

Abstract
Study Objectives:
There are reports suggesting that obstructive sleep apnea (OSA) may itself cause weight gain. However, recent reports showed increases in body mass index (BMI) following continuous positive airway pressure (CPAP) treatments. When considering weight changes, changes in humoral factors that have significant effects on appetite such as acyl (AG) and desacyl ghrelin (DAG), leptin, insulin, and glucose and their interactions, examples of which are AG/DAG and AG/insulin, are important. The aim of this study was to test the hypothesis that some appetite-related factors had a specific profile before and after CPAP treatment.
Methods:
Metabolic parameters were measured cross-sectionally while fasting and 30, 60, 90, and 120 min following breakfast in no or mild OSA (apnea-hypopnea index < 15, n = 15) and moderate-to-severe OSA (apnea-hypopnea index ≥ 15, n = 39) participants in a single institute. There were no differences in age, sex, BMI, or visceral fat accumulation between the two groups. Twenty-one patients with moderate-to-severe OSA who received CPAP treatment also prospectively underwent the same testing following 3 months of CPAP treatment.
Results:
Although fasting and postprandial glucose, insulin, and leptin levels did not differ between no or mild OSA and moderate-to-severe OSA participants, AG and DAG, including AG/DAG and AG/insulin, under fasting and postprandial conditions were significantly increased in the moderate-to-severe OSA patients (p < 0.01). After 3 months of CPAP treatment in 21 of the moderate-to-severe OSA participants, AG/DAG did not change significantly, but other ghrelin-related parameters including AG/insulin significantly decreased compared with values before treatment but remained higher than in no or mild OSA.
Conclusions:
Among several important metabolic factors, ghrelin-related factors had the strongest associations with moderate-to-severe OSA. These results indicate that continuous changes in ghrelin secretion in OSA patients existed at least within 3 months of CPAP treatment. Methods to prevent OSA as well as treatment in its early stage may be recommended.
Clinical Trial Registration:
URL: http://www.clinicaltrials.gov. Unique identifier: NCT00942110.
Citation:
Chihara Y, Akamizu T, Azuma M, Murase K, Harada Y, Tanizawa K, Handa T, Oga T, Mishima M, Chin K. Among metabolic factors, significance of fasting and postprandial increases in acyl and desacyl ghrelin and the acyl/desacyl ratio in obstructive sleep apnea before and after treatment. J Clin Sleep Med 2015;11(8):895–905.
Keywords: acyl ghrelin, continuous positive airway pressure, desacyl ghrelin, metabolic disorder, obesity, obstructive sleep apnea
Obstructive sleep apnea (OSA) is said to induce cardiovascular and metabolic diseases.1,2 Obesity is considered a major risk factor for OSA, and reports suggest that OSA may itself cause weight gain.3–5 When considering weight changes, humoral factors such as ghrelin, leptin, insulin, and glucose, which have significant effects on appetite, are important.6–8 Most data on the associations between OSA and some humoral factors have been acquired in the fasting state.9–12 However, it is important to investigate not only fasting data but postprandial data because these humoral secretions are significantly affected by food intake.13–15 Ghrelin exists in 3 forms: acyl ghrelin (AG), desacyl ghrelin (DAG), and the fragmented form. Recent data showed that interactions between AG and DAG as well as between AG and insulin are important in the energy balance and insulin resistance in patients with conditions such as obesity, type 2 diabetes, and metabolic syndrome.15–17 But these parameters have never been investigated in patients with OSA.
BRIEF SUMMARY
Current Knowledge/Study Rationale: It is said that there is a reciprocal interaction between obesity and obstructive sleep apnea (OSA). A few studies have shown that the treatment of OSA with continuous positive airway pressure (CPAP) is associated with a significant reduction in body mass index (BMI), while other studies have found a significant increase in BMI following CPAP treatment. It is important to consider the changes in BMI, physical activity, and neurohormonal mechanisms that induce satiety and hunger.
Study Impact: From the simultaneous measurements of 7 appetite-related factors (acyl ghrelin (AG), desacyl ghrelin (DAG), leptin, insulin, glucose, acyl/desacyl and acyl/insulin ratios) in fasting and postprandial stages before and after CPAP treatment, it was found that ghrelin-related factors had the strongest associations with moderate-to-severe OSA. The elevations in the blood ghrelin-related factors did not improve completely following 3 months of CPAP treatments.
If OSA may itself cause weight gain,3–5 treatment of OSA with continuous positive airway pressure (CPAP) should therefore prevent further weight gain or facilitate weight loss.18 However, available evidence regarding weight change is conflicting.19–21 Two recent reports showed increases in body mass index (BMI) following CPAP treatments.18,22
The mechanisms of changes in BMI following CPAP treatment have been investigated from the viewpoint of energy expenditure.23 It is said that OSA is associated with an increased energy expenditure during sleep, which is normalized by treatment with CPAP.23 When considering body weight changes, energy intake is also important, with investigations of appetite-related (food intake) factors promising to be useful. However, there have been no data on the simultaneous measurements of 7 appetite-related factors (AG, DAG, leptin, insulin, glucose, acyl/desacyl ratio and acyl/insulin ratio) under fasting and postprandial conditions before and after CPAP treatment.
We hypothesized that some of the seven appetite-related factors might have specific patterns that would induce a continuous promotion of appetite under fasting and postprandial conditions in OSA patients before and following CPAP treatment. To test that hypothesis, the primary aim was to investigate the effects of CPAP treatment on the blood levels of postprandial appetite-related factors such as AG, DAG, leptin, insulin, and glucose in addition to the fasting levels. The second aim was to examine the interaction among these factors such as AG/DAG and AG/insulin ratios, which were thought to be important in the energy balance and insulin resistance.13–15 In this study, visceral and subcutaneous fat accumulation determined by computed tomography (CT) were also measured because fat accumulation and distribution had significant associations with metabolic parameters.24
METHODS
Study Subjects
In this study, we consecutively assessed for eligibility 128 adults (age > 20 y, BMI ≤ 35 kg/m2). The participants came to our hospital with suspected OSA because they had witnessed apnea and/or symptoms such as sleepiness, nonrestorative sleep, fatigue, insomnia, gasping, or choking. When being assessed for eligibility, the subject's medical history was recorded and a physical examination was performed. Serum thyroid stimulating hormone and free-T4 levels were also measured. Of these 128 subjects, 55 clinically stable adults were consecutively enrolled. In Japan, obesity is defined as BMI ≥ 25 kg/m2, with the prevalence of individuals with a BMI > 35 kg/m2 of 0.5%.25 Exclusion criteria were history of gastrointestinal surgery; cardiovascular disease such as myocardial infarction or ischemic heart disease; acute infection; malignancy; inflammatory, autoimmune, or other chronic diseases; diabetes mellitus under treatment with hypoglycemic agents or insulin; regular use of steroids or immunosuppressive drugs; renal dysfunction (serum creatinine ≥ 1.2 mg/dL); respiratory diseases such as bronchial asthma or chronic obstructive pulmonary disease; endocrine disorders and neurological disorders. In addition, patients were excluded if they had predominantly central sleep apnea. In addition, we excluded 1 patient without sufficient postprandial data. The remaining 54 patients were examined (Figure 1). This study was approved by the Kyoto University Graduate School and Faculty of Medicine Ethics Committee, IRB approval number C-311. All patients gave written informed consent to participate.
Figure 1. Flowchart of trial design.
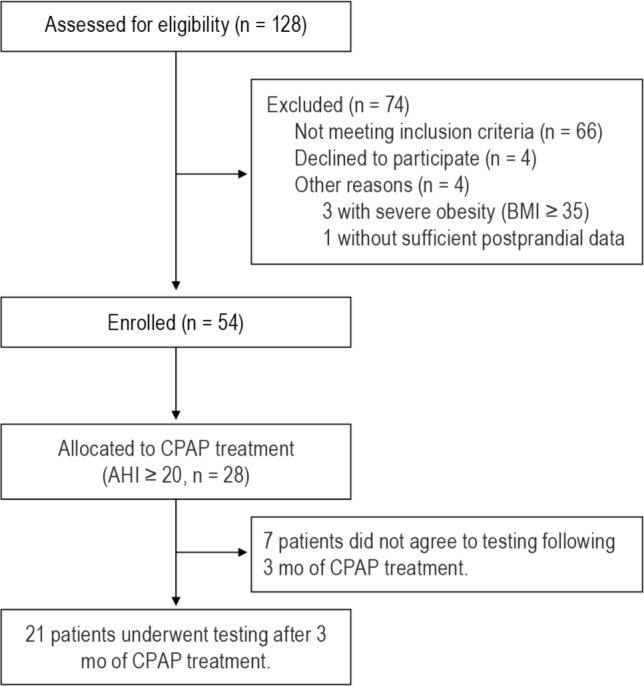
BMI, body mass index; AHI, apnea-hypopnea index; CPAP, continuous positive airway pressure.
Study Design
All patients underwent attended diagnostic overnight polysomnography (PSG). At 08:00 on the morning following a 12-h overnight fast and PSG, each patient consumed a standard mixed meal containing 539 kcal, with 54.8% of the calories composed of carbohydrate, 29.2% of fat, and 16.0% of protein. Blood samples were collected while still fasting and 30, 60, 90, and 120 min following the meal. Throughout the blood studies, physical activity was kept to a minimum.
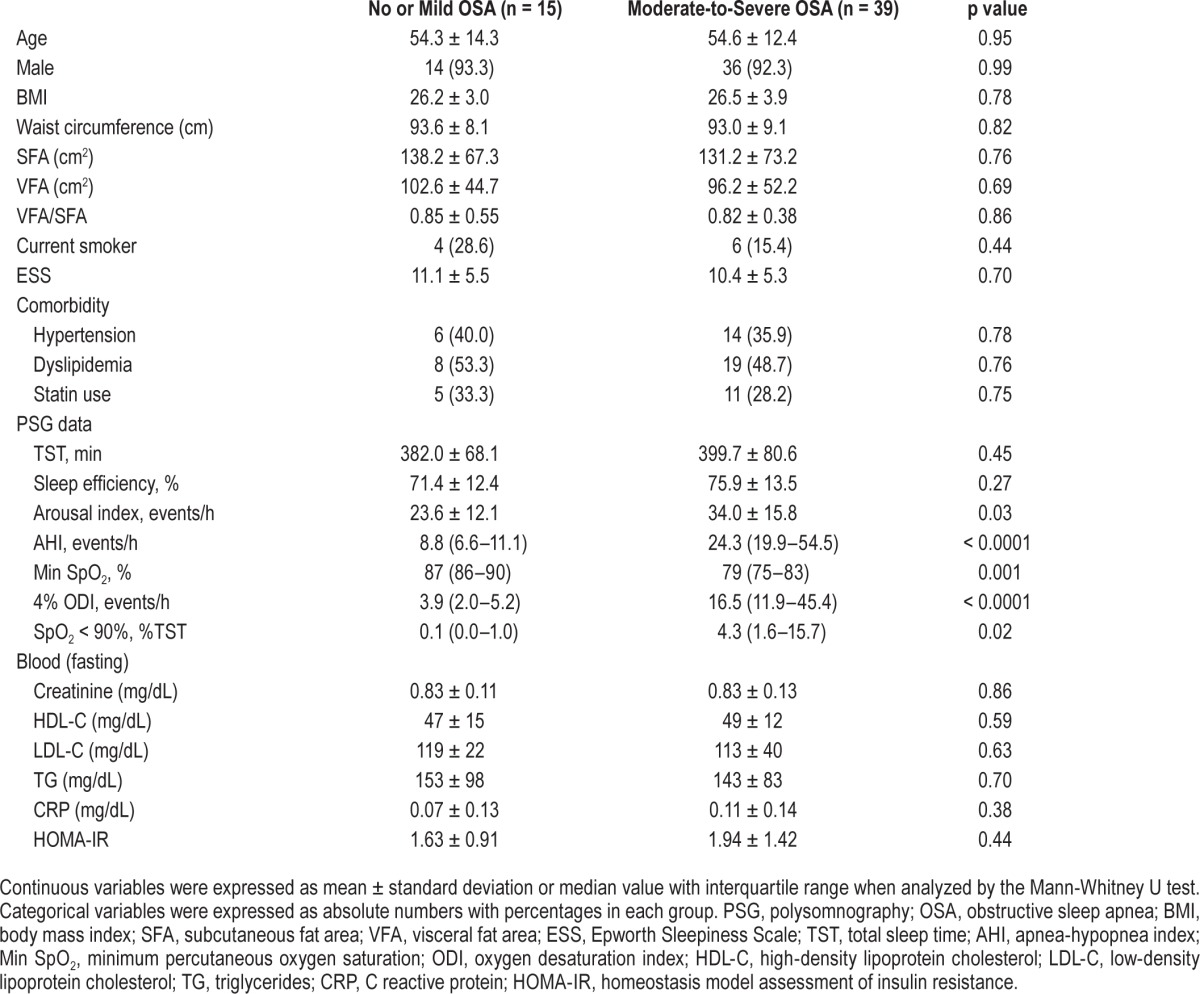
From results of the PSG, the 54 subjects were divided into 2 groups: no or mild OSA group whose apnea-hypopnea index (AHI) was < 15 (n = 15) and mild-to-moderate OSA group whose AHI was ≥ 15 (n = 39). In this study, there were no significant differences in age, sex, BMI, subcutaneous fat area (SFA), visceral fat area (VFA), Epworth Sleepiness Scale (ESS), or comorbidities between the 2 groups (Table 1).
Table 1.
Characteristics, PSG and laboratory data in no or mild OSA patients and moderate-to-severe OSA patients.
Of the 39 patients in the moderate-to-severe OSA group, 28 received CPAP treatment following the first examination because under the health insurance system in Japan CPAP is only permitted for OSA patients with an AHI > 20. Seven patients did not agree to testing following 3 months of CPAP treatment, leaving 21 patients who underwent testing of several parameters after 3 months of CPAP treatment (that is, ranging from almost 3 months to 1 to 3 weeks beyond 3 months).
PSG
The diagnosis of OSA was confirmed by PSG (SomnoStar pro, Cardinal Health, Dublin, OH, USA), which was started at 22:00 and ended at 06:00 the following morning. Surface electrodes were attached using standard techniques to obtain an electrooculogram, electromyogram of the chin, and 12-lead electroencephalograph. Sleep stages were defined according to the criteria of Rechtschaffen and Kales.26 Ventilation/respiratory effort was monitored by inductive plethysmography (Respitrace QDC, Viasys Healthcare, Palm Springs, CA, USA). Airflow was monitored by a nasal pressure transducer (PTAFlite, Pro-Tech Services Inc., Mukilteo, WA, USA) and supplemented by an oronasal thermal sensor (Sleepmate Technologies, Midlothian, VA, USA). Arterial oxygen saturation (SpO2) was monitored continuously with a pulse oximeter (Adult Flex System, Nonin Medical, Plymouth, MN, USA).
Apnea was defined as the complete cessation of airflow and hypopnea as a clear decrease in airflow of 50% lasting ≥ 10 s accompanied by a decrease in SpO2 ≥ 3% and/or associated with arousal.27 All AHI values were expressed as the number of episodes of apnea and hypopnea per hour over the total sleep time. The lowest SpO2 during sleep was calculated in each patient.
Measurements of Blood Samples
While fasting and 30, 60, 90, and 120 min after a meal, glucose, insulin, leptin, AG, and DAG were measured. Blood samples for determination of AG and DAG concentrations were collected into chilled polypropylene tubes containing EDTA-2Na (1 mg/mL) and aprotinin (Ohkura Pharmaceutical, Inc., Kyoto, Japan: 500 kallikrein inactivator U/mL), and centrifuged. Then, the separated plasma sample was immediately added to 1N HCl (10% of plasma volume) and stored at −80°C until analysis. Ghrelin levels were measured with a fluorescence enzyme immunoassay (FEIA; Tosoh Corp. Tokyo, Japan) that was used in a previous report.28 The minimal detection limits for AG and DAG in this assay system were 2.5 fmol/mL and 10 fmol/mL, respectively. The interassay coefficients of variation were 2.9% and 3.1% for AG and DAG, respectively.28 Serum leptin was measured by radioimmunoassay (Mitsubishi Kagaku Bio-Clinical Laboratories, Inc., Tokyo, Japan). The intra- and interassay coefficients of variation were 4.8% and 8.3%, respectively. All other assays, excluding those for plasma ghrelin and serum leptin, were performed by the biochemistry department at Kyoto University Hospital using standard techniques.29 Hypertension was defined as systolic blood pressure ≥ 140 mm Hg or diastolic blood pressure ≥ 90 mm Hg or the use of an antihypertensive medication. Dyslipidemia was defined as serum low-density lipoprotein cholesterol (LDL-C) ≥ 140 mg/dL, high-density lipoprotein cholesterol (HDL-C) < 40 mg/dL or triglycerides (TG) ≥ 150 mg/dL30 or the use of an antilipidemic medication.
Visceral Adipose Tissue Measurement
VFA was assessed by an Aquilion 64 CT system (Toshiba Medical Systems Corporation, Tochigi, Japan) running on 135 kVp, 440 mA, 0·5-s scan time and 10·0 mm slice thickness. We used a single CT scan obtained at the level of the umbilicus,31 and the VFA and SFA were quantified using a specialized image analysis program (AZE Virtual Place 99, AZE of America, Ltd., Irvine, CA, USA).
Statistical Analysis
Data were analyzed using JMP 9.0 (SAS Institute, Inc. Cary, NC, USA). Continuous variables were expressed as mean ± standard deviation or the median value with interquartile range where analysis was by Mann-Whitney U test. Categorical variables were expressed as absolute numbers with percentages in each group. Postprandial levels of glucose, insulin, leptin, AG, and DAG were calculated for the four 30-min intervals as the area under the curve (AUC) according to the trapezoid rule. The associations between participants' characteristics, PSG data, and laboratory data (blood and urine) including postprandial profiles and presence of OSA were assessed. Continuous variables were tested by the unpaired t test or Mann-Whitney U test. Categorical variables were compared by the χ2 test or Fisher exact test. The differences between the baseline value and each postprandial value in each subject were tested by the paired t test.
Covariances between 2 sets of continuous data were analyzed by Pearson correlation coefficient tests, and those between dichotomous data were by the Spearman rank correlation coefficient. We also defined “presence of OSA” as AHI ≥ 15. Multiple regression analysis was performed to adjust for confounders such as age, gender, BMI, and current smoking. Next, multiple regression analyses, with a p value < 0.10 required for entry into the models, were performed to identify those variables that could best predict fasting and postprandial AG, DAG, AG/DAG, and AG/insulin. Also, to exclude the effects of co-linearity on the multiple regression analyses, we tested for co-linearity among the variables. Then, among the variables that had very strong co-linearity (r > 0.70) with each other, such as the arousal index, AHI, and 4% oxygen desaturation index (ODI), the highest one was selected.
To investigate changes in each postprandial AUC and other parameters before and after 3 mo of CPAP, comparisons of data between baseline and after 3 mo of CPAP treatment were tested by a paired t test. In all analyses, p value < 0.05 was considered statistically significant.
RESULTS
Clinical Characteristics of Subjects
Participants' characteristics, PSG data, and fasting laboratory data at baseline are shown in Table 1. Except for sleep parameters, other factors such as age, sex, BMI and fat distribution and accumulation, and ESS were not significantly different between the no or mild OSA patients and the moderate-to-severe OSA patients. Since the participants came to our hospital due to suspected OSA with witnessed apnea and/or symptoms such as sleepiness, nonrestorative sleep, fatigue, the ESS scores in both groups were relatively high (Table 1).
Fasting and Postprandial Ghrelin, Glucose, Insulin, and Leptin Levels
Fasting and postprandial changes in glucose, insulin, leptin, AG, and DAG levels are shown in Figures 2 and 3 and Table 2. At baseline, both AG and DAG were significantly higher in the moderate-to-severe OSA patients (AG, p = 0.002; DAG, p = 0.001) than in the no or mild OSA group patients (Table 2, Figure 2A, 2B). In addition, in the moderate-to-severe OSA patients both AG/DAG (p = 0.01) and AG/insulin (p = 0.01) were significantly higher than in the no or mild OSA patients (Table 2, Figure 3).
Figure 2. Comparison of fasting and postprandial acylated ghrelin, desacyl ghrelin, glucose, insulin, and leptin between no or mild OSA patients and moderate-to-severe OSA patients.

Before treatment, both AG and DAG were significantly higher in the moderate-to-severe OSA patients than in no or mild OSA patients (A,B). The measured values of fasting and postprandial glucose, insulin, and leptin levels between no or mild OSA patients and moderate-to-severe OSA patients were not significantly different. Data are shown as mean ± standard deviation. Single asterisk indicates p < 0.05 between the no or mild OSA patients and moderate-to-severe OSA patients. OSA, obstructive sleep apnea.
Figure 3. Comparison of fasting and postprandial acylated ghrelin/desacyl ghrelin ratio and acylated ghrelin/insulin ratio between no or mild OSA patients and moderate-to-severe OSA patients.

Before treatment, both AG/DAG and AG/insulin were significantly higher in the moderate-to-severe OSA patients than in the no or mild OSA patients (A,B). Data are shown as mean ± standard deviation. Single asterisk indicates p < 0.05 between the no or mild OSA patients and moderate-to-severe OSA patients. OSA, obstructive sleep apnea.
Table 2.
Fasting and postprandial glucose, insulin, leptin, and acylated and desacyl ghrelin levels in no or mild OSA patients and moderate-to-severe OSA patients.
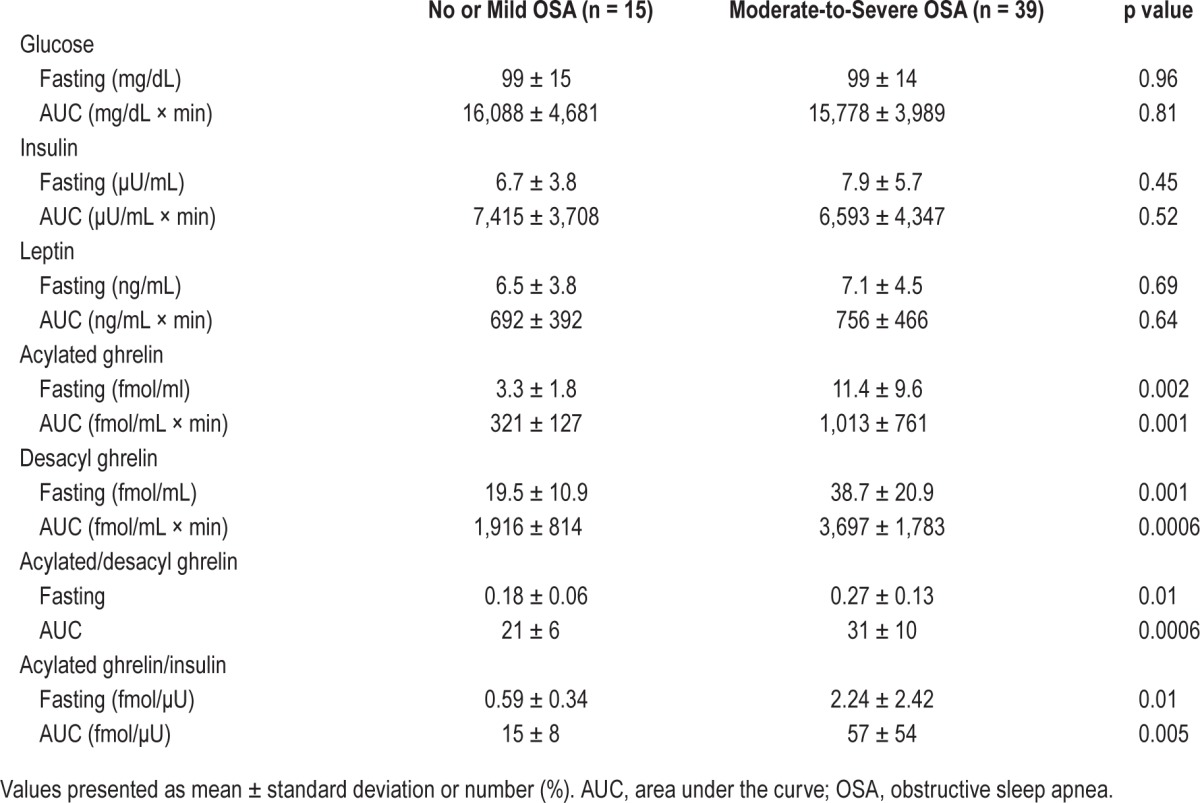
Regarding the fasting and AUC data, AG, DAG, AG/DAG, and AG/insulin were significantly higher in the moderate-to-severe OSA patients than in no or mild OSA patients (Table 2, Figures 2A, 2B, 3A, and 3B).
Glucose and insulin values at each postprandial time point were significantly elevated compared with the baseline values in both groups (Figure 2C, 2D), whereas leptin levels at each postprandial time point were significantly decreased compared with baseline values in both groups (Figure 2E), although the decreases were small. However, the measured values of fasting and postprandial glucose, insulin, and leptin were not significantly different between the two patients groups.
Associations between Fasting and Postprandial Hormonal Levels and Clinical Indices, and Determinants of AG, DAG, AG/DAG, and AG/Insulin Levels
After adjustment for age, gender, BMI, and smoking status, which were said to be associated with ghrelin levels, the associations between several parameters (fat and fat distribution, PSG data, fasting blood data and the presence of moderate-to-severe OSA) and fasting and postprandial AG, DAG, AG/DAG, and AG/insulin were investigated. Ghrelin-associated parameters were significantly related to several parameters including the presence of moderate-to-severe OSA (Table 3).
Table 3.
Multivariate regression analysis for AG, DAG, AG/DAG ratio and AG/insulin ratio after adjustment for age, gender, BMI, and smoking status.
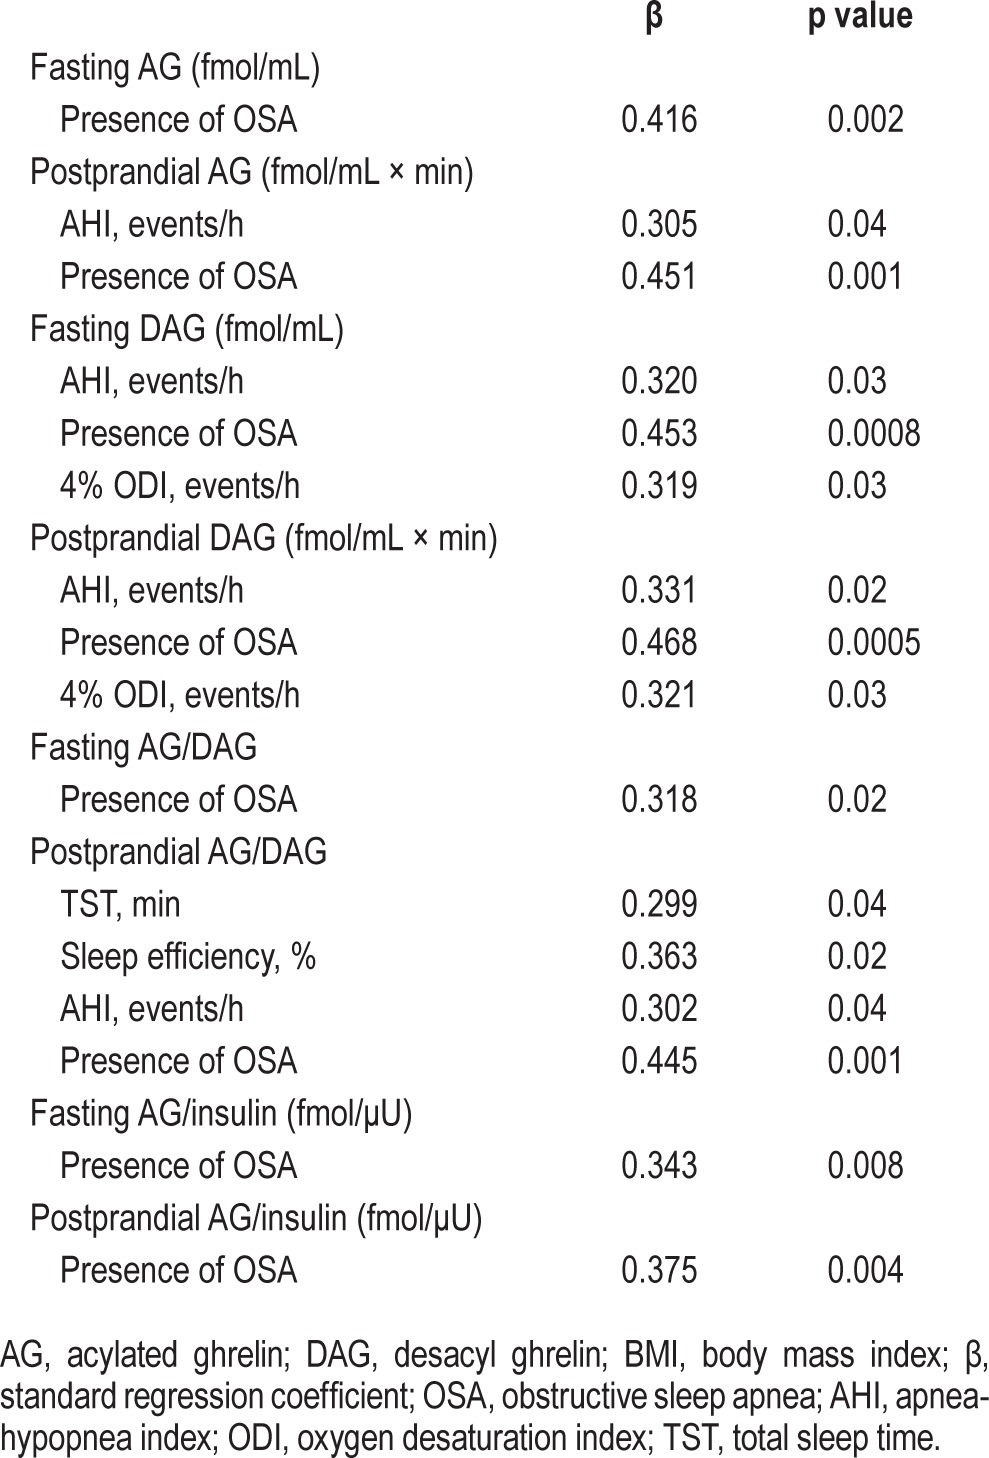
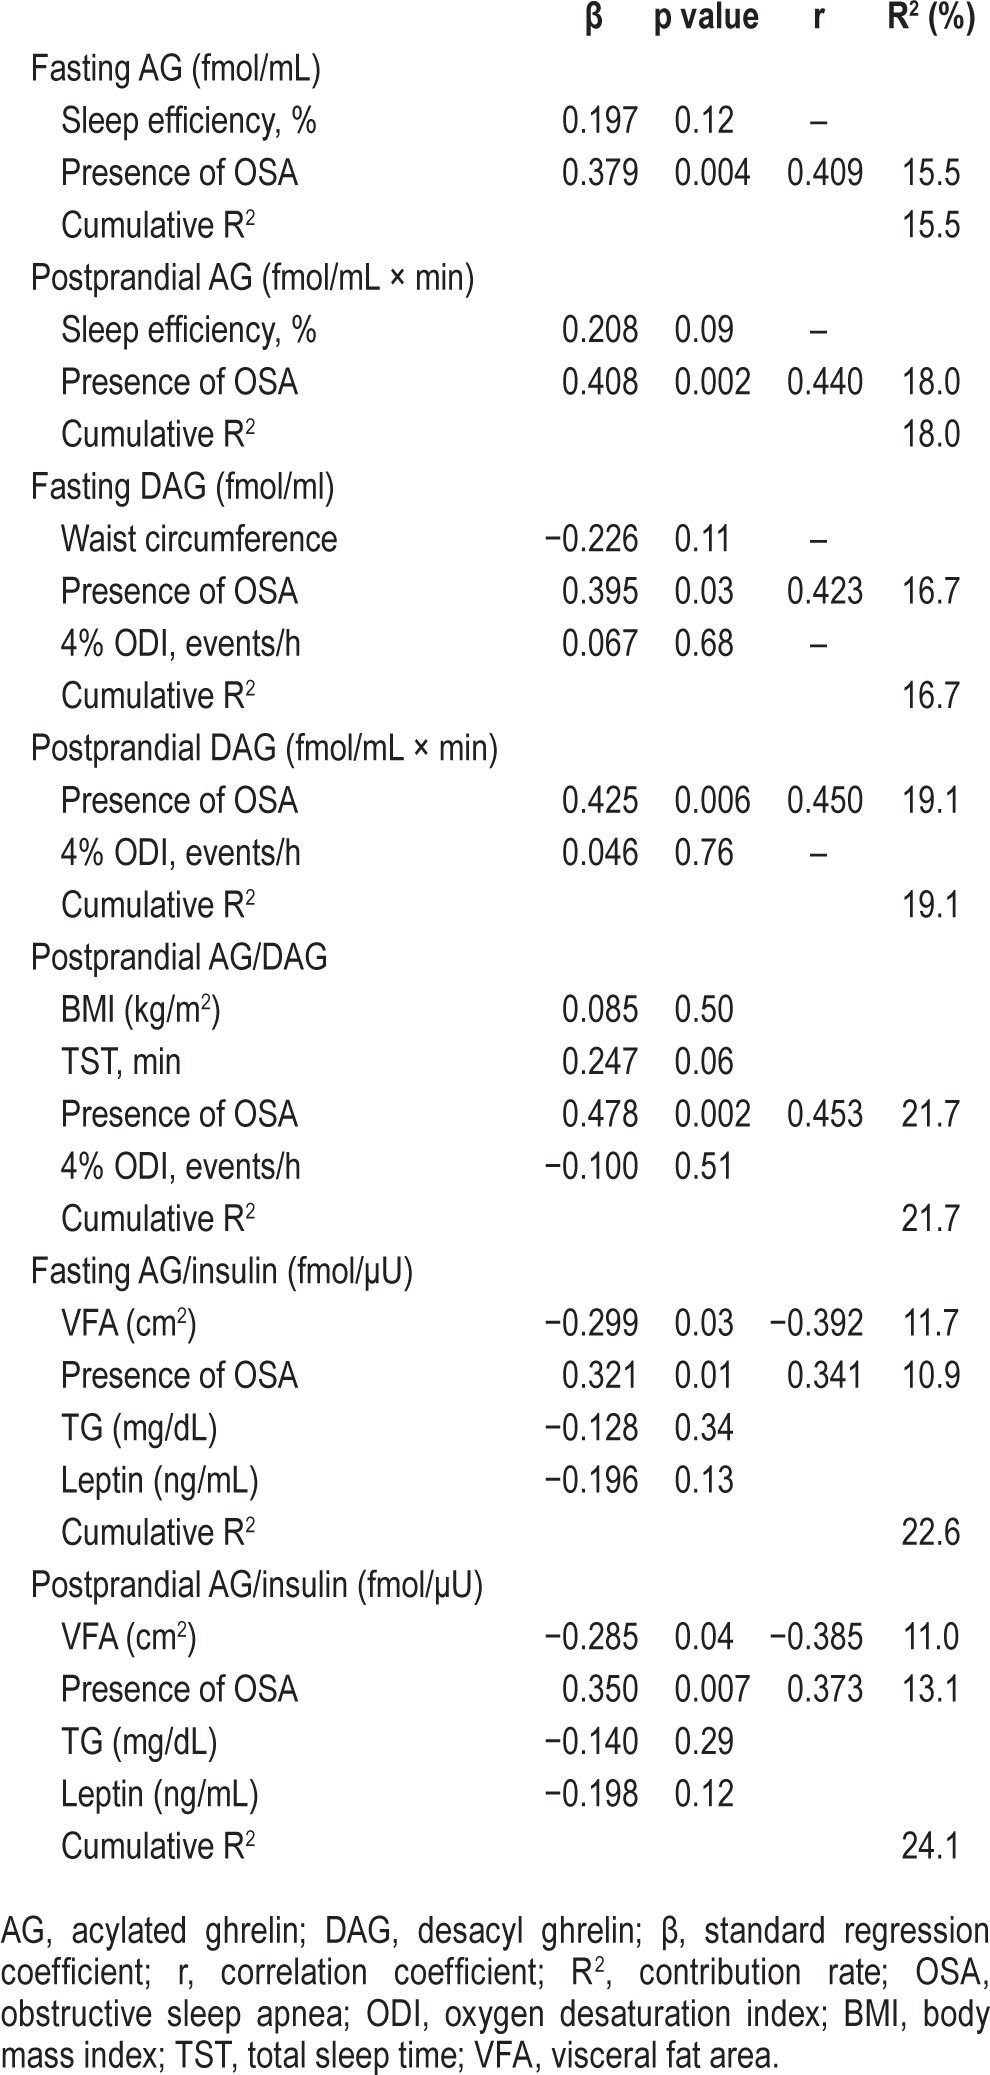
Multiple regression analyses, with a p value < 0.10 (between each parameter in Table 1 and AG, DAG, AG/DAG, and AG/insulin) required for entry into the models (Tables S1, S2, supplemental material), were performed to identify the factors that could predict fasting and postprandial AG, DAG, AG/DAG, and AG/insulin. The presence of moderate-to-severe OSA had a significant positive correlation with postprandial AG, DAG, and AG/DAG and fasting and postprandial AG/insulin (Table 4).
Table 4.
Multivariate linear regression analysis for AG, DAG, AG/DAG and AG/insulin.
Effects of CPAP Treatment on Postprandial Changes in Glucose, Insulin, and Ghrelin Levels
During the study period, BMI did not increase significantly (before CPAP: 27.8 ± 5.5 vs following 3 mo of CPAP 28.0 ± 5.5, p = 0.28). The average time of usage of the CPAP machine was 4.5 ± 2.0 h/day. AHI significantly decreased from 41.2 ± 22.3 to 3.9 ± 3.1 by CPAP treatment. Following CPAP treatment in the OSA group, AG (fasting and 60 and 120 postprandial min), DAG (fasting and 30, 60 and 90 postprandial min) AG/insulin (fasting and 60 postprandial min), AGAUC, DAGAUC, and AG/insulinAUC were significantly decreased compared with data before CPAP treatment, while fasting AG/DAG and postprandial AG/DAGAUC did not change significantly (Figure 4A, 4B, and Figure 5). Although fasting and postprandial AG and DAG significantly decreased following 3 months of CPAP treatment, the levels were still higher than those of no or mild OSA patients (Figure 4A, 4B, and Figure 6). Although AG/insulin levels in OSA patients were significantly decreased, they were significantly higher than those among the no or mild OSA patients (fasting: moderate-to-severe OSA following 3 months of CPAP 1.46 ± 1.47 vs. no or mild OSA patients 0.59 ± 0.34, p = 0.03; postprandial: moderate-to-severe OSA following 3 mo of CPAP 37 ± 36 vs. no or mild OSA patients 15 ± 8, p = 0.02) (Figure 5B). Fasting and postprandial glucose, insulin, and leptin were not significantly changed (Figures 4C, 4D, and 4E). If we excluded patients with daily usage time of CPAP < 3 h, the data (n = 16) were almost the same except for fasting DAG and AG/DAG ratio (Table S3, supplemental material).
Figure 4. Change in postprandial acylated ghrelin, desacyl ghrelin, glucose, insulin, and leptin before and after 3 months of CPAP treatment in patients with moderate-to-severe OSA (n = 21).

Following CPAP treatment, AG (fasting and 60 and 120 postprandial minutes), DAG (fasting and 30, 60, and 90 postprandial min), AGAUC, and DAGAUC were significantly decreased compared with pretreatment values (A,B), while fasting and postprandial glucose, insulin, and leptin were not significantly changed (C–E). Data are shown as mean ± standard deviation. Single asterisk indicates p < 0.05 between before CPAP and after 3 mo of CPAP. OSA, obstructive sleep apnea; CPAP, continuous positive airway pressure.
Figure 5. Change in acylated ghrelin/desacyl ghrelin ratio and acylated ghrelin/insulin ratio before and after 3 months of CPAP treatment in patients with moderate-to-severe OSA (n = 21).

Following CPAP treatment, AG/insulin ratio (fasting and 60 postprandial min) and AG/insulinAUC ratio were significantly decreased compared with baseline values (B), while fasting AG/DAG or AG/DAGAUC did not change significantly (A). Data are shown as mean ± standard deviation. Single asterisk indicates p < 0.05 between before CPAP and after 3 months of CPAP. OSA, obstructive sleep apnea; CPAP, continuous positive airway pressure.
Figure 6. Comparison of fasting and postprandial acylated ghrelin and desacyl ghrelin between no or mild OSA patients and moderate-to-severe OSA patients after 3 months of CPAP treatment.

Data are shown as mean ± standard deviation. Single asterisk indicates p < 0.05 between no or mild OSA patients and moderate-to-severe OSA patients after 3 months of CPAP treatment. OSA, obstructive sleep apnea; CPAP, continuous positive airway pressure.
DISCUSSION
Not only fasting but also postprandial AG and DAG levels were significantly elevated in patients with moderate-to-severe OSA compared with no or mild OSA patients even though BMI, waist circumference, SFA, and VFA were similar in the two groups. On the other hand, there were no significant differences in fasting or postprandial glucose, insulin, and leptin levels between the two groups. Although the AG/DAG ratio did not change significantly, other ghrelin-related parameters, including the AG/insulin ratio, significantly decreased following 3 months of CPAP treatment. However, the values of those parameters in the moderate-to-severe OSA patients remained higher than in the no or mild OSA patients. In addition, the presence of OSA (AHI ≥ 15) was a significant factor in relation to values for AG, DAG, AG/DAG, and AG/insulin.
Differences in Metabolic Hormones between Moderate-to-Severe OSA and No or Mild OSA Patients
Among glucose, insulin, leptin, and ghrelin, including AG and DAG, only the ghrelin-related parameters were significantly increased under both fasting and postprandial conditions in moderate-to-severe OSA patients compared with no or mild OSA patients. Several parameters such as age, sex, BMI, SFA, VFA, ESS, and comorbidities (Table 1) that have significant effects on levels of ghrelin-related parameters were not significantly different between the two patient groups. Although several studies have examined the relation between OSA and ghrelin levels, results have not been consistent.9–11,32 Several factors such as obesity, age, and sex,15,33,34 which influence ghrelin secretion, may contribute to the previous inconsistent results regarding the relationship between OSA and ghrelin secretion. Further, in former studies11,32 that did not demonstrate significant associations between OSA and ghrelin, plasma ghrelin levels were not measured separately as two circulating forms of ghrelin (AG and DAG), which have different biophysical activities, but were measured as total ghrelin. In our examinations, we added 1N HCl (10% of plasma volume) to plasma samples immediately, which stabilized the acylated ghrelin and allowed us to separately measure AG and DAG. As a result, we could show that both fasting and postprandial AG and DAG were greatly elevated in the moderate-to-severe OSA group compared with the no or mild OSA patients. Our study revealed that AGAUC and DAGAUC were positively correlated with AHI and/or the 4% ODI after adjustment for confounding factors. A long-term prospective study is needed to confirm whether the increased postprandial ghrelin in OSA participants is caused by intermittent hypoxia induced by OSA.
AG/DAG and AG/insulin Ratios in Moderate-to-Severe OSA Patients
No study has investigated the AG/DAG or AG/insulin ratio in OSA patients. Increases in the AG/DAG and AG/insulin ratios mean that there is an increase in AG relative to DAG and insulin levels. Ghrelin acylation is dependent on the function of ghrelin O-acyl transferase (GOAT) and the availability of substrates such as proghrelin and short-to-medium-chain fatty acids.35 In this study, the presence of dyslipidemia and the components of the breakfast meal were the same between the moderate-to-severe OSA patients and no or mild OSA patients. Therefore, OSA may increase GOAT activity. In addition to the AHI and the presence of OSA, total sleep time and sleep efficiency, which had a significant relationship to postprandial AG/DAG, might have a significant association with GOAT activity (Table 3). Indeed, several studies have shown that recurrent partial sleep deprivation and chronic short sleep duration are associated with a significant increase in levels of ghrelin.36,37 OSA causes recurrent arousals that result in sleep fragmentation and loss of sleep quality.38 These sleep disorders in OSA might lead to an abnormality in postprandial ghrelin secretion. Thus, OSA and sleep parameters may induce an increase in GOAT activity, the mechanism of which was not determined in this study.
Recent data showed that obese patients with metabolic syndrome had high AG/DAG.16 AG/DAG was shown to be associated with insulin sensitivity.17 That there is an interaction between secretions of ghrelin and insulin has been reported.15,39 The increased AG/insulin noted in our OSA patients suggests that the interaction between AG and insulin may be disturbed in general in patients having OSA.
Data before and after CPAP Treatment
Although the present study showed that fasting and postprandial AG, DAG, and the AG/insulin ratio were decreased after 3 months of CPAP, those values were still significantly higher than in no or mild OSA patients; also, there was no change in AG/DAG following CPAP treatment (Figures 4–6). It is unclear whether a longer period of CPAP would have improved these levels and ratios or whether irreversible changes in secretion of ghrelin might occur in OSA patients, as in hypoxic-induced “neural injury,” such as daytime sleepiness and impaired memory and concentration.40
Recent data showed that patients treated by CPAP might have body weight gain after CPAP treatment.18,22 The mechanism was said to be decreased energy expenditure.21 In contrast, higher AG/DAG ratios and higher values for ghrelin-related parameters in patients with OSA might show that they had followed the same dietary habits as before CPAP treatment. Recent data from four months of CPAP treatment showed that the participants did not change their dietary habits.40 Our data may support their data. Thus, preserved dietary habits due to ghrelin-related factors in this study in addition to a decrease in energy expenditure in OSA patients following CPAP treatment might cause body weight gain41 or make it difficult to lose body weight during CPAP treatment.21
This study had some limitations. Firstly, the sample size was small. Therefore, the findings might be caused by chance. However, the differences in the fasting and postprandial AG and DAGAUC between no or mild OSA patients and moderate-to-severe OSA patients were very large. Therefore, the results could be considered significant and definitive. To confirm the findings of our study, a community-based prospective study with large sample size is warranted. Secondly, we did not randomize the application of CPAP or use sham CPAP to confirm the effects of CPAP. Under the health insurance system in Japan randomization and the use of sham CPAP are difficult. However, not only fasting but also postprandial data could lessen these limitations. Thirdly, the population in our study was Japanese. Therefore, the results might be specific to a Japanese population. A large study of another ethnic population might explore the ethnic differences in the results or confirm these results. Fourthly, the differences in the period of CPAP treatment might have affected the results of our study. However, after diagnosing PSG, all 21 patients who underwent testing of several parameters following 3 months of CPAP treatment had received CPAP treatment within one month. Thus, we think that this possible limitation had a minimal effect on the study outcomes.
In conclusion, in moderate-to-severe OSA patients, ghrelin, including AG and DAG, was a more suitable metabolic marker than insulin or leptin under not only fasting but also postprandial conditions. In addition to the continuous increase in the AG/DAG ratio, the increases in fasting AG/insulin persisted in OSA patients even though significant improvements were found following 3 months of CPAP treatment. Ghrelin and ghrelin-related markers may be useful to monitor metabolic disorders in OSA patients before and following CPAP treatment. Early diagnosis and treatment of OSA patients would be necessary because irreversible changes in the ghrelin system might occur in those with OSA. A long-term prospective study is needed to clarify this issue.
DISCLOSURE STATEMENT
This work was supported by grants from the Japanese Ministry of Education, Culture, Sports, Science and Technology, Respiratory Failure Research Group and Health science Research Grants (Comprehensive Research on Life-Style Relate Diseases including Cardiovascular Diseases and Diabetes Mellitus) from the Ministry of Health, Labor and Welfare of Japan, and the Japan Vascular Disease Research Foundation. The Department of Respiratory Care and Sleep Control Medicine is funded by endowments from Philips-Respironics, Teijin Pharma, Fukuda Denshi, and Fukuda Lifetec Keiji to Kyoto University. Drs. Tanizawa, Oga, and Chin belong to the Department of Respiratory Care and Sleep Control Medicine, Kyoto University Graduate School of Medicine, which is funded by endowments from Philips-Respironics, Teijin Pharma, Fukuda Denshi, and Fukuda Lifetec Keiji. The other authors have indicated no financial conflicts of interest. The work was performed at the Sleep unit of Kyoto University Hospital, Kyoto, Japan. This work did not include off-label or investigational use.
ACKNOWLEDGMENTS
The authors thank Mr. Kazuyuki Ueda, Ms. Yuko Yamanishi, Ms. Natsuko Susukida and Ms. Nobuko Matsuura for their contribution of analyzing polysomnographic data. We also thank Ms. Naoko Kimura, Ms. Satoko Tamura and Ms. Tomoko Toki for their contribution of inputting data.
ABBREVIATIONS
- AG
acylated ghrelin
- AHI
apnea-hypopnea index
- AUC
area under the curve
- CRP
C reactive protein
- DAG
desacyl ghrelin
- β
standard regression coefficient
- BMI
body mass index
- ESS
Epworth Sleepiness Scale
- HDL-C
high-density lipoprotein cholesterol
- HOMA-IR
homeostasis model assessment of insulin resistance
- LDL-C
low-density lipoprotein cholesterol
- Min SpO2
minimum percutaneous oxygen saturation
- ODI
oxygen desaturation index
- OSA
obstructive sleep apnea
- PSG
polysomnography
- r
correlation coefficient
- R2
contribution rate
- SFA
subcutaneous fat area
- TG
triglycerides
- VFA
visceral fat area
SUPPLEMENTAL MATERIAL
Associations of fasting and postprandial acylated ghrelin and desacyl ghrelin levels with participants' characteristics, PSG data and biomarkers.
Associations of fasting and postprandial acylated ghrelin/desacyl ghrelin and acylated ghrelin/insulin ratios with participants' characteristics, PSG data and biomarkers.
Effects of CPAP on laboratory data in OSA patients with good adherence to CPAP (≥ 3 h/day) (n = 16).
REFERENCES
- 1.Bradley TD, Floras JS. Obstructive sleep apnoea and its cardiovascular consequences. Lancet. 2009;373:82–93. doi: 10.1016/S0140-6736(08)61622-0. [DOI] [PubMed] [Google Scholar]
- 2.Lévy P, Bonsignore MR, Eckel J. Sleep, sleep-disordered breathing and metabolic consequences. Eur Respir J. 2009;34:243–60. doi: 10.1183/09031936.00166808. [DOI] [PubMed] [Google Scholar]
- 3.Brown MA, Goodwin JL, Silva GE, et al. The impact of sleep-disordered breathing on body mass index (BMI): the Sleep Heart Health Study (SHHS) Southwest J Pulm Crit Care. 2011;3:159–68. [PMC free article] [PubMed] [Google Scholar]
- 4.Phillips BG, Hisel TM, Kato M, et al. Recent weight gain in patients with newly diagnosed obstructive sleep apnea. J Hypertens. 1999;17:1297–300. doi: 10.1097/00004872-199917090-00009. [DOI] [PubMed] [Google Scholar]
- 5.Traviss KA, Barr SI, Fleming JA, Ryan CF. Lifestyle-related weight gain in obese men with newly diagnosed obstructive sleep apnea. J Am Diet Assoc. 2002;102:703–6. doi: 10.1016/s0002-8223(02)90160-4. [DOI] [PubMed] [Google Scholar]
- 6.Wren AM, Seal LJ, Cohen MA, et al. Ghrelin enhances appetite and increases food intake in humans. J Clin Endocrinol Metab. 2001;86:5992. doi: 10.1210/jcem.86.12.8111. [DOI] [PubMed] [Google Scholar]
- 7.Friedman JM, Halaas JL. Leptin and the regulation of body weight in mammals. Nature. 1998;395:763–70. doi: 10.1038/27376. [DOI] [PubMed] [Google Scholar]
- 8.Tuomi T, Santoro N, Caprio S, Cai M, Weng J, Groop L. The many faces of diabetes: a disease with increasing heterogeneity. Lancet. 2014;383:1084–94. doi: 10.1016/S0140-6736(13)62219-9. [DOI] [PubMed] [Google Scholar]
- 9.Harsch IA, Konturek PC, Koebnick C, et al. Leptin and ghrelin levels in patients with obstructive sleep apnoea: effect of CPAP treatment. Eur Respir J. 2003;22:251–7. doi: 10.1183/09031936.03.00010103. [DOI] [PubMed] [Google Scholar]
- 10.Takahashi K, Chin K, Akamizu T, et al. Acylated ghrelin level in patients with OSA before and after nasal CPAP treatment. Respirology. 2008;13:810–6. doi: 10.1111/j.1440-1843.2008.01357.x. [DOI] [PubMed] [Google Scholar]
- 11.Ulukavak Ciftci T, Kokturk O, Bukan N, Bilgihan A. Leptin and ghrelin levels in patients with obstructive sleep apnea syndrome. Respiration. 2005;72:395–401. doi: 10.1159/000086254. [DOI] [PubMed] [Google Scholar]
- 12.West SD, Nicoll DJ, Wallace TM, Matthews DR, Stradling JR. Effect of CPAP on insulin resistance and HbA1c in men with obstructive sleep apnoea and type 2 diabetes. Thorax. 2007;62:969–74. doi: 10.1136/thx.2006.074351. [DOI] [PMC free article] [PubMed] [Google Scholar]
- 13.Erdmann J, TÖpsch R, Lippl F, Gussmann P, Schusdziarra V. Postprandial response of plasma ghrelin levels to various test meals in relation to food intake, plasma insulin, and glucose. J Clin Endocrinol Metab. 2004;89:3048–54. doi: 10.1210/jc.2003-031610. [DOI] [PubMed] [Google Scholar]
- 14.Marzullo P, Caumo A, Savia G, et al. Predictors of postabsorptive ghrelin secretion after intake of different macronutrients. J Clin Endocrinol Metab. 2006;91:4124–30. doi: 10.1210/jc.2006-0270. [DOI] [PubMed] [Google Scholar]
- 15.Erdmann J, Lippl F, Wagenpfeil S, Schusdziarra V. Differential association of basal and postprandial plasma ghrelin with leptin, insulin, and type 2 diabetes. Diabetes. 2005;54:1371–8. doi: 10.2337/diabetes.54.5.1371. [DOI] [PubMed] [Google Scholar]
- 16.Barazzoni R, Zanetti M, Ferreira C, et al. Relationships between desacylated and acylated ghrelin and insulin sensitivity in the metabolic syndrome. J Clin Endocrinol Metab. 2007;92:3935–40. doi: 10.1210/jc.2006-2527. [DOI] [PubMed] [Google Scholar]
- 17.Delhanty PJ, van der Lely AJ. Ghrelin and glucose homeostasis. Peptides. 2011;32:2309–18. doi: 10.1016/j.peptides.2011.03.001. [DOI] [PubMed] [Google Scholar]
- 18.Quan SF, Budhiraja R, Clarke DP, et al. Impact of treatment with continuous positive airway pressure (CPAP) on weight in obstructive sleep apnea. J Clin Sleep Med. 2013;9:989–93. doi: 10.5664/jcsm.3064. [DOI] [PMC free article] [PubMed] [Google Scholar]
- 19.Ferland A, Poirier P, Sériès F. Sibutramine versus continuous positive airway pressure in obese obstructive sleep apnoea patients. Eur Respir J. 2009;34:694–701. doi: 10.1183/09031936.00167308. [DOI] [PubMed] [Google Scholar]
- 20.Garcia JM, Sharafkhaneh H, Hirshkowitz M, Elkhatib R, Sharafkhaneh A. Weight and metabolic effects of CPAP in obstructive sleep apnea patients with obesity. Respir Res. 2011;12:80. doi: 10.1186/1465-9921-12-80. [DOI] [PMC free article] [PubMed] [Google Scholar]
- 21.Hoyos CM, Killick R, Yee BJ, Phillips CL, Grunstein RR, Liu PY. Cardiometabolic changes after continuous positive airway pressure for obstructive sleep apnoea: a randomised sham-controlled study. Thorax. 2012;67:1081–9. doi: 10.1136/thoraxjnl-2011-201420. [DOI] [PubMed] [Google Scholar]
- 22.Redenius R, Murphy C, O'Neill E, Al-Hamwi M, Zallek SN. Does CPAP lead to change in BMI? J Clin Sleep Med. 2008;4:205–9. [PMC free article] [PubMed] [Google Scholar]
- 23.StenlÖf K, Grunstein R, Hedner J, SjÖstrÖm L. Energy expenditure in obstructive sleep apnea: effects of treatment with continuous positive airway pressure. Am J Physiol. 1996;271:E1036–43. doi: 10.1152/ajpendo.1996.271.6.E1036. [DOI] [PubMed] [Google Scholar]
- 24.Vgontzas AN, Papanicolaou DA, Bixler EO, et al. Sleep apnea and daytime sleepiness and fatigue: relation to visceral obesity, insulin resistance, and hypercytokinemia. J Clin Endocrinol Metab. 2000;85:1151–8. doi: 10.1210/jcem.85.3.6484. [DOI] [PubMed] [Google Scholar]
- 25.Ministry of Health, Labor and Welfare, March 2013. Report of National Health and Nutrition Survey. 2011. [Accessed: 13 January 2014]. http://www.mhlw.go.jp/bunya/kenkou/eiyou/dl/h23-houkoku.pdf.
- 26.Rechtschaffen A, Kales A. Washington, DC: National Institutes of Health; 1968. A manual of standardized terminology, techniques and scoring system for sleep stages of human subjects. [Google Scholar]
- 27.Iber C, Ancoli-Israel S, Chesson A, Quan S. Westchester, IL: American Academy of Sleep Medicine; 2007. The AASM manual for the scoring of sleep and associated events: rules, terminology and technical specifications. [Google Scholar]
- 28.Akamizu T, Sakura N, Shigematsu Y, et al. Analysis of plasma ghrelin in patients with medium-chain acyl-CoA dehydrogenase deficiency and glutaric aciduria type II. Eur J Endocrinol. 2012;166:235–40. doi: 10.1530/EJE-11-0785. [DOI] [PubMed] [Google Scholar]
- 29.Murase K, Hitomi T, Hamada S, et al. The additive impact of periodic limb movements during sleep on inflammation in patients with obstructive sleep apnea. Ann Am Thorac Soc. 2014;11:375–82. doi: 10.1513/AnnalsATS.201306-144OC. [DOI] [PubMed] [Google Scholar]
- 30.Teramoto T, Sasaki J, Ueshima H, et al. Japan Atherosclerosis Society (JAS) Committee for Epidemiology and Clinical Management of Atherosclerosis. Diagnostic criteria for dyslipidemia. Executive summary of Japan Atherosclerosis Society (JAS) guideline for diagnosis and prevention of atherosclerotic cardiovascular diseases for Japanese. J Atheroscler Thromb. 2007;14:155–8. doi: 10.5551/jat.e537. [DOI] [PubMed] [Google Scholar]
- 31.Yoshizumi T, Nakamura T, Yamane M, et al. Abdominal fat: standardized technique for measurement at CT. Radiology. 1999;211:283–6. doi: 10.1148/radiology.211.1.r99ap15283. [DOI] [PubMed] [Google Scholar]
- 32.Papaioannou I, Patterson M, Twigg GL, et al. Lack of association between impaired glucose tolerance and appetite regulating hormones in patients with obstructive sleep apnea. J Clin Sleep Med. 2011;7:486–92B. doi: 10.5664/JCSM.1314. [DOI] [PMC free article] [PubMed] [Google Scholar]
- 33.Haqq AM, Farooqi IS, O'Rahilly S, et al. Serum ghrelin levels are inversely correlated with body mass index, age, and insulin concentrations in normal children and are markedly increased in Prader-Willi syndrome. J Clin Endocrinol Metab. 2003;88:3573–6. doi: 10.1210/jc.2002-021052. [DOI] [PubMed] [Google Scholar]
- 34.Purnell JQ, Weigle DS, Breen P, Cummings DE. Ghrelin levels correlate with insulin levels, insulin resistance, and high-density lipoprotein cholesterol, but not with gender, menopausal status, or cortisol levels in humans. J Clin Endocrinol Metab. 2003;88:5747–52. doi: 10.1210/jc.2003-030513. [DOI] [PubMed] [Google Scholar]
- 35.Al Massadi O, TschÖp MH, Tong J. Ghrelin acylation and metabolic control. Peptides. 2011;32:2301–8. doi: 10.1016/j.peptides.2011.08.020. [DOI] [PubMed] [Google Scholar]
- 36.Spiegel K, Tasali E, Penev P, Van Cauter E. Brief communication: sleep curtailment in healthy young men is associated with decreased leptin levels, elevated ghrelin levels, and increased hunger and appetite. Ann Intern Med. 2004;141:846–50. doi: 10.7326/0003-4819-141-11-200412070-00008. [DOI] [PubMed] [Google Scholar]
- 37.Taheri S, Lin L, Austin D, Young T, Mignot E. Short sleep duration is associated with reduced leptin, elevated ghrelin, and increased body mass index. PLoS Med. 2004;1:e62. doi: 10.1371/journal.pmed.0010062. [DOI] [PMC free article] [PubMed] [Google Scholar]
- 38.Ayas NT, Hirsch AA, Laher I, et al. New frontiers in obstructive sleep apnoea. Clin Sci (Lond) 2014;127:209–16. doi: 10.1042/CS20140070. [DOI] [PMC free article] [PubMed] [Google Scholar]
- 39.Broglio F, Arvat E, Benso A, et al. Ghrelin, a natural GH secretagogue produced by the stomach, induces hyperglycemia and reduces insulin secretion in humans. J Clin Endocrinol Metab. 2001;86:5083–6. doi: 10.1210/jcem.86.10.8098. [DOI] [PubMed] [Google Scholar]
- 40.Dempsey JA, Veasey SC, Morgan BJ, O'Donnell CP. Pathophysiology of sleep apnea. Physiol Rev. 2010;90:47–112. doi: 10.1152/physrev.00043.2008. [DOI] [PMC free article] [PubMed] [Google Scholar]
- 41.Batool-Anwar S, Goodwin JL, Drescher AA, et al. Impact of CPAP on activity patterns and diet in patients with obstructive sleep apnea (OSA) J Clin Sleep Med. 2014;10:465–72. doi: 10.5664/jcsm.3686. [DOI] [PMC free article] [PubMed] [Google Scholar]
Associated Data
This section collects any data citations, data availability statements, or supplementary materials included in this article.
Supplementary Materials
Associations of fasting and postprandial acylated ghrelin and desacyl ghrelin levels with participants' characteristics, PSG data and biomarkers.
Associations of fasting and postprandial acylated ghrelin/desacyl ghrelin and acylated ghrelin/insulin ratios with participants' characteristics, PSG data and biomarkers.
Effects of CPAP on laboratory data in OSA patients with good adherence to CPAP (≥ 3 h/day) (n = 16).