Abstract
A novel class of bolapolyphile (BP) molecules are shown to integrate into phospholipid bilayers and self-assemble into unique sixfold symmetric domains of snowflake-like dendritic shapes. The BPs comprise three philicities: a lipophilic, rigid, π–π stacking core; two flexible lipophilic side chains; and two hydrophilic, hydrogen-bonding head groups. Confocal microscopy, differential scanning calorimetry, XRD, and solid-state NMR spectroscopy confirm BP-rich domains with transmembrane-oriented BPs and three to four lipid molecules per BP. Both species remain well organized even above the main 1,2-dipalmitoyl-sn-glycero-3-phosphocholine transition. The BP molecules only dissolve in the fluid membrane above 70 °C. Structural variations of the BP demonstrate that head-group hydrogen bonding is a prerequisite for domain formation. Independent of the head group, the BPs reduce membrane corrugation. In conclusion, the BPs form nanofilaments by π stacking of aromatic cores, which reduce membrane corrugation and possibly fuse into a hexagonal network in the dendritic domains.
Keywords: bolapolyphiles, lipids, membranes, pi interactions, self-assembly
Introduction
Lipid membranes with their specific spatial variation of polarity along the membrane normal provide a unique environment for supramolecular structure-formation processes in two dimensions. Of particular biological relevance are, for instance, the formation of well-defined pores and channels from peptides, proteins,[1, 2] or artificial molecules,[3] and the formation of lipid domains, sometimes referred to as rafts.[4, 5] Microdomain formation and compartmentalization[6–9] are important in lending specific functions to biological membranes.[10] Synthetic polymers, such as amphiphilic di- or triblock copolymers, often affect the membrane integrity and permeability and are, in many cases, known to form separated microdomains with specific local structure and packing,[11–13] whereas low-molecular-weight triblock molecules can stabilize bicellar structures.[14] Bipolar amphiphiles, so-called bolaamphiphiles, are incorporated into membranes to provide stabilization[15] or facilitate transbilayer diffusion.[16] Moreover, these bolaamphiphiles can operate as ligands for lectins[17] or form nanodomains.[18] Bolaamphiphiles involving molecular rods, such as octaphenylenes,[19] naphthalene or perylene diimide arrays,[20] and shorter linear biphenyl,[21] tolane,[22, 23] or polyene units,[24] provide useful scaffolds for ion or electron conductance through membranes[3] or serve as fluorescent probes.[24] Apart from these π-conjugated rods, nonconjugated linear oligospiroketals have also been incorporated into lipid membranes.[25] Although the ion transport properties, in particular, have been intensively investigated for various kinds of molecules, there is only limited knowledge about the modes of self-assembly of these synthetic molecules in membranes. This issue, which is of relevance to membrane stability and for the performance of membrane channels, could also contribute to the understanding of fundamental aspects of self-assembly in biomembranes, and is addressed herein.
Specifically, we report on a novel self-organization phenomenon of X-shaped bolapolyphiles (BPs), namely, synthetic molecules with rigid rod-like oligo(phenylene ethynylene)-based π-conjugated hydrophobic cores,[26] identical hydrophilic groups at each end, and two long aliphatic chains attached in the middle,[27–29] within lipid membranes made of 1,2-dipalmitoyl-sn-glycero-3-phosphocholine (DPPC). The unique feature is the self-assembly of some of these X-shaped BPs into microdomains of a clearly delineated dendritic shape with hexagonal symmetry in DPPC membranes of giant unilamellar lipid vesicles (GUVs). We used laser scanning confocal fluorescence microscopy (CFM) to image the regular dendritic domains and probe the BP orientation in these domains. To characterize the structural and dynamic features of the novel structures and correlate these with the complex phase behavior of the BP/DPPC/water system, as revealed by differential scanning calorimetry (DSC), we applied different solid-state NMR spectroscopy techniques and XRD to multilamellar vesicle (MLV) preparations.
First, the molecular design concept and syntheses of the new compounds are described, followed by CFM studies of GUVs prepared from mixtures of DPPC with each of the BPs. Next, the thermal behavior of one representative BP (B12) in different concentrations of mixtures of DPPC/H2O studied by DSC and XRD is presented. The remainder of the paper focuses on a detailed spectroscopic characterization of B12 in DPPC by using solid-state 31P and 1H NMR techniques to characterize the mobility of the respective components to explain the complex thermal behavior and investigate structural features. We conclude with a discussion of tentative structural models.
Results
Design and synthesis of materials
The structures of the investigated BPs are shown in Scheme 1. Because certain types of living organisms contain bolaamphiphilic molecules in their phospholipid membranes (albeit with different structures and without the central attachments[15, 30]), we reasoned that X-type BPs of about 3 nm core length,[29] roughly matching the hydrophobic DPPC bilayer core, might integrate into phospholipid bilayers in a transmembrane orientation. Additional structural diversity is conveyed by the central side chains, leading to a combination of three philicities: the core is lipophilic, rigid, and capable of π–π stacking interactions; the side chains are lipophilic, but flexible; and the head groups are hydrophilic and capable of hydrogen bonding.
Scheme 1.
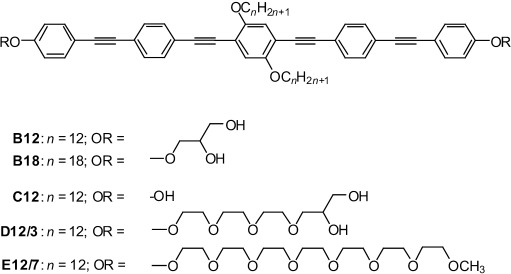
Structures of the BPs B12–E12/7. In the nomenclature for Bn, Cn, Dn/m, and En/m, n denotes the alkyl chain length and m is the number of ethylene oxide groups.
By using B12 with n=12 and glycerol head groups as a starting point and keeping the core constant, further variations were introduced: First, the length of the side chains was extended (B18, n=18). In addition to side-chain variation, both glycerol head groups of B12 were replaced by simple hydroxyl groups (C12), by head groups combining a hydrophilic and flexible oligo(ethylene oxide) spacer unit (EO3) with glycerol moieties (D12/3), or by oligo(ethylene oxide) (EO7) head groups incapable of acting as a hydrogen-bond donor (E12/7; see Scheme 1).
The polyphiles were synthesized by two strategies, as shown in Scheme 2. Compounds Bn (n=12,18) with glycerol groups were obtained in a similar way to that used previously for structurally related compounds.[29] Herein, 1,2-O-isopropylidene glycerol substituted phenylacetylene (2)[31] was coupled in a Sonogashira reaction[32] with 4-bromotrimethylsilylethinylbenzene (1 a)[33] to obtain 4′-1,2-O-isopropylideneglycerol-functionalized 4-ethinyltolane 4 a after basic cleavage (K2CO3/MeOH) of the C-terminal trimethylsilyl group.[34] Sonogashira coupling of 4 a (2 equiv) with 2,5-dibromohydroquinone ethers 5 (n=12, 18)[35] led to compounds 6 a (n=12, 18), which were deprotected with Py⋅TsOH in methanol[36] to give the BPs B12 and B18, respectively. This last deprotection step turned out to be the bottleneck of this synthetic strategy, leading to low yields (≈20–50 %) due to the sensitivity of the electron-rich oligo(phenylene ethynylene) core under acidic conditions, the long reaction time required, and the incomplete deprotection of both glycerol groups, giving rise to purification problems. Therefore, an alternative strategy, which avoided this step, was used for the synthesis of subsequent compounds.
Scheme 2.
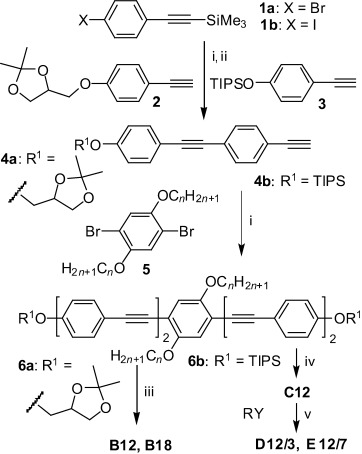
Synthesis of compounds Bn–Em/n. Reagents and conditions: i) [Pd(PPh3)4], CuI, Et3N, reflux, 7 h; ii) K2CO3, MeOH, CH2Cl2, RT, 10 h; iii) pyridinium tosylate (Py⋅TsOH), THF, MeOH, 60 °C, 5 d; iv) tetra-n-butylammonium fluoride (TBAF), THF, 25 °C, 1 h; v) K2CO3, DMF, 80 °C, 8 h (Y=Br and Y=OTs in the syntheses of D12/3 and E12/7, respectively; R is shown in Scheme 1, TIPS=triisopropylsilyl).
For the synthesis of compounds D12/3 and E12/7 with extended polar groups the oligo(phenylene ethynylene)-based biphenol C12 was synthesized first in two subsequent Sonogashira coupling reactions, and the polar groups were attached in the final step through etherification reactions. In the first coupling reaction, the TIPS-protected 4-ethinylphenol 3[37] was coupled with 4-iodophenylethinyltrimethylsilane (1 b)[38] to give the 4′-triisopropyloxy-substituted 4-ethinyltolane 4 b after selective base-catalyzed desilylation (K2CO3/MeOH) of the ethynyl group.[34] Two equivalents of 4 b were then coupled with 2,5-dibromo-1,4-didodecyloxybenzene 5 (n=12) to yield the O-TIPS-protected compound 6 b. Removal of the TIPS groups under fluoride ion catalysis[39] yielded the oligo(phenylene ethynylene)-based biphenol C12. Etherification of C12 with 12-bromo-3,6,9-trioxadodecane-1,2-diol (RY, Y=Br) or 3,6,9,12,15,18,21-heptaoxadocosyl-p-toluenesulfonate (RY, Y=OTs)[40] yielded compounds D12/3 and E12/7, respectively. Analytical data and details of the syntheses and purification are described in the Supporting Information.
GUVs and CFM
GUVs represent free-standing bilayer model membranes, which, by virtue of their large size, allow direct visualization of the membrane morphology and phase separation by fluorescence microscopy. Domains with irregularly shaped boundaries are observed when a solid and a fluid membrane phase coexist, for instance, in GUVs from DPPC and 1,2-dilauroyl-snglycero-3-phosphocholine (DLPC) at room temperature.[41] In contrast, in fluid–fluid phase separation, the length of the interfacial lines becomes minimized, leading to circular domains.[42]
Electroformation, that is, rehydration of a lipid film in the presence of an alternating electric field, is a preferred method for obtaining giant vesicle preparations with a large degree of unilamellarity.[43] For the preparation of GUVs in this study, BPs were mixed with DPPC at a 1:10 molar ratio and the solvent was evaporated to yield a dry mixed film. GUVs containing both BP and phospholipid were formed upon electroformation (for details, see the Experimental Section).[44] GUVs were visualized by means of CFM by exploiting the autofluorescence of the BPs (absorption maxima at λ=334 and 386 nm, emission maximum at λ=428 nm) and by counterstaining with a small amount of a red fluorescent rhodamine-labeled lipid (1,2-dipalmitoyl-sn-glycero-phosphoethanolamine-N-(lissamine rhodamine B sulfonyl), Rh-PE).
GUVs from pure DPPC can only be prepared by electroformation at a temperature above the main transition temperature. When the GUVs are cooled to room temperature for CFM, the GUVs exhibit a faceted, corrugated shape and hole defects due to the presence of the gel phase,[44] as shown in Figure 1 a. Next, GUVs were prepared from BPs and DPPC to test the miscibility of the two components in the membrane plane (Figure 1 b–f). Incorporation of any of the BPs was found to suppress the hole defects and reduce the corrugated appearance of facetted GUVs. Some GUVs appeared smooth, whereas others were still corrugated; this was accounted for by the fact that GUV samples tended to be slightly heterogeneous in quantitative compositions.[45] Most notably, the domains formed by B12 had a striking, snowflake-like appearance, which featured sixfold symmetry and dendritic branches (Figure 1 b). The dendritic domains are probably formed through a kinetically controlled nucleation and growth mechanism[46] and bear a superficial resemblance to phase-separated structures observed in mixed-lipid GUVs[10] or supported bilayers.[6, 7] The clean sixfold symmetry observed for B12 is remarkable. It suggests a regular packing structure of the BP and lipid components, and most likely reflects its local symmetry.
Figure 1.
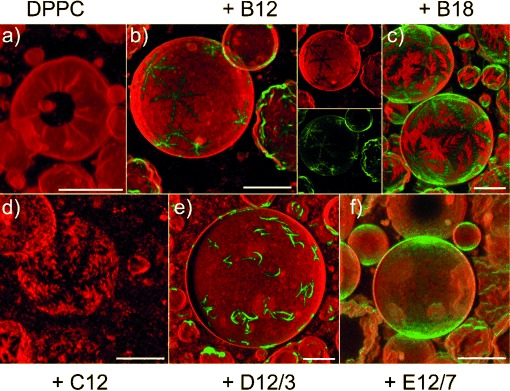
Confocal fluorescence images (shadow projections of axial image stacks) of GUVs from DPPC (a) and of GUVs from DPPC and different BPs (B12 (b), B18 (c), C12 (d), D12/3 (e), and E12/7 (f)) at a 10:1 molar ratio at room temperature (22 °C). The BP autofluorescence is displayed in green. The Rh-PE counterstain is shown in red. In b), separate images for the red (Rh-PE) and green (B12 autofluorescence) channels are also shown. In d), the BP fluorescence is not observable due to fast photobleaching of C12. Notably, sixfold symmetric domains with a snowflake-like appearance are observed with B12, B18, and C12. Scale bar=20 μm.
Chemical variations allow us to delineate necessary conditions for the formation of the observed domains. A similar, sixfold-symmetric snowflake-like appearance to that of B12 was observed for B18 (Figure 1 c), which was a polyphile with extended lateral alkyl chains, as well as with C12, which represented a polyphile with only a single hydroxyl head group at each end (Figure 1 d). A bulkier head group (D12/3), which combines the glycerol moiety with an (EO)3 spacer unit, preserves phase separation into domains, but removes the strict symmetry, resulting in boomerang-shaped domains (Figure 1 e). Only E12/7, which carries methoxy-terminated (EO)7 head groups that are incapable of acting as a hydrogen-bond donor, does not form macroscopically segregated domains. The nearly uniformly distributed green fluorescence indicates that, in this case, individual BPs or small microdomains are randomly distributed in the lipid bilayer. Hence, the ability of the polyphiles to form hydrogen bonds appears to be a prerequisite for macroscopic segregation. Enlargement and increased flexibility of the head groups appear to contribute to a reduced size and regularity of the domains.
The characteristic angle dependence of the fluorescence intensity along the perimeter of a macroscopically homogeneous GUV, illuminated with linearly polarized light, is indicative of the orientation of a fluorophore in a bilayer membrane.[47–49] Therefore, BP fluorescence along the perimeter of the GUVs obtained by confocal laser scanning microscopy with a polarized laser beam was used to study how the BP was incorporated into the membrane. A single confocal slice of the GUVs containing E12/7 from Figure 1 f is shown in Figure 2. The transition dipole moment of BP is approximately parallel to the long axis of the rod-like aromatic core. The systematic variation in fluorescence intensity along the perimeter of a GUV with fluorescence maxima appearing at the top and bottom of the microscope image and minima appearing to the right and left confirms that the BP is indeed integrated into the phospholipid bilayer in an approximately transmembrane orientation. The pronounced noise-like fluctuations suggest that GUVs from the 1:10 mixture of E12/7 and DPPC are not perfectly homogeneous, but heterogeneous around the confocal resolution limit.
Figure 2.
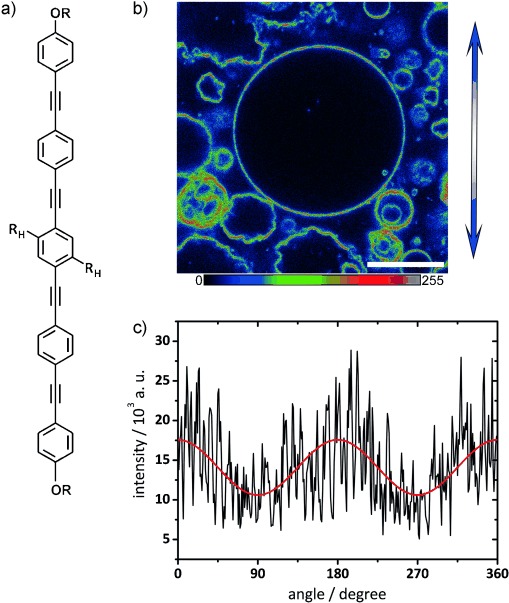
a) Structure of the BP core (substituents OR as in Scheme 1 and RH=OC12H25). b) Confocal slice of GUVs prepared from a 1:10 ratio of E12/7 and DPPC, excited with polarized λ=405 nm laser light. The direction of polarization is indicated by the blue double arrow. A multicolor palette (as depicted below) is used to highlight fluorescence intensity variations. Scale bar=20 μm. Imaging was performed at room temperature (22 °C). c) The fluorescence intensity along the perimeter of the largest GUV in b) as a function of angle γ (black line: data; red line: cosine-squared fit function, I=a+b cos2 (γ)) shows maxima at the top and bottom of the image and minima to the right and the left; this indicates an approximately transmembrane incorporation of the BP into the bilayer.
DSC investigation of B12/DPPC mixtures
To obtain a better understanding of the origin of the unusual mode of molecular self-assembly in the lipid layers, in-depth investigations of B12/DPPC mixtures were performed. DPPC forms a gel phase at room temperature, and the DSC results shown in Figure 3 demonstrate a reduced transition enthalpy for the main lipid gel to fluid phase transition at 42 °C upon mixing with increasing amounts of B12. Three new transitions appear between 50 and 70 °C, which suggests the existence of phase separation within the membrane. The whole set of three new transitions shifts to higher temperature for a DPPC/B12 ratio of 4:1 and lower, which indicates a change in the composition of the domains with increasing B12 content. The reduced ΔH values for the main transition at 42 °C suggest that a significant fraction of lipid molecules do not take part in the main transition at this temperature, but become disordered only at higher temperature. The sum of all peak areas in the mixtures remains almost constant, which indicates that at 80 °C all DPPC molecules are in the disordered state. Because the length of the domain boundaries in a phase-separated system can also decrease the transition enthalpies, we refrain from a quantitative interpretation of the reduced ΔH values, and refer to our NMR spectroscopy based assessment described below.
Figure 3.
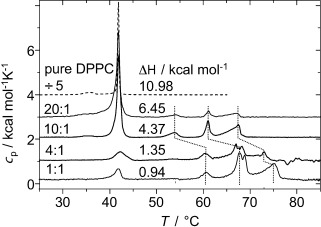
DSC thermograms of MLV preparations of pure DPPC and of B12 in mixtures with DPPC with different molar ratios. The indicated ΔH values refer to the sum of the pre- and main transition of DPPC in units of kcal mol−1 lipid.
XRD investigation of a B12/DPPC mixture
The phase behavior and demixing phenomena found by DSC were also investigated by using temperature-dependent powder XRD to gain more insight into the structural organization of the B12/DPPC system as a function of temperature. A B12/DPPC sample with a molar mixing ratio of 1:10 was prepared within a capillary and temperature-dependent powder patterns were recorded (Figure 4). In the SAXS region, up to four reflections with equidistant positions are visible, which indicate the presence of a lamellar structure. The WAXS region shows two strong reflections: the (020) and (110) reflections from the chain lattice of the lipids. From these reflections, the chain packing mode and tilt angle of the chains can be determined to be similar to pure DPPC.
Figure 4.
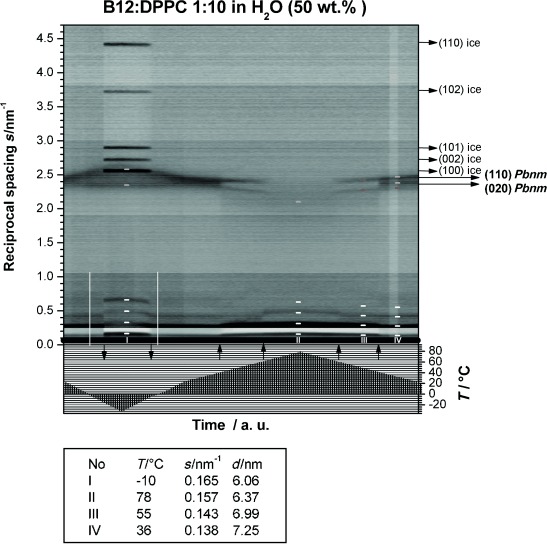
X-ray contour plot of aqueous suspensions of B12/DPPC (1:10) with 50 wt % H2O. In the upper part, the scattering intensities are plotted in grayscales (reciprocal spacing axis at the left-hand side) and the temperature profile is plotted in the lower part (temperature axis at the lower right-hand side). Arrows pointing upwards mark phase transitions, and arrows pointing downwards show the freezing and melting of excess water. Scattering curves at 0 °C are highlighted with white vertical lines. At temperatures between the freezing and melting of water, sharp ice reflections appear that are indexed with horizontal arrows in the right-hand border. Small-angle X-ray scattering (SAXS) reflections at temperatures I–IV are marked with white horizontal dashes and respective reflections of the wide-angle X-ray scattering (WAXS) region with yellow or red dashes (two phases). The WAXS reflection indexing in the right-hand border (long horizontal arrows) refers to the lipid-rich phase. The box at the bottom shows the repeat distances at the marked temperatures (I–IV).
The repeat distance (membrane plus interlamellar water layer thickness) within the multilayer stacks was determined at different temperatures. At room temperature, the lamellar repeat distance of the mixture is slightly larger (d (1:10)=7.25 nm) than the distance found for pure DPPC bilayers (d=6.35 nm at 20 °C in the Lβ′ phase and 6.70 nm at 50 °C in the Lα phase).[50] The interlamellar water layers are thus increased in thickness and/or the molecular tilt has decreased. An increase in the water layer thickness can be caused by a change in hydration of the head-group region due to the incorporation of the B12 molecules, which, at the same time, can also induce a reduction of the tilt angle of the lipid chains. For a phase-separated system, we would expect two sets of lamellar repeat distances in the SAXS region, provided that the phase-separated domains do not have identical thicknesses of lipid layers including the water layer. Analysis of the profiles of the peaks in the SAXS region indicate only that the peaks may have a shoulder. Experiments that have been performed on oriented bilayers by using X-ray reflectometry support this finding because the shoulders are more pronounced.[51] In addition, at a higher temperature of approximately 50 °C, when the lipids in the almost pure DPPC domains are fluid, the difference in layer thickness between the two domain types becomes larger and the two sets of SAXS reflections are more clearly separated.
In the WAXS region, the reciprocal spacings of 2.33 (110) and 2.43 nm−1 (020) indicate the presence of an orthorhombic (symmetry group Pbnm) herringbone lattice[52] with tilted chains characteristic for bilayers in an Lβ’ phase at room temperature. Upon cooling below room temperature, an increase in splitting of the two WAXS reflections is observed, which indicates a further change in chain packing. When the sample is further cooled below 0 °C, the crystallization of excess water leads to the appearance of sharp ice reflections. The freezing of interlamellar water leads to reduced membrane repeat distances (d=6.06 nm). After heating the sample again to room temperature, the initial repeat distance, and thus, the membrane structure is restored, which indicates a reversible process of excess water freezing (dehydration/hydration).
At higher temperatures, the two WAXS reflections change into a broad scattering peak, which indicates the transition from the gel to the fluid Lα phase. For the 1:10 mixture, this occurs at 42 °C in coincidence with the main transition at Tm observed by DSC. Above this transition, still intense WAXS peaks are visible at slightly different reciprocal spacings and additional WAXS peaks appear (sT>42 °C=2.25 and 2.39 nm−1). These reflections indicate that the sample still contains some ordered lipid chains, but the packing is in a different geometry to that of the normal Lβ′-phase with tilted chains.
Above 68 °C, fluid high-temperature phases are formed. No sharp reflections, but only a broad halo characteristic for fluid chains is visible in the WAXS region. The layer thickness is further decreased, as expected for a fluid lipid bilayer (d (1:10)=6.37 nm), and the high-temperature fluid phase appears to be homogeneously mixed.
The XRD results support the assumptions based on the DSC results that the mixtures seem to be phase separated. The XRD results clearly show that a pure or very DPPC-rich lamellar phase must exist, which transforms into a fluid Lα phase at a temperature of 42 °C. Above this temperature, part of the lipids are still ordered and probably form a type of complex with B12, in which the chains are in a different chain lattice. A homogeneous fluid phase is only formed at very high temperature above 68 °C with a reduced lamellar repeat distance and a typical broad halo in the WAXS region that is characteristic for fluid chains. The X-ray results for the B12/DPPC (1:4) mixture are similar (not shown), although the phase separation at low temperature is not as pronounced. This is also evident in the DSC curves, in which the low-temperature transition peak characteristic for DPPC is much smaller.
NMR spectroscopy of B12/DPPC mixtures
Information on the physical properties of the membranes and changes associated with the addition of B12 can be obtained by static 31P NMR spectroscopy. The single 31P nucleus in the lipid head group has a strongly orientation-dependent chemical shift (chemical-shift anisotropy (CSA)), which is sensitive to rotational motions of the head group.[53, 54] The width of the CSA tensor, Δν, is preaveraged by fast axial rotations, leading to a symmetric tensor with a principal axis parallel to the membrane normal. The extent of rotational averaging depends on the mobility of the lipid and primarily reflects the phase state, that is, the more confined environment of the gel phase and the more mobile environment of the fluid Lα phase. This is demonstrated for experimental results on pure DPPC given in Figure 5 a and b, which show the well-documented spectral changes.[54]
Figure 5.
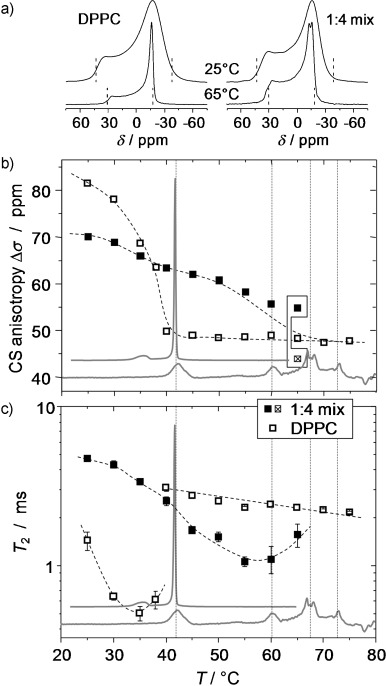
31P NMR spectroscopy of a 1:4 mixture of B12 with DPPC and of pure DPPC. a) Static spectra reflecting the CSA of the 31P of DPPC in the Lα phase (47 ppm or 7.6 kHz between the dashed lines) and in the gel phase (81 ppm or 13.1 kHz) of the pure lipid (left) and corresponding data for the mixture (right). b) CSA values as a function of temperature. c) 13P T2 relaxation times evaluated at the magic-angle orientation (around δ=0 ppm in the spectra); the minimum arises from slow lipid rotations in the gel phase. The slight temperature shifts of the NMR spectroscopy data relative to the DSC traces (gray in the background) originate from weak radiofrequency-induced heating due to 1H decoupling and possible errors in the temperature calibration.
Qualitative changes are observed for the spectra of the 1:4 mixture (Figure 5 a, right column, and b). In lieu of the steep pretransitional drop to a lower CSA value above 40 °C, Δσ in the mixture exhibits a decay with indications of a two-step feature associated with the reduced main transition and the first new transition in DSC. This is the first indication that a fraction of DPPC is still within the gel phase above 40 °C, as further substantiated below. Notably, the Δσ values represent an average over the different DPPC fractions, that is, the one associated with B12 still in the gel phase and the mobilized fraction. The intrinsic line width of the spectra is only sufficiently reduced at 65 °C, so that the two fractions can be discriminated (see the connected points in Figure 5 b). The fact that the Δσ value associated with the Lα phase falls below the bulk value can be attributed to the inaccuracy related to the simple reading off of the anisotropy values, which is ambiguous due to the intrinsic line width. An important observation at low temperatures is that the Δσ value of the mixture is lower than that for pure DPPC. This Δσ value is, of course, an average of two components, but it indicates that the second fraction of immobilized lipid displays larger-amplitude, fast head-group fluctuations than a pure DPPC gel phase. This is in agreement with the WAXS observations, which indicate a lattice that is different from the normal Lβ′-phase.
The intrinsic line broadening (refocused line width) is best studied by Hahn-echo T2 relaxation time measurements, the results of which are shown in Figure 5 c. The T2 decay was evaluated at the isotropic-shift position of the CSA patterns (center of gravity, close to δ=0 ppm), corresponding to the magic-angle orientation of the membrane normal in the vesicle preparations with respect to the magnetic field B0, in which T2 is sensitive to slow orientation fluctuations. The minimum in the gel phase arises from the onset of free-lipid rotation on a timescale of (ΔσνL)−1≈0.1 ms, whereas the slow decay in the fluid phase is associated with slower bending modes.[54] Again expectedly, the lower average T2 value in the mixture reflects intermediate behavior, for which the minimum of the unmodified DPPC fraction is barely visible. The most important effect is the shifted minimum, which demonstrates that the larger part of the lipid is still in a gel phase above 40 °C. Clearly, the T2 value of the mixed system approaches the bulk value only at temperatures above 75 °C, at which B12 is freely mobile in the membrane. The latter can be demonstrated with the help of quantitative 1H NMR spectra, which we now discuss.
Quantitative temperature-dependent magic-angle spinning (MAS) 1H NMR spectra were taken to first quantify the amount of lipid involved in the different phases, by taking advantage of the fact that the aliphatic lipid resonances associated with the ordered gel phase are broadened by strong 1H–1H dipole–dipole couplings beyond detection at moderate MAS, namely, 5 kHz spinning frequency (Figure 6 a). Integrations of the aliphatic and glycerol (C2 proton) resonances (Figure 6 b) reveal that, for the 4:1 and 10:1 mixtures, only around 10–15 and 50–55 %, respectively, of the total expected signal is visible above the transition into the fluid Lα phase at 42 °C. This suggests that significant amounts of DPPC do not participate in this transition, but are associated with a rather immobile B12-rich phase. Taking into account the contribution of B12 residues to the two signal regions, we consistently estimate the mixed phase to be composed of about 3.4 and 4.2 immobilized DPPC molecules per B12 molecule for the 4:1 and 10:1 mixtures, respectively.
Figure 6.
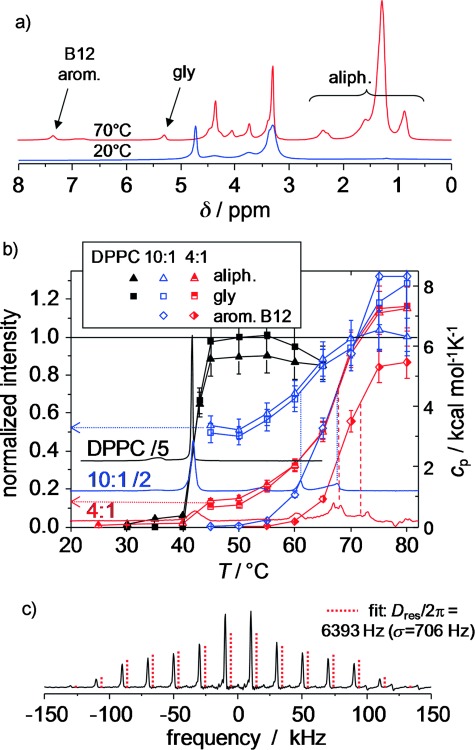
MAS 1H NMR data (5 kHz spinning) of hydrated pure DPPC and DPPC/B12 MLV preparations. a) Exemplary quantitative 1H NMR spectra of a 4:1 mixture obtained by using a recycle delay of 8 s at 20 and 70 °C. b) Integrals of different spectral regions, normalized to 100 % as the total expected signal, as a function of temperature overlaid with scaled DSC traces (right vertical scale) and c) double-quantum (DQ) spinning sideband pattern (10 kHz MAS) for the aromatic B12 resonance of a 4:1 mixture at 75 °C by using the BaBa-xy16 pulse sequence[55] with a recoupling time of 4 rotor periods.
Figure 6 b also demonstrates that, within the error margin of about 20 % intrinsic to our comparison of different samples, all resonances are visible in the MAS 1H NMR spectrum above 75 °C. Thus, the aliphatic chains of all membrane components, as well as the B12 aromatic cores seen at δ≈7 ppm, are completely mobilized and possibly dissolved in a homogeneous membrane above the last transition. As determined from the inflection points of the sigmoidal trends, the majority of the still immobilized DPPC tails are consistently seen to become mobile about 5 °C below the B12 cores. Thus, the two highest DSC transitions are assigned to DPPC melting and B12 melting/dissolution, respectively, which confirms the interpretation of the 31P NMR spectroscopy data of the head group.
Details on the dynamic state (amplitude of motion) and orientation of B12 can be inferred from the dynamic order parameter, S, associated with different internuclear vectors. It can be probed by suitable NMR spectroscopy techniques that measure the respective residual (motion-averaged) dipole–dipole coupling constants, Dres,[56] by using S=Dres/Dstat, in which Dstat is the effective static-limit coupling constant in rad s−1. Specifically, fast orientation fluctuations (which are much faster than 1/Dstat) of dissolved B12 can be characterized by the 1H–1H dipole–dipole coupling of pairs of neighboring aromatic protons to exploit the fact that the internuclear vector points along the long axis and is thus not affected by fast uniaxial rotation. The value of Dres can be obtained from DQ[57] spinning sideband analysis.[58] From the result at 75 °C (Figure 6 c), in combination with a reference coupling, Dstat/2π, of 8.2 kHz, which corresponds to an H–H distance of 2.45 Å, we obtain S=0.78±0.1, which characterizes orientation fluctuations of the B12 long axis. This can be interpreted by models that assume diffusive motion of the long axis on or within a cone with half-opening angles of 20 or 30°, respectively. This reinforces the conclusion of a mainly transmembrane orientation of B12 already inferred from the fluorescence measurements at lower temperature.
For further refinement of the analysis, we use advanced 13C–1H dipolar solid-state NMR spectroscopy techniques.[56] An account of these results is beyond the scope of this work and will be reported separately. To summarize, similar 13C–1H order parameter measurements unambiguously demonstrate that B12 performs fast, well-defined 180° flip motions in DPPC MLVs at room temperature, as well as in its pure, crystalline state. This is a common process for p-substituted, π–π-stacked phenyl rings.[59] In contrast, above all thermal transitions in the miscible phase (75 °C), the data confirm free rotation of B12.
The π–π interactions between aromatic rings are corroborated by our observation of a redshifted fluorescence of B12 in the star-shaped domains of DPPC GUVs, when visualized with a spectral detector, compared with B12 dissolved in organic solvent (Figure 7). This redshift of the fluorescence due to π–π interactions is also observed in fluorescence spectra of MLVs taken at 20 °C, at which the emission observed for B12 in solution becomes shifted to longer wavelength when incorporated into DPPC bilayers. Above the transition at 75 °C, the fluorescence spectrum becomes nearly identical to that recorded in solution in chloroform; this indicates that the B12 molecules are now molecularly dispersed in the bilayers.[51]
Figure 7.
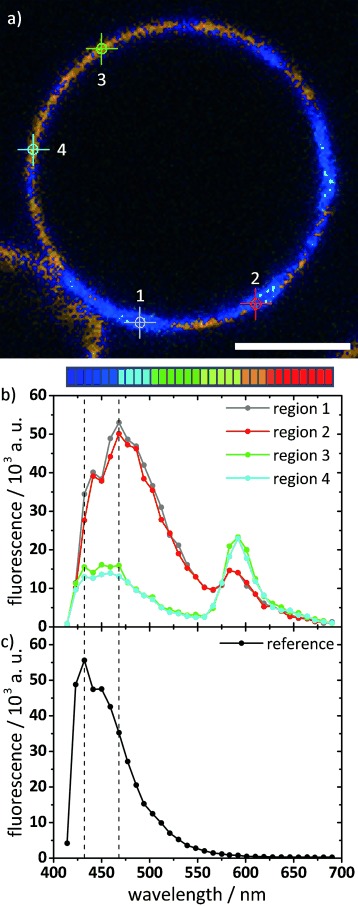
Spectrally resolved CFM of GUVs from B12/DPPC (1:10), counterstained with Rh-PE. a) Confocal slice image color-coded by wavelength, as indicated by the color palette below (32 channels, λ=414 to 690 nm, 8.9 nm resolution). Scale bar=5 μm. Imaging was performed at room temperature. b) Corresponding spectral plots for the four regions indicated by circles in the confocal image. Regions 1 and 2 are located in the B12-rich star-shaped domains; regions 3 and 4 are in the surrounding phase. The peak at λ≈470 nm (which is higher within the domains) is due to B12 emission; the peak at λ≈590 nm (which is higher outside the domains) is due to Rh-PE emission. c) As a reference, the spectrally resolved fluorescence of B12 in chloroform/methanol was recorded on the same setup, and showed a peak at λ≈430 nm.
We finally note that 1H MAS spectra were also recorded for an MLV mixture of DPPC and E12/7 (see Scheme 1). Here, a very gradual mobilization of the E12/7 aromatic cores is also only seen above the main DPPC phase-transition temperature, which indicates that, in this case, when no macroscopic domain formation was observed optically (see Figure 1 f), π-stacked, rigid aggregates should also be present. Apparently, these aggregates form microdomains that randomly pervade the DPPC membranes, smooth out the GUV membranes, and explain that the majority of giant vesicles lack visible corrugation.
Discussion
Based on these insights, we discuss tentative models of self-assembly of the X-shaped BPs in the lipid bilayers. XRD investigations and DSC results indicate that the B12/DPPC mixtures are phase separated. The major phase is a pure or very DPPC-rich lamellar Lß’ phase, which transforms into a fluid Lα phase at a temperature of 42 °C. The B12 molecules self-assemble into B12-rich domains that contain highly ordered, tightly π–π-stacked B12 molecules oriented, on average, along the membrane normal and are only able to perform π flips. In the B12-rich domains, about 3–4 DPPC molecules per B12 molecule are involved, which display enhanced head-group mobility, although the chain order (probably on a different lattice) is retained even above 42 °C, that is, the chains appear to be immobilized.
At first sight, a simple explanation for the dendritic appearance of the B12-enriched domains in the confocal images of GUV membranes (Figure 1 b) might seem to be defect lines around the gel-phase facets formed upon cooling and gel-phase formation in DPPC GUVs. One might envision that these may be occupied by the B12-enriched domains. However, if this were the case, an irregular network of B12-filled cracks would be expected to cover the surface of the GUVs, instead of the impressively regular, hexagonal, star-shaped domains observed in the B12, B18, and C12 samples.
It could also be envisaged that, according to the solid docks hypothesis,[9] the BP microdomains favor chain crystallization of the lipid molecules around them, as indicated by the observed increase in the transition temperature to the fluid Lα phase of DPPCs associated with the BPs. The simultaneously enhanced head-group mobility of these immobilized lipids suggests that the orthorhombic chain packing might be modified. The observed dendritic growth of the domains with hexagonal symmetry could result if the symmetry of chain packing were changed to hexagonal in the BP-rich domains, at least in time and space average.
Our observation of well-packed BPs with motions restricted to π flips suggests that they form extended filaments with parallel π faces. An analogous filament formation has recently been demonstrated for bolaamphiphiles without lateral chains in the absence of lipids.[60] With the X-shaped bolaamphiles used herein, the additional lateral alkyl chains interact and preferentially mix with the alkyl chains of the DPPC molecules; thus separating adjacent BP filaments. Moreover, the BP head groups capable of hydrogen bonding are expected to additionally stabilize the string-like filaments. The strings may become interconnected, resulting in a random network. The lack of visible corrugation in the DPPC-rich parts of the GUVs could be explained by a low density of randomly distributed nanofilaments that smooth out and stabilize the membranes by gluing together larger patches of DPPC gel phase. The sixfold symmetric shape of the B12-rich domains could, in this case, result from a fusion of these filaments into a regular hexagonal net. A tentative model that takes into consideration all these restrictions, in which the walls are built of transmembrane-oriented, aligned, and π–π-packed B12 cores, is shown in Figure 8 and in the Supporting Information. The resulting hexagonal cells are filled by the lateral chains of the B12 and DPPC molecules that become immobilized by this confinement. As the overall effective head group to chain cross-sectional area ratio of the superstructure is reduced (by the lateral chains of BP and the smaller head groups of most BPs), lipid-chain immobilization could indeed be associated with the observed lipid head-group mobilization. Based on the maximum observed ratio for B12/DPPC of around 1:3 (B12-rich domains) and considering the dimensions of the involved molecules, it is estimated that at least 7 molecules of B12 are arranged along each of the honeycomb walls; thus accommodating about 50 DPPC molecules in the hexagonal cells, as estimated by calculations given in the Supporting Information. This dense packing in hexagonal honeycombs could be favored by hydrogen bonding between the relatively small head groups of the BPs B12, B18, and C12, whereas larger head groups with reduced capability for hydrogen bonding cannot fuse to form a dense honeycomb, and thus, the BP filaments remain randomly distributed in the lipid matrix, as observed for E12/7.
Figure 8.
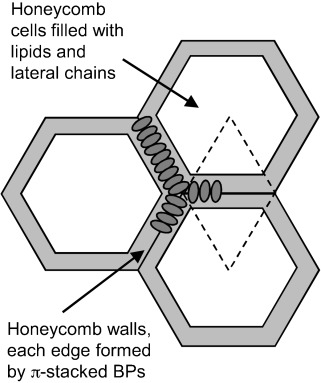
Model showing the organization of BPs (B12) in a hexagonal honeycomb (cut perpendicular to the membrane normal).
The formation of polygonal honeycombs composed of parallel aligned aromatic cores is a common feature of BPs, previously found as a dominating mode of self-assembly of such molecules in liquid-crystalline (LC) bulk phases.[27–29, 61] However, in contrast to most reported LC honeycombs with aromatic cores oriented tangentially around the lipophilic domains, in the membranes, as a result of the confinement provided by the membranes and the anchoring of polar groups at the surfaces, the aromatic cores align parallel to the cylinder long axes. This indeed resembles the organization of some T-shaped polyphiles in the hexagonal channeled layer LC phases.[62] We therefore consider the honeycomb model to be the most probable model, although further in-depth characterization of the mesoscale structure will be required for a final conclusion to be drawn.
Conclusion
We demonstrated that a new class of bolapolyphilic molecules exhibited a unique propensity to form supramolecular structures in free-standing lipid bilayer membranes. We found that, as a function of the head-group structure, BPs and lipids reproducibly self-organized in either highly regular, sixfold symmetric structures or less ordered 2D networks. The molecular origin of the three first-order thermal transitions associated with these structures, as seen in DSC, were elucidated by XRD and NMR spectroscopy. By using distinct head groups, it was demonstrated how supramolecular organization could be tuned by molecular design. The mesoscale structure and molecular orientation of B12 in DPPC and in DMPC have been further investigated by transmission electron microscopy, different X-ray diffraction techniques, fluorescence and polarized infrared spectroscopy, as reported in a separate publication.[51] Because the physical properties of self-assembled materials depend crucially on their supramolecular organization, we envision that a targeted design will enable novel applications in nanotechnology, encapsulation, and drug delivery or template-assisted engineering of scaffolds of π-conjugated rods, which are of interest, for example, for molecular electronics and sensor applications. The investigation of the self-assembly of properly designed synthetic molecules in lipid membranes could also contribute to the better understanding of microdomain formation in biomembranes[4–10] and to the design, stabilization, and investigation of functional membranes and protocells.[63]
Experimental Section
Synthesis
Details of the syntheses and analytical data are described in the Supporting Information.
GUV preparation
The lipid DPPC and red fluorescent lipid marker Rh-PE were purchased from Avanti Polar Lipids (Alabaster, Alabama, USA) and used without further purification. GUVs were prepared by a modified electroformation method.[64, 44] With chloroform as a solvent, the DPPC was mixed with one of the BPs at 10:1 molar ratio by adding 0.5 mol % of Rh-PE as a red counterstain. The total concentration was 15 mg mL−1. The mixture (15 μL) was spread on optically transparent indium tin oxide (ITO) coverslips (Gesim GmbH, Grosserkmannsdorf, Germany) preheated to 60 °C. The coverslips were assembled in a capacitor-type configuration by using a home-built perfusion chamber with 2 mm spacers. The chamber was filled with deionized water and an alternating sinusoidal voltage (1.3 V effective voltage, 10 Hz) was applied for 4 h at 60 °C. Prior to confocal microscopy, the perfusion chamber was allowed to cool to room temperature (22 °C).
CFM measurements
CFM was carried out on an LSM 710 setup (Carl Zeiss Microimaging, Jena, Germany) by using a C-Apochromat 40×/1.2 N.A. water immersion objective at room temperature. The BPs were excited with a diode laser at λ=405 nm; the fluorescence emission was collected from λ=412 to 500 nm by using a photomultiplier detector. A λ=561 nm DPSS laser was used to excite the lipid marker Rh-PE; the fluorescence emission of the marker was collected from λ=566 to 681 nm. Spectrally resolved confocal imaging was performed on an LSM 780 setup (Carl Zeiss Microimaging, Jena, Germany) by using a C-Apochromat 63×/1.2 N.A. water immersion objective. Fluorescence was collected between λ=414 and 690 nm at 8.9 nm resolution by using a 32-channel GaAsP detector. Spectral plots were generated for selected regions of interest (ROIs). For the reference measurement, an image of a solution of B12 in CHCl3/MeOH (2:1) was acquired and a spectral plot for an arbitrary ROI within the uniform image was generated.
DSC measurements
DSC thermograms were acquired by using a VP-DSC[65] instrument (MicroCal/GE Inc. Northampton, USA) with heating/cooling rates of 60 K h−1 in a temperature range of 2–95 °C. The traces shown in Figure 5 represent the seventh heating scan of mixed vesicles prepared as follows: All components were mixed in CHCl3/MeOH (2:1) at the required molar ratio; the organic solvent was then evaporated in a stream of N2 to obtain a lipid film. The film was further dried under reduced pressure at 70 °C for about 3 h. After hydration with H2O, the sample had a total concentration of 2.0–2.5 mm. The aqueous suspension was then vortexed and sonicated at about 60 °C for 30 min to obtain vesicles. All DSC results were reproducible for repeated sample preparations, and showed no significant hystereses, except for the first few heating–cooling cycles, after which the samples were in equilibrium.
XRD measurements
The XRD measurements of lipid mixtures were performed by using monochromic CuKα1 radiation (λ=0.154051 nm from a Ge(111) monochromator (Seifert X-ray/GE Inc. Freiberg) and a curved linear position-sensitive detector (range: 2θ=0–40°). Samples were prepared according to the standard procedure followed by lyophilization and rehydration to give a water content of 50 wt % for a good signal to noise ratio of the scattering patterns. The samples were transferred into glass capillaries, which were then flame-sealed. The temperature was controlled by using a high-temperature sample holder (STOE & CIE GmbH, Darmstadt). SAXS and WAXS (s=1–4.7 nm−1) data were collected in the temperature range from −35 to 80 °C. The temperature was varied stepwise (heating rates of 1 K min−1) and the sample was equilibrated for 5 min at each temperature before data acquisition with 10 min of exposure time per diffractogram. Each scattering pattern was corrected by subtracting the scattering of an empty capillary. All diffraction patterns of one temperature series were then converted into a contour diagram (intensities in grayscales).
NMR spectroscopy
Static 31P and MAS 1H NMR spectroscopy investigations were carried out on MLV preparations made by co-dissolving lipid and B12 in methanol/chloroform, drying, and subsequent rehydration by adding 50 wt % of H2O/D2O to the powder. All data were acquired on a Bruker Avance III instrument with 400 MHz 1H Larmor frequency by using a Bruker static 5 mm double-resonance probe for 31P spectra and a Bruker 4 mm MAS WVT double-resonance probe head at 5 kHz spinning frequency (if not indicated otherwise) for 1H spectra, relying in both cases on a flow of heated air for temperature regulation. Typical 90° pulse lengths were 3 μs for both 31P and 1H NMR spectra.
31P direct-polarization spectra to characterize the motion of the lipid head groups were taken with a 3 s repetition time and 1H decoupling achieved by using SPINAL64.[66] The 31P NMR chemical shift was calibrated with 85 % H3PO4 (δ=0 ppm) as an external reference. In addition, T2 relaxation time measurements were performed with a standard Hahn-echo sequence (90°x−t/2−180°y−t/2−acq) with an eight-step phase cycle and 1H decoupling over the whole sequence. The Fourier-transformed echo signals were integrated within a narrow range around the magic-angle orientation and fitted exponentially. The decoupling strength was adjusted to around 10–30 kHz nutation frequency, which represented a good compromise between sample heating at high power and additional line broadening (T2 reduction) at low power.
Quantitative 1H spectra were taken at 5 kHz MAS. Weight-controlled samples were prepared in 4 mm MAS rotors with Teflon spacers for reproducible sample positioning. The recycle delay was adjusted to a value much larger than T1 at each temperature, and the spectral intensities were corrected for the Curie temperature dependence, by multiplying them by T/Tref, and allowing for a quantitative evaluation of the integrals. The aliphatic, aromatic, and glycerol resonances of DPPC and B12 in the gel phase (20 °C) at the given spinning frequency were subject to dipolar line broadening down to the baseline level due to the well-defined packing and low mobility; this precluded their observation in sufficiently narrow integration ranges. Just above the main lipid phase transition, all resonances of pure hydrated DPPC became well resolved and quantitatively detectable, although their intensity remained lower for the mixtures. The resolved glycerol resonance of the pure DPPC preparation at Tref=50 °C served as an external intensity standard to define 100 % of the signal for each group of resonances. Notably, a significant intensity was found in sharp spinning sidebands, which were also integrated. At 75 °C and above, the Curie-corrected integrals did not change further, which indicated that all species were sufficiently mobile. The deviations of this high-temperature data from 100 % also demonstrated that the measurements were subject to systematic errors on the order of 20 %, which could be explained by baseline problems upon integration, and external calibration, for which a change of the sample in a MAS rotor could lead to setup variations, and thus, deviations in the absolute spectral intensities.
1H–1H dipole–dipole coupling constants for the adjacent aromatic CH protons were determined by DQ[57] spinning sideband analysis[58] by using the BaBa-xy16 pulse sequence[55] at 10 kHz MAS and four rotor periods recoupling. The pattern was fitted to a numerically calculated and Fourier-transformed powder average of the theoretical time domain signal by assuming a Gaussian distribution of residual dipole–dipole couplings, Dres. The standard deviation was always around 10 % of the average, which indicated weak apparent distribution effects.[67] Such effects did not necessarily arise from an actual coupling distribution, but could also be assigned to changes in the pattern shape that arose from couplings to remote protons[58c] or from a bias in the assumed isotropic powder average[57] that arose from anisotropic T2.
Acknowledgments
S.W. and B.D.L. performed and analyzed the confocal microscopy experiments; H.E. and S.P. designed and synthesized the new compounds; B.D.L. performed and analyzed the DSC and X-ray experiments; F.L., A.A. and R.B. performed and analyzed the NMR experiments; A.B., K.S., C.T. and K.B. designed the research, analyzed and interpreted data, and wrote the manuscript. We thank Gunter Reuter for use of the LSM 780. We are grateful to the Deutsche Forschungsgemeinschaft (DFG) for financial support in the framework of the Forschergruppe 1145. K.B. also acknowledges funding from ERDF (grant 1241090001) and BMBF (FKZ 03Z2HN22).
Supporting Information
As a service to our authors and readers, this journal provides supporting information supplied by the authors. Such materials are peer reviewed and may be re-organized for online delivery, but are not copy-edited or typeset. Technical support issues arising from supporting information (other than missing files) should be addressed to the authors.
miscellaneous_information
References
- 1.Doyle DA. Science. 1998;280:69–77. doi: 10.1126/science.280.5360.69. [DOI] [PubMed] [Google Scholar]
- 2.Shai Y. Biochim. Biophys. Acta Biomembr. 1999;1462:55–70. doi: 10.1016/s0005-2736(99)00200-x. [DOI] [PubMed] [Google Scholar]
- 3.Sakai N, Matile S. Langmuir. 2013;29:9031–9040. doi: 10.1021/la400716c. [DOI] [PubMed] [Google Scholar]
- 4.Brown DA, London E. J. Biol. Chem. 2000;275:17221–17224. doi: 10.1074/jbc.R000005200. [DOI] [PubMed] [Google Scholar]
- 5.Simons K, Vaz WLC. Annu. Rev. Biophys. Biomol. Struct. 2004;33:269–295. doi: 10.1146/annurev.biophys.32.110601.141803. [DOI] [PubMed] [Google Scholar]
- 6.Moran-Mirabal JM, Auberecht DM, Craighead HG. Langmuir. 2007;23:10661–10671. doi: 10.1021/la701371f. [DOI] [PubMed] [Google Scholar]
- 7.Bernchou U, Ipsen JH, Simonsen AC. J. Phys. Chem. B. 2009;113:7170–7177. doi: 10.1021/jp809989t. [DOI] [PubMed] [Google Scholar]
- 8.Simons K, Gerl MJ. Nat. Rev. Mol. Cell Biol. 2010;11:688–699. doi: 10.1038/nrm2977. [DOI] [PubMed] [Google Scholar]
- 9.de Almeida RF, Joly E. Front. Plant Sci. 2014;5:72. doi: 10.3389/fpls.2014.00072. [DOI] [PMC free article] [PubMed] [Google Scholar]
- 10.Bagatolli LA, Ipsen JH, Simonsen AC, Mouritsen OG. Prog. Lipid Res. 2010;49:378–389. doi: 10.1016/j.plipres.2010.05.001. [DOI] [PubMed] [Google Scholar]
- 11.Binder WH, Barragan V, Menger FM. Angew. Chem. Int. Ed. 2003;42:5802–5827. doi: 10.1002/anie.200300586. [DOI] [PubMed] [Google Scholar]
- Angew. Chem. 2003;115:5980–6007. [Google Scholar]
- 12.Hädicke A, Blume A. J. Colloid Interface Sci. 2013;407:327–338. doi: 10.1016/j.jcis.2013.06.041. [DOI] [PubMed] [Google Scholar]
- 13.Schulz M. Angew. Chem. Int. Ed. 2013;52:1829–1833. doi: 10.1002/anie.201204959. [DOI] [PubMed] [Google Scholar]
- Angew. Chem. 2013;125:1877–1882. [Google Scholar]
- 14.Scholtysek P, Achilles A, Hoffmann C-V, Lechner B-D, Meister A, Tschierske C, Saalwächter K, Edwards K, Blume A. J. Phys. Chem. B. 2012;116:4871–4878. doi: 10.1021/jp207996r. [DOI] [PubMed] [Google Scholar]
- 15.Fuhrhop J-H, Wang T. Chem. Rev. 2004;104:2901–2937. doi: 10.1021/cr030602b. [DOI] [PubMed] [Google Scholar]
- 16.Forbes CC, DiVittorio KM, Smith BD. J. Am. Chem. Soc. 2006;128:9211–9218. doi: 10.1021/ja0619253. [DOI] [PMC free article] [PubMed] [Google Scholar]
- 17.Aleandri S, Casnati A, Fantuzzi L, Mancini G, Rispoli G, Sansone F. Org. Biomol. Chem. 2013;11:4811. doi: 10.1039/c3ob40732b. [DOI] [PubMed] [Google Scholar]
- 18.Brownholland DP, Longo GS, Struts AV, Justice MJ, Szleifer I, Petrache HI, Brown MF, Thompson DH. Biophys. J. 2009;97:2700–2709. doi: 10.1016/j.bpj.2009.06.058. [DOI] [PMC free article] [PubMed] [Google Scholar]
- 19.Sakai N, Mareda J, Matile S. Acc. Chem. Res. 2005;38:79–87. doi: 10.1021/ar0400802. [DOI] [PubMed] [Google Scholar]
- 20.Vargas Jentzsch A, Hennig A, Mareda J, Matile S. Acc. Chem. Res. 2013;46:2791–2800. doi: 10.1021/ar400014r. [DOI] [PubMed] [Google Scholar]
- 21.Wang W, Li R, Gokel GW. Chem. Eur. J. 2009;15:10543–10553. doi: 10.1002/chem.200900898. [DOI] [PubMed] [Google Scholar]
- 22.Moszynski JM, Fyles TM. Org. Biomol. Chem. 2010;8:5139–5149. doi: 10.1039/c0ob00194e. [DOI] [PubMed] [Google Scholar]
- 23.Muraoka T, Shima T, Hamada T, Morita M, Takagi M, Kinbara K. Chem. Commun. 2011;47:194–196. doi: 10.1039/c0cc02420a. [DOI] [PubMed] [Google Scholar]
- 24.Quesada E, Acuna AU, Amat-Guerri F. Angew. Chem. Int. Ed. 2001;40:2095–2097. [PubMed] [Google Scholar]
- Angew. Chem. 2001;113:2153–2155. [Google Scholar]
- 25.Nikolaus J, Czapla S, Möllnitz K, Höfer CT, Herrmann A, Wessig P, Müller P. Biochim. Biophys. Acta Biomembr. 2011;1808:2781–2788W. doi: 10.1016/j.bbamem.2011.08.008. [DOI] [PubMed] [Google Scholar]
- 26.Hill EH, Sanchez D, Evans DG, Whitten DG. Langmuir. 2013;29:15732–15737. doi: 10.1021/la4038827. For previously reported oligo(phenylene ethynylenes) involving hydrophilic groups, see. [DOI] [PubMed] [Google Scholar]
- Bull SR, Palmer LC, Fry NJ, Greenfield MA, Messmore BW, Meade TJ, Stupp SI. J. Am. Chem. Soc. 2008;130:2742–2743. doi: 10.1021/ja710749q. [DOI] [PMC free article] [PubMed] [Google Scholar]
- Erdogan B, Wilson JN, Bunz UHF. Macromolecules. 2002;35:7863–7864. [Google Scholar]
- Phillips RL, Kim I-B, Carson BE, Tidbeck B, Bai Y, Lowary TL, Tolbert LM, Bunz UHF. Macromolecules. 2008;41:7316–7320. [Google Scholar]
- Kim I-B, Phillips R, Bunz UHF. Macromolecules. 2007;40:5290–5293. [Google Scholar]
- 27a.Kieffer P, Prehm M, Glettner B, Pelz K, Baumeister U, Liu F, Zeng X, Ungar G, Tschierske C. Chem. Commun. 2008:3861–3863. doi: 10.1039/b804945a. [DOI] [PubMed] [Google Scholar]
- 27b.Liu F, Kieffer R, Zeng X, Pelz K, Prehm M, Ungar G, Tschierske C. Nat. Commun. 2012;3:1104. doi: 10.1038/ncomms2096. [DOI] [PubMed] [Google Scholar]
- 28a.Tschierske C. Angew. Chem. Int. Ed. 2013;52:8828–8878. doi: 10.1002/anie.201300872. [DOI] [PubMed] [Google Scholar]
- Angew. Chem. 2013;125:8992–9047. [Google Scholar]
- 28b.Tschierske C, Nürnberger C, Ebert H, Glettner B, Prehm M, Liu F, Zeng X, Ungar G. Interface Focus. 2012;2:669–680. doi: 10.1098/rsfs.2011.0087. [DOI] [PMC free article] [PubMed] [Google Scholar]
- 29.Zeng XB, Kieffer R, Glettner B, Nürnberger C, Liu F, Pelz K, Prehm M, Baumeister U, Hahn H, Lang H, Gehring GA, Weber CHM, Hobbs JK, Tschierske C, Ungar G. Science. 2011;331:1302–1306. doi: 10.1126/science.1193052. [DOI] [PubMed] [Google Scholar]
- 30a.Benvegnu T, Brard M, Plusquellec D. Current Opinion in Colloid and Interface Science. 2004;8:469–479. [Google Scholar]
- 30b.Meister A, Blume A. Current Opinion in Colloid & Interface Science. 2007;12:138–147. Interface Science 2007, 12, 138–147. [Google Scholar]
- 31a.Kölbel M, Beyersdorff T, Tschierske C, Diele S, Kain J. Chem. Eur. J. 2000;6:3821–3837. doi: 10.1002/1521-3765(20001016)6:20<3821::aid-chem3821>3.0.co;2-8. [DOI] [PubMed] [Google Scholar]
- 31b.Glettner B, Liu F, Zeng X, Prehm M, Baumeister U, Walker M, Bates MA, Boesecke P, Ungar G, Tschierske C. Angew. Chem. Int. Ed. 2008;47:9063–9066. doi: 10.1002/anie.200802957. [DOI] [PubMed] [Google Scholar]
- Angew. Chem. Int. Ed. 2008;120:9203–9206. [Google Scholar]
- 32.Sonogashira K, Tohda Y, Nagihara N. Tetrahedron Lett. 1975;16:4467–4470. [Google Scholar]
- 33.Eaborn C, Thompson AR, Walton DRM. J. Chem. Soc. C. 1967:1364–1366. [Google Scholar]
- 34a.Austin WB, Bilow N, Kelleghan WJ, Lau KSY. J. Org. Chem. 1981;46:2280–2286. [Google Scholar]
- 34b.Musso DL, Clarke MJ, Kelley JL, Boswell GE, Chen G. Org. Biomol. Chem. 2003;1:498–506. doi: 10.1039/b209165h. [DOI] [PubMed] [Google Scholar]
- 35a.Vahlenkamp T, Wegner G. Makromol. Chem. Phys. 1994;195:1933–1952. [Google Scholar]
- 35b.Fkyerat A, Dibin G-M, Tabacchi R. Helv. Chim. Acta. 1999;82:1418–1422. [Google Scholar]
- 36.Sterzycki R. Synthesis. 1979:724–725. [Google Scholar]
- 37.Mitzel F, Fitzgerald S. Chem. Eur. J. 2003;9:1233–1241. doi: 10.1002/chem.200390140. [DOI] [PubMed] [Google Scholar]
- 38a.Moore JS, Weinstein EJ, Wu Z. Tetrahedron Lett. 1991;32:2465–2466. [Google Scholar]
- 38b.Lavastre O, Laurence O, Dixneuf PH. Tetrahedron. 1996;52:5495–5504. [Google Scholar]
- 39a.Nelson TD, Crouch RD. Synthesis. 1996:1031–1069. [Google Scholar]
- 39b.Cheng J, Hacksell U, Daves GD. J. Org. Chem. 1986;51:3093–3098. [Google Scholar]
- 40.Saha A, Ramakrishnan S. Macromolecules. 2009;42:4956–4959. [Google Scholar]
- 41.Korlach J, Schwille P, Webb WW, Feigenson GW. Proc. Natl. Acad. Sci. USA. 1999;96:8461–8466. doi: 10.1073/pnas.96.15.8461. [DOI] [PMC free article] [PubMed] [Google Scholar]
- 42.Bacia K, Schwille P, Kurzchalia T. Proc. Natl. Acad. Sci. USA. 2005;102:3272–3277. doi: 10.1073/pnas.0408215102. [DOI] [PMC free article] [PubMed] [Google Scholar]
- 43.Rodriguez N, Pincet F, Cribier S. Colloids Surf. B. 2005;42:125–130. doi: 10.1016/j.colsurfb.2005.01.010. [DOI] [PubMed] [Google Scholar]
- 44.Schulz M, Glatte D, Meister A, Scholtysek P, Kerth A, Blume A, Bacia K, Binder WH. Soft Matter. 2011;7:8100–8110. [Google Scholar]
- 45.Veatch SL, Keller SL. Biophys. J. 2003;84:725–726. doi: 10.1016/S0006-3495(03)74891-7. [DOI] [PMC free article] [PubMed] [Google Scholar]
- 46.Liu XY. Nanoscale structure and assembly at solid-fluid interfaces, Vol. 1. In: Yang Liu Xiang, De Yoreo James J., editors. From solid-fluid interfacial structure to nucleation kinetics: principles and strategies for micro/nanostructure engineering. Kluwer Academics Publishers; 2004. ISBN 1 4020 7792 0. [Google Scholar]
- 47.Yguerabide J, Stryer L. Proc. Natl. Acad. Sci. USA. 1971;68:1217–1221. doi: 10.1073/pnas.68.6.1217. [DOI] [PMC free article] [PubMed] [Google Scholar]
- 48.Axelrod D. Biophys. J. 1979;26:557–574. doi: 10.1016/S0006-3495(79)85271-6. [DOI] [PMC free article] [PubMed] [Google Scholar]
- 49.Gullapalli RR, Demirel MC, Butler PJ. Phys. Chem. Chem. Phys. 2008;10:3548–3560. doi: 10.1039/b716979e. [DOI] [PMC free article] [PubMed] [Google Scholar]
- 50.Nagle JF, Tristram-Nagle S. Biochim. Biophys. Acta Rev. Biomembr. 2000;1469:159–195. doi: 10.1016/s0304-4157(00)00016-2. [DOI] [PMC free article] [PubMed] [Google Scholar]
- 51.Lechner B-D, Ebert H, Prehm M, Werner S, Meister A, Hause G, Beerlink A, Saalwächter K, Bacia K, Tschierske C, Blume A. Langmuir. 2015;31:2839–2850. doi: 10.1021/la504903d. [DOI] [PubMed] [Google Scholar]
- 52.Förster G, Meister A, Blume A. Current Opinion in Colloid & Interface Science. 2001;6:294–302. Interface Science 2001, 6, 294–302. [Google Scholar]
- 53.Seelig J. Biochim. Biophys. Acta Rev. Biomembr. 1978;515:105–140. doi: 10.1016/0304-4157(78)90001-1. [DOI] [PubMed] [Google Scholar]
- 54.Dufourc EJ, Mayer C, Stohrer J, Althoff G, Kothe G. Biophys. J. 1992;61:42–57. doi: 10.1016/S0006-3495(92)81814-3. [DOI] [PMC free article] [PubMed] [Google Scholar]
- 55a.Saalwächter K, Lange F, Matyjaszewski K, Huang C-F, Graf R. J. Magn. Reson. 2011;212:204–215. doi: 10.1016/j.jmr.2011.07.001. [DOI] [PubMed] [Google Scholar]
- 55b.Feike M, Demco DE, Graf R, Gottwald J, Hafner S, Spiess HW. J. Magn. Reson. Ser. A. 1996;122:214–221. [Google Scholar]
- 56.Reichert D, Saalwächter K. In: NMR Crystallography (Encyc. Magn. Reson.) Harris RK, Wasylichen RE, Duer MJ, editors. Chichester: Wiley; 2009. pp. 177–193. [Google Scholar]
- 57.Saalwächter K. ChemPhysChem. 2013;14:3000–3014. doi: 10.1002/cphc.201300254. [DOI] [PubMed] [Google Scholar]
- 58a.Graf R, Demco DE, Gottwald J, Hafner S, Spiess HW. J. Chem. Phys. 1997;106:885–895. [Google Scholar]
- 58b.Schnell I, Brown SP, Low HY, Ishida H, Spiess HW. J. Am. Chem. Soc. 1998;120:11784–11795. [Google Scholar]
- 58c.Schnell I, Spiess HW. J. Magn. Reson. 2001;151:153–227. doi: 10.1006/jmre.2001.2336. [DOI] [PubMed] [Google Scholar]
- 59.Fischbach I, Pakula T, Minkin P, Fechtenkötter A, Müllen K, Spiess HW, Saalwächter K. J. Phys. Chem. B. 2002;106:6408–6418. [Google Scholar]
- 60.Rudolph T, Allampally NK, Fernandez G, Schacher FH. Chem. Eur. J. 2014;20:13871–13875. doi: 10.1002/chem.201404141. [DOI] [PubMed] [Google Scholar]
- 61a.Chen B, Zeng X, Baumeister U, Ungar G, Tschierske C. Science. 2005;307:96–99. doi: 10.1126/science.1105612. [DOI] [PubMed] [Google Scholar]
- 61b.Tschierske C. Chem. Soc. Rev. 2007;36:1930–1970. doi: 10.1039/b615517k. [DOI] [PubMed] [Google Scholar]
- 62a.Chen B, Zeng X, Baumeister U, Diele S, Ungar G, Tschierske C. Angew. Chem. Int. Ed. 2004;43:4621–4625. doi: 10.1002/anie.200460762. [DOI] [PubMed] [Google Scholar]
- Angew. Chem. 2004;116:4721–4725. [Google Scholar]
- 62b.Chen B, Baumeister U, Pelzl G, Das MK, Zeng X, Ungar G, Tschierske C. J. Am. Chem. Soc. 2005;127:16578–16591. doi: 10.1021/ja0535357. [DOI] [PubMed] [Google Scholar]
- 63.Rasmussen S, Bedau MA, Chen L, Deamer D, Krakauer DC, Packard NH, Stadler PF. Protocells: Bridging Nonliving and Living Matter. Cambridge, MA: MIT Press; 2009. [Google Scholar]
- 64.Angelova MI, Dimitrov DS. Faraday Discuss. Chem. Soc. 1986;81:303–311. [Google Scholar]
- 65.Plotnikov VV, Brandts JM, Lin LN, Brandts JF. Anal. Biochem. 1997;250:237–244. doi: 10.1006/abio.1997.2236. [DOI] [PubMed] [Google Scholar]
- 66.Fung BM, Khitrin AK, Ermolaev K. J. Magn. Reson. 2000;142:97–101. doi: 10.1006/jmre.1999.1896. [DOI] [PubMed] [Google Scholar]
- 67a.Brown SP, Schnell I, Brand JD, Müllen K, Spiess HW. J. Mol. Struct. 2000;521:179–195. [Google Scholar]
- 67b.Holland GP, Cherry BR, Alam TM. J. Magn. Reson. 2004;167:161–167. doi: 10.1016/j.jmr.2003.12.008. [DOI] [PubMed] [Google Scholar]
Associated Data
This section collects any data citations, data availability statements, or supplementary materials included in this article.
Supplementary Materials
miscellaneous_information


