Abstract
This is the third article covering core knowledge in scholarly activities for neonatal physicians. In this article, we discuss various principles of epidemiology and clinical research design. A basic knowledge of these principles is necessary for conducting clinical research and for proper interpretation of studies. This article reviews bias and confounding, causation, incidence and prevalence, decision analysis, cost-effectiveness, sensitivity analysis, and measurement.
Introduction
This article provides a brief overview of the principles of epidemiology and clinical research design and covers all the topics required by the American Board of Pediatrics content outline (and uses the same alphabetical numbering in the content outline). The reader is referred to other review books listed in the Reference section for a complete understanding of study types and epidemiology. (1)(2)(3)(4)(5)(6)(7) A major role of epidemiology is to elucidate the causal pathways that link exposures and risk of illness so that preventive measures can be developed. The principles of epidemiology are important in developing strategies and studies aimed at reducing neonatal mortality and improving outcomes.
Bias and Confounding
Study Example
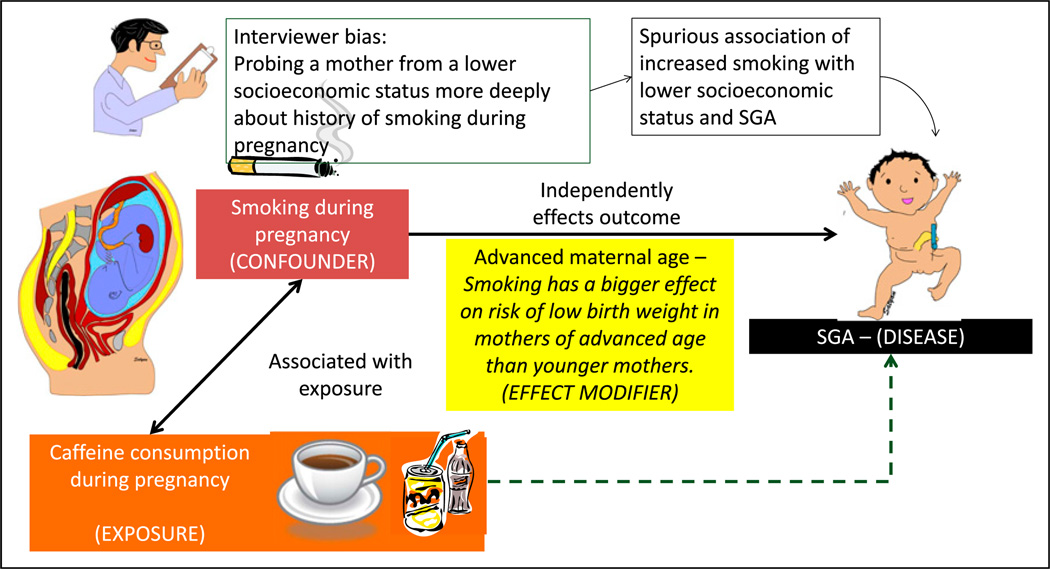
One hundred mothers were seen at the clinic at Women and Children’s Hospital of Buffalo in 2013. A study evaluating the association between maternal caffeine consumption during pregnancy and the incidence of small for gestation (SGA) birth was planned (Figure 1).
Figure 1.
Bias, confounders, and effect modifiers. The association with caffeine consumption during pregnancy and fetal growth restriction is being evaluated. If we assume that smoking is associated with increased caffeine consumption during pregnancy and that smoking is directly associated with fetal growth restriction and small for gestational age (SGA) status, the observed association between caffeine consumption and SGA status may be positively influenced by maternal smoking. In this example, caffeine consumption is the exposure and SGA status is the outcome; smoking is the confounder. The association between maternal smoking during pregnancy and fetal growth restriction is evaluated. The interviewer is biased that mothers of lower socioeconomic status smoke more frequently during pregnancy. The researcher may probe lower socioeconomic mothers more deeply and elicit a history of smoking, leading to a spurious association of economic status, smoking, and SGA. This bias is a systematic error and is not overcome by increasing sample size. It can be prevented by blinding (masking) or educating the interviewer. Smoking has a bigger effect on risk of SGA offspring in mothers of advanced age compared with younger mothers. Advanced maternal age is an effect modifier.
The goals of many research studies are to evaluate the association between an exposure (eg, maternal caffeine intake) and an outcome (eg, SGA birth) and to identify the factors that may modify the exposure’s effect on the outcome. Factors related to measurement, study design, and implementation can lead to misleading conclusions about this association. These considerations include bias, confounding, and effect modification.
a. Bias and Validity of Results
Bias is a systematic (nonrandom) deviation or error from the underlying truth (measurement or estimated association) due to limitations in study design and execution. Sources of bias may include errors in definitions, study design, patient recruitment, data collection, data analysis, interpretation, and publication. Bias can result in a mistaken estimate of an exposure’s effect on the risk of disease. Some examples of different sources of bias are as follows:
Interviewer bias: The interviewer may probe more deeply regarding smoking history if the mother is from a lower socioeconomic background, leading to increased recording of smoking habits in women with a lower socioeconomic status compared with women with a higher socioeconomic status (Figure 1).
Publication bias: Only studies with a positive outcome (linking caffeine consumption to SGA or a therapeutic intervention with cure) are published, leading to an overrepresentation of studies with positive links and/or beneficial outcomes
Recall bias: Such bias may be a considerable issue in retrospective study designs, such as a case-control study. Individuals in a case-control study who have the disease (outcome, such as SGA) may recall the exposure (caffeine consumption or smoking) more reliably than individuals who do not have the disease.
Selection bias: If patients are selected from a clinic primarily serving an inner-city population, the results may not be representative of the general population. The results of the study may not be generalizable.
Social desirability bias: Mothers may answer according to social norms or desirable behavior rather than what is actually the case (eg, underreport smoking or alcohol consumption).
b. Common Strategies in Study Design to Reduce or Avoid Bias
Some degree of bias is almost always present in published studies; readers must consider the effect of bias on the conclusions of the study. Bias can produce a type I (observing a difference when there is none) or a type II (failing to observe a difference when there is one) error, although often the focus is on type I error due to bias. Increasing the sample size has no effect on systematic error (as opposed to random error, where increasing the sample size decreases the effect of random error). The best way to improve validity of the results is to design the study such that various biases are reduced as much as possible. Standardizing the measurement methods, training and certifying observers, refining and automating the instruments, blinding and rigorous efforts to obtain complete data, and keeping the nonresponse rate to a minimum are examples of commonly used methods to decrease bias.
c. Confounders and Validity
Confounding occurs when the association between an exposure (consumption of coffee during pregnancy) and an outcome (SGA at birth) occurs due to a third variable (maternal smoking) called the confounder or a confounding variable (Figure 1). (8) Positive confounding (observed association is away from the null) and negative confounding (observed association is toward the null) can occur. The confounder must be associated with the predictor of interest (ie, smoking during pregnancy is more common among coffee or caffeine drink consumers) (9) and also be a cause of the outcome (smoking can independently cause fetal growth restriction). (10)
A confounding variable (smoking during pregnancy) is a risk factor for the disease (SGA) independent of the exposure (caffeine consumption during pregnancy), is associated with the exposure, and is not in the causal pathway between exposure and disease. If a potential confounder is known and can be measured, the analysis will require either a statistical adjustment for the con-founder or subgroup stratification (see below).
d. Common Strategies to Cope, Avoid, or Reduce Confounding
Various strategies to cope with confounders can be implemented during the design phase (specification and matching) or during the analysis phase (stratification, statistical adjustment, and use of propensity scores).
-
(i)
Specification is a design strategy that specifies the value of a potential confounder for inclusion or exclusion criteria. In example 1, all smoking pregnant mothers may be excluded from the study. However, such a strategy will prevent us from evaluating a potential additive or synergistic effect between caffeine consumption and maternal smoking on fetal growth restriction.
-
(ii)
Matching for the confounding variable can prevent confounding. Each smoker is matched with a nonsmoking mother who consumed caffeine during pregnancy. Each smoking mother who is not consuming caffeine is matched with a nonsmoking mother who does not consume caffeinated drinks.
-
(iii)
Stratification segregates individuals into subgroups (strata) by analyzing infants exposed to maternal smoking as a separate subgroup; the confounding effect of smoking can be removed.
-
(iv)
Confounding can also be reduced by using statistical techniques to adjust for confounders and by assigning propensity scores to study participants.
e. Effect Modification
The effect of exposure on disease is modified, depending on the value of a third variable known as the effect modifier. The magnitude of the effect is different for different groups of individuals (eg, blacks vs whites, males vs females, young vs old). For example, smoking during pregnancy is associated with increased risk of low birth weight in the offspring. Smoking has a bigger effect on the risk of low birth weight in older mothers than younger mothers. In this example, maternal age is an effect modifier of maternal smoking on birth weight (Figure 1).
Causation
Causation refers to a cause-effect relationship between the exposure and the outcome.
a. Difference Between Association and Causation
Association is a quantifiable relationship between an exposure and an outcome. For example, a systematic review has found that breastfed infants are less likely to have asthma. (11) Just because the incidence of asthma is less in breastfed infants, a causal relationship cannot be assumed. (12) One explanation may be that breastfed infants are more likely to be from a better socioeconomic background, have better living conditions, and have less exposure to triggers of asthma and less daycare attendance. An association between an exposure and an outcome does not necessarily imply a causal relationship because the association may be observed due to a confounding variable.
b. Factors That Strengthen Causal Inference in Observational Studies
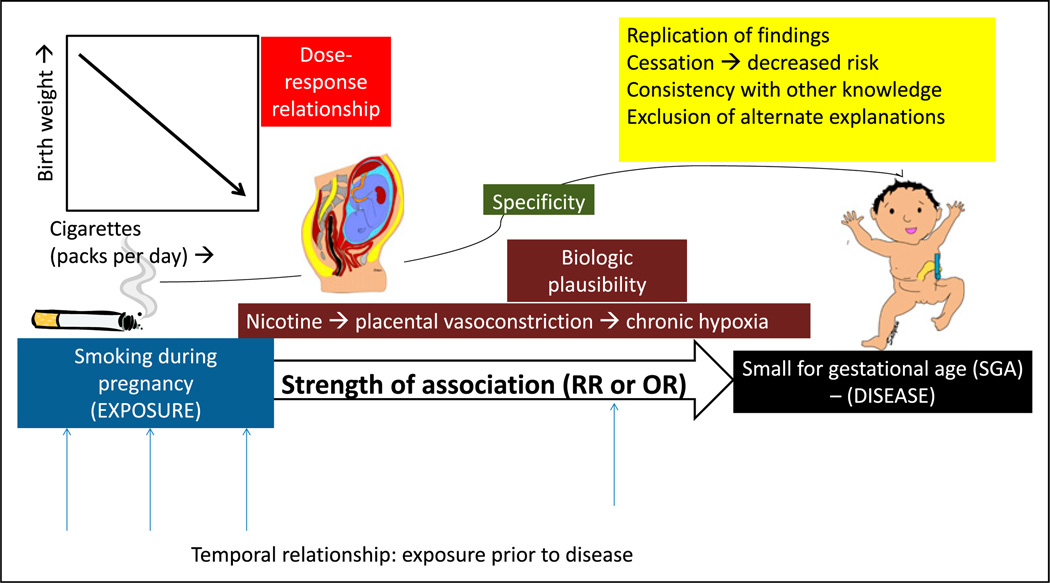
In his classic essay entitled “The Environment and Disease: Association or Causation,” the British epidemiologist Sir Austin Bradford Hill described the criteria for causation (Hill’s criteria for causation). (13) These criteria were also explored by the expert committee appointed by the US surgeon general to better define the relationship between smoking and lung cancer, who proposed a set of guidelines to establish causation based on epidemiologic observations and observational studies (Figure 2). These guidelines include the following:
Figure 2.
Causal association. The association between maternal smoking during pregnancy and small for gestational age (SGA) offspring is more likely to be causal if there is a temporal relationship between exposure and outcome or disease; high strength of association as measured by relative risk (RR) or odds ratio (OR); specific 1:1 association between smoking and SGA; dose-response relationship (decreasing birth weight with increased cigarette smoking per day; biologic plausibility (nicotine can lead to placental vasoconstriction and chronic fetal hypoxia leading to growth restriction); replication of findings in different populations and different studies; cessation of exposure (the risk of disease decreases with decreasing or removing the exposure); consistency with other knowledge (association found in different subgroups, for example, men and women); and finally exclusion of alternate explanations.
-
(i)
Temporal relationship: Exposure occurs before the occurrence of disease (outcome); this relationship is best established in a prospective cohort study. The latency period between exposure and outcome can also be defined and may range from a few hours for infectious origins to several decades for mesothelioma from asbestos exposure.
-
(ii)
Strength of the association: This is measured by relative risk or odds ratio. The stronger the association, the more likely a causal relationship exists. However, causality cannot be excluded based on a weak association.
-
(iii)
Specificity of the association: A specific exposure is associated with only one disease (the absence of specificity does not exclude a causal relationship).
-
(iv)
Dose-response relationship: Increasing dose of exposure leads to increasing risk of disease (the absence of a dose-response relationship does not exclude causality).
-
(v)
Biologic plausibility: This requires agreement with the body of biologic knowledge (the cause-effect relationship can be explained based on biologic findings).
-
(vi)
Replication of findings: Replication in different populations and different studies.
-
(vii)
Cessation of exposure: The risk of disease decreases with decreasing or removing the exposure.
-
(viii)
Consistency with other knowledge: Association is found in different subgroups, for example, men and women.
-
(ix)
Consideration of alternate explanations: If alternate explanations are excluded, likelihood of causation increases.
Not all criteria have to be met in every instance. It is the totality of evidence that may suggest causation rather than mere association. Causal association is a judgment based on available information; this is subject to change with availability of new information, which may confirm or refute the prevailing understanding of the relationship between exposure and disease.
Incidence and Prevalence
a. Incidence
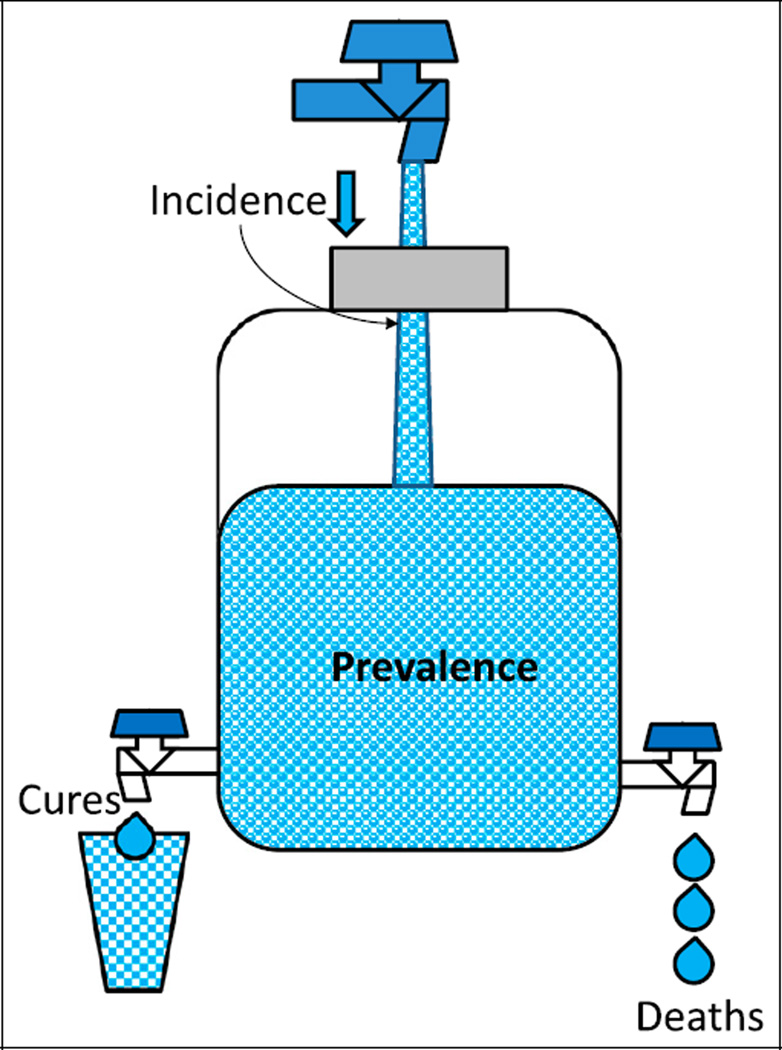
The incidence rate of a disease is defined as the number of new cases of a disease that occur during a specified period in a population at risk for developing the disease (Figure 3).
Figure 3.
The relationship between incidence and prevalence. The water content of a jug is similar to the prevalence of a disease (affected individuals in a population at a given time). Prevalence can be increased by increasing incidence (new cases during a period or increasing flow from the inlet) or by decreasing deaths and cures (outflow of water). Improving health care can decrease prevalence by decreasing incidence and increasing cures. Improved health care may also lead to better control of disease (such as diabetes or cystic fibrosis), reduce mortality, and increase prevalence.
The incidence rate per 1,000 is calculated as the number of new cases of a disease occurring in the population during a specified time multiplied by 1,000, divided by the number of individuals who are at risk of developing the disease during that time.
The incidence rate is a measure of risk. For example, the incidence of myocardial infarction is 35 per 1,000 person-years in middle-aged men, about twice the rate (17 per 1,000 person-years) in middle-aged women. (5)
b. Prevalence
Prevalence is defined as the number of affected individuals present in the population at a specific time divided by the number of individuals in a population at a given time.
Prevalence per 1,000 is calculated as the number of cases of a disease present in the population at a specified time times 1,000 divided by the number of individuals in the population at that specified time.
For example, prevalence of systemic lupus erythematosus among pregnant women refers to the proportion of pregnant women who have SLE at a specific point of time (eg, on January 1, 2014).
Figure 3 shows the association between incidence and prevalence. Prevalence can be increased by the addition of new cases (increasing incidence). Effective treatment can cure the disease and decrease prevalence. If many patients die of the disease, the prevalence will decrease. Implementation of effective treatment strategies may increase life expectancy and can also increase prevalence. The prevalence of cystic fibrosis in a population increases if better management increases the life span of patients.
Screening
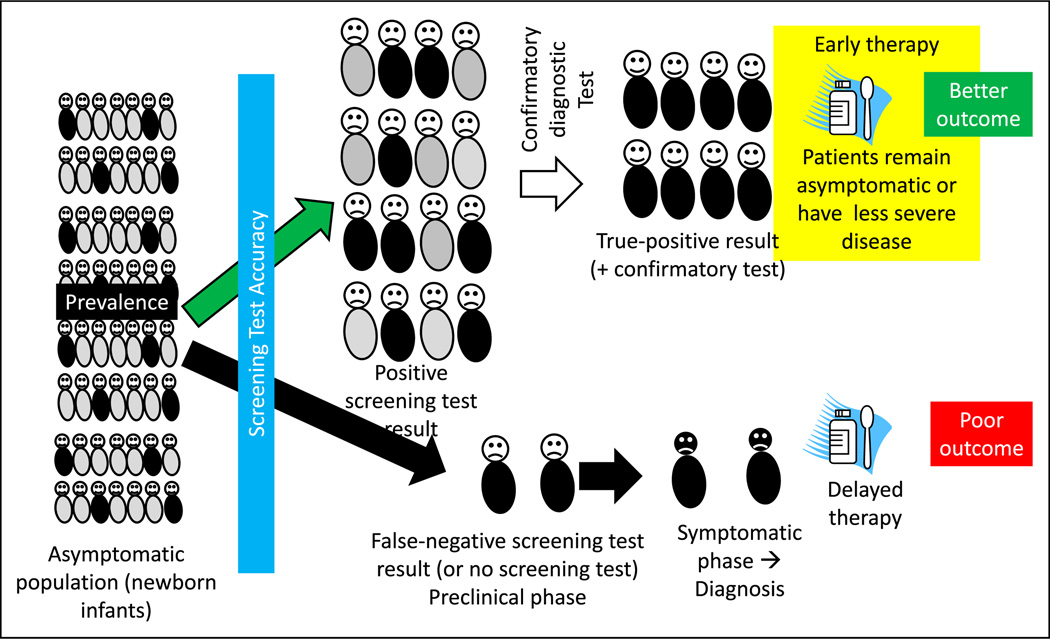
Screening refers to the application of a medical procedure or test to people who have no symptoms of the disease for the purpose of determining the likelihood of having the disease or detecting the disease in a preclinical phase. The screening test does not confirm the diagnosis of the illness. Those who have a positive result from the screening test will need further evaluation (Figures 4, 5, and 6).
Figure 4.
The rationale for and factors that influence a screening test. A screening test, such as newborn screening for hypothyroidism, is administered to asymptomatic infants after birth before discharge from the hospital. The screening test result is positive in some infants (true-positive results shown as neonates with black trunks and false-positive results as neonates with gray trunks). The screening test may also miss a few infants with hypothyroidism (false-negative results). A confirmatory diagnostic test is performed in infants with a positive screen result. Once the diagnosis is confirmed, early intervention before the onset of symptoms typically leads to better outcome. False-negative screening test results will cause some patients to be missed. These patients later become symptomatic, leading to a specific diagnosis and delayed therapy. Factors that influence a screening test include prevalence of the disease, accuracy of the screening test, risk-benefit ratio (Figure 6), and duration of the presymptomatic phase.
Figure 5.
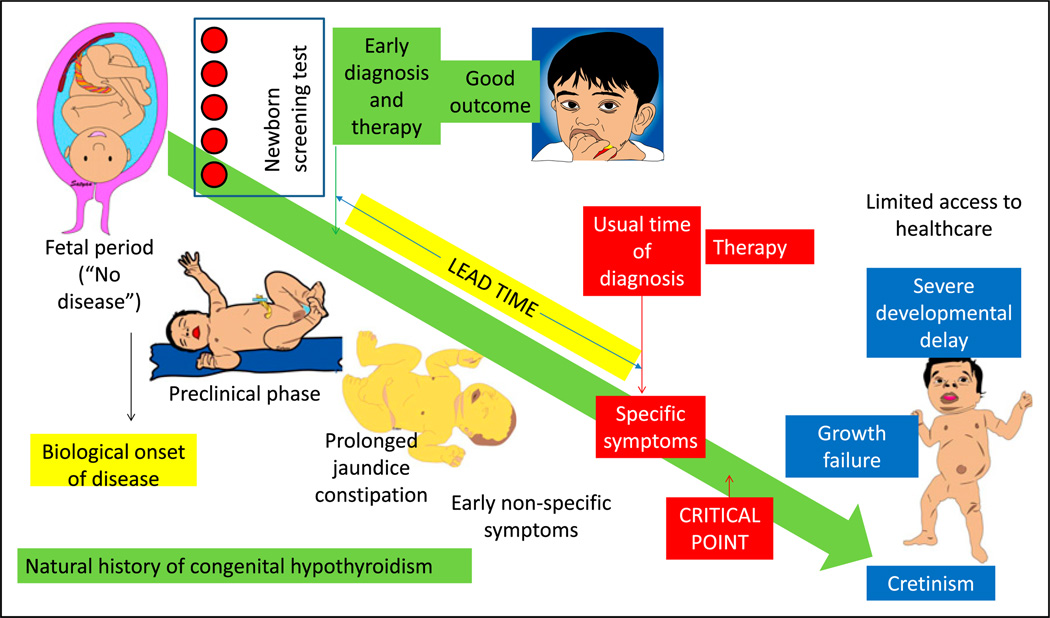
Natural history of the disease and influence of screening and early treatment on outcome. Before the availability of specific therapy (and in health care shortage areas), congenital hypothyroidism if left untreated leads to growth failure and severe developmental delay (cretinism). Newborn screen using blood spots can diagnose the disease in the presymptomatic or preclinical phase, leading to early diagnosis and therapy in the neonatal period. In the absence of a screening test, patients with hypothyroidism can present with nonspecific symptoms, such as prolonged hyperbilirubinemia and constipation. Eventually, with the onset of specific symptoms, diagnosis is suspected, confirmatory tests are performed, and therapy is initiated. The difference between the time of early diagnosis and therapy with screening and the usual time of diagnosis and treatment is called the lead time. Diagnosis and therapy before a critical point in the natural history of the disease are more effective compared with delayed therapy.
Figure 6.
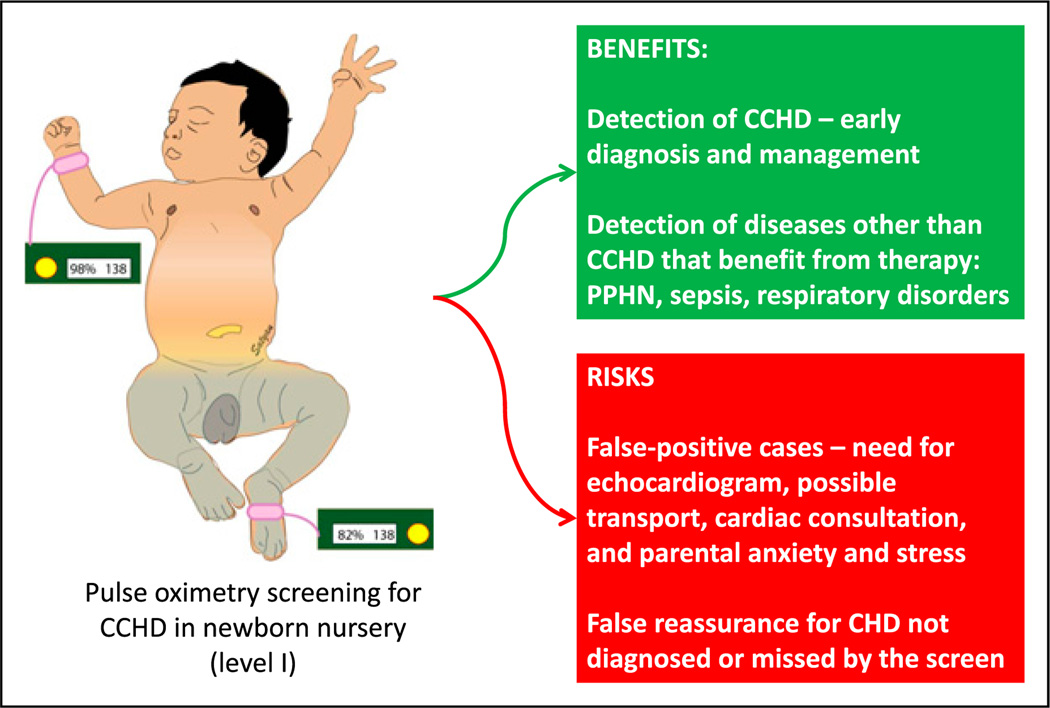
Benefits and risks of pulse oximetry screening for critical congenital heart disease (CCHD) for asymptomatic neonates in a newborn nursery.
CHD = congential heart disease; PPHN = persistent pulmonary hypertension of the newborn.
a. Rationale for Screening
The goal of screening is to reduce morbidity or mortality from the disease by detecting it at an earlier stage, when treatment is more successful. Detecting hypothyroidism by newborn screening reduces the risk of developmental delay if therapy with thyroxine is implemented in the newborn period (Figure 5). The rationale for implementing a screening test for a condition or disease depends on the following factors.
-
(i)
Prevalence: The prevalence of the detectable preclinical phase of the disease has to be reasonably high among the population screened. If screening is implemented for an extremely rare disease or condition, the risk of false-positive results will be high. A screening program for a more common disease is likely to be more cost-effective. However, if a rare disease has very serious long-term consequences (such as phenylketonuria), a screening test may still be beneficial. Hence, the disease burden may represent increased prevalence or very serious consequences of delayed detection and treatment.
-
(ii)
Accuracy: The accuracy of a test is its ability to detect true disease and to distinguish between who has a disease and who does not. The sensitivity of the test is defined as the ability of the test to identify correctly those who have the disease. The specificity of a test is defined as the ability to identify correctly those who do not have the disease. A screening test should ideally be highly sensitive (and not miss any cases, ie, false negative) and reasonably specific (to prevent too many individuals from being screened as false positive and therefore requiring additional diagnostic workup) (Figure 4).
-
(iii)
Risk-benefit: Screening for critical congenital heart disease (CCHD) by preductal and postductal pulse oximetry is being implemented in many states (Figure 6). This is a cost-effective test, resulting in early diagnosis of CCHD. In addition, conditions such as sepsis, persistent pulmonary hypertension of the newborn, or respiratory disorders associated with mild hypoxemia may be detected, resulting in early therapy, such as initiation of antibiotic treatment. The risks of the screen may include anxiety and stress secondary to false-positive results. A false-positive CCHD screen result may result in a transfer to a tertiary care facility for a pediatric cardiology consultation. In addition, practitioners, patients, and parents may experience a false sense of security when they are informed that the infant has passed the “heart disease screen.” This may potentially delay the diagnosis of conditions (such as coarctation of aorta) that may be missed by this screening test. (14)(15) (16)(17)(18) Other risks inherent to the screening test itself, such as radiation with plain radiography or computed tomography (for detecting lung cancer), should also be considered.
-
(iv)
Presymptomatic state: The onset of symptoms marks an important point in the natural history of a disease. Primary prevention refers to preventing development of the disease by reducing exposure to disease-causing agents (intrapartum antibiotic prophylaxis to reduce group B streptococcal disease) or by modifying behavior (eg, smoking and exercise) or immunization. Secondary prevention refers to detection of the disease during the preclinical or presymptomatic phase. Many forms of screening (eg, hypothyroidism and galactosemia) in the newborn period are forms of secondary prevention. When a disease is detected by screening, the time of diagnosis is advanced to an earlier point in the natural history of the disease (Figures 4 and 5). The lead time is defined as the interval by which the time of diagnosis is advanced by screening and early detection (Figure 5). Once the patient becomes symptomatic, the natural history of the disease continues to progress to a critical point beyond which the treatment is less effective or more difficult to administer. In an infant with coarctation of aorta, for example, detection at the time of newborn discharge due to absent femoral pulses has a better prognosis than an infant arriving to the emergency department in shock and severe metabolic acidosis. Similarly, with congenital hypothyroidism, delayed treatment after the onset of specific signs and symptoms (Figure 5) may be associated with significant developmental delay and growth failure.
Decision Analysis
Decision analysis is an explicit, quantitative, and systematic approach to decision-making under conditions of uncertainty. For example, it is not clear whether screening siblings of patients diagnosed as having febrile urinary tract infections (fUTIs) for vesicoureteral reflux (VUR) by voiding cystourethrography (VCUG) is beneficial.
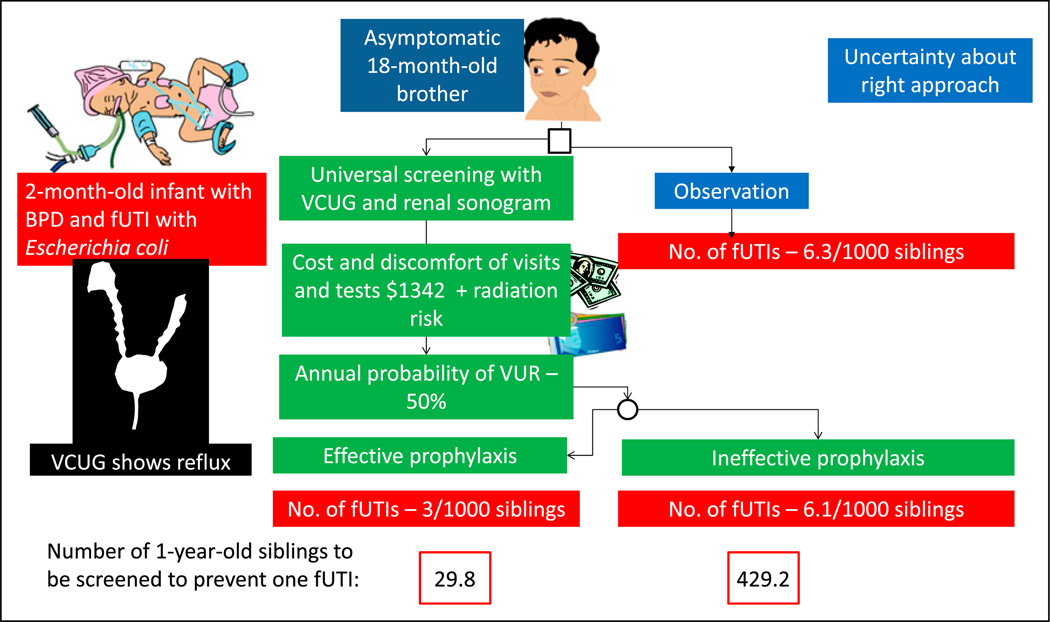
A 2-month-old male infant born at 27 weeks’ gestation with bronchopulmonary dysplasia (BPD) developed a fever (Figure 7). His urine culture yielded more than 100,000 colonies of Escherichia coli. Renal ultrasonography revealed pelvicalyceal dilation in the right kidney. VCUG revealed a grade IV VUR on the right side and a grade II VUR on the left side. This index very low-birth-weight (VLBW) infant has one elder brother aged 18 months. This brother never had an fUTI. Should he be investigated for possible VUR?
Figure 7.
Factors to be considered when uncertainty exists regarding approach to a problem using decision analysis. A 2-month-old infant born prematurely with febrile urinary tract infection (fUTI) is diagnosed as having vesicoureteral reflux (VUR). A decision is needed on appropriate approach to his 18-month-old asymptomatic brother based on available evidence. (19)
BPD = bronchopulmonary dysplasia; VCUG = voiding cystourethrography.
The prevalence of VUR in a sibling of a patient with VUR is 27%. However, because the brother is only 1 year old, the probability of VUR is higher (approximately 50%). (19) The decision analysis approach shown in Figure 7 provides a formal, transparent, and orderly analytic approach to assist in decisionmaking by parents and practitioners. On the basis of these numbers, a decision may be made regarding whether this 18-month-old sibling should undergo screening at the pediatrician’s office and be scheduled for a VCUG and renal sonogram.
a. Strengths of Decision Analysis
Decision analysis may be used when randomized clinical trials (RCTs) do not sufficiently capture data needed to support pharmacoeconomic decision-making. Decision analysis may also be useful while examining institution-specific results to identify optimal strategies based on value (choosing optimal antibiotic for fUTI prophylaxis based on local sensitivity patterns for E coli). The strengths of decision analysis include the following:
Inexpensive (compared with additional RCTs)
Timely
Ethical
Can synthesize current state of knowledge
b. Limitations of Decision Analysis
A decision analysis is only as robust as underlying model structure and available data (from previous observational studies and RCTs).
If the decision tree is potentially complex, it may be difficult for day to day use by a clinician.
Data from multiple RCTs and observational studies may be combined and the interpretation may require assumptions to be made.
There is the potential for bias with discretionary nature of methods and data selection.
Cost Benefit, Cost-Effectiveness, and Outcomes
Economic evaluation of health care interventions serves as a tool to inform decision makers and practitioners of the cost-effectiveness of different management strategies. Economic evaluations can be performed from the perspective of the patient, practitioner, payer, or society. Commonly used methods in economic evaluation include cost-effectiveness analysis (CEA), cost-utility analysis (CUA), and cost-benefit analysis (CBA). Other methods less commonly used include cost-minimization analysis and cost-consequence analysis.
a. Cost-Effectiveness Analysis
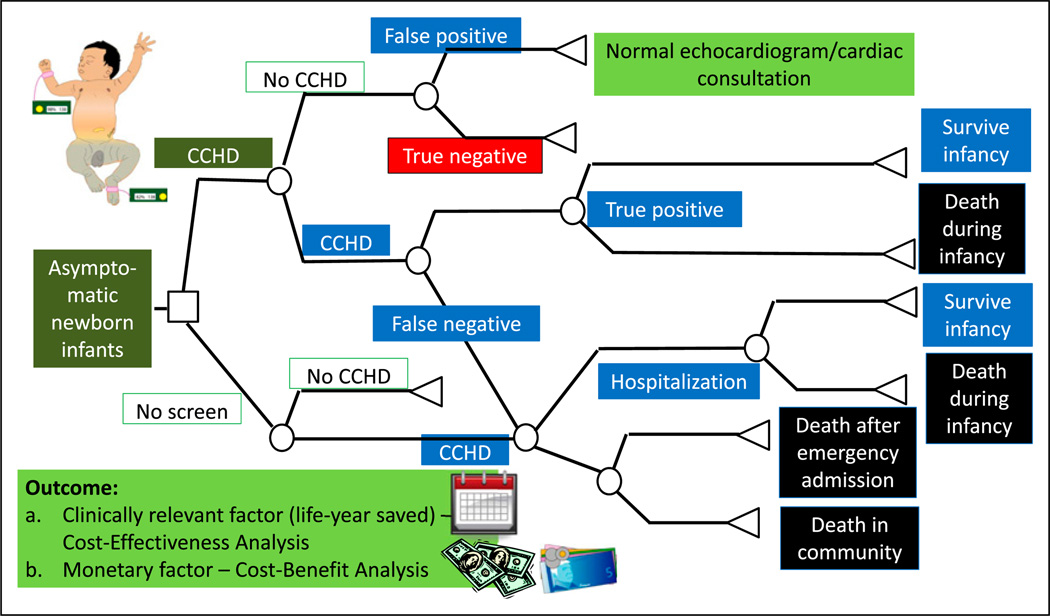
CEA is a widely used method that uses natural units of effect as the outcome measure. CEA helps explain the relationship between the cost of an intervention and the outcome. In its simplest form, CEA is performed comparing the standard therapy (no CCHD screen) with a new therapy or intervention (CCHD screen) (Figure 8). However, 3 or more options can also be compared simultaneously. Costs include the costs of the entire pathway of patient management, including costs of diagnostic tests (performing the CCHD screen, cardiology consultation, and echocardiogram), therapeutic options (medical, interventional catheterization, and surgical therapy), and hospitalization. The outcome is usually a clinically relevant outcome such as per life saved or per case of bleeding prevented. CEA helps explain the relationship between the cost of an intervention and a particular outcome.
Figure 8.
A simplified cohort state transition model for critical congenital heart disease (CCHD) screening in asymptomatic newborn infants. (18) These models are typically created using TreeAge Pro (Williamstown, MA) or Microsoft Excel (Redmond, WA) software. By convention, the following nodes are built into a decision tree. A square depicts a decision node, a circle depicts an event node, and a triangle is a terminal node (often indicating a disability, utility, or an outcome). The output of a cost analysis is a clinically relevant factor (such as life-year saved) in a cost-effectiveness analysis. In a cost-benefit analysis, the output is usually a monetary factor.
b. Quality-Adjusted Life-Years
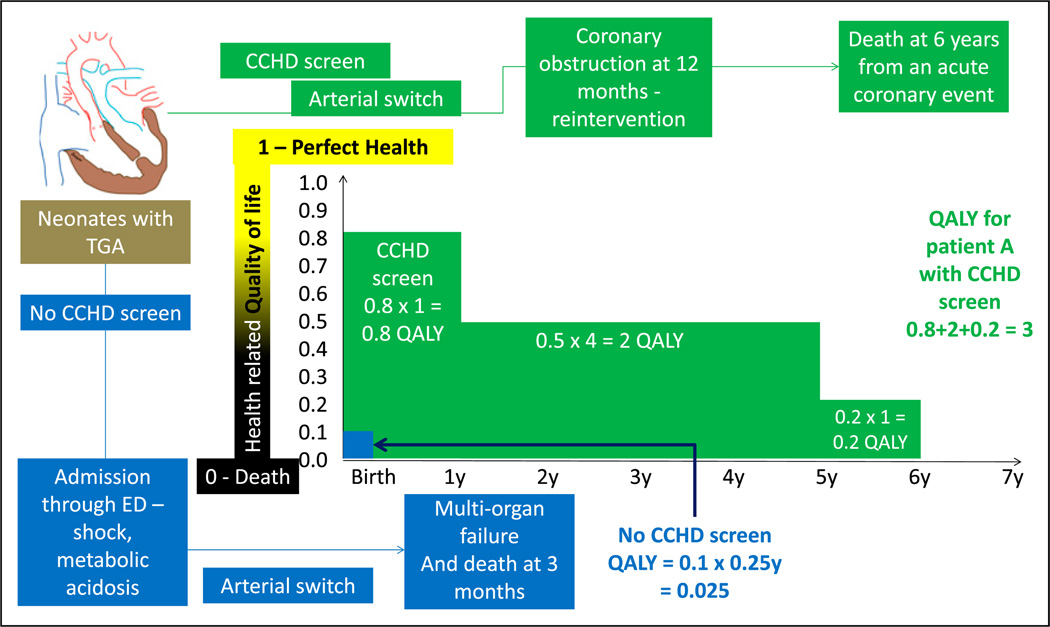
CUA is a type of CEA in which the consequences are expressed in quality-adjusted life-years (QALYs). This allows for comparison of cost-effectiveness of interventions across specialties. QALY is a measure of the participant’s health utility; this metric tries to combine improvement in the quality and quantity (improved survival) of life as a result of the new intervention. Health utility is based on the quality of life at a given point. It ranges from 0 to 1 (with 0 being death and 1 being perfect health). Health utility is a 1-dimensional measurement that measures the quality of health at a given point in time, whereas QALY is a 2-dimensional measurement that includes health utility measured over time. The gain in life expectancy is multiplied by the health utility to obtain QALY (Figure 9). A QALY of 10, for example, indicates 10 years at perfect health or 20 years with a utility of 0.5 (50%).
Figure 9.
Quality-adjusted life-years (QALYs). Health-related quality of life is rated from 0 (death) to 1 (perfect health). This number is multiplied by life-years to get QALYs. A comparison is made regarding the outcome of 2 neonates with transposition of great arteries (TGA). Before the performance of CCHD screen, an infant with TGA was discharged home at 36 hours and was admitted in a critical state through the emergency department (ED). He subsequently underwent cardiac surgery under suboptimal state of health and succumbed to multiorgan failure at age 3 months (0.25 years). His QALY is calculated as follows: quality of life (0.1 - poor quality of life) X 0.25 years = 0.025 (shown in blue). In a second infant with TGA, CCHD screen resulted in early diagnosis before onset of circulatory compromise. This patient (shown in green) had a good quality of life (0.8) during the first year. After an acute coronary event, his quality of life decreased to 0.5 for 4 years and 0.2 for 1 year. The patient died at age 6 years of an acute coronary event. His QALY shown in green font is 3.
c. Cost-Benefit Analysis
In CBA, the costs and the consequences are expressed in monetary terms. In this type of analysis, a monetary value is assigned to the quality and survival improvement due to the intervention.
d. Incremental Cost-Effectiveness Ratio
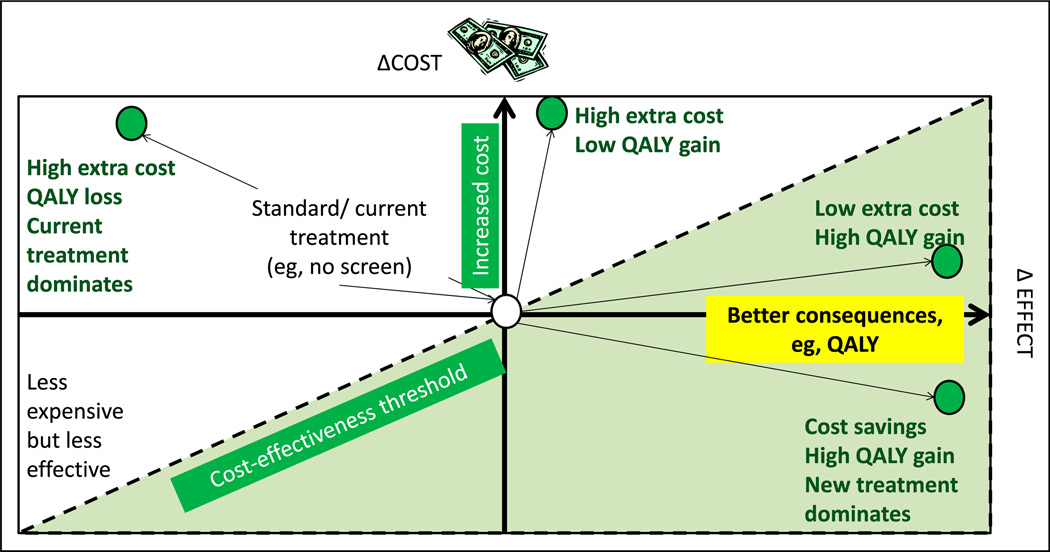
The incremental cost-effectiveness ratio is a universally used metric to express cost-effectiveness. This is calculated by dividing the difference in costs between the new and standard therapy by the difference in the effects or consequences of the new and standard effects (Costnew – Coststandard)/(Consequencesnew – Consequencesstandard). A diagrammatic depiction of a cost-effectiveness plane is shown in Figure 10. (20)
Figure 10.
Cost-effectiveness model or plane. Increasing cost is depicted on the y-axis and better effect or consequences (such as quality-adjusted life-years [QALY]) on the x-axis. The central point is the cost and effect of current (“standard”) management. The left upper quadrant represents more expensive and less effective alternative to the current intervention. The left lower quadrant represents less expensive but less effective intervention. The right upper quadrant shows 2 new interventions (green circles) with extra cost but better QALY gain. The right lower quadrant intervention provides high QALY with cost savings. The dotted line is referred to as the cost-effectiveness threshold.
e. Multiple Perspectives Influencing Interpretation of CEA and CBA
The perspective from which the economic effectiveness is conducted determines what is included in the analysis. If the perspective of the insurance payer is used, for example, the analysis does not include out-of-pocket costs by the patient (or parent), costs incurred due to loss of work, and other such costs; these costs would be included if the perspective of the patient is considered. Almost all the costs are included if the societal perspective is chosen.
Sensitivity Analysis
Sensitivity analysis is used to test the robustness of the results obtained in health care evaluations, including economic evaluations. By changing the parameters of interest, the stability of the conclusions over a range of probability estimates can be assessed. The parameters of interest (inputs) that can influence outcome include patient characteristics, cost of care, health effect (eg, life-years saved, utilities, and cases of disease avoided), and use of alternate definitions of predictor or outcome variables or different statistical tests. In the example shown in Figure 7, sensitivity analyses reveal that the rates of VUR and fUTI are mainly dependent on the patient’s age. The frequency of VUR is more common in young children. Young children are also exposed to a higher radiation dose per unit of body surface area if subjected to further testing. Another example of a sensitivity analysis is to repeat the analysis using only high-quality data. In a meta-analysis of clinical trials evaluating the effect of selective serotonin reuptake inhibitors on depression, in a sensitivity analysis, the investigator may include only the blinded trials to demonstrate that the results are robust when the analysis is restricted to high-quality trials.
Measurements
Measurements describe phenomena in terms that can be analyzed statistically. (21) The validity of a study depends on how well the variables designed for the study represent the phenomena of interest. In newborn nursery, how well does the new glucometer measure glucose level compared with the laboratory?
a. Validity
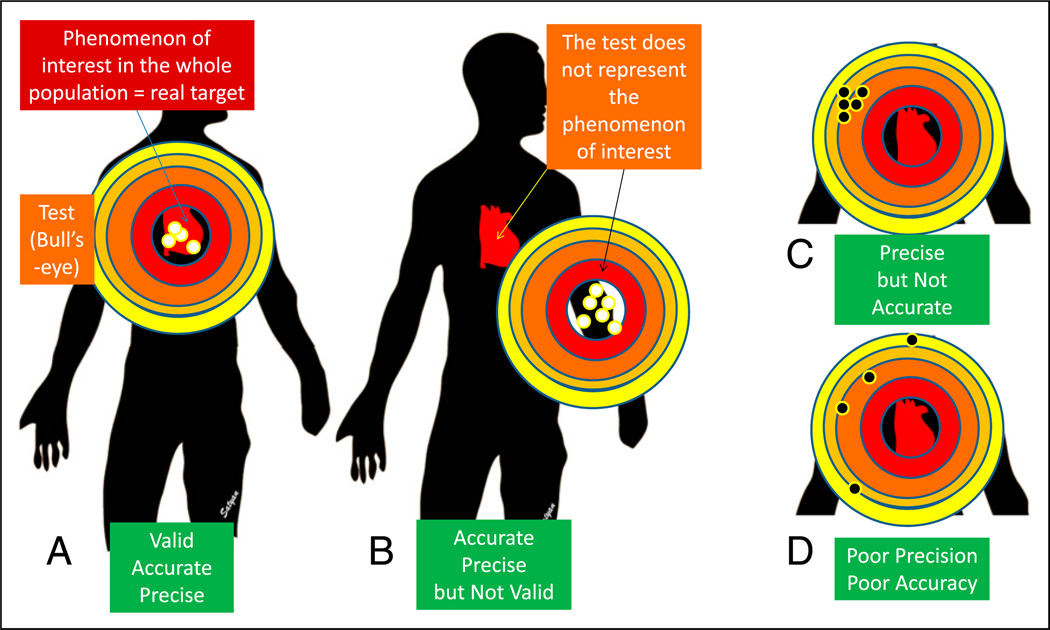
Validity is an assessment of how well a measurement represents the phenomenon of interest (what is being measured?). A full-term infant is recovering from hypoxic-ischemic encephalopathy and acute tubular necrosis. Decreasing levels of blood urea nitrogen (BUN), serum creatinine, and cystatin C represent improving renal function. Protein intake and hydration influence BUN levels. Serum creatinine may be influenced by muscle mass. Therefore, cystatin C may be more valid than serum creatinine and creatinine is more valid compared with BUN in assessing renal function. In Figure 11, validity can be thought of as describing whether the bull’s-eye is on the right target.
Figure 11.
Validity, precision, and accuracy. Validity is an assessment of how well a measurement represents the phenomenon of interest. A. The bull’s-eye (test or study) is located over the target practice manikin’s heart (phenomenon of interest). The pattern of tightness in the bullet holes indicates precision, and the location close to the center of the bull’s eye indicates accuracy. B. The bull’s-eye (test/study) is located away from the manikin’s heart and is not representing the phenomenon of interest, suggesting poor validity. The bullet hole pattern suggests high accuracy and precision. C. The pattern of tightness indicates precision, but these holes are located away from the center, suggesting poor accuracy. D. The test shows neither precision (wide scatter) nor accuracy (the holes are biased to the left). (21).
Validity is often not amenable to assessment with a gold standard, particularly for measurements aimed at subjective and abstract phenomenon, such as neonatal pain during procedures or quality of life. (5) Social scientists have created qualitative and quantitative constructs for addressing the validity of these instrument approaches.
-
(i)
Face validity describes whether the instrument seems inherently reasonable, such as a neonatal infant pains scale.
-
(ii)
Construct validity is the degree to which a specific measuring device agrees with a theoretical construct; for example, Bayley scales of infant development should distinguish between preterm infants with varying degrees of neurologic morbidities that theory or other measures suggest have different levels of psychomotor and mental development.
-
(iii)
Criterion-related validity is the degree to which a new measurement correlates with well-accepted existing measures (cystatin C compared with serum creatinine for renal function).
-
(iv)
Predictive validity is the ability of the measurement to predict an outcome. The assessment of score for acute neonatal physiology or its modifications should be able to predict neonatal mortality. (22)
-
(v)
Content validity examines how well the measurement represents all aspects of the phenomenon under study. In studies evaluating quality of life in teenagers who were born at less than 28 weeks’ gestation, questions pertaining to social, physical, emotional, educational, and intellectual functioning need to be included.
b. Generalizing the Study Findings (External and Internal Validity)
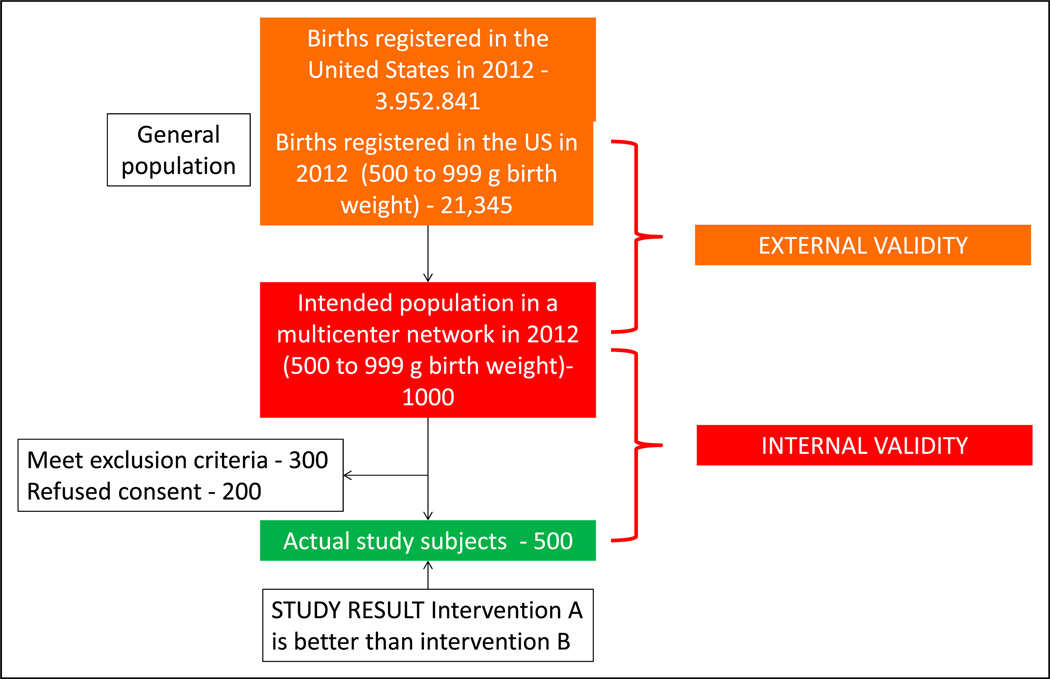
A total of 3,952,841 births were registered in the United States in 2012. (23) Approximately 21,345 infants (0.54%) were born with a birth weight between 500 and 999 g. A study evaluating this extremely low birth weight (ELBW) population comparing intervention A and intervention B is planned in 10 academic neonatal intensive care units (NICUs) with approximately 1,000 ELBW infants per year (intended sample). Of these infants, 500 ELBW infants were actually enrolled in the study (actual study participants) (Figure 12). The study results demonstrate that intervention A is better than intervention B. If there were no errors in implementing the study (eg, consent, exclusion criteria, and selection bias), these results must be true in the intended sample, and the study is said to have internal validity. We want to be able to generalize the study findings to all ELBW infants born in the United States. If the characteristics of the study patients are similar to those of the general population and the actual measurements in the study participants represent the phenomenon of interest in all the preterm ELBW infants in United States, the study is said to have generalizability or external validity.
Figure 12.
External and internal validity: External validity refers to the generalizability of the study findings to the population (eg, all preterm extremely low birth weight - VLBW neonates in the US). Internal validity depends on the design and conduct of the study; it represents the degree to which the results of the study accurately reflect the truth in the study. A study with high internal validity has a lower likelihood of bias.
c. Reliability
Reliability refers to consistency and stability of test scores across situations.
-
(i)
Test-retest reliability assesses whether an instrument or test yields the same results each time it is used with the same study sample under the same study conditions.
-
(ii)
Interrater reliability is the degree to which 2 raters independently score an observation similarly. Neonatal practitioners commonly code observations using the following Current Procedural Terminology codes: critical care (99468, 99469, 99471 and 99472), intensive care (99477-80), or nonintensive care (99221-3 and 99231-3). When multiple neonatal practitioners code for patients in the NICU in a similar pattern, the interrater reliability is high. For categorical variables, interrater reliability can be assessed using the following methods.
Percent agreement (percentage of observations on which the observers agree exactly): If 2 neonatal practitioners code NICU patients as critical, intensive, and routine exactly the same, they have 100% interrater reliability.
κ score: This is the extent of agreement beyond what is expected by chance and can give credit to partial agreement. The κ scores can vary from −1 to +1 as follows: −1 indicates perfect disagreement, 0 indicates no more agreement than would be expected from the prevalence of each abnormality, +1 indicates perfect agreement, and values greater than 0.6 are considered good and greater than 0.8 are considered very good.
d. Precision
Precision of a variable is the degree to which it is reproducible and is a function of random error. Repeated measurements of axillary temperature of all infants in the NICU may be reproducible and precise. Random error leading to reduced precision may result from the following sources:
Subject variability: In preterm, ELBW infants, the axillary temperature may be influenced more by the environmental temperature compared with term infants.
Instrument variability: There may be a difference in reproducibility of digital thermometers vs mercury thermometers (can be minimized by refining and automating the instrument).
Observer variability: Axillary temperatures obtained by experienced nurses may be more reproducible compared with interns on their first rotation in the NICU (can be reduced by standardizing the measurement method and training or certifying the observer).
Note: Repeating the measurement (use of the mean of 3 axillary temperature measurements) will decrease all the above 3 forms of variability, reduce random error, and improve precision.
e. Accuracy
Accuracy of a variable is the degree to which it represents the true value. The best way to assess accuracy is to compare with a gold standard (compare axillary temperature with core rectal or esophageal temperature). Accuracy is a function of systematic error (bias). The 3 main causes of systematic error are as follows:
Instrument bias is due to faulty function of an instrument (axillary thermometer that has not been calibrated). If the thermometer consistently records values 2°F (−15.7°C) below the real value, the measurements may be precise (reproducible) but not accurate (away from gold standard) (Figure 11).
Observer bias in the perception of reporting of the measurement by the observer. In an unmasked trial, such as optimizing (longer, deeper) cooling trial for hypoxic ischemic encephalopathy (NCT01192776), the nurse may have an increased tendency to report bradycardia in the deeper cooling group.
Subject bias is a tendency not to recall or report socially undesirable behavior, such as smoking, during a questionnaire.
Masking or blinding is a classic strategy that can eliminate differential bias that affects one group more than the other.
Scales and Scores to Measure Abstract Variables
Hendricks-Muñoz et al (24) evaluated the factors that influence neonatal nursing perceptions of family-centered care, kangaroo mother care, and developmental care practices in 3 level III NICUs in New York City. Abstract concepts, such as individual perceptions, are difficult to measure from a single question. In this study, 59 nurses answered a 24-item scale. Multi-item scales, such as the Likert scales, are commonly used to quantify attitudes, behaviors, and domains of health-related quality of life. These scales provide respondents with a list of statements or questions and ask them to select a response that best represents the rank or degree of their answer. (5)
For example, the NICU nurses were asked to rate the following three questions statements to evaluate their perception of family-centered care. (24)
Question 1: “I should encourage parents and their children to come anytime in the NICU [neonatal intensive care unit].”
Question 2: “I feel that nurses always make parents feel welcomed in the NICU.”
Question 3: “Nurses should make parents feel included as part of the team in the care of their baby.”
The responses can be rated as strongly agree, agree, neutral, disagree, or strongly disagree. Sometimes, a nurse may answer strongly agree to questions 1 and 3 but answer strongly disagree to question 2. This pattern is not internally consistent. The internal consistency of a scale can be tested statistically using measures such as Cronbach’s α. Values of this measure greater than 0.8 are considered excellent and below 0.5 are unacceptable.
Conclusion
The 3 articles covering biostatistics, (25) study design, (26) and principles of epidemiology and clinical research are intended to provide a quick review for neonatal practitioners. They are designed to inform the reader about basic concepts of clinical research in a reader-friendly manner with illustrations referring to the neonatal population. The readers are referred to books on biostatistics, (4)(7) designing clinical research, (5) and epidemiology (2)(27) before planning clinical research.
American Board of Pediatrics Neonatal-Perinatal Content Specifications.
Understand how bias affects the validity of results.
Understand how confounding affects the validity of results.
Identify common strategies in study design to avoid or reduce bias.
Identify common strategies in study design to avoid or reduce confounding.
Understand how study results may differ between distinct subpopulations (effect modification).
Understand the difference between association and causation.
Identify factors that strengthen causal inference in observational studies (eg, temporal sequence, dose response, repetition in a different population, consistency with other studies, biologic plausibility).
Distinguish disease incidence from disease prevalence.
Understand factors that affect the rationale for screening for a condition or disease (eg, prevalence, test accuracy, risk-benefit, disease burden, presence of a presymptomatic state).
Understand the strengths and limitations of decision analyses.
Interpret a decision analysis.
Differentiate cost-benefit from cost-effectiveness analysis.
Understand how quality-adjusted life years are used in cost analyses.
Understand the multiple perspectives (eg, of an individual, payor, society) that influence interpretation of cost-benefit and cost-effectiveness analyses.
Understand the strengths and limitations of sensitivity analysis.
Interpret the results of sensitivity analysis.
Understand the types of validity that relate to measurement (eg, face, construct, criterion, predictive, content).
Distinguish validity from reliability.
Distinguish internal from external validity.
Distinguish accuracy from precision.
Understand and interpret measurements of interobserver reliability (eg, kappa).
Understand and interpret Cronbach’s alpha.
Acknowledgments
Drs Manja and Lakshminrusimha have disclosed funding from NICHD grant 1R01HD072929-0.
Abbreviations
- BPD
bronchopulmonary dysplasia
- BUN
blood urea nitrogen
- CBA
cost-benefit analysis
- CCHD
critical congenital heart disease
- CEA
cost-effectiveness analysis
- CUA
cost-utility analysis
- ELBW
extremely low birth weight
- fUTI
febrile urinary tract infection
- NICU
neonatal intensive care unit
- QALY
quality-adjusted life-years
- RCT
randomized clinical trial
- SGA
small for gestational age
- VCUG
voiding cystourethrography
- VLBW
very low birth weight
- VUR
vesicoureteral reflux
Footnotes
Author Disclosure
Dr Lakshminrusimha has disclosed that he is on the speakers’ bureau of Ikaria Inc, and Dr Manja has disclosed that she has a family member on the speakers’ bureau of Ikaria Inc. This commentary does not contain a discussion of an unapproved/investigative use of a commercial product/device.
References
- 1.Brodsky D, Martin C. Neonatology Review. Kidlington, United Kingdom: Hanley & Belfus; 2003. [Google Scholar]
- 2.Cordis L. Epidemiology: With Student Consult Online Access. Amsterdam, the Netherlands: Elsevier Health Sciences; 2013. [Google Scholar]
- 3.Guyatt GH, Rennie D, Meade MO, Cook DJ. User’s Guide to the Medical literature a manual for evidence-based clinical practice. 2nd edition. New York: NY McGraw Hill; 2008. [Google Scholar]
- 4.Hermansen M. Biostatistics: Some Basic Concepts. Gainesville, FL: Caduceus Medical Publishers; 1990. [Google Scholar]
- 5.Hulley SB, Cummings SR, Browner WS, Grady DG, Newman TB. Designing Clinical Research. Baltimore, MD: Wolters Kluwer Health; 2013. [Google Scholar]
- 6.Morris S, Devlin N, Parkin D. Economic Analysis in Health Care. Hoboken, NJ: John Wiley & Sons; 2007. [Google Scholar]
- 7.Norman GR, Streiner DL. Biostatistics: The Bare Essentials. Hamilton, ON: BC Decker; 2008. [Google Scholar]
- 8.Fortier I, Marcoux S, Beaulac-Baillargeon L. Relation of caffeine intake during pregnancy to intrauterine growth retardation and preterm birth. Am J Epidemiol. 1993;137(9):931–940. doi: 10.1093/oxfordjournals.aje.a116763. [DOI] [PubMed] [Google Scholar]
- 9.Olsen J. Predictors of smoking cessation in pregnancy. Scand J Soc Med. 1993;21(3):197–202. doi: 10.1177/140349489302100309. [DOI] [PubMed] [Google Scholar]
- 10.Spiegler J, Jensen R, Segerer H, et al. Influence of smoking and alcohol during pregnancy on outcome of VLBW infants. Z Geburtshilfe Neonatol. 2013;217(6):215–219. doi: 10.1055/s-0033-1361145. [DOI] [PubMed] [Google Scholar]
- 11.Dogaru CM, Nyffenegger D, Pescatore AM, Spycher BD, Kuehni CE. Breastfeeding and childhood asthma: systematic review and meta-analysis. Am J Epidemiol. 2014;179(10):1153–1167. doi: 10.1093/aje/kwu072. [DOI] [PubMed] [Google Scholar]
- 12.Kramer MS. Invited commentary: Does breastfeeding protect against “asthma”? Am J Epidemiol. 2014;179(10):1168–1170. doi: 10.1093/aje/kwu070. [DOI] [PubMed] [Google Scholar]
- 13.Hill AB. The environment and disease: association or causation? Proc R Soc Med. 1965;58:295–300. [PMC free article] [PubMed] [Google Scholar]
- 14.Mahle W, Koppel R. Screening with pulse oximetry for congenital heart disease. Lancet. 2011;378(9793):749–750. doi: 10.1016/S0140-6736(11)61032-5. [DOI] [PubMed] [Google Scholar]
- 15.Mahle WT, Martin GR, Beekman RH, III, Morrow WR. Section on Cardiology and Cardiac Surgery Executive Committee. Endorsement of Health and Human Services recommendation for pulse oximetry screening for critical congenital heart disease. Pediatrics. 2012;129(1):190–192. doi: 10.1542/peds.2011-3211. [DOI] [PubMed] [Google Scholar]
- 16.Mahle WT, Newburger JW, Matherne GP, et al. American Heart Association Congenital Heart Defects Committee of the Council on Cardiovascular Disease in the Young, Council on Cardiovascular Nursing, Interdisciplinary Council on Quality of Care and Outcomes Research; American Academy of Pediatrics Section on Cardiology And Cardiac Surgery; Committee On Fetus And Newborn. Role of pulse oximetry in examining newborns for congenital heart disease: a scientific statement from the AHA and AAP. Pediatrics. 2009;124(2):823–836. doi: 10.1542/peds.2009-1397. [DOI] [PubMed] [Google Scholar]
- 17.Manja V, Mathew B, Carrion V, Lakshminrusimha S. Critical congenital heart disease screening by pulse oximetry in a neonatal intensive care unit [published online July 24, 2014] J Perinatol. doi: 10.1038/jp.2014.135. [DOI] [PMC free article] [PubMed] [Google Scholar]
- 18.Peterson C, Grosse SD, Oster ME, Olney RS, Cassell CH. Cost-effectiveness of routine screening for critical congenital heart disease in US newborns. Pediatrics. 2013;132(3):e595–e603. doi: 10.1542/peds.2013-0332. [DOI] [PMC free article] [PubMed] [Google Scholar]
- 19.Routh JC, Grant FD, Kokorowski P, et al. Costs and consequences of universal sibling screening for vesicoureteral reflux: decision analysis. Pediatrics. 2010;126(5):865–871. doi: 10.1542/peds.2010-0744. [DOI] [PMC free article] [PubMed] [Google Scholar]
- 20.Wonderling D, Sawyer L, Fenu E, Lovibond K, Laramee P. National Clinical Guideline Centre cost-effectiveness assessment for the National Institute for Health and Clinical Excellence. Ann Intern Med. 2011;154(11):758–765. doi: 10.7326/0003-4819-154-11-201106070-00008. [DOI] [PubMed] [Google Scholar]
- 21.Streiner DL, Norman GR. “Precision” and “accuracy”: two terms that are neither. J Clin Epidemiol. 2006;59(4):327–330. doi: 10.1016/j.jclinepi.2005.09.005. [DOI] [PubMed] [Google Scholar]
- 22.Richardson DK, Corcoran JD, Escobar GJ, Lee SK. SNAP-II and SNAPPE-II: Simplified newborn illness severity and mortality risk scores. J Pediatr. 2001;138(1):92–100. doi: 10.1067/mpd.2001.109608. [DOI] [PubMed] [Google Scholar]
- 23.Martin JA, Hamilton BE, Ventura SJ, Osterman MJ, Mathews TJ. Births: final data for 2011. Natl Vital Health Stat. 2013;62(1):1–69. 72. [PubMed] [Google Scholar]
- 24.Hendricks-Munoz KD, Louie M, Li Y, Chhun N, Prendergast CC, Ankola P. Factors that influence neonatal nursing perceptions of family-centered care and developmental care practices. Am J Perinatol. 2010;27(3):193–200. doi: 10.1055/s-0029-1234039. [DOI] [PMC free article] [PubMed] [Google Scholar]
- 25.Manja V, Lakshminrusimha S. Principles of use of biostatistics in research. Neoreviews. 2014;15:150. doi: 10.1542/neo.15-4-e133. [DOI] [PMC free article] [PubMed] [Google Scholar]
- 26.Manja V, Lakshminrusimha S. Core knowledge in scholarly activities - epidemiology and clinical research design part 1: study types. Neoreviews. doi: 10.1542/neo.15-12-e558. In press. [DOI] [PMC free article] [PubMed] [Google Scholar]
- 27.Sackett DL. Clinical Epidemiology: A Basic Science for Clinical Medicine. 2nd ed. New York, NY: Little, Brown; 1991. [Google Scholar]


