Cryo-EM study reveals key molecular structural features for activation of guanosine triphosphate cleavage by EF-G during translocation.
Keywords: Cryo-EM, Ribosome, translocation, Elongation factor G, GTP hydrolysis
Abstract
During protein synthesis, elongation of the polypeptide chain by each amino acid is followed by a translocation step in which mRNA and transfer RNA (tRNA) are advanced by one codon. This crucial step is catalyzed by elongation factor G (EF-G), a guanosine triphosphatase (GTPase), and accompanied by a rotation between the two ribosomal subunits. A mutant of EF-G, H91A, renders the factor impaired in guanosine triphosphate (GTP) hydrolysis and thereby stabilizes it on the ribosome. We use cryogenic electron microscopy (cryo-EM) at near-atomic resolution to investigate two complexes formed by EF-G H91A in its GTP state with the ribosome, distinguished by the presence or absence of the intersubunit rotation. Comparison of these two structures argues in favor of a direct role of the conserved histidine in the switch II loop of EF-G in GTPase activation, and explains why GTP hydrolysis cannot proceed with EF-G bound to the unrotated form of the ribosome.
INTRODUCTION
The ribosome translates the genetically encoded sequence of codons along mRNA into a polypeptide chain, which is subsequently folded into a protein. The ribosome has three binding sites for transfer RNA (tRNA): the aminoacyl (A) site, peptidyl (P) site, and exit (E) site. In each cycle of the peptide chain elongation, an amino acid is delivered to the ribosome at the A site by a cognate aminoacylated tRNA (aa-tRNA) bound with elongation factor Tu (EF-Tu). After EF-Tu separates from the ribosome and the peptide is transferred from the P-site tRNA to the amino acid on the A-site tRNA, the ribosome equilibrates between two conformations, termed “rotated” and “nonrotated,” distinguished by a ~9° rotation between the two subunits (1–5). Efficient translocation of mRNA-tRNAs, a process required to move a new codon into the A site, requires the binding of elongation factor G (EF-G) to the ribosome and subsequent guanosine triphosphate (GTP) hydrolysis (6, 7). A recent x-ray study reported a compact conformation of EF-G bound with the pretranslocational ribosome, indicating that the translocation depends on the structural transition of EF-G, starting from a compact conformation (8). In spite of significant progress by x-ray crystallography (9–12) and cryogenic electron microscopy (cryo-EM) (13, 14), and studies by single-molecule fluorescence resonance energy transfer (smFRET) (15–18) to characterize the binding interactions of EF-G with the ribosome, the role of EF-G in translocation is still not well understood. An smFRET study showed that EF-G•GTP is able to bind to the ribosome in both rotated and nonrotated states, but that only the former is productive in leading to GTP hydrolysis and translocation (19). We reasoned that structural investigation of these two different binding states might give us clues on the mechanism of guanosine triphosphatase (GTPase) activation. Imaging of EF-G•GTP–bound complexes for structural visualization is challenged by their very short life span because GTP hydrolysis is a very fast process and results in rapid conformational changes downstream. A solution to circumvent this problem in the past was to use nonhydrolyzable GTP analogs, such as GDPNP (9, 10) or GMPPCP (12), as a substitute for GTP, thereby blocking the complex in the state before GTP hydrolysis. The structures obtained in this way showed that the His87 residue in Thermus thermophilus EF-G (His91 in Escherichia coli EF-G) is situated one water molecule away from the GTP molecule. The role of this histidine residue in the activation of GTP hydrolysis was proposed to either be direct, through catalytic activation of the water molecule for nucleophilic attack (20–22), or indirect, through stabilization of the structural elements surrounding GTP; see review in (23). In an attempt to resolve the question of the role of H91 in GTPase activation and to shed further light on the interactions between EF-G and the ribosome, we used cryo-EM to image a sample of translating ribosomes in the presence of EF-G in which His91 is mutated to Ala (see Materials and Methods).
RESULTS AND DISCUSSION
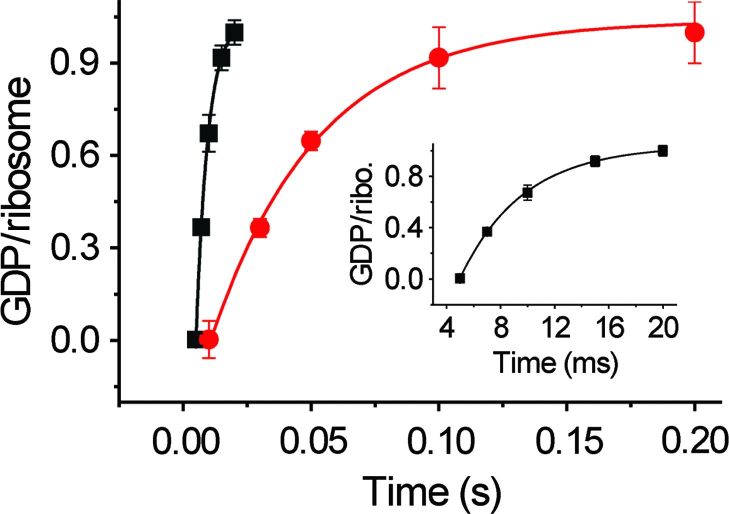
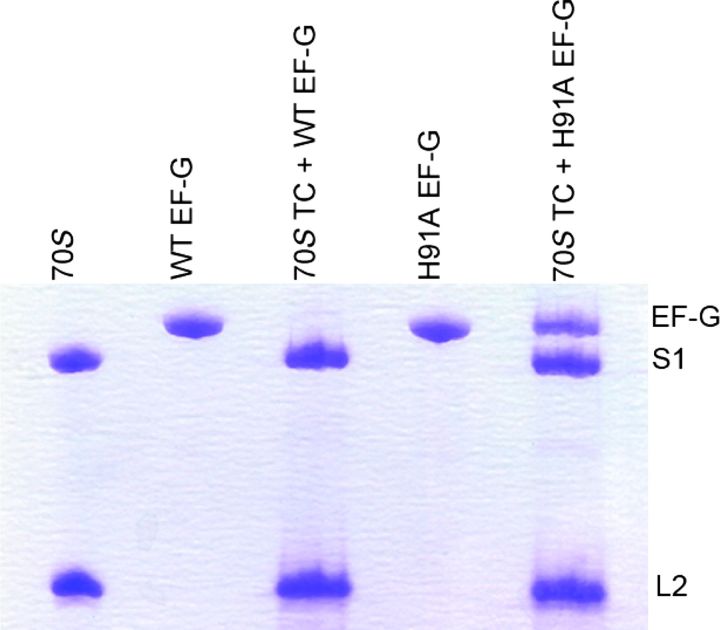
Biochemical analysis shows that a mutant of EF-G, H91A, hydrolyzes GTP at a substantially slower rate (kGTP H91A = 28 ± 4.5 s−1) than the wild type (kGTP WT = 202 ± 29 s−1) does on the ribosome (Fig. 1). The same EF-G mutant has been reported earlier as being completely inactive in GTP hydrolysis under different experimental conditions (24, 25). Also, in the case of EF-Tu, the corresponding H84A mutation was shown to be defective in GTP hydrolysis by five orders of magnitude (26, 27). These results, along with the smFRET results cited above (19), suggest that with H91A, stable EF-G–ribosome complexes suitable for imaging can even be obtained in the presence of authentic GTP; this is confirmed by co-sedimentation analysis by ultracentrifugation followed by SDS–polyacrylamide gel electrophoresis (SDS-PAGE) (Fig. 2).
Fig. 1. Single-turnover GTP hydrolysis.
Time course of single-turnover GTP hydrolysis by wild-type (WT; black) and H91A (red) EF-G. The amount of [3H]GDP produced is plotted against time and fitted with a single exponential function. The rate constants are 202 ± 29 s−1 for WT and 28 ± 4.5 s−1 for H91A EF-G. Error bars represent SDs obtained from three independent experiments. Ribo., ribosome.
Fig. 2. Occupancy of H91A EF-G in the ribosomal translocation complex.
Translocation complexes (70S TC) containing WT or H91A EF-G are ultracentrifuged at 100,000g at 4°C with 30% sucrose cushion. The ribosomal pellet was carefully isolated, washed, and subjected to SDS-PAGE analysis. Whereas no EF-G band was seen in the 70S TC + WT EF-G complex, a clear band of H91A EF-G, in almost 1:1 stoichiometry with the ribosomal protein S1, could be seen in the 70S TC + H91A EF-G complex.
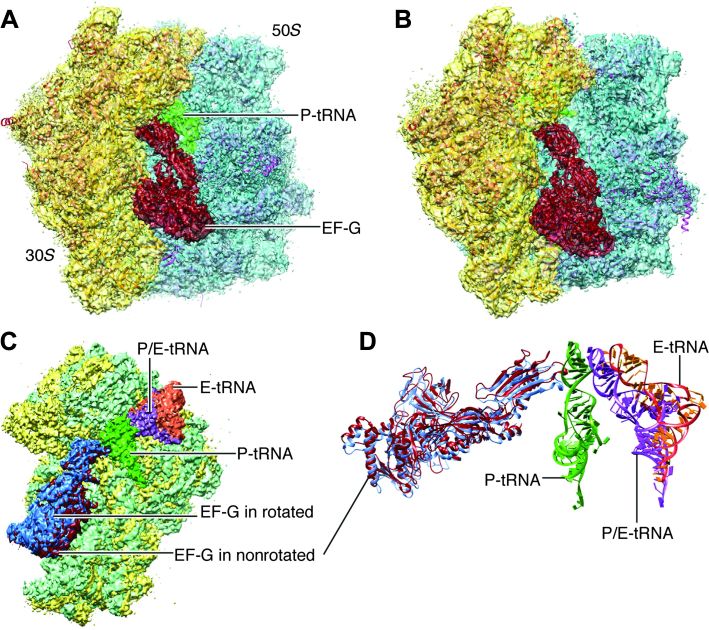
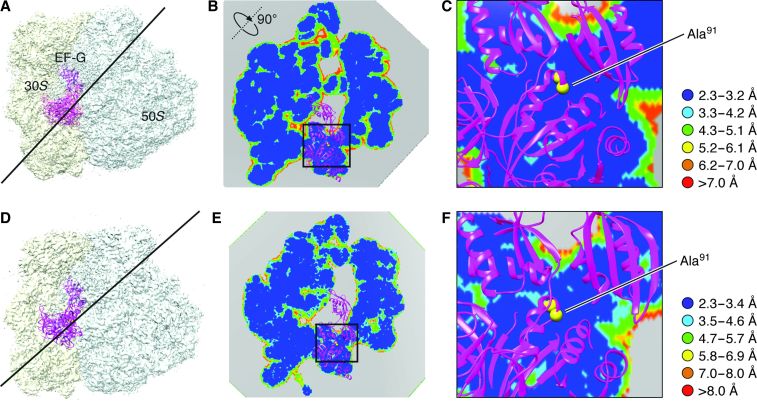
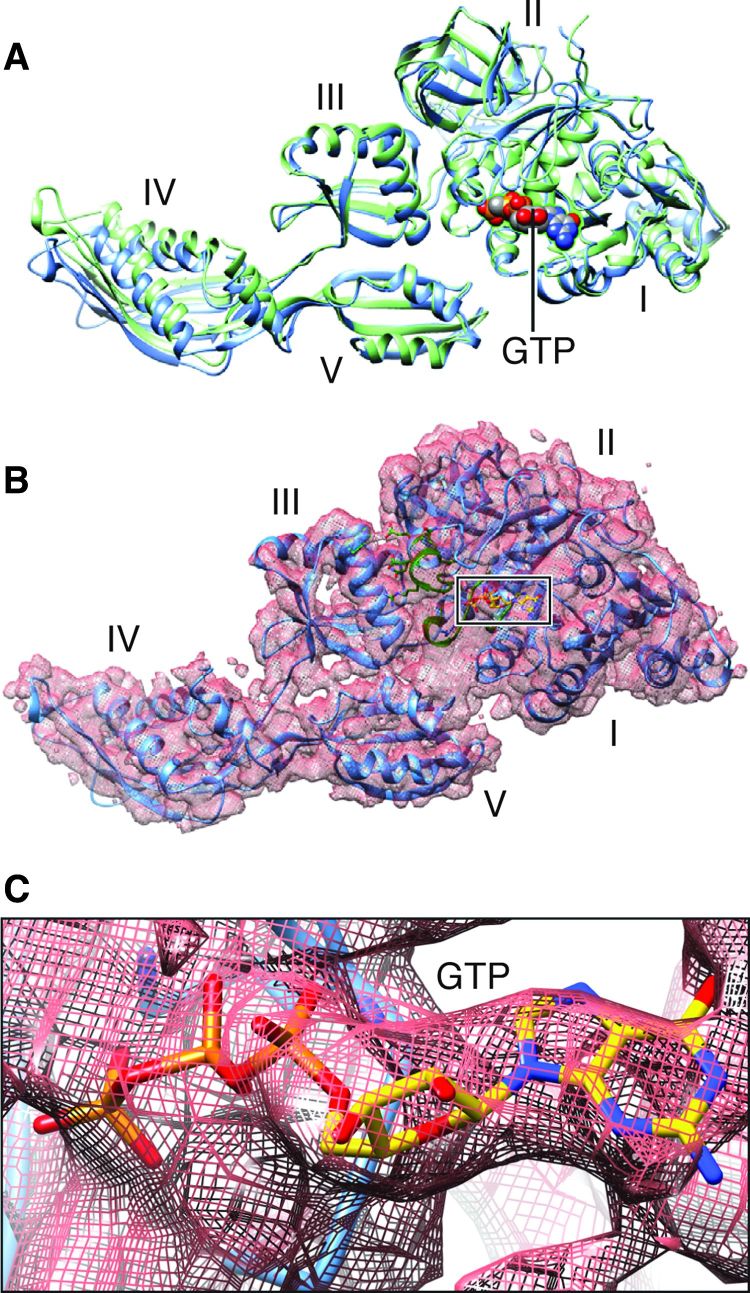
Refined density maps were obtained for four major classes (fig. S1 and Fig. 3), with resolutions in the range of 3.6 to 5.7 Å (Table 1, movies S1 to S3, and fig. S2), whose major differences are seen in a combination of presence or absence of EF-G and presence or absence of intersubunit rotation. The atomic details were extracted in terms of existing x-ray crystallographic structures of the 70S E. coli ribosome using the flexible fitting program MDFF (see Materials and Methods), and yielding representative structural models for four states, as summarized in Table 1. Here, we report our results on two structures showing EF-G bound to the rotated (Fig. 3B) and nonrotated (Fig. 3A) state of the ribosome, the former with one tRNA in the hybrid P/E position and the latter with tRNAs in the P and E positions (Fig. 3, C and D). The map resolution in the region surrounding the mutation H91A in EF-G is close to 3.2 and 3.4 Å in the unrotated and rotated state, respectively (Fig. 4). These two structures appear to correspond to the two GTP states observed in Chen et al.’s smFRET study (19). In both density maps, the size of the nucleotide bound to EF-G, singled out within the density of EF-G when displayed at a high threshold, is too large for a guanosine diphosphate (GDP) but just large enough to accommodate a GTP or GDP-Pi (inorganic phosphate) (Fig. 5 and fig. S3). Thus, the complexes could have been trapped in the GTP or GDP-Pi state. Furthermore, EF-G in both structures exhibits the domain constellation characteristic for its GTP form, distinguished from the GDP form (28, 29) by a rotation of the superdomain formed by domains II, IV, and V.
Fig. 3. Cryo-EM maps of the EF-G-bound complexes.
(A) Nonrotated ribosome (transparent) fitted with atomic models for both ribosome and EF-G. (B) Rotated ribosome (transparent) fitted with atomic models. (C) Superimposition of the maps of the 30S subunit (green for rotated) when two maps are aligned on the 50S subunits. (D) Map-fitted structures of all tRNAs and EF-Gs at their respective positions shown in (C).
Table 1. Summary of cryo-EM maps.
r70S, rotated ribosome; nr70S, nonrotated ribosome.
| Maps | Annotation of states | Resolution (Å) | No. of particles |
| 1 | nr70S•P-tRNA•E-tRNA | 4.0 | ~50,000 |
| 2 | nr70S•P-tRNA•E-tRNA•EF-G | 3.6 | ~90,000 |
| 3 | r70S•P/E-tRNA•EF-G | 4.2 | ~35,000 |
| 4 | r70S•P/E-tRNA | 5.7 | ~15,000 |
Fig. 4. Map resolution in a plane adjacent to residue Ala91.
(A) Map of the nonrotated ribosome complex. The line indicates the position of the section of the map in which the local resolution map is viewed. (B) Local resolution map in the section at the position shown in (A). (C) Zoomed-in view of the boxed region in (B). Resolution ranges are color-coded. (D to F) Illustrations of the rotated complex, corresponding to (A) to (C), respectively.
Fig. 5. Structures of 70S-bound EF-G in its GTP-bound state.
(A) EF-G structure obtained from our cryo-EM maps of the nonrotated (green) and rotated complexes (blue), aligned on domains I and II. (B) Map-fitted structure in the rotated complex (see corresponding fig. S3 for the nonrotated complex). (C) Map in (B) displayed at a very high threshold, singling out the density for GTP.
The rotated, EF-G–bound structure (Fig. 3B) has the characteristics of a pre-translocational ribosome in the GTP state, captured at the precise point where GTP hydrolysis is initiated in the wild-type situation. As in several x-ray structures (5, 10–12), no A/P-tRNA is present in this complex. This common observation is explained by the small size of the peptide; in an smFRET study (30) on the dynamics of EF-G in the pre-translocational complex showed an increase in the occupancy of tRNA in the hybrid A/P configuration as the peptide length was increased. As in these previous crystallography studies, the authenticity of the pre-translocational complex missing A/P is confirmed by the fact that the conformation of the ribosome is closely comparable with the authentic, A/P-tRNA–containing PRE complexes obtained by previous cryo-EM studies (4, 14, 15). The structure shows that the nonrotated EF-G–bound structure (Fig. 3A) was the result of the binding of EF-G in its GTP state to the post-translocational ribosome, which is weak and transient (19), but may be frequently sampled on account of the high concentration of EF-G•GTP in our sample. This structure is distinct from the structure of the post-translocational ribosome bound with EF-G in the GDP state, which can be trapped by fusidic acid (28) and is only reached after a round of translocation.
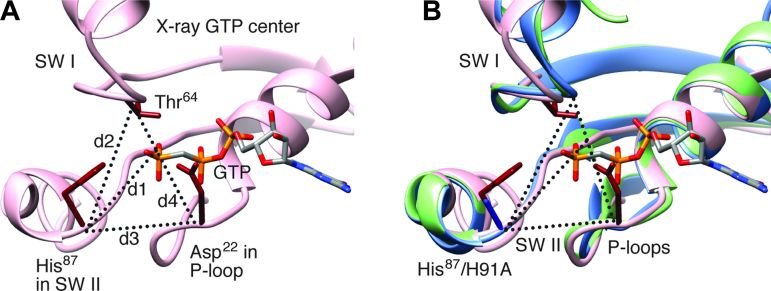
We first come to a close examination of the GTPase activation region. In both density maps, the region encompassing switch I, switch II, and the P-loop is virtually identical, showing the characteristics of the GTP state: switch I is ordered (Fig. 5) as in all x-ray structures of eubacterial ribosomes bound with the EF-G and GTP analogs GDPNP (10), GDPCP (9, 11), or GMPPMP (12). An overall structural comparison of the current EF-G and the x-ray structures is summarized in Table 2. However, our structures differ from previous wild-type EF-G structures in the distances between the Cα atom of H91A and the γ phosphate of GTP, between the Cα atom of H91A and the Cα atom of Thr63, between the Cα atom of H91A and the Cα atom of Asp22, and between the Cα atom of Thr63 and the Cα atom of Thr63 by about 1 to 2 Å. The slightly greater distances, compared with the corresponding distances in the x-ray structures of T. thermophilus [Table 3 and Fig. 6; (9–12, 20)], must be attributed to the mutation from the charged histidine to the nonpolar alanine residue. Hence, despite the very similar positions and conformations of the local structures in the immediate environment of GTP, the change in the distance between residue 91 and the γ phosphate, due to absence of the positive charge and the bulky side chain of His, renders the GTPase center of EF-G defective in triggering GTP hydrolysis. This result shows that the positioning of the side chain of His91 is critical for the activation of GTP hydrolysis.
Table 2. Comparison of EF-G conformations in terms of root mean square deviation.
|
EF-G in 4KIY.pdb (from E. coli PRE; resolution: 2.9 Å) |
EF-G in 4BTC.pdb (from T. thermophilus PRE; resolution: 2.95 Å) |
|
| EF-G in nonrotated complex | 1.3 Å | 1.3 Å |
| EF-G in rotated complex | 1.2 Å | 1.3 Å |
Table 3. Geometries for region of switch I and II and P-loop.
Distances d1 (between Cα of His87 and the Pγ atom of GTP), d2 (between Cα atoms of His87 and Thr64), d3 (between Cα atoms of His87 and Asp22), and d4 (between Cα atoms of Thr64 and Asp22) were obtained by averaging these distances from four x-ray structures (4JUW, 4KIY, 4KBT, 4KCY). For EF-Tu, the x-ray structure 4QDS was used. The x-ray POST used PDB 2WRI. “rt” and “nrt” denote rotated and nonrotated structures, respectively (see also Fig. 3).
| Distances (Å) |
X-ray EF-G average |
X-ray EF-Tu |
rt | nrt |
X-ray POST |
| d1 | 7.0 | 6.6 | 7.3 | 7.3 | 9.0 ( to Pβ) |
| d2 | 9.1 | 9.2 | 8.8 | 9.1 | 19.0 |
| d3 | 8.8 | 9.2 | 10.3 | 11.3 | 6.7 |
| d4 | 10.2 | 9.5 | 10.4 | 11.7 | 18.5 |
Fig. 6. Structures for region of switch I and II and P-loop.
(A) Structure (x-ray PDB: 4JUW) around GTP showing the residues directly involved in GTP hydrolysis. Distances d1 (between Cα of His87 and the Pγ atom of GTP), d2 (between Cα atoms of His87 and Thr64), d3 (between Cα atoms of His87 and Asp22), and d4 (between Cα atoms of Thr64 and Asp22), listed in Table 2 for our cryo-EM structures and x-ray structures. SW I, switch I; SW II, switch II. (B) Superimposition of our cryo-EM structures in the rotated (blue) and nonrotated (green) complexes on a representative x-ray structure of GTP state (PDB: 4JUW, pink).
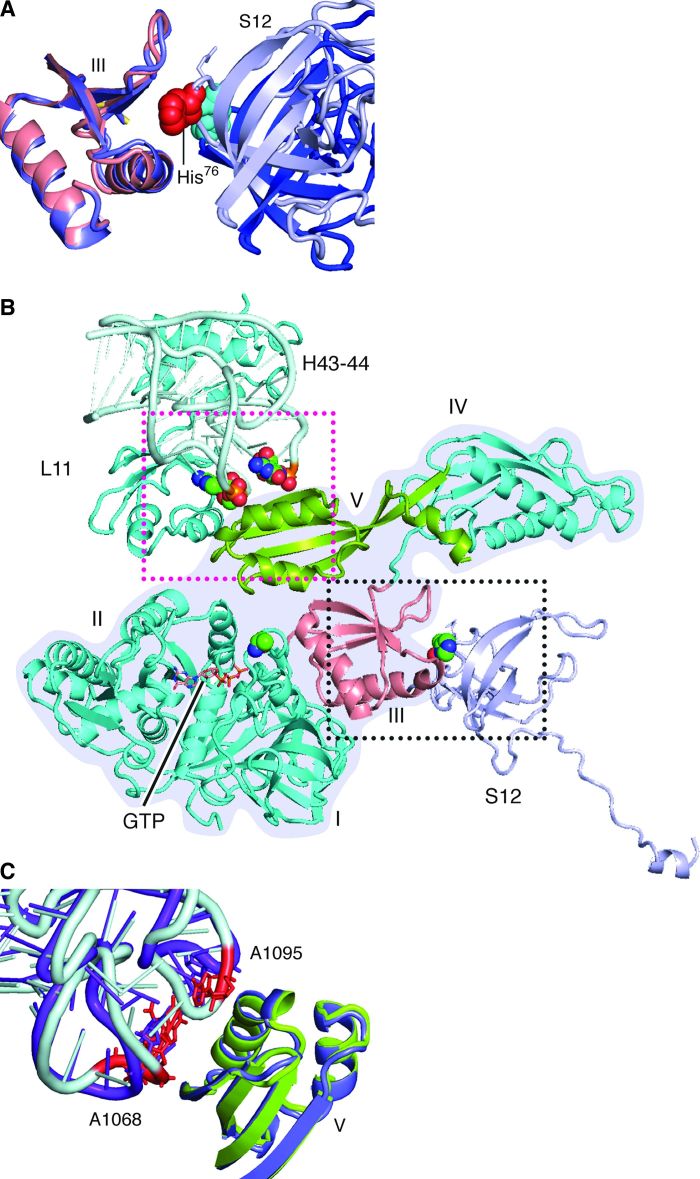
That the mutant H91A EF-G binds to both the rotated and unrotated ribosomes, yet wild-type EF-G only leads to GTP hydrolysis in the rotated ribosome [see (19, 25)], strongly suggests that the position of His91 (His87 in T. thermophilus) seen in the x-ray structures of ribosomes bound to EF-G in the presence of GTP is a necessary but not sufficient condition for GTP hydrolysis. Clues for the additional requirements will therefore come from an examination of the differences in the binding interactions between EF-G•GTP in the two conformations of the ribosome. As will be shown in detail below, this comparison reveals that the additional action effected by the rotation is the stabilization of domain III, which is poised to interact with the switch I loop. Because domain III is part of a superdomain that it forms with domains IV and V, stabilization of these latter two domains is required as well. Examination of the contacts between EF-G and the ribosome shows that in the rotated complex, the superdomain is stabilized by flanking interactions with domain III on one side and with domain V on the other side (Fig. 7), as follows.
Fig. 7. Contacts between EF-G, protein S12, and helices 43 and 44 of 23S ribosomal RNA.
(A) In the rotated complex, the 76-loop of protein S12 (blue-gray) is inserted into domain III of EF-G (salmon). The group of atoms for His76 are displayed as red spheres. In the nonrotated complex (domain III in slate blue; a portion of S12 in blue), His76 (atoms displayed as cyan spheres) in protein S12 is away from domain III. (B) Overview of the flanking restrictions on EF-G domains III and V in the rotated complex. The structure of EF-G is outlined with a gray background. (C) Contact between domain V and nucleotides A1068 in helix 43 and A1095 in helix 44 of the 23S ribosomal RNA. In the rotated structure, domain V is green and helices (H) 43 and 44 are blue-gray, in which A1068 and A1095 are red. In the nonrotated complex, domain V is slate blue and helices are purple.
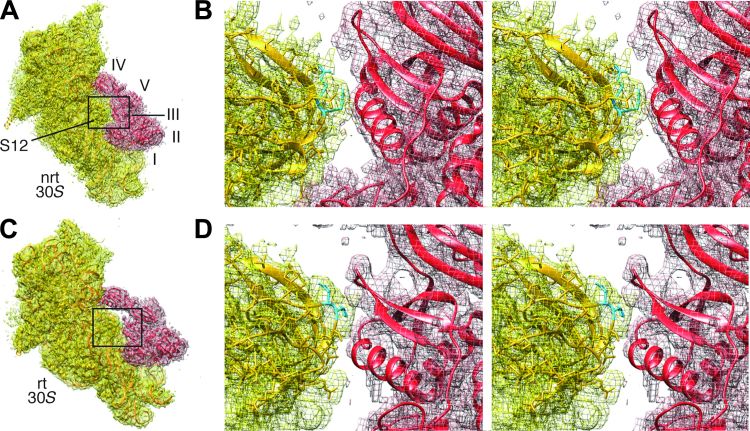
In the present rotated pre-translocational complex, switch I and domain III are in contact through residues Glu57-Arg474, Arg58-Asp466 in E. coli EF-G (12). This result agrees with the identification, in the x-ray structures, of the interacting pairs Glu56-Arg468, Gln57-Asp464, and Arg61-Glu460 for EF-G of T. thermophilus (11). We also find in the rotated complex that the 75-loop of protein S12 directly contacts domain III of EF-G, whereas residue 76 inserts itself into the middle of the helix (residues 424 to 440) and the β-turn (around residue 452) in domain III (Figs. 7, A and B, and 8), similarly as seen in the x-ray structure by Pulk and Cate (12). In sharp contrast, the 75-loop is positioned outside of domain III in the present nonrotated EF-G–bound complex. It is worth noting that in spite of the different positions of the 75-loop relative to domain III in our present two complexes, the conformation of protein S12 remains virtually the same, and the difference is only introduced by the intersubunit rotation. This inserted position is maintained during translocation because it also appears in the x-ray structure of the POST complex in which the nonrotated ribosome is bound with EF-G•GDP [fig. S4; (28)]. In conclusion, the insertion of the 75-loop of protein S12 into domain III of EF-G in the rotated ribosome is one of the critical elements for stabilization of domain III ensuring efficient activation of GTP hydrolysis.
Fig. 8. Positions of residues 75 to 76 in protein S12 relative to domain III of EF-G.
(A) Density maps (mesh) of the 30S subunit and EF-G in the nonrotated (nrt) state, with structures shown as ribbon. The domains of EF-G are labeled. (B) A stereo view of the boxed region in (A). Residues 75 to 76 are in cyan. (C and D) Illustrations corresponding to (A) and (B) respectively, but for the rotated state.
We now proceed to the stabilization of domain V from the other side of the superdomain (Fig. 7C). The interactions between the elements of domain V (side chains of Leu641 and Gln644) and nucleotides A1067 and A1096 in helices 43 and 44 are only found in the rotated complex, in which the N-terminal domain of L11 is also rotated toward domain V, compared with both the EF-G–unbound and EF-G–bound nonrotated ribosomes. The closed position of the L11 lobe appears to stabilize domain V, whereas domain III is restricted in its orientation by protein S12’s insertion on the opposite side of the structure (Fig. 7C). The interactions with protein S12 and the L11 lobe produce a pair of flanking restrictions on EF-G, which, in contrast, are not formed in the nonrotated state.
We also see in our maps that the linker between domains III and IV is stabilized in the rotated conformation, and domains II and V are connected (at the displayed threshold), which is probably attributable to the aforementioned flanking restrictions (fig. S5). Additionally, in the rotated state, domain IV of EF-G, which is directly involved in the translocation of mRNA and the anticodon loop of tRNAs (31), interacts more strongly with bridge B2a, which is formed between helix 69 of 23S RNA and helix 44 of 16S RNA.
It is finally worth asking, given the evidence that EF-G•GTP competes with the aa-tRNA•EF-Tu•GTP complex for binding to the POST ribosome, what are the structural features that favor the ternary complex? In the smFRET experiments of Chen et al. (19), EF-G•GTP was seen to only visit the nonrotated POST ribosome intermittently, indicating a weak interaction. In contrast, these authors found much longer lifetimes of the complex formed between EF-G•GTP and the ribosome in the rotated state. Comparison of our two EF-G–bound cryo-EM density maps shows that in the nonrotated state, EF-G’s interaction with the ribosome is unstable, whereas in the rotated state, the factor establishes strong contacts with protein S12 and the L11-lobe. Thus, the overall weak binding of EF-G to the nonrotated state stands in stark contrast to multiple binding interactions with aa-tRNA•EF-Tu•GTP, explaining the results of Chen et al. (19) in structural terms.
MATERIALS AND METHODS
Buffer and translation components
All experiments were performed using Hepes polymix buffer (pH 7.5) at room temperature (32). E. coli MRE600 70S ribosomes, His-tagged initiation factors (IF1, IF2, and IF3) and elongation factors (EF-Tu, EF-Ts, and EF-G), XR7-Met-Leu-Phe-stop mRNA, tRNALeu, and [3H]fMet-tRNAfMet were purified following standard laboratory protocols (32, 33). H91A EF-G was created by mutating histidine (H) at position 91 to alanine (A) in wild-type EF-G construct (C-terminally His-tagged) (a gift from K. S. Wilson, Oklahoma State University) by site-directed mutagenesis (34). Nucleotide triphosphates [adenosine triphosphate (ATP) and GTP] were purchased from GE Healthcare.
Single-turnover GTP hydrolysis
GTP hydrolysis by EF-G (wild type and H91A) was measured under single-turnover conditions by mixing 70S ribosomes (3 μM) and [3H]GTP (15 μM) with EF-G (15 μM) in a quench-flow device (RQF-4, KinTek Corp.) at 37°C. The reaction was quenched at different time points with 25% formic acid. The amount of [3H]GDP formed was estimated by separating the [3H]GTP and [3H]GDP fractions on a Mono Q column attached to a high-performance liquid chromatography system. The rate of GTP hydrolysis (kGTP) was obtained by fitting the data with a single exponential function using Origin 8.0 (OriginLab).
Preparation of the translocation complex with H91A EF-G
An initiation mixture (IM) containing 70S ribosomes (0.5 μM), all the three initiation factors [IF1, IF2, and IF3 (0.5 μM each)], XR7-Met-Leu-Phe mRNA (2 μM), [3H]fMet-tRNAfMet (1 μM), ATP (1 mM), GTP (1 mM), and phosphoenolpyruvate (PEP; 10 mM), and an elongation mixture (EM) containing elongation factors EF-Tu (0.5 μM), EF-Ts (0.2 μM), and EF-G H91A (5 μM), leucine (100 μM), tRNALeu 0.5 μM), Leu-tRNA synthatase (0.2 μM), ATP (1 mM), GTP (1 mM), and PEP (10 mM) were incubated separately at 37°C for 15 min. Both reaction mixtures were cooled down by leaving them at room temperature for 10 min. To initiate peptide elongation, 2 μl of IM was mixed with 8 μl of EM to achieve a final concentration of 70S ribosomes of 100 nM. The reaction was done for 15 s at room temperature (between 20° and 23°C). Aliquots of 4 μl of the final mixture were dropped on carbon-coated and glow-discharged holey carbon grids (Quantifoil 2/4 grids), which were incubated for 30 s in the Vitrobot chamber at a temperature of 4°C and a humidity of 100%. The grids were blotted for 1 s using an FEI Vitrobot, and the grids were immediately freeze-plunged in liquid ethane at the temperature of liquid nitrogen.
Co-sedimentation analysis to determine the occupancy of H91A EF-G in the translocation complex
The H91A EF-G–containing translocation complex was analyzed by co-sedimentation assay to determine the occupancy of EF-G in the complex. First, the translocation complex (prepared as above) was ultracentrifuged at 100,000g at 4°C with 30% sucrose cushion in an analytical ultracentrifuge. Then, the ribosomal pellet was carefully separated from the supernatant, washed twice with 1× Hepes polymix buffer (32), and subjected to SDS-PAGE analysis. A control experiment with wild-type EF-G was done in parallel.
Cryogenic electron microscopy
The specimens were transferred to a Titan Krios electron microscope (FEI) under cryo-conditions. The microscope was operated at 300 kV. Images were recorded using an FEI Falcon I direct electron detection camera with the Leginon program (35) at a calibrated magnification of ×59,000, yielding a pixel size of 1.09 Å. Defocus values for the contrast transfer function were calculated using CTFFIND3 (36) and were in the range of 1.5 to 3.5 μm in the final data set. A total of 8800 micrographs were collected, 6800 of which were used for particle selection after excluding those micrographs that had either poor power spectra or thick ice, using the method described by Jiang et al. (37). Program EMAN was used to select ribosome-sized single-particle images and then manually examine the quality of these images, yielding a data set of 380,000 single-particle images. The images were subjected to three-dimensional (3D) classifications and then map refinements, all performed using program RELION 1.2 (38). The process of hierarchical 3D classification is detailed in fig. S6. The refined maps were corrected for the modulation transfer function of the detector, and the high spatial frequencies were boosted using B-factor sharpening (39). Local resolutions of the maps were calculated using ResMap [fig. S7; (40)].
Model building and map fitting
With the program Modeller, the sequence of EF-G from E. coli was aligned to the sequence of EF-G from T. thermophilus, and then a homology model was built using the x-ray structure of EF-G from T. thermophilus [Protein Data Bank (PDB) ID: 2WRI] as the template. This template structure was bound with GDP and fusidic acid in the original form. The atomic structures of the 70S ribosome from E. coli, which included an fMet-tRNA in the P site (PDB IDs: 3J0U and 3J9T) of the nonrotated ribosome, were used for the starting model of the map-fitting of the nonrotated states. The atomic model (PDB IDs: 3J0Z and 3 J12) of the rotated ribosome including P/E-tRNA was used for the starting model of the fitting for the maps of the rotated states. The starting structures for the 70S ribosome and EF-G were fitted separately into the segmented maps, and then the fitted structures were combined together. The flexible fitting was done using the program MDFF (41) with implicit solvent, the generalized-Born implicit solvent model as implemented in NAMD. The final product fitting for each map was run for a 0.5-ns simulation, which was followed by 5000 steps of energy minimization. The cryo-EM maps and the atomic structures have been deposited (EMD-6315, EMD-6316, 3J9Z.pdb, and 3JAl.pdb.
Supplementary Material
Acknowledgments
We thank Z. Yu and J. de la Cruz for their assistance in the data collection at Janelia Farm Research Campus of Howard Hughes Medical Institute (HHMI). We also thank A. des Georges for his assistance with the use of the Relion program, and M. Thomas-Baum for her assistance in preparing the illustrations. Funding: This research was supported by HHMI and NIH grants R01 GM29169 and GM55440 (to J.F.); the Swedish Research Council [2011-6088 (NT) and 2008-6593 (Linnaeus grant to Uppsala RNA Research Center)] and the Knut and Alice Wallenberg Foundation (KAW 2011.0081, RiboCORE) grants (to S.S.). Competing interests: The authors declare that they have no competing interests.
SUPPLEMENTARY MATERIALS
Supplementary material for this article is available at http://advances.sciencemag.org/cgi/content/full/1/4/e1500169/DC1
Fig. S1. Gallery of four cryo-EM maps obtained by classification.
Fig. S2. Examples for map fittings.
Fig. S3. Density for GTP in the nonrotated complex.
Fig. S4. Interaction of protein S12 with domain III.
Fig. S5. Densities linking domain III to IV and domain II to V in our maps.
Fig. S6. Three-stage (I, II, III) classification of the entire data set using RELION.
Fig. S7. Color code for the resolution values in the movie showing the local resolution map.
Movie S1. Overview and local resolution estimation for the 3.6-Å map.
Movie S2. Examples of high-resolution protein features in the 3.6-Å map.
Movie S3. Examples of high-resolution RNA features in the 3.6-Å map.
REFERENCES AND NOTES
- 1.Moazed D., Noller H. F., Intermediate states in the movement of transfer RNA in the ribosome. Nature 342, 142–148 (1989). [DOI] [PubMed] [Google Scholar]
- 2.Frank J., Agrawal R. K., A ratchet-like inter-subunit reorganization of the ribosome during translocation. Nature 406, 318–322 (2000). [DOI] [PubMed] [Google Scholar]
- 3.Frank J., Intermediate states during mRNA–tRNA translocation. Curr. Opin. Struct. Biol. 22, 778–785 (2012). [DOI] [PMC free article] [PubMed] [Google Scholar]
- 4.Agirrezabala X., Lei J., Brunelle J. L., Ortiz-Meoz R. F., Green R., Frank J., Visualization of the hybrid state of tRNA binding promoted by spontaneous ratcheting of the ribosome. Mol. Cell 32, 190–197 (2008). [DOI] [PMC free article] [PubMed] [Google Scholar]
- 5.Zhang W., Dunkle J. A., Cate J. H., Structures of the ribosome in intermediate states of ratcheting. Science 325, 1014–1017 (2009). [DOI] [PMC free article] [PubMed] [Google Scholar]
- 6.Spiegel P. C., Ermolendo D. N., Noller H. F., Elongation factor G stabilizes the hybrid-state conformation of the 70S ribosome. RNA 13, 1473–1482 (2007). [DOI] [PMC free article] [PubMed] [Google Scholar]
- 7.Rodnina M. V., Savelsbergh A., Katunin V. I., Wintermeyer W., Hydrolysis of GTP by elongation factor G drives tRNA movement on the ribosome. Nature 385, 37–41 (1997). [DOI] [PubMed] [Google Scholar]
- 8.Lin J., Gagnon M. G., Bulkley D., Steitz T. A., Conformational changes of elongation factor G on the ribosome during tRNA translocation. Cell 160, 219–227 (2015). [DOI] [PMC free article] [PubMed] [Google Scholar]
- 9.Tourigny D. S., Fernández I. S., Kelley A. C., Ramakrishnan V., Elongation factor G bound to the ribosome in an intermediate state of translocation. Science 340, 1235490 (2013). [DOI] [PMC free article] [PubMed] [Google Scholar]
- 10.Zhou J., Lancaster L., Donohue J. P., Noller H. F., Crystal structures of EF-G–ribosome complexes trapped in intermediate states of translocation. Science 340, 1236086 (2013). [DOI] [PMC free article] [PubMed] [Google Scholar]
- 11.Chen Y., Feng S., Kumar V., Ero R., Gao Y. G., Structure of EF-G–ribosome complex in a pretranslocation state. Nat. Struct. Mol. Biol. 20, 1077–1084 (2013). [DOI] [PubMed] [Google Scholar]
- 12.Pulk A., Cate J. H., Control of ribosomal subunit rotation by elongation factor G. Science 340, 1235970 (2013). [DOI] [PMC free article] [PubMed] [Google Scholar]
- 13.Ramrath D. J., Lancaster L., Sprink T., Mielke T., Loerke J., Noller H. F., Spahn C. M., Visualization of two transfer RNAs trapped in transit during elongation factor G-mediated translocation. Proc. Natl. Acad. Sci. U.S.A. 110, 20964–20969 (2013). [DOI] [PMC free article] [PubMed] [Google Scholar]
- 14.Brilot A. F., Korostelev A. A., Ermolenko D. N., Grigorieff N., Structure of the ribosome with elongation factor G trapped in the pretranslocation state. Proc. Natl. Acad. Sci. U.S.A. 110, 20994–20999 (2013). [DOI] [PMC free article] [PubMed] [Google Scholar]
- 15.Pan D., Kirillov S. V., Cooperman B. S., Kinetically competent intermediates in the translocation step of protein synthesis. Mol. Cell 25, 519–529 (2007). [DOI] [PMC free article] [PubMed] [Google Scholar]
- 16.Fei J., Kosuri P., MacDougall D. D., Gonzalez R. L. Jr, Coupling of ribosomal L1 stalk and tRNA dynamics during translation elongation. Mol. Cell 30, 348–359 (2008). [DOI] [PubMed] [Google Scholar]
- 17.Munro J. B., Altman R. B., N. O’Connor, Blanchard S. C., Identification of two distinct hybrid state intermediates on the ribosome. Mol. Cell 25, 505–517 (2007). [DOI] [PMC free article] [PubMed] [Google Scholar]
- 18.Ermolenko D. N., Majumdar Z. K., Hickerson R. P., Spiegel P. C., Clegg R. M., Noller H. F., Observation of intersubunit movement of the ribosome in solution using FRET. J. Mol. Biol. 370, 530–540 (2007). [DOI] [PubMed] [Google Scholar]
- 19.Chen J., Petrov A., Tsai A., O’Leary S. E. and Puglisi J. D., Coordinated conformational and compositional dynamics drive ribosome translocation. Nat. Struct. Mol. Biol. 20, 718–727 (2013). [DOI] [PMC free article] [PubMed] [Google Scholar]
- 20.Voorhees R. M., Schmeing T. M., Kelley A. C. and Ramakrishnan V., The mechanism for activation of GTP hydrolysis on the ribosome. Science 330, 835–838 (2010). [DOI] [PMC free article] [PubMed] [Google Scholar]
- 21.Liljas A., Ehrenberg M., Aqvist J., Comment on “The mechanism for activation of GTP hydrolysis on the ribosome”. Science 333, 37 (2011). [DOI] [PubMed] [Google Scholar]
- 22.Wallin G., Kamerlin S. C., Aqvist J., Energetics of activation of GTP hydrolysis on the ribosome. Nat. Commun. 4, 1733 (2013). [DOI] [PubMed] [Google Scholar]
- 23.Voorhees R. M., Ramakrishnan V., Structural basis of the translational elongation cycle. Annu. Rev. Biochem. 82, 203–236 (2013). [DOI] [PubMed] [Google Scholar]
- 24.Cunha B. R., Peske F., Holtkamp W., Wintermeyer W., Rodnina M. V., Dual use of GTP hydrolysis by elongation factor G on the ribosome. Translation 1, e24315 (2013). [DOI] [PMC free article] [PubMed] [Google Scholar]
- 25.Holtkamp W., Cunha C. E., Peske F., Konevega A. L., Wintermeyer W., Rodnina M. V., GTP hydrolysis by EF-G synchronizes tRNA movement on small and large ribosomal subunits. EMBO J. 33, 1073–1085 (2014). [DOI] [PMC free article] [PubMed] [Google Scholar]
- 26.Cool R. H., Parmeggiani A., Substitution of histidine-84 and the GTPase mechanism of elongation factor Tu. Biochemistry 30, 362–366 (1991). [DOI] [PubMed] [Google Scholar]
- 27.Scarano G., Krab I. M., Bocchini V., Parmeggiani A., Relevance of histidine-84 in the elongation factor Tu GTPase activity and in poly(Phe) synthesis: Its substitution by glutamine and alanine. FEBS Lett. 365, 214–218 (1995). [DOI] [PubMed] [Google Scholar]
- 28.Gao Y. G., Selmer M., Dunham C. M., Weixlbaumer A., Kelley A. C., Ramakrishnan V., The structure of the ribosome with elongation factor G trapped in the posttranslocational state. Science 326, 694–699 (2009). [DOI] [PMC free article] [PubMed] [Google Scholar]
- 29.Frank J., Gao H., Sengupta J., Gao N., Taylor D. J., The process of mRNA–tRNA translocation. Proc. Natl. Acad. Sci. U.S.A. 104, 19671–19678 (2007). [DOI] [PMC free article] [PubMed] [Google Scholar]
- 30.Munro J. B., Wasserman M. R., Altman R. B., Wang L., Blanchard S. C., Correlated conformational events in EF-G and the ribosome regulate translocation. Nat. Struct. Mol. Biol. 17, 1470–1477 (2010). [DOI] [PMC free article] [PubMed] [Google Scholar]
- 31.Zhou J., Lancaster L., Donohue J. P., Noller H. F., How the ribosome hands the A-site tRNA to the P site during EF-G–catalyzed translocation. Science 345, 1188–1191 (2014). [DOI] [PMC free article] [PubMed] [Google Scholar]
- 32.Mandava C. S., Peisker K., Ederth J., Kumar R., Ge X., Szaflarski W., Sanyal S., Bacterial ribosome requires multiple L12 dimers for efficient initiation and elongation of protein synthesis involving IF2 and EF-G. Nucleic Acids Res. 40, 2054–2064 (2012). [DOI] [PMC free article] [PubMed] [Google Scholar]
- 33.Huang C., Mandava C. S., Sanyal S., The ribosomal stalk plays a key role in IF2-mediated association of the ribosomal subunits. J. Mol. Biol. 399, 145–153 (2010). [DOI] [PubMed] [Google Scholar]
- 34.Koripella R. K., Chen Y., Peisker K., Koh C. S., Selmer M., Sanyal S., Mechanism of elongation factor-G-mediated fusidic acid resistance and fitness compensation in Staphylococcus aureus. J. Biol. Chem. 287, 30257–30267 (2012). [DOI] [PMC free article] [PubMed] [Google Scholar]
- 35.Carragher B B., Kisseberth N., Kriegman D., Milligan R. A., Potter C. S., Pulokas J., Reilein A., Leginon: An automated system for acquisition of images from vitreous ice specimens. J. Struct. Biol. 132, 33–45 (2000). [DOI] [PubMed] [Google Scholar]
- 36.Mindell J. A., Grigorieff N., Accurate determination of local defocus and specimen tilt in electron microscopy. J. Struct. Biol. 142, 334–347 (2003). [DOI] [PubMed] [Google Scholar]
- 37.Jiang W., Guo F., Liu Z., A graph theory method for determination of cryo-EM image focuses. J. Struct. Biol. 180, 343–351 (2012). [DOI] [PMC free article] [PubMed] [Google Scholar]
- 38.Scheres S. H., RELION: Implementation of a Bayesian approach to cryo-EM structure determination. J. Struct. Biol. 180, 519–530 (2012). [DOI] [PMC free article] [PubMed] [Google Scholar]
- 39.Rosenthal P. B., Henderson R., Optimal determination of particle orientation, absolute hand, and contrast loss in single-particle electron cryomicroscopy. J. Mol. Biol. 333, 721–745 (2003). [DOI] [PubMed] [Google Scholar]
- 40.Kucukelbir A., Sigworth F. J., Tagare H. D., Quantifying the local resolution of cryo-EM density maps. Nat. Methods 11, 63–65 (2014). [DOI] [PMC free article] [PubMed] [Google Scholar]
- 41.Trabuco L. G., Villa E., Mitra K., Frank J., Schulten K., Flexible fitting of atomic structures into electron microscopy maps using molecular dynamics. Structure 16, 673–683 (2008). [DOI] [PMC free article] [PubMed] [Google Scholar]
Associated Data
This section collects any data citations, data availability statements, or supplementary materials included in this article.
Supplementary Materials
Supplementary material for this article is available at http://advances.sciencemag.org/cgi/content/full/1/4/e1500169/DC1
Fig. S1. Gallery of four cryo-EM maps obtained by classification.
Fig. S2. Examples for map fittings.
Fig. S3. Density for GTP in the nonrotated complex.
Fig. S4. Interaction of protein S12 with domain III.
Fig. S5. Densities linking domain III to IV and domain II to V in our maps.
Fig. S6. Three-stage (I, II, III) classification of the entire data set using RELION.
Fig. S7. Color code for the resolution values in the movie showing the local resolution map.
Movie S1. Overview and local resolution estimation for the 3.6-Å map.
Movie S2. Examples of high-resolution protein features in the 3.6-Å map.
Movie S3. Examples of high-resolution RNA features in the 3.6-Å map.


