Our work identified a porosity index biomarker that strongly correlated with actual volumetric cortical bone porosity.
Abstract
Purpose
To develop a method to assess volumetric cortical bone porosity in clinically practical acquisition times by measuring the signal decay at only two echo times (TEs) as part of a single three-dimensional ultrashort TE (UTE) magnetic resonance (MR) examination.
Materials and Methods
The study was approved by the institutional review board and complied with HIPAA guidelines. Written informed consent was obtained from all subjects. A marker of cortical bone porosity called porosity index was defined as the ratio of UTE image intensities at a long and short TE, and the results were compared with biexponential analysis. Porosity index of midtibia cortical bone samples obtained from 16 donors was compared with ground-truth porosity by using micro–computed tomographic (CT) imaging and bone mineral density by peripheral quantitative CT scanner. Reproducibility of porosity index were tested in volunteers, and clinical feasibility was evaluated in postmenopausal women. Interparameter associations were assessed by using Pearson or Spearman correlation coefficient.
Results
Bone specimen porosity index was correlated with micro-CT imaging porosity (R2 = 0.79) and pore size (R2 = 0.81); age (R2 = 0.64); peripheral quantitative CT scanner density (R2 = 0.49, negatively); and pore water fraction (R2 = 0.62) and T2* (R2 = 0.64) by biexponential analysis. The reproducibility study yielded a coefficient of variation of 2.2% and intraclass correlation coefficient of 0.97. The study that involved postmenopausal women showed a wide range of porosity index (15%–38%).
Conclusion
A two-point MR imaging method to assess cortical bone porosity in humans was conceived and validated. This approach has the potential for clinical use to assess changes in cortical bone porosity that result from disease or in response to therapy.
© RSNA, 2015
Introduction
For clinical diagnosis of osteoporosis and fracture risk assessment on the basis of dual-energy x-ray absorptiometry, the role of cortical bone is largely disregarded. However, loss of cortical bone mass is attributed to most fractures that occur after age 65 years (1), and there is a 13-fold increase in femoral neck fracture risk from ages 60 to 80 years (2).
Cortical porosity is a major determinant of overall bone strength (3), which explains over 80% of the total variation in the Young modulus (4). Impaired cortical bone strength is primarily a consequence of increased porosity more than of changes in mineralization or mechanical properties of the bone matrix (5–7). Cortical bone porosity increases as a consequence of aging (6,8) and of disease (ie, hyperparathyroidism [9], primary osteoporosis [10,11], secondary osteoporosis caused by steroids [12], and diabetes [13–15]).
Recognizing the role of cortical bone in metabolic bone disease, several techniques were recently proposed for in vivo assessment of cortical porosity by using high-resolution peripheral quantitative computed tomographic (CT) imaging (1,16–19). Despite these advances, cortical bone porosity assessment with high-resolution peripheral quantitative CT imaging has several challenges, including underestimation of porosity because only relatively large pores that are present mostly near the endosteum can be resolved by direct imaging because of limited spatial resolution of approximately 130 μm (14). We note that the cortical bone pore network consists of Haversian and Volkmann canals (∼40 to 100 μm), osteocyte lacunae (∼10 to 30 μm), and canaliculi (∼0.1 μm) (20–22).
Ultrashort echo time (TE) (UTE) magnetic resonance (MR) imaging allows for the assessment of cortical bone by using detection of proton signal from mobile water in pore spaces (ie, pore water) and water bound to collagen matrix by hydrogen bonds (ie, bound water) (23–27). Furthermore, proton nuclear MR spectroscopic imaging of cadaveric human cortical bone suggests that the bound water fraction with short T2 (∼300 to 400 μsec) and pore water fraction with longer T2 values (∼1 msec to 1 second) are positively and negatively associated with bone strength, respectively (28).
Horch et al (29) proposed methods to obtain signal from predominantly bound or pore water that incorporated T2 selective single or double adiabatic inversion pulses, respectively, to a UTE imaging sequence. Biswas et al (30) proposed another method to separate bound and pore water signals via biexponential analysis of the UTE MR imaging signal decay by using a range of TEs by exploiting the hypothesized differences in T2* relaxation times between the two water components. Feasibility of implementing these methods on clinical 3-T whole-body MR imagers was demonstrated, but it involved relatively long clinical imaging times (>30 minutes) (31,32). More recently, Li et al (33) proposed a biomarker called suppression ratio (ie, the ratio of UTE MR imaging signal amplitude obtained without pore water suppression/the signal with suppression) to indirectly assess bound and free water. This method, however, allows only two-dimensional analysis in vivo to avoid long imaging time.
The aim of our study was to develop a method to assess volumetric cortical bone porosity in clinically practical imaging times by measuring the signal decay at only two TEs as part of a single three-dimensional UTE MR examination.
Materials and Methods
The study was approved by the institutional review board and complied with Health Insurance Portability and Accountability Act guidelines. Written informed consent was obtained from all participants.
Bone Specimens
Sixteen whole human tibiae were obtained from donors (nine female donors [median age, 65 years; range, 27–97 years]; seven male donors [median age, 69 years; range, 37–93 years]) and stored frozen at −30°C until they were further processed. Whole cross-section specimens, 36-mm thick, were cut at distance 38% proximal to distal endplate from a thawed tibia by using a Hall pneumatic reciprocating saw. The specimens were stored in phosphate-buffered saline (12 mmol of saline per liter of buffer) solution at 4°C before imaging.
UTE MR Imaging
The cortical bone specimens submerged in phosphate-buffered saline underwent three-dimensional UTE imaging by using a four-channel surface coil (Insight MR imaging, Worcester, Mass) in a 3-T whole-body imager (Siemens, Erlangen, Germany). Imaging parameters were as follows: field of view, 160 × 160 × 160 mm3; repetition time, 12 msec; flip angle, 12° with 20-μsec hard pulse duration; 50 000 half-projections distributed uniformly within a sphere (34); 190 readout points per projection; gradient ramp time, 240 μsec; and readout bandwidth, 125 kHz. Twenty-three UTE images were acquired at TEs of 50, 64, 80, 100, 130, 160, 200, 250, 320, 400, 500, 640, 800, 1000, 1300, 1600, 2000, 2500, 3200, 4000, 5000, 6400, and 7790 μsec. Total imaging time was 115 minutes. By using a three-dimensional fast-Fourier transform that was not uniform, UTE images were reconstructed onto a 320 × 320 × 320 matrix that corresponded to an isotropic 0.5-mm voxel size.
We defined the following two analysis regions: compact-appearing cortex that excluded the trabecularized transition zone, which was labeled the cortical bone region, and entire bone region outside of the medullary (marrow) cavity, which was labeled the total bone region.
Assessment of Porosity
We referred to a biomarker of cortical bone porosity as porosity index. It was defined as the following ratio between a long TE (shown in the equation as TElong) and the shortest TE (shown in the equation as TEshort) UTE image intensities:
The underlying idea is that the first echo obtained at the shortest possible TE contains the proton signal from all water and the second echo obtained at much longer TE predominantly results from pore water. The short TE value was chosen to obtain the maximum combined proton signal that resulted from bound water (T2*, ∼300 μsec) and pore water (T2*, >1 msec). At long TE, however, the detected proton signal is essentially derived from water that resides in pore spaces because the shorter T2* components should have negligible amplitude (<5%). We used images acquired at TE of 2000 μsec and 50 μsec as respective long and short TE images. Porosity index was calculated as the average over the whole cortical or total bone volume.
Bound and pore water fraction and T2* was assessed by biexponential fitting of the 23-echo UTE MR imaging data (Appendix E1 [online]).
The bone specimens were imaged on a Bruker micro-CT scanner (SkyScan 1172; Bruker microCT, Kontich, Belgium) by using the following imaging parameters: source voltage, 100 kV; source current, 100 μA; exposure time, 5.89 seconds; angular increment, 0.04°; 4877 views; acquisition time, 50 hours; and isotropic voxel size, 8.63 μm.
Micro-CT Porosity Assessment
The solid phase of cortical bone was segmented from the background and pore spaces by selecting a threshold value at the midpoint of the two peaks that corresponded to bone tissue and pores on the intensity histogram. Cortical and total bone regions were defined analogous to the MR imaging analysis by excluding and including the trabecular cortex, respectively. Porosity was calculated as the ratio of the pore volume to total analysis volume.
Micro-CT Pore Size Analysis
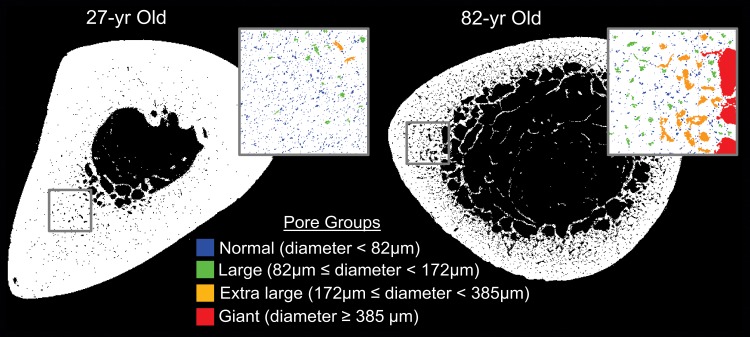
Segmented micro-CT images at the center of each specimen were analyzed by using a flood-fill algorithm. Pores were divided into four groups: normal (diameter, <82 μm), large (diameter, 82 to <172 μm), extra large (diameter, 172 to <385 μm), and giant (diameter, ≥385 μm) (10). The porosity contribution of each group to the total pore space was calculated as the volume fraction of each group.
Bone mineral density was measured with peripheral quantitative CT imaging by using 2.3-mm axial sections to cover the entire 36-mm sample at 0.4-mm in-plane voxel size on a peripheral quantitative CT scanner (Stratec XCT 2000; Orthometrix, White Plains, NY).
Reproducibility in Healthy Volunteers
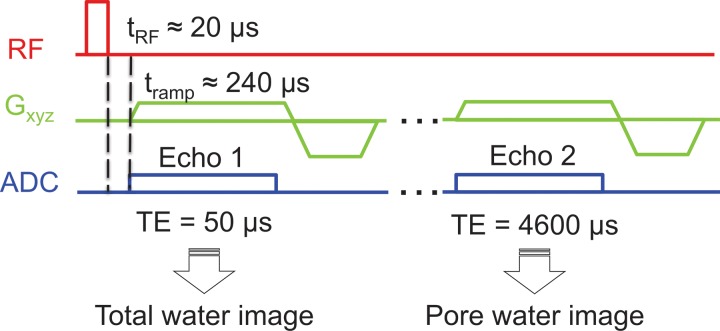
Five healthy volunteers (two women and three men; age range, 26–41 years) were imaged three times within 5 days in different imaging sessions. The imaging slab was centered at 38% of the total length of the tibia, measured proximally from the medial malleolus to match the image locations in the ex vivo study. Imaging was performed by using the same radiofrequency coil and UTE parameters described above for the specimen study, but by restricting the number of echoes to only two (TE, 50 μsec and 4600 μsec) that were obtained in a single 10-minute examination (Fig 1). The second TE was set at 4600 μsec so that both TEs were within the same radiofrequency excitation, which thereby limited the total acquisition time to 10 minutes. Porosity index was computed as described. Porosity index was converted to absolute porosity by using the linear relationship between porosity index (derived from TEs of 50 μsec and 4000 μsec) and micro-CT imaging porosity values from the specimen study as the calibration curve.
Figure 1:
Graph shows three-dimensional UTE pulse sequence used to generate total and pore water images by sampling two TEs in the same acquisition for in vivo studies. Dashed vertical lines represent the switching delay from “transmit” mode to “receive” mode. ADC = analog-to-digital conversion, Gxyz = magnetic field gradients, μs = μsec, RF = radiofrequency pulses, tramp = ramp time, tRF = radiofrequency pulse duration.
Clinical Feasibility Study in Postmenopausal Women
To evaluate the feasibility of the use of the proposed method to assess cortical porosity, the same MR imaging protocol validated in bone specimens and reproducibility tested in healthy volunteers was incorporated into an ongoing translational patient study. Imaging and computation of porosity index was performed in 34 postmenopausal women (age range, 55–80 years) as described in the reproducibility section. Lumbar spine (L1-L4), total hip, and femoral neck bone mineral density were assessed by dual-energy x-ray absorptiometry by using a bone densitometer (Delphi Systems; Hologic, Bedford, Mass). Mean bone thickness of the cortical and total bone regions was calculated by modeling the periosteal and inner boundaries on each axial imaging section as concentric circles in which the radii were estimated from the respective encompassed areas (35).
Statistical Analysis
The normality of each parameter was tested by using the Shapiro-Wilk test. When parameters (porosity index, age, porosity, bone mineral density, pore size, T2*, and water fraction) were normally distributed, the Pearson correlation coefficient was computed. Otherwise, the Spearman correlation coefficient was used. Statistical significance of the difference between two correlation coefficients was assessed by using the Fisher r-to-z transformation. Comparison of regression slopes was performed by using the z test statistic (36). P values of less than .05 were considered to indicate statistical significance. The reproducibility of porosity index was assessed in terms of the coefficient of variation and intraclass correlation coefficient.
Results
Simulated Effect of Pore Water T2*
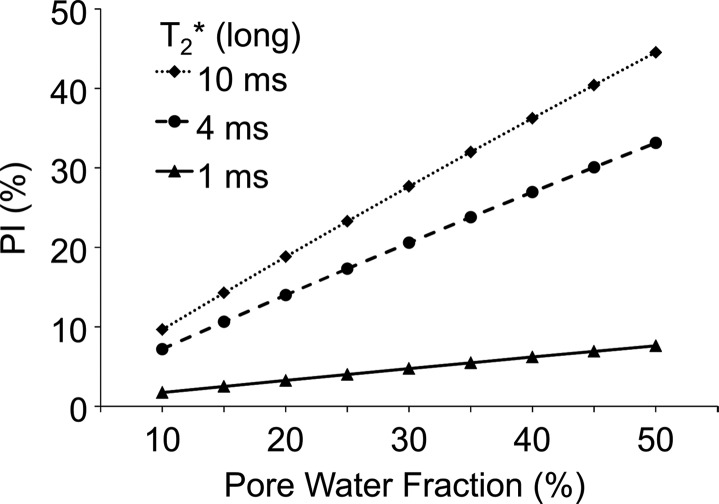
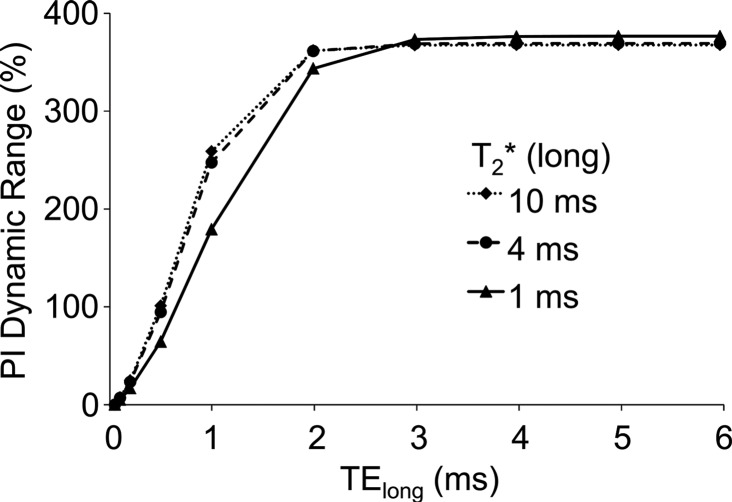
Porosity index increases linearly with porosity (Eq 3 [online]) at fixed T2* (ie, long TE) and nonlinearly with pore water T2* at fixed pore water fraction (Fig 2a). The dynamic range of porosity index increased with increasing long TE but plateaued beyond 2 msec, which was used as the optimum long TE for the ex vivo experiments (Fig 2b).
Figure 2a:
Graphs show simulations of the effect of pore water T2* on porosity index (PI) calculated on the basis of a dual-echo UTE sequence. (a) Association between porosity index and pore water fraction for pore water T2* range of 1–10 msec (ms). (b) Effect of the second TE (ie, long TE) on the dynamic range of porosity index, which shows negligible effect of pore water T2* range of 1–10 msec as long as long TE is greater than 2 msec. The dynamic range was defined as the percent difference in porosity index corresponding to 10% and 50% pore water fraction at each T2* value.
Figure 2b:
Graphs show simulations of the effect of pore water T2* on porosity index (PI) calculated on the basis of a dual-echo UTE sequence. (a) Association between porosity index and pore water fraction for pore water T2* range of 1–10 msec (ms). (b) Effect of the second TE (ie, long TE) on the dynamic range of porosity index, which shows negligible effect of pore water T2* range of 1–10 msec as long as long TE is greater than 2 msec. The dynamic range was defined as the percent difference in porosity index corresponding to 10% and 50% pore water fraction at each T2* value.
MR Imaging Porosity Index Validated with Micro-CT Porosity in Specimens
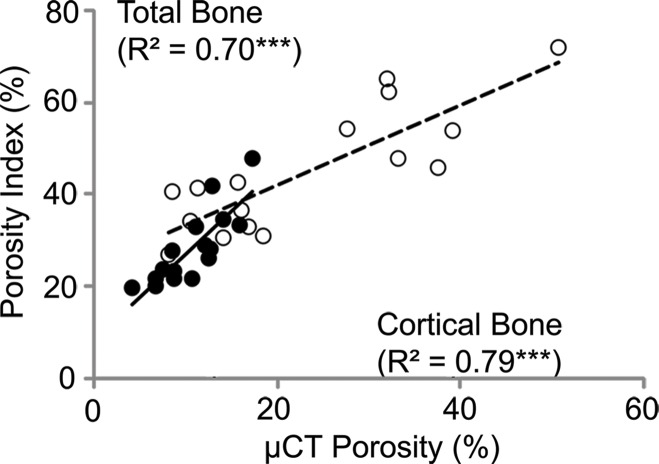
Porosity index was positively correlated with micro-CT–derived porosity (cortical bone: R2 = 0.79, P < .001; total bone: R2 = 0.70, P < .001; Fig 3a). Porosity index is linearly related to actual porosity (cortical bone region: porosity [%] = 2.2 + 0.37 × [porosity index]; and total bone region: porosity = −10 + 0.92 × [porosity index]).
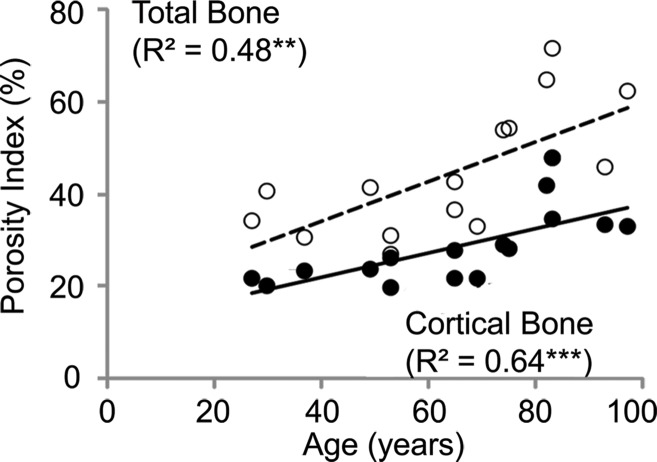
Figure 3a:
Correlations between porosity index and (a) micro-CT (μCT)–derived porosity, (b) age, and (c) peripheral quantitative CT (pQCT) scanner–derived bone mineral density obtained on the basis of cortical and total bone regions of midtibia specimens. Black dots represent data from the cortical region, white dots represent data from the total region, the solid line represents linear fitting of data from the cortical bone region, and the dashed line represents linear fitting of data from the total bone region. ** P < .005, *** P < .001.
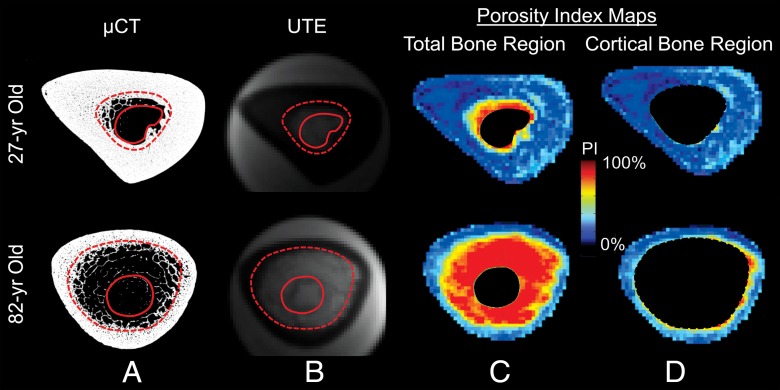
Porosity index was positively correlated with the age of the donor at death (cortical bone region: R2 = 0.64, P < .001; total bone region: R2 = 0.48, P = .004; Figs 3b, 4). Covariant analysis showed that the rate at which porosity increases with age is significantly greater in the endosteal regions compared with the compact-appearing cortex.
Figure 3b:
Correlations between porosity index and (a) micro-CT (μCT)–derived porosity, (b) age, and (c) peripheral quantitative CT (pQCT) scanner–derived bone mineral density obtained on the basis of cortical and total bone regions of midtibia specimens. Black dots represent data from the cortical region, white dots represent data from the total region, the solid line represents linear fitting of data from the cortical bone region, and the dashed line represents linear fitting of data from the total bone region. ** P < .005, *** P < .001.
Figure 4:
A, Midtibia micro-CT (μCT) images obtained from a 27-year-old and 82-year-old donor that illustrate age-related endocortical erosion and trabecularized cortex. The solid and dashed lines in A and B show the inner boundary used for the total bone and cortical bone analyses, respectively. B, UTE images that correspond to A. C, D, Porosity index (PI) maps of the, C, total bone and, D, cortical bone regions that show the spatial distribution of porosities in the entire cross-section of the bone that correspond to the high-resolution micro-CT images.
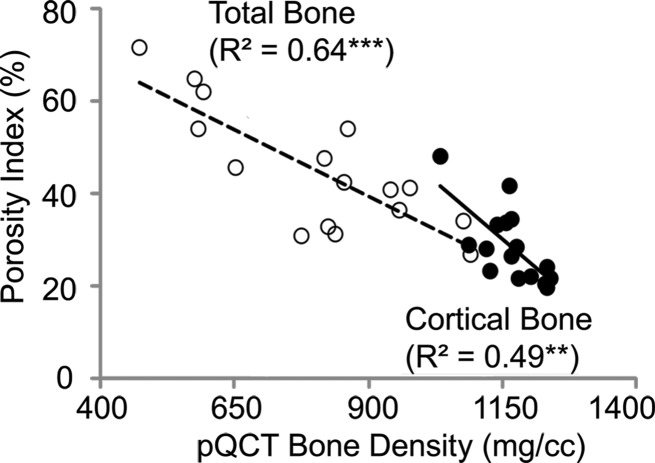
Porosity derived by using MR imaging was negatively correlated with bone mineral density of specimens derived by using peripheral quantitative CT imaging (cortical bone region: R2 = 0.49, P = .004; total bone region: R2 = 0.64, P < .001; Fig 3c).
Figure 3c:
Correlations between porosity index and (a) micro-CT (μCT)–derived porosity, (b) age, and (c) peripheral quantitative CT (pQCT) scanner–derived bone mineral density obtained on the basis of cortical and total bone regions of midtibia specimens. Black dots represent data from the cortical region, white dots represent data from the total region, the solid line represents linear fitting of data from the cortical bone region, and the dashed line represents linear fitting of data from the total bone region. ** P < .005, *** P < .001.
Porosity Index Compared with Biexponential Analysis in Specimens
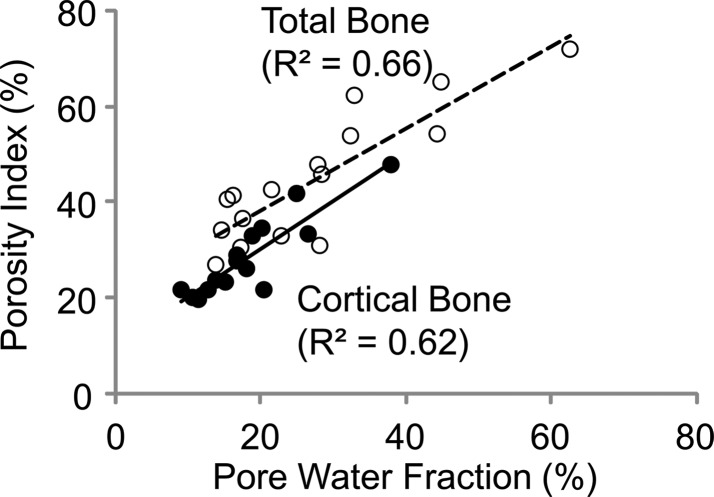
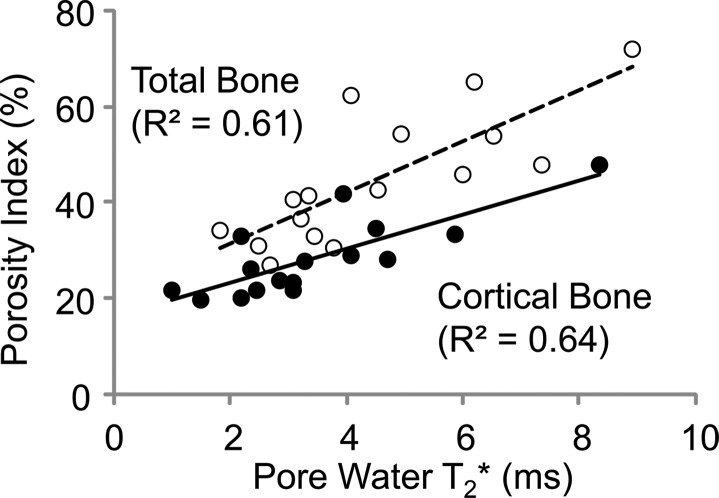
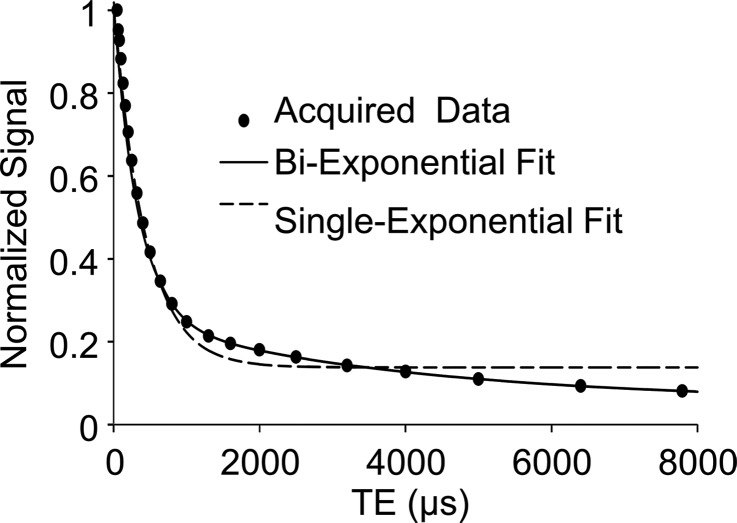
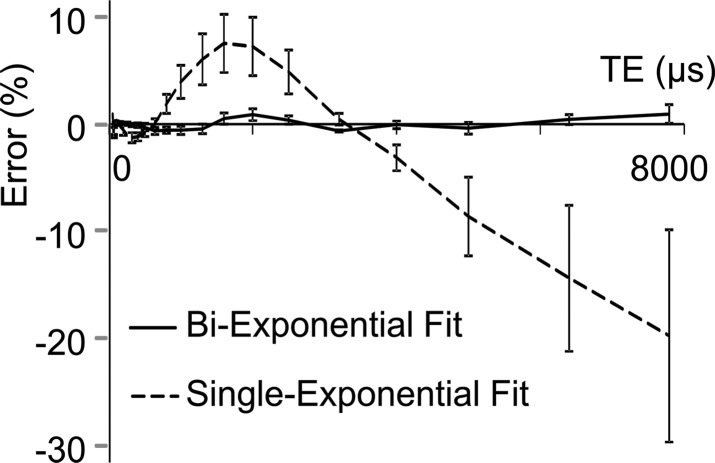
Porosity index was positively correlated with pore water fraction (cortical bone region: R2 = 0.62, P < .001; total bone region: R2 = 0.66, P < .001, Fig 5a) and pore water T2* (cortical bone region: R2 = 0.64, P < .001; total bone region: R2 = 0.61, P < .001; Fig 5b). The T2* distribution from bound water was relatively narrow compared with T2* distribution from pore water (Table). Biexponential fitting provided a closer match to UTE signal decay than did a single-exponential model, especially for TEs greater than 1 msec (Fig 5c, 5d).
Figure 5a:
Graphs show results from biexponential analysis in tibia specimens. Association of porosity index with (a) pore water fraction and (b) pore water T2* derived from biexponential analysis of multiecho UTE decay. In a and b, black dots represent data from the cortical region, white dots represent data from the total region, the solid line represents linear fitting of data from the cortical bone region, and the dashed line represents linear fitting of data from the total bone region. (c) A representative UTE signal decay that shows better agreement with biexponential fitting (R2 > 0.99) compared with single-exponential model ( R2 = 0.52) for TE greater than 1 msec. (d) Residual error for single and biexponential fitting at each TE in the cortical bone region. Vertical bars indicate the standard error of the means across all bone specimens.
Figure 5b:
Graphs show results from biexponential analysis in tibia specimens. Association of porosity index with (a) pore water fraction and (b) pore water T2* derived from biexponential analysis of multiecho UTE decay. In a and b, black dots represent data from the cortical region, white dots represent data from the total region, the solid line represents linear fitting of data from the cortical bone region, and the dashed line represents linear fitting of data from the total bone region. (c) A representative UTE signal decay that shows better agreement with biexponential fitting (R2 > 0.99) compared with single-exponential model ( R2 = 0.52) for TE greater than 1 msec. (d) Residual error for single and biexponential fitting at each TE in the cortical bone region. Vertical bars indicate the standard error of the means across all bone specimens.
T2* and Water Fraction Values

Note.—Data are means ± standard deviation. Data are derived from 16 specimens from donors (nine women and seven men; age range, 27–97 years) by using biexponential analysis.
Figure 5c:
Graphs show results from biexponential analysis in tibia specimens. Association of porosity index with (a) pore water fraction and (b) pore water T2* derived from biexponential analysis of multiecho UTE decay. In a and b, black dots represent data from the cortical region, white dots represent data from the total region, the solid line represents linear fitting of data from the cortical bone region, and the dashed line represents linear fitting of data from the total bone region. (c) A representative UTE signal decay that shows better agreement with biexponential fitting (R2 > 0.99) compared with single-exponential model ( R2 = 0.52) for TE greater than 1 msec. (d) Residual error for single and biexponential fitting at each TE in the cortical bone region. Vertical bars indicate the standard error of the means across all bone specimens.
Figure 5d:
Graphs show results from biexponential analysis in tibia specimens. Association of porosity index with (a) pore water fraction and (b) pore water T2* derived from biexponential analysis of multiecho UTE decay. In a and b, black dots represent data from the cortical region, white dots represent data from the total region, the solid line represents linear fitting of data from the cortical bone region, and the dashed line represents linear fitting of data from the total bone region. (c) A representative UTE signal decay that shows better agreement with biexponential fitting (R2 > 0.99) compared with single-exponential model ( R2 = 0.52) for TE greater than 1 msec. (d) Residual error for single and biexponential fitting at each TE in the cortical bone region. Vertical bars indicate the standard error of the means across all bone specimens.
Porosity Index and Pore Size
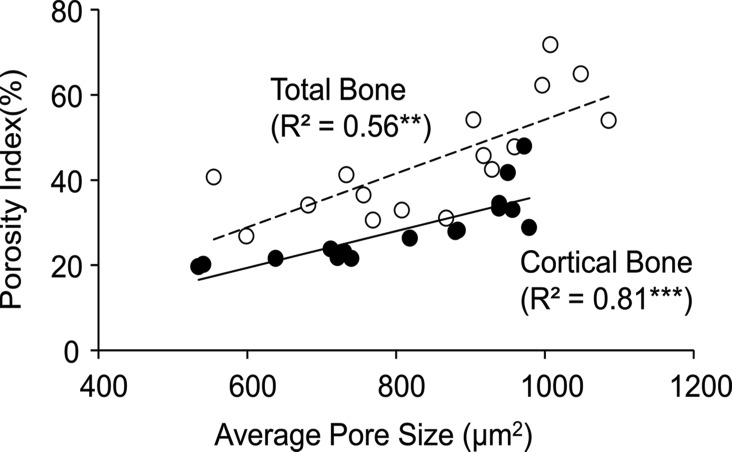
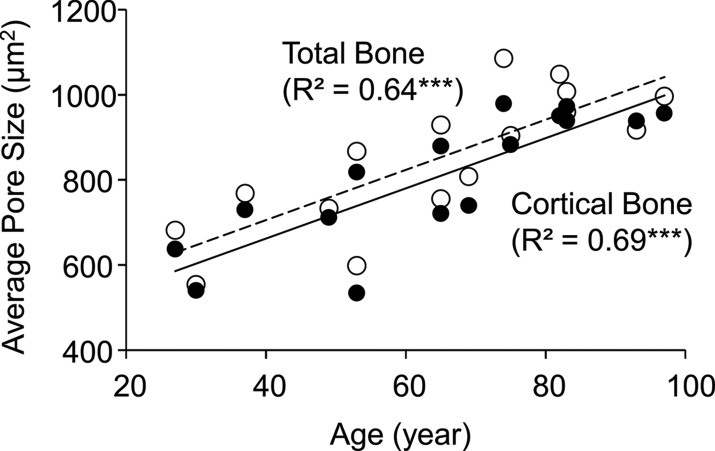
Average pore size derived by using micro-CT imaging was strongly correlated with porosity index (cortical bone region: R2 = 0.81, P < .001; total bone region: R2 = 0.56, P = .003; Fig 6a) and age (cortical bone region: R2 = 0.69, P < .001; total bone region: R2 = 0.64, P < .001; Fig 6b).
Figure 6a:
Graphs show association between micro-CT–derived average pore size (ie, mean cross-sectional pore area) in the tibial cortical bone region with (a) porosity index and (b) age. Black dots represent data from the cortical region, white dots represent data from the total region, the solid line represents linear fitting of data from the cortical bone region, and the dashed line represents linear fitting of data from the total bone region. ** P < .005, *** P < .001.
Figure 6b:
Graphs show association between micro-CT–derived average pore size (ie, mean cross-sectional pore area) in the tibial cortical bone region with (a) porosity index and (b) age. Black dots represent data from the cortical region, white dots represent data from the total region, the solid line represents linear fitting of data from the cortical bone region, and the dashed line represents linear fitting of data from the total bone region. ** P < .005, *** P < .001.
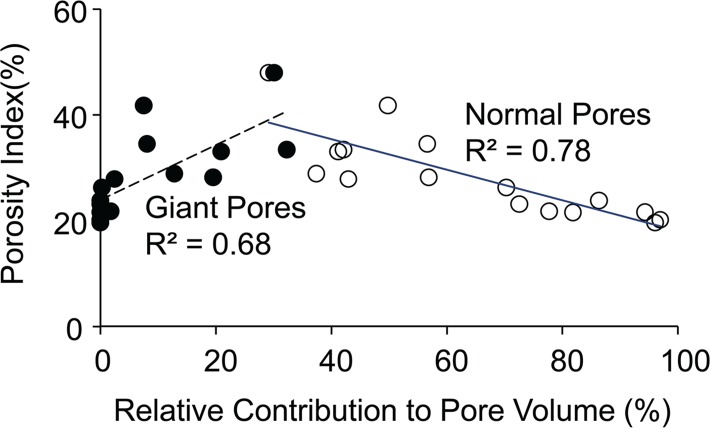
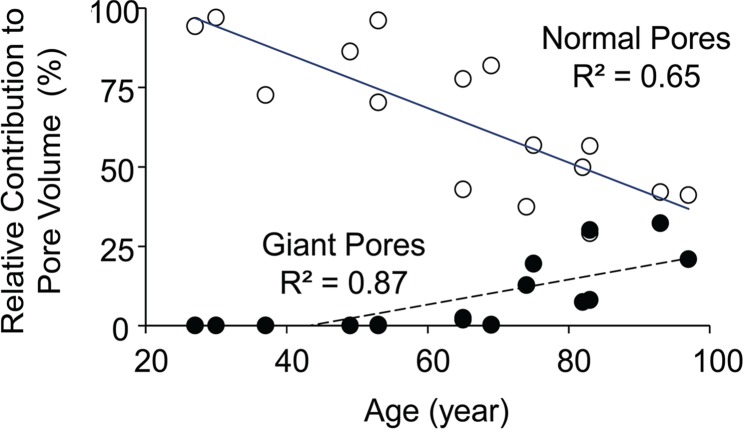
Porosity index was negatively correlated with the fraction of pore volume occupied by normal-size pores (cortical bone region: R2 = 0.78, P < .001; total bone region: R2 = 0.58, P = .003) and positively with giant pores (cortical bone region: R2 = 0.68, P < .001; total bone region: R2 = 0.51, P = .003; Fig 7a). Age was negatively correlated with the volume fraction of normal-size pores (cortical bone region: R2 = 0.65, P < .001; total bone region: R2 = 0.76, P < .001). However, the fraction occupied by giant pores was positively correlated with age (cortical bone region: R2 = 0.87, P < .001; total bone region: R2 = 0.75, P < .001; Fig 7b). Finally, high-resolution micro-CT images provide visual evidence of increased porosity and pore size when proceeding from the tibial periosteum to the endosteum (Fig 8).
Figure 7a:
Graphs show relative contribution of giant and normal pores to the total pore volume assessed on the basis of micro-CT images of tibia specimens in the cortical bone region and their association with (a) porosity index and (b) age. Black dots represent data from the cortical region, white dots represent data from the total region, the solid line represents linear fitting of data from the cortical bone region, and the dashed line represents linear fitting of data from the total bone region. P < .001.
Figure 7b:
Graphs show relative contribution of giant and normal pores to the total pore volume assessed on the basis of micro-CT images of tibia specimens in the cortical bone region and their association with (a) porosity index and (b) age. Black dots represent data from the cortical region, white dots represent data from the total region, the solid line represents linear fitting of data from the cortical bone region, and the dashed line represents linear fitting of data from the total bone region. P < .001.
Figure 8:
Micro-CT specimen images show cortical bone pore distributions in 27-year-old and 82-year-old donors. The boxes, color coded according to pore diameter, are enlarged regions that correspond to the regions of interest on the images, and they show that normal and large pores are the primary contributors to porosity in the younger donor compared with extra-large and giant pores in the older donor. Pores seem to increase in size from the periosteum to endosteum, especially in the older bone.
Preliminary in Vivo Studies
Porosity indices for the cohort of postmenopausal women were in the range of 15%–31% (20% ± 3.8%) and 24%–38% (30% ± 3.0%) for the cortical and total bone regions, respectively (Fig 9). Dual-energy x-ray absorptiometry bone mineral densities measured in the spine and femur were not significantly associated with porosity index. Cross-sectional cortical bone thickness was only weakly correlated with porosity index in the corresponding region (cortical bone thickness: R2 = 0.10, P = .08; total bone thickness: R2 = 0.14, P = .04). For repeated measurements of porosity index in healthy volunteers, the mean coefficient of variation in the cortical and total bone regions was, respectively, 2.2% and 2.0%, and the intraclass correlation coefficient in the cortical and total bone regions was, respectively, greater than 0.98 and 0.97.
Figure 9:

Representative volumetric porosity index (PI) histograms derived from midtibia cortical and total bone regions of three postmenopausal women show a range of porosities. Histogram frequencies are presented as the number of voxels in percentage in the corresponding bone region. The pictograms are associated with each graph and show the middle section porosity index maps.
Discussion
Our work identified the porosity index biomarker, which strongly correlates with actual volumetric cortical bone porosity. We showed the feasibility of volumetric porosity mapping in a large region of tibia diaphysis by using an in vivo MR imaging sequence that required only 10 minutes of acquisition time.
Data showed that porosity index in the total bone region can be as much as twofold greater than the compact-appearing cortical bone. Our approach allows for assessment of porosity in the entire cross section of the bone versus direct imaging based in vivo methods (eg, high-resolution peripheral quantitative CT imaging) that can help to resolve only large pores that are typically located near the medullary cavity.
The increase in porosity with aging is not only in the regions adjacent to the endosteum but also in the compact periosteal cortical ring. We also note that total bone porosity linearly increased during younger age followed by an upsurge in porosity after 60 years. A similar trend was previously observed in cadaveric bone studies by using histomorphometry (6,8) and in vivo by using high-resolution peripheral quantitative CT imaging (37). The rapid increase in porosity can be primarily attributed to the disproportionate increase in endocortical porosity because the compact-appearing cortex did not show such a dramatic change.
Previous studies that investigated the effect of age on bone porosity reported porosity values in the range of 5%–30% for the femoral diaphysis (6), 2%–20% for the proximal humerus (8), and 2%–20% for the distal radius (37). Data from our study show that between the age of 30 and 100 years, porosity in the tibial diaphysis increases approximately threefold (5%–15%) in the compact-appearing cortex and eightfold (5%–40%) when trabecular regions are included, and this increase is dependent on the analysis region. These differences emphasize the influence of the analysis region when cortical bone porosity measurements from different studies are compared.
Pore-size analysis conclusively shows that the increased porosity at older age is predominantly a consequence of the expansion of existing pores rather than formation of new pores. Consequently, decreased normal pore volume fraction and increased giant pore volume fraction are inversely related to each other and not independent processes of aging. Our finding is consistent with that by Stein et al (38), who reported that increased porosity with aging in the human femoral diaphysis is because of greater proportion of larger pores. Previous studies by Broulik et al (39) and Brockstedt et al (40) also found that iliac crest haversian canal size correlated with age.
Porosity assessed by biexponential analysis of the UTE signal from 23 TEs, which required 115 minutes of acquisition time, was not significantly better than our approach, which required only two TEs acquired in a 10-minute examination, compared with porosity derived from micro-CT imaging as the standard with a Fisher r-to-z transformation. Furthermore, the high correlation between porosity index and results from biexponential analysis suggests that it is possible to assess cortical pore water fraction by using a clinically practical dual-echo UTE sequence.
Du et al (41) determined with biexponential analysis that pore water fraction in the midtibia human cortical bone (donor age range, 28–85 years) was approximately 22%, but Horch et al (42) also reported a similar value (23%) in midfemoral cortex (donor age range, 21–94 years) by using a Carr-Purcell-Meiboom-Gill sequence. Our data show the pore water fraction to be highly dependent on donor age and analysis region, ranging from 8% to 40% in the cortical bone region and from 12% to 65% in the total bone region.
The bound water T2* values found in our study closely match those reported by Du et al (41) (ie, 350 μsec) with biexponential analysis of bone specimens. For pore water T2*, however, Du et al reported a narrow range around 2.6 msec, and our data showed a considerably greater range of 1–9 msec. The wider range of pore water T2* values found in our study can be attributed to the wide spectrum of pore sizes, especially in specimens obtained from older donors, in accordance with increased T2* with decreased surface-to-volume ratio of pores (43,44).
Porosity index is modulated not only by total pore volume, but also pore size distribution. Because water in larger pores has longer T2*, bone with fewer but larger pores would have a higher porosity index than bone with more numerous but smaller pores. If total pore volume were to change while at constant pore size, T2* would not be altered because it is governed by surface-to-volume ratio. Thus, increased T2* with increased porosity is direct evidence of the increase in pore size. The pore-size dependence may enhance the use of porosity index because larger pores have a greater adverse effect on cortical bone mechanical competence than smaller pores (10). The positive association of pore water fraction and T2* with porosity index is consistent with the notion of increased T2* of pore water in large mobile water pools because the relaxation rate decreases with a decrease in surface-to-volume ratio (43,44).
One could argue that porosity can be indirectly assessed by simply measuring the bone mineral density and by using the inverse relationship between the two measures. Our data show that bone mineral density obtained by using peripheral quantitative CT imaging in bone specimens only partially explains the variation in porosity, which highlights the need to measure porosity independent of bone mineral density.
Because porosity index is computed as the ratio between pore water image (ie, the image obtained with second echo) and total water image (ie, the image obtained with echo 1), the parameter has self-normalizing properties, which thereby minimizes the effect of variations in both radiofrequency and static field inhomogeneity and signal-to-noise ratio on the porosity index maps. Furthermore, porosity index calculation does not involve often ill-posed Laplace inversion.
For the ex vivo validation and in vivo components of the study, we used the same MR imager, radiofrequency coil, imaging volume, and analysis method. Ex vivo validation was performed on whole cross-sectional midtibia samples that approximately covered a region imaged in vivo. Our data show that cortical porosity variation across the cross section of the bone is not uniform across participants. Therefore, analysis of the porosity in a small subregion of bone may not necessarily be representative of the whole bone.
The study is not without limitations. The resolution of micro-CT images did not allow the quantification of pores less than 8.6 μm. Our micro-CT imaging time for each bone sample involved approximately 50 hours of continuous imaging to achieve that resolution in a large volume of bone (36 mm), which resulted in data sizes that were over 200 GB. Further improvement in resolution could have substantially increased the imaging and analysis times. Nevertheless, pores not shown with our micro-CT images are likely to have a negligible contribution to overall porosity. We used a TE of 50 μsec for the first echo in the porosity index measurements because this was the minimum allowed on our imager. Ideally, the first TE should be kept as short as possible to minimize the decay of total bone water signal. However, the signal loss at 50 μsec is only approximately 1% for the free water component (average T2*, ∼4 msec) and approximately 14% for the bound water component (T2*, ∼330 μsec). The timing of the second echo has more flexibility, but the requirement is that signal from pore water is present and all other water components have decayed almost completely. With current instrumentation, a TE of 4.6 msec allows for sampling of the second echo in a single acquisition together with the short echo so that the bound water signal has decayed to almost completely while still retaining more than 30% of the pore water signal.
With this study, we conceived and validated a two-point MR imaging method to assess cortical bone porosity in humans. Our approach has the potential to be used clinically to assess changes in cortical bone porosity because of disease or in response to therapy.
Advances in Knowledge
■ Ultrashort echo time (TE) (UTE) MR imaging-based biomarker of volumetric cortical bone porosity, defined as porosity index, is correlated with donor age, actual porosity, pore size, bone mineral density, pore-water fraction, and pore-water T2*.
■ Biexponential fitting shows a closer match to UTE signal decay than single-exponential model, especially for TEs greater than 1 msec, which suggests that a long T2* water component exists.
■ Between age 30 and 100 years, porosity in the tibial diaphysis increases approximately threefold in the compact-appearing cortex and eight-fold when the trabecular regions are included.
■ While the bound-water T2* is relatively constant around 330 μsec in midtibia cortical bone, pore-water T2* (1–9 msec) and pore-water fraction (10%–60%) show wide distributions.
■ With aging, cortical bone porosity increases primarily because of the expansion of normal-size pores, not because of emergence of new pores.
Implication for Patient Care
■ Porosity index may be suited for evaluation of the effect of metabolic bone disease and response to treatment on cortical bone.
APPENDIX
Received August 4, 2014; revision requested September 23; revision received November 20; accepted December 1; final version accepted December 23.
The content is solely the responsibility of the authors and does not necessarily represent the official views of the National Institutes of Health.
Funding: This research was supported by the National Institutes of Health (grants K25 AR 060283, R01 AR 50068, and R03 AR 064577).
Abbreviations:
- TE
- echo time
- UTE
- ultrashort TE
Disclosures of Conflicts of Interest: C.S.R. disclosed no relevant relationships. M.B.Z. disclosed no relevant relationships. C.L. disclosed no relevant relationships. W.S. disclosed no relevant relationships. A.C.W. disclosed no relevant relationships. F.W.W. disclosed no relevant relationships.
References
- 1.Zebaze RM, Ghasem-Zadeh A, Bohte A, et al. Intracortical remodelling and porosity in the distal radius and post-mortem femurs of women: a cross-sectional study. Lancet 2010;375(9727):1729–1736. [DOI] [PubMed] [Google Scholar]
- 2.De Laet CE, van Hout BA, Burger H, Hofman A, Pols HA. Bone density and risk of hip fracture in men and women: cross sectional analysis. BMJ 1997;315(7102):221–225. [DOI] [PMC free article] [PubMed] [Google Scholar]
- 3.Schaffler MB, Burr DB. Stiffness of compact bone: effects of porosity and density. J Biomech 1988;21(1):13–16. [DOI] [PubMed] [Google Scholar]
- 4.Currey JD. The effect of porosity and mineral content on the Young’s modulus of elasticity of compact bone. J Biomech 1988;21(2):131–139. [DOI] [PubMed] [Google Scholar]
- 5.Martin RB, Ishida J. The relative effects of collagen fiber orientation, porosity, density, and mineralization on bone strength. J Biomech 1989;22(5):419–426. [DOI] [PubMed] [Google Scholar]
- 6.McCalden RW, McGeough JA, Barker MB, Court-Brown CM. Age-related changes in the tensile properties of cortical bone. The relative importance of changes in porosity, mineralization, and microstructure. J Bone Joint Surg Am 1993;75(8):1193–1205. [DOI] [PubMed] [Google Scholar]
- 7.Roschger P, Gupta HS, Berzlanovich A, et al. Constant mineralization density distribution in cancellous human bone. Bone 2003;32(3):316–323. [DOI] [PubMed] [Google Scholar]
- 8.Laval-Jeantet AM, Bergot C, Carroll R, Garcia-Schaefer F. Cortical bone senescence and mineral bone density of the humerus. Calcif Tissue Int 1983;35(3):268–272. [DOI] [PubMed] [Google Scholar]
- 9.Vu TD, Wang XF, Wang Q, et al. New insights into the effects of primary hyperparathyroidism on the cortical and trabecular compartments of bone. Bone 2013;55(1):57–63. [DOI] [PMC free article] [PubMed] [Google Scholar]
- 10.Bell KL, Loveridge N, Jordan GR, Power J, Constant CR, Reeve J. A novel mechanism for induction of increased cortical porosity in cases of intracapsular hip fracture. Bone 2000;27(2):297–304. [DOI] [PubMed] [Google Scholar]
- 11.Dickenson RP, Hutton WC, Stott JR. The mechanical properties of bone in osteoporosis. J Bone Joint Surg Br 1981;63-B(2):233–238. [DOI] [PubMed] [Google Scholar]
- 12.Kanis JA, Johansson H, Oden A, et al. A meta-analysis of prior corticosteroid use and fracture risk. J Bone Miner Res 2004;19(6):893–899. [DOI] [PubMed] [Google Scholar]
- 13.Burghardt AJ, Issever AS, Schwartz AV, et al. High-resolution peripheral quantitative computed tomographic imaging of cortical and trabecular bone microarchitecture in patients with type 2 diabetes mellitus. J Clin Endocrinol Metab 2010;95(11):5045–5055. [DOI] [PMC free article] [PubMed] [Google Scholar]
- 14.Patsch JM, Burghardt AJ, Yap SP, et al. Increased cortical porosity in type 2 diabetic postmenopausal women with fragility fractures. J Bone Miner Res 2013;28(2):313–324. [DOI] [PMC free article] [PubMed] [Google Scholar]
- 15.Vestergaard P. Discrepancies in bone mineral density and fracture risk in patients with type 1 and type 2 diabetes—a meta-analysis. Osteoporos Int 2007;18(4):427–444. [DOI] [PubMed] [Google Scholar]
- 16.Burghardt AJ, Buie HR, Laib A, Majumdar S, Boyd SK. Reproducibility of direct quantitative measures of cortical bone microarchitecture of the distal radius and tibia by HR-pQCT. Bone 2010;47(3):519–528. [DOI] [PMC free article] [PubMed] [Google Scholar]
- 17.Goldenstein J, Kazakia G, Majumdar S. In vivo evaluation of the presence of bone marrow in cortical porosity in postmenopausal osteopenic women. Ann Biomed Eng 2010;38(2):235–246. [DOI] [PMC free article] [PubMed] [Google Scholar]
- 18.Kirmani S, Christen D, van Lenthe GH, et al. Bone structure at the distal radius during adolescent growth. J Bone Miner Res 2009;24(6):1033–1042. [DOI] [PMC free article] [PubMed] [Google Scholar]
- 19.Nishiyama KK, Macdonald HM, Buie HR, Hanley DA, Boyd SK. Postmenopausal women with osteopenia have higher cortical porosity and thinner cortices at the distal radius and tibia than women with normal aBMD: an in vivo HR-pQCT study. J Bone Miner Res 2010;25(4):882–890. [DOI] [PubMed] [Google Scholar]
- 20.Cowin SC. Bone mechanics handbook. 2nd ed. Boca Raton, Fla: CRC, 2001. [Google Scholar]
- 21.Gururaja S, Kim HJ, Swan CC, Brand RA, Lakes RS. Modeling deformation-induced fluid flow in cortical bone’s canalicular-lacunar system. Ann Biomed Eng 2005;33(1):7–25. [DOI] [PubMed] [Google Scholar]
- 22.Lemaire T, Naili S, Sansalone V. Multiphysical modelling of fluid transport through osteo-articular media. An Acad Bras Cienc 2010;82(1):127–144. [DOI] [PubMed] [Google Scholar]
- 23.Reichert IL, Robson MD, Gatehouse PD, et al. Magnetic resonance imaging of cortical bone with ultrashort TE pulse sequences. Magn Reson Imaging 2005;23(5):611–618. [DOI] [PubMed] [Google Scholar]
- 24.Robson MD, Gatehouse PD, Bydder M, Bydder GM. Magnetic resonance: an introduction to ultrashort TE (UTE) imaging. J Comput Assist Tomogr 2003;27(6):825–846. [DOI] [PubMed] [Google Scholar]
- 25.Techawiboonwong A, Song HK, Leonard MB, Wehrli FW. Cortical bone water: in vivo quantification with ultrashort echo-time MR imaging. Radiology 2008;248(3):824–833. [DOI] [PMC free article] [PubMed] [Google Scholar]
- 26.Techawiboonwong A, Song HK, Wehrli FW. In vivo MRI of submillisecond T(2) species with two-dimensional and three-dimensional radial sequences and applications to the measurement of cortical bone water. NMR Biomed 2008;21(1):59–70. [DOI] [PubMed] [Google Scholar]
- 27.Ni QW, Nyman JS, Wang XD, De Los Santos A, Nicolella DP. Assessment of water distribution changes in human cortical bone by nuclear magnetic resonance. Meas Sci Technol 2007;18(3):715–723. [Google Scholar]
- 28.Horch RA, Gochberg DF, Nyman JS, Does MD. Non-invasive predictors of human cortical bone mechanical properties: T(2)-discriminated H NMR compared with high resolution X-ray. PLoS ONE 2011;6(1):e16359. [DOI] [PMC free article] [PubMed] [Google Scholar]
- 29.Horch RA, Gochberg DF, Nyman JS, Does MD. Clinically compatible MRI strategies for discriminating bound and pore water in cortical bone. Magn Reson Med 2012;68(6):1774–1784. [DOI] [PMC free article] [PubMed] [Google Scholar]
- 30.Biswas R, Bae W, Diaz E, et al. Ultrashort echo time (UTE) imaging with bi-component analysis: bound and free water evaluation of bovine cortical bone subject to sequential drying. Bone 2012;50(3):749–755. [DOI] [PMC free article] [PubMed] [Google Scholar]
- 31.Du J, Bydder GM. Qualitative and quantitative ultrashort-TE MRI of cortical bone. NMR Biomed 2013;26(5):489–506. [DOI] [PMC free article] [PubMed] [Google Scholar]
- 32.Manhard MK, Horch RA, Harkins KD, Gochberg DF, Nyman JS, Does MD. Validation of quantitative bound- and pore-water imaging in cortical bone. Magn Reson Med 2014;71(6):2166–2171. [DOI] [PMC free article] [PubMed] [Google Scholar]
- 33.Li C, Seifert AC, Rad HS, et al. Cortical bone water concentration: dependence of MR imaging measures on age and pore volume fraction. Radiology 2014;272(3):796–806. [DOI] [PMC free article] [PubMed] [Google Scholar]
- 34.Wong ST, Roos MS. A strategy for sampling on a sphere applied to 3D selective RF pulse design. Magn Reson Med 1994;32(6):778–784. [DOI] [PubMed] [Google Scholar]
- 35.Rajapakse CS, Leonard MB, Bhagat YA, Sun W, Magland JF, Wehrli FW. Micro-MR imaging-based computational biomechanics demonstrates reduction in cortical and trabecular bone strength after renal transplantation. Radiology 2012;262(3):912–920. [DOI] [PMC free article] [PubMed] [Google Scholar]
- 36.Paternoster R, Brame R, Mazerolle P, Piquero A. Using the correct statistical test for the equality of regression coefficients. Criminology 1998;36(4):859–866. [Google Scholar]
- 37.Macdonald HM, Nishiyama KK, Kang J, Hanley DA, Boyd SK. Age-related patterns of trabecular and cortical bone loss differ between sexes and skeletal sites: a population-based HR-pQCT study. J Bone Miner Res 2011;26(1):50–62. [DOI] [PubMed] [Google Scholar]
- 38.Stein MS, Feik SA, Thomas CD, Clement JG, Wark JD. An automated analysis of intracortical porosity in human femoral bone across age. J Bone Miner Res 1999;14(4):624–632. [DOI] [PubMed] [Google Scholar]
- 39.Broulik P, Kragstrup J, Mosekilde L, Melsen F. Osteon cross-sectional size in the iliac crest: variation in normals and patients with osteoporosis, hyperparathyroidism, acromegaly, hypothyroidism and treated epilepsia. Acta Pathol Microbiol Immunol Scand [A] 1982;90(5):339–344. [PubMed] [Google Scholar]
- 40.Brockstedt H, Kassem M, Eriksen EF, Mosekilde L, Melsen F. Age- and sex-related changes in iliac cortical bone mass and remodeling. Bone 1993;14(4):681–691. [DOI] [PubMed] [Google Scholar]
- 41.Du J, Hermida JC, Diaz E, et al. Assessment of cortical bone with clinical and ultrashort echo time sequences. Magn Reson Med 2012 Sep 21. [Epub ahead of print] [DOI] [PubMed]
- 42.Horch RA, Nyman JS, Gochberg DF, Dortch RD, Does MD. Characterization of 1H NMR signal in human cortical bone for magnetic resonance imaging. Magn Reson Med 2010;64(3):680–687. [DOI] [PMC free article] [PubMed] [Google Scholar]
- 43.Brownstein KR, Tarr CE. Importance of classical diffusion in NMR studies of water in biological cells. Phys Rev A 1979;19(6):2446–2453. [Google Scholar]
- 44.Fantazzini P, Brown RJ, Borgia GC. Bone tissue and porous media: common features and differences studied by NMR relaxation. Magn Reson Imaging 2003;21(3-4):227–234. [DOI] [PubMed] [Google Scholar]
- 45.Du J, Diaz E, Carl M, Bae W, Chung CB, Bydder GM. Ultrashort echo time imaging with bicomponent analysis. Magn Reson Med 2012;67(3):645–649. [DOI] [PubMed] [Google Scholar]
Associated Data
This section collects any data citations, data availability statements, or supplementary materials included in this article.


