SUMMARY
The electrocardiogram (ECG) is one of the most significant outputs of a computational model of cardiac electrophysiology because it relates the numerical results to clinical data and is a universal tool for diagnosing heart diseases. One key feature of the ECG is the T-wave, which is caused by longitudinal and transmural heterogeneity of the action potential duration (APD). Thus, in order to model a correct wave of repolarization, different cell properties resulting in different APDs must be assigned across the ventricular wall and longitudinally from apex-to-base. To achieve this requirement, a regional parametrization of the heart is necessary. We propose a robust approach to obtain the transmural and longitudinal segmentation in a general heart geometry, without relying on ad hoc procedures. Our approach is based on auxiliary harmonic lifting analyses, already used in the literature to generate myocardial fiber orientations. Specifically, the solution of a sequence of Laplace boundary value problems allows parametrically controlled segmentation of both heart ventricles. The flexibility and simplicity of the proposed method is demonstrated through several representative examples, varying the locations and extents of the epicardial, midwall and endocardial layers. Effects of the control parameters on the T-wave morphology are illustrated via computed ECGs.
Keywords: Ventricular segmentation, Cardiac modeling, Harmonic lifting, T-wave, Repolarization dispersion
1. INTRODUCTION
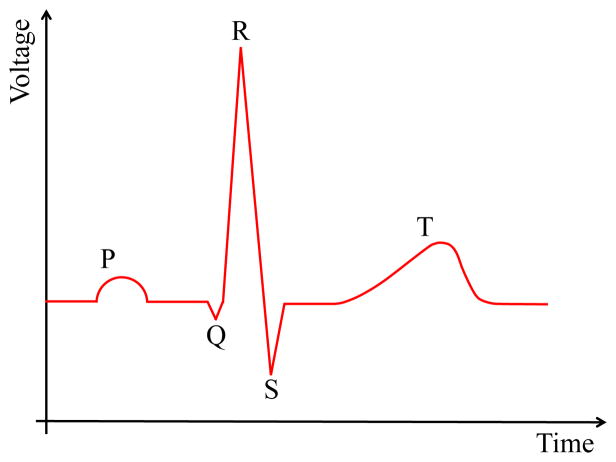
Numerical models of the heart electrophysiology (EP) are increasingly used to better understand the mechanisms governing the functioning of the heart in both healthy and failing, e.g., arrhythmic, conditions. The proposed models require to be validated by computing the Electrocardiogram (ECG), which is the most common clinical diagnostic tool to assess the electrical activity of the heart. During every beat, an electrical signal propagates through the myocardium. Its ensemble timing and strength can be evaluated at different positions (i.e., ECG lead positions) through an ECG recording. Each wave in the ECG (Fig. 1) captures a particular electrical event, which occurs during a heart beat. Normal atrial depolarization is described by the P wave. The QRS segment characterizes the depolarization of the left and right ventricles. The T-wave (wave of repolarization) is related to the repolarization of the ventricles. In particular, the morphology of the T-wave plays a key role in identifying cardiac diseases and, as such, should be modeled accurately. For example, hyperkalemia is related to peaked symmetric T-waves [1], hypokalemia leads to flattened T-waves [2], ST segment elevation may indicate ischemia [3] or other pathological conditions [4], and T-wave alternans is related to the risk of ventricular arrhythmia [5].
Figure 1.
Idealized ECG signal with marked P,Q,R,S and T-waves.
Several studies have focused on understanding the physiological causes of the T-wave in the ECG. Higuchi and Nakaya [6] investigated experimentally the origin of upright and negative T-waves by recording a unipolar epicardial ECG while changing the APD through modification of the temperature of the epicardial surface. They inferred that the amplitude of the T-wave increased with increasing transmural (Endo to Epi) APD gradient. Subsequent studies (e.g., [7]) supported their findings and identified the central role of transmural and apex-to-base APD gradients in governing the T-wave morphology. Specifically, the T-wave is caused by the fact that the first cells to depolarize are the last to repolarize. This relation is known as the Franz relationship [7].
The origin of the T-wave morphology has also been modeled and studied numerically. Given its importance in diagnosing and understanding heart diseases, a large number of numerical T-wave related studies have been published in the literature (e.g., [8, 9, 10, 11, 12], to cite only a few) and in the following we provide only a few examples, representative of different modeling strategies. A first approach (e.g., [13]) to model upright T-waves is based on the aforementioned Franz relationship and consists in assigning the repolarization starting time at a given location according to the time at which depolarization occurs at the same location. This approach does not require a heart segmentation into transmural and apex-to-base regions but is phenomenological in nature; it does not link regional differences in action potential to the underlying physiological mechanisms at the cell level. A similar approach consists in assigning the repolarization starting times on the endocardial and epicardial surfaces based on experimental data [14]. The surface repolarization times are then linearly interpolated to define the length of the action potential plateau across the myocardial wall. This method shares the same drawback — no causal effect between cell physiology and T-wave morphology — suffered by the strategies based on the Franz relation. Consequently, these approaches can neither investigate the distribution of physiological ion channel properties that produce the T-wave, nor predict changes in the T-wave morphology caused by an altered state of the myocardial cells (e.g., changes in ion channels). As such, they cannot be used to study heart diseases or drugs that affect the T-wave morphology.
A different approach consists in modeling the physiological origin of the T-wave by assigning different EP to myocardial cells in separate transmural and apex-to-base regions. Following this approach, Okada et al. [15] modified the APD gradients by changing the potassium currents of the myocardial cells through the myocardial wall and from apex-to-base. Similarly Weiss et al. [16] study the origin of the T-wave by varying the maximum conductance of the potassium (IKs and Ito) and sodium-calcium exchange (INaCa) currents through the myocardial wall and from apex-to- base. By accounting for multi-scale mechanisms, from myocardial cell ion channel models to electrical conduction in the full heart ventricles, these approaches can explain changes in the ECG T-wave mechanistically and relate them to an altered or diseased state of the myocardial cells.
This second type of approach requires an objective strategy to assign variations in cell model parameters across the heart wall and from apex-to-base. A simple and effective option consists of segmenting the myocardium into transmural and apex-to-base regions and assigning different cell model parameters to each of them. An apex-to-base segmentation may be easily obtained based on the position of the myocardial cells along the heart longitudinal axis. A transmural segmentation is equally straightforward if the heart model is based on a simplified geometry and the ventricles are modeled using truncated ellipsoids fitted to MRI data (e.g., [17]). In this case, the distance between the epicardial and endocardial surfaces is well defined and may be used to compute the transmural layers. However, anatomically accurate heart geometries are required for numerical simulations aimed at modeling the detailed EP of the heart. In this latter case, although the epicardial and endocardial surfaces are in general not smooth or analytically defined, the distance from either the endocardial or the epicardial surfaces may still be computed using the single distance map from a triangulation of the surface as presented by Baerentzen and Aanaes [18]. This approach was used by Chabiniok et al. [19] to compute the distance of a point from the epicardial and endocardial surfaces and accordingly assign fiber orientation. Nevertheless, since in anatomically accurate heart models the epicardial and endocardial surfaces are not parallel, transmural regions are not rigorously defined based purely on the distance from one or both of these surfaces.
These approaches notwithstanding, there has not been proposed a clear, systematic strategy to subdivide physiologically accurate biventricular heart geometries in transmural and apex-to-base regions necessary to assign different APD gradients and to obtain a correct T-wave. Herein we propose a systematic solution to this problem and study its robustness by investigating the effect of different transmural segmentations on the resulting T-wave. We based our algorithm on an auxiliary steady state diffusion boundary value problem following a technique previously employed to generate myocardial fiber orientations [20, 21, 22]. We show how the combination of multiple Laplace boundary value problems allow careful control of the ventricular segmentation into Epi/M(ventricular midwall)/Endo and Apex/Mid (or mid-ventricular)/Base layers. The resulting segmentation, in conjunction with physiologically accurate ionic cell models defining the APD gradients, results in a physiologically correct T-wave. Since this modeling approach incorporates the spatial variation in cell ion channels responsible for the T-wave morphology, it can be used to study heart disease or drugs affecting the T-wave.
In the remainder of the paper, we first provide a brief overview of the model employed to solve the heart EP and of the ionic cell models used to vary the APD in each transmural region. The boundary value problem and the algorithms used to segment the heart are described next. Following the computation of the myocardial segmentation, we assign varied ionic cell model parameters to each of the regions and compute the corresponding ECG, which exhibits the correct T-wave morphology. A discussion of the segmentation method presented and its possible extensions concludes the manuscript.
2. ANATOMICAL AND ELECTROPHYSIOLOGY MODEL
The heart segmentation resulting from our algorithm is used and tested inside a computational scheme developed to model heart EP [23]. Here we provide a brief overview of this computational scheme, which is necessary to compute the ECG from a segmented heart domain.
The heart EP is described using a monodomain reaction-diffusion partial differential equation, which is coupled with a set of ordinary differential equations (ODEs) governing cell-level ionic currents based on the Hodgkin-Huxley framework [24]. We solve the governing equations using operator splitting [25] and the finite element method as previously presented in Krishnamoorthi et al. [26]. The equations governing the heart EP are solved on an anatomically accurate rabbit heart geometry model, which includes MRI-based microstructural fiber/sheet orientations and a Purkinje conduction system, as described by Krishnamoorthi et al. [23] (Fig. 2, left).
Figure 2.
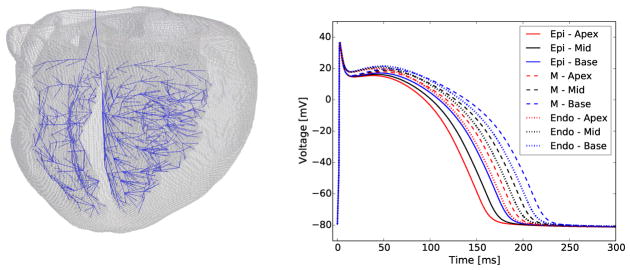
Ventricular finite element mesh (left) with embedded Purkinje system (blue), and action potentials in different heart regions (pacing cycle length equal to 400 ms) showing repolarization heterogeneity (right).
Animal handling and care related to the acquisition of the rabbit heart geometry and microstructure were performed according to the recommendations of the National Institutes of Health Guide for the Care and Use of Laboratory Animals and the Institutional Animal Care and Use Committee at the University of California, Los Angeles (UCLA). The animal protocol for ex vivo tissue evaluation (Protocol #2008-161-12) was approved by the UCLA Chancellors Animal Research Committee.
Our finite element model consists of 901,852 nodes and 828,532 elements with mesh size equal to 200 μm. This mesh size was previously verified in [26, 23] and guarantees the correct numerical solution of the EP governing equations. According to the microstructure information, we assign diffusion coefficients equal to 0.001 cm2/ms, 0.0005 cm2/ms, and 0.00025 cm2/ms in the fiber, cross fiber, and fiber sheet normal direction, respectively. The conductivity σ is then computed as σ = χCmD, where χ = 6 × 103cm−1 is the membrane surface/volume ratio, and Cm = 1μF/cm2 is the membrane capacitance. Therefore, the fastest, medium and slowest conductivities are related by a 4:2:1 proportionality. The resulting tissue conductivity is anisotropic since at every point in the model the tissue microstructure, i.e., the fibers orientation, varies and with it the conductivity coefficients and directions.
In our model, the system of ODEs describing the cell ionic gating channels is the Mahajan et al. [27] cell model, which meets important validation criteria such as reproducing a physiologically correct action potential, calcium transient, and action potential (AP) restitution curve. Conduction is initiated by a stimulus current at the atrioventricular node, from which it propagates to the myocardial tissue through the Purkinje muscle junctions (PMJs). Before modeling the propagation of the electrical stimulus, we prepace the single cell models (9 myocardial cell models and the Purkinje cell model) for 1000 beats. After 1000 cycles at constant pacing we verify that the action potential, Calcium and Sodiumtransients have reached the steady state regime. Using the same pacing interval (400 ms in the analyses presented herein) we carry out the full heart simulations initialized with the prepaced cell models. Employing this initialization procedure we observe that the changes in the ECG in subsequent beats are minimal. Nevertheless, to ensure that a steady state regime has been reached, in the following analyses we disregard the first two beats and report the subsequent beats.
We seek to separate the myocardium into Epi, M and Endo cells, and Apical, Mid-ventricular, and Basal subdomains. The cell model properties in these regions were modified according to trends observed in the literature [28, 29, 30]. Specifically, we alter the model conductance Gks of the slow component of the delayed rectifier potassium current Iks. Transmurally, we also alter the conductance Gto of the transient outward potassium current Ito, which contributes to both the duration and the shape of the action potential. This current has not been shown to vary significantly from apex-to-base. We report in Table I the calibrated values of Gks and Gto. The resulting action potentials in the different regions of the myocardium exhibit significant differences in duration, primarily due to variation in the repolarization phase (Fig. 2, right). Here we will consider both the apex-to-base and transmural cell properties gradients simultaneously and focus on presenting a segmentation algorithm, and discuss its validity and robustness to describe the T-wave. Other studies have considered only one of these gradients and the resulting effect on the T-wave, e.g., we show the T-wave due to either of these gradients in isolation in the supplementary material of [23].
Table I.
Potassium currents conductances in the nine transmural and apex-to-base regions.
| Cell position | Gto [mS/μF] | Gks [mS/μF] | APD90 [ms] |
|---|---|---|---|
| Epi - Apex | 0.110 | 0.263 | 158 |
| Epi - Mid | 0.110 | 0.194 | 168 |
| Epi - Base | 0.110 | 0.139 | 179 |
| M - Apex | 0.110 | 0.103 | 189 |
| M - Mid | 0.110 | 0.072 | 202 |
| M - Base | 0.110 | 0.049 | 217 |
| Endo - Apex | 0.094 | 0.136 | 182 |
| Endo - Mid | 0.094 | 0.097 | 195 |
| Endo - Base | 0.094 | 0.069 | 208 |
3. SEGMENTATION OF BIVENTRICULAR MODEL
A biventricular model may be subdivided in the apex-to-base direction on a simple geometric basis. Through a rigid body rotation, the longitudinal heart axis may be aligned with a Cartesian axis. Without loss of generality, we refer to this axis as the z-axis. The model may then be subdivided in the apex-to-base direction according to the z coordinate. For simplicity we segmented the heart into three longitudinal segments of equal height. This amounts to a step of one-dimensional interpolation along the z-axis. A z coordinate for the Apex-Mid boundary (zapex), and another for the Mid-Base boundary (zbase with zbase > zapex) are sufficient for longitudinal segmentation (Algorithm 4). We point out that a finer apex-to-base segmentation is a straightforward extension of the three region model presented here and may be appealing as more accurate experimental data becomes available to describe the apex-to-base EP variations at the cellular level. In the present context, given the available experimental data and the purpose of presenting the segmentation algorithm, we use three apex-to-base regions and proceed to describe the more complex transmural segmentation.
Given the irregular geometry of the endocardial and epicardial surfaces, transmural segmentation is not amenable to such a simplistic geometric definition. Interpolation along the “transmural direction” is not unambiguously defined. As an alternative to distance map definitions [18, 19], we propose a method based on Laplace interpolation [20, 21] and harmonic lifting [22]. In this approach the relative distance from the endocardial and the epicardial surfaces may be computed according to the field distribution resulting from the solution of a steady state diffusion (Laplace) equation in an homogeneous isotropic material. Specifically, on the given domain Ω, we solve the Laplace equation
| (1a) |
with field values prescribed on the epicardial, and left and right endocardial surfaces, denoted generally as ∂Ωi,
| (1b) |
and zero-flux Neumann boundary conditions prescribed on the base of the heart,
| (1c) |
defined as the complement of the epi- and endocardial surfaces, ∂Ω = {∪i∂Ωi} ∪ ∂ΩN. The resulting field φ(x) interpolates smoothly between the values prescribed on neighboring surfaces ∂Ωi. For instance, in the simple case of a domain between two large parallel plate boundaries at x = ±a with prescribed values φ0 on ∂Ω0 = {x|x = −a} and φ1 on ∂Ω1 = {x|x = a}, the solution of Eqn. (1) far from the lateral boundaries ∂ΩN will be , a linear interpolation between φ0 and φ1. The fractional distance from the surfaces can then be computed as di = |φ(x) − φi|/Δφ, with Δφ = |φ1 − φ0|. This holds as a robust estimate of distance even in complex geometries with irregular surfaces.
By this approach, a single steady state diffusion problem can be solved to subdivide a domain delimited by two singly-connected surfaces ∂Ω0,1. By assigning boundary values φ0,1, the distance from the surfaces to any point x ∈ Ω is estimated as proportional to the difference between the field φ(x) and φ0,1. However, the epi- and endocardium are not two singly-connected surfaces. The septum divides the left (LV) and right (RV) ventricles and, in order to obtain the transmural segmentation needed to assign the cell model properties, we need to interpolate between three singly-connected surfaces: the epicardial surface, the RV endocardial surface and the LV endocardial surface. Although in this case one diffusion boundary value problem is insufficient, we can compute the transmural LV and RV segmentation by solving multiple diffusion problems, with each focusing on a particular pair of surfaces. We identify in the following three separate strategies (Algorithms 1–3) involving two and three subsequent diffusion analyses (Eqn. 2–4). The outlined algorithms illustrate the method and its flexibility.
In the diffusion analyses solved on the heart domain in order to obtain the ventricles segmentation, we impose two Dirichlet boundary conditions, φ0 and φ1, on the epicardial and RV/LV endocardial surfaces and, without loss of generality, we assume hereafter that Δφ ≡ φ1 − φ0 > 0.
In a first diffusion analysis (A) we impose φ = φ0 on the endocardial surfaces and φ = φ1 on the epicardial surface,
| (2) |
A second diffusion analysis (B) is performed imposing φ = φ0 on the RV endocardial surface and φ = φ1 on the epicardial and LV endocardial surfaces,
| (3) |
A third analysis (C) mirrors the second analysis by switching the boundary conditions applied on the RV and LV endocardial surfaces, i.e., φ = φ0 on the LV endocardial surface and φ = φ1 on the epicardial and RV endocardial surfaces,
| (4) |
The field distributions resulting from these analyses, plotted in Fig. 3 for boundary conditions φ0 = −1 and φ1 = 1, show a smooth interpolation of φ between the ∂Ω0 and ∂Ω1 boundaries. Accordingly φ(x) provide a measure of the relative distance from the epi- and endocardial surfaces. The heart segmentation obtainable in each separate diffusion analysis may be visualized by computing field isovalue surfaces, which determine the interface (i.e., the threshold) between adjacent layers. We can parametrize the isovalue by a scalar α ∈ [0, 1] representing a unitless coordinate interpolating between φ0 and φ1,
Figure 3.
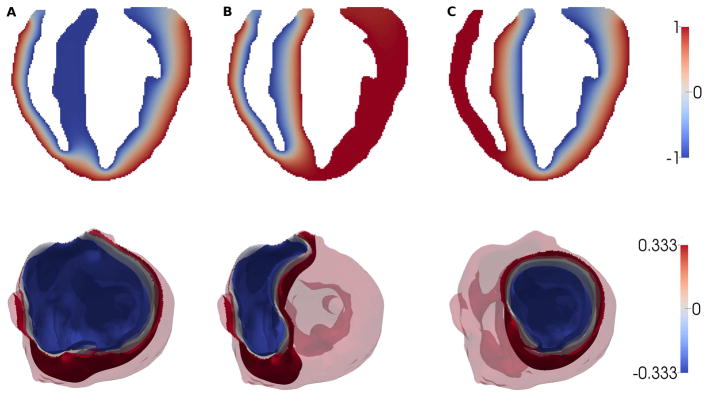
Top: Longitudinal sections of the field distributions for analyses A–C. A: ∂Ω0 = ∂Ωendo (Eqn. 2); B: (Eqn. 3); C: (Eqn. 4); Bottom: isosurfaces φ = (1 − α) φ0 + αφ1 obtained in analyses A, B, and C for α = 1/3 (blue), 1/2 (gray) and 2/3 (red).
If, for example, a transmural segmentation in three equal layers is desired, the isosurfaces for and , i.e., with isovalues and can be identified as the interfaces between regions (Fig. 3).
Our strategy is to construct a transmural segmentation of the heart by computing unions and intersections of regions separated by particular isosurfaces in analyses A–C. We denote by pepi, pM, and pendo the fractions of the wall to be assigned to the Epi, M, and Endo regions. The coordinate α coincides approximatively with the fraction of the wall that is on the ∂Ω0 side of the isosurface. Because ∂Ω0 boundary always includes one or more of the endocardial surfaces, we can identify α = pendo as the coordinate of the isosurface separating the Endo and M regions. By similar logic, since ∂Ω1 always includes the epicardial surface, we can identify α = 1 − pepi as the coordinate of the Epi-M interface. We segment the ventricles by thresholding φ(x) in the regions between isosurfaces. The isovalue of the candidate Endo-M interface is denoted as
and that of the Epi-M interface as
Based on φ− and φ+, we threshold φ(x) to obtain the following three regions in each diffusion analysis A–C (● denotes analysis A, B or C in the following)
| (5) |
Application of Eqn. (5) shows (Fig. 4) that analysis A can can be used to identify the Epi, M and Endo regions everywhere except in the septum where the field is uniform and equal to φ0. In analyses B and C, the different boundary conditions in the left and right Endo surfaces create a clean interpolation across the septal region, which can be used to subdivide it into Endo and M regions. These results make clear that the Epi, M and Endo regions can be defined from the union and/or intersection of the Ω+, Ω−, Ω± domains from analyses A, B, and C. There are a variety of possible definitions using set arithmetic. Here, as illustrative examples, we consider three particular options, Algorithms 1–3, specified below.
Figure 4.

Longitudinal sections of the transmural heart segmentation obtained separately in diffusion analyses A, B, and C using pendo = pM = pepi = 1/3.
Algorithm 1.
Transmural segmentation based on 2 diffusion analyses (A,B)
|
|
Algorithm 2.
Transmural segmentation based on 3 diffusion analyses
|
|
Algorithms 1 through 3 can be easily interpreted with the help of Fig. 4. For Algorithm 1, the epicardial region coincides with the red portion computed in analysis A. The M cell region is defined as the union of the gray region in analysis A and the intersection between the blue region in analysis A and the gray region in analysis B. Lastly, the endocardial region is the intersection between the blue region obtained in analysis A and the red and blue regions obtained in analysis B. Algorithms 2 and 3 can be visualized in the same way.
Algorithm 3.
Transmural segmentation based on 2 diffusion analyses (B,C)
|
|
Algorithm 4.
Apex-to-base segmentation based on position along the longitudinal z axis
| Ωapex: = {x: z(x) ≤ zapex} |
| Ωmid: = {x: zapex < z(x) < zbase} |
| Ωbase: = {x: z(x) ≥ zbase} |
A longitudinal section of the final transmural and apex-to-base segmentations based on the presented algorithms is shown in Fig. 5. Since in our formulation [23] the ionic variables governing the cell AP reside at the nodes of the heart finite element mesh, we use the outlined algorithms to subdivide the nodes based on their coordinate x. Equivalently, we can subdivide the finite elements of the heart mesh based, for instance, on their barycentric coordinate. The Epi, M and Endo regions and the Apical, Mid and Basal regions are labeled using an identification number from 1 to 9 according to Table II.
Figure 5.

Longitudinal sections of the ventricles segmentations: each region is labeled from 1 to 9 according to the heart location to which it belongs (Table II). Transmural and apex-to-base ventricular segmentation obtained with Algorithm 1 (left), Algorithm 2 (center), and Algorithm 3 (right).
Table II.
Region identification numbers for apex-to-base and transmural segmentation.
| Apex | Mid | Base | |
|---|---|---|---|
| Epi | 9 | 8 | 7 |
| M | 6 | 5 | 4 |
| Endo | 3 | 2 | 1 |
All the algorithms presented in the foregoing (Algorithms 1–3) result in valid transmural heart segmentations, which differ only subtly from each other. The largest difference between any two of the presented algorithms amounts to 4.2% of the total nodes receiving a different ID and, consequently, different cell properties and APD. In the following section we quantify the effect of these differences by computing the electrocardiogram for each of the transmural heart segmentations.
In our applications, we solved the simple steady state diffusion problems employing the finite element method, which is often also the method of choice for cardiac EP analyses. Other computational schemes commonly used to model cardiac EP, such as the finite difference method, may be employed as well in a straightforward way to solve the Laplace equation on the heart domain. The availability of common computational schemes to solve the basic equations and the simplicity of the proposed approach render it readily applicable.
4. ELECTROCARDIOGRAMS AND APDS RESULTING FROM THE PROPOSED CELL SEGMENTATIONS
We proceed to show that the heart segmentation obtained with the presented method can be successfully used to assign cell property gradients and to produce a physiologically correct T-wave in the ECG. Furthermore, we investigate how sensitive the T-wave is to changes in the parameters governing the segmentation algorithms.
Toward this objective, we combine the heart segmentation obtained in Section 3 with the heart and cell models described in Section 2. In particular, the 9 heart regions used in the simulation are obtained with Algorithm 1 and correspond to equally spaced apex-to-base ( and with H being the heart total length along the longitudinal z axis) and equal-width transmural (pendo = pM = pepi = 1/3) segmentation. This segmentation corresponds to the section shown in Fig. (5,1). According to Section 2 and the previous work of Krishnamoorthi et al. [23], cell properties resulting in different APDs are assigned to the cells in the 9 heart regions. We simulate four heart beats with pacing cycle length equal to 400ms and report the third and fourth heart beat. Disregarding the first two heart beats and preliminary single cell prepacing as described in Section 2, guarantees that a steady state solution has been reached in our model. For comparison, the same simulation and corresponding ECG were computed using an identical heart model but without cell APD heterogeneity; i.e., uniform cell properties (in this example we chose the Mid and M cell properties) were assigned to all the nodes in the finite element mesh. The voltage field time history is subsequently used to compute the ECG output from a bipolar lead according to [31]:
| (6) |
where R(x) denotes the distance from a point in the heart domain Ω to the lead position and D(x) is the diffusion tensor at point x. We observe that a scaling factor is necessary to convert the ECG signal computed using Eqn. 6 in voltage units. However, this scaling factor does not affect in any way the morphology of the ECG signal and therefore, in the following, we report directly the normalized voltage computed through Eqn. 6.
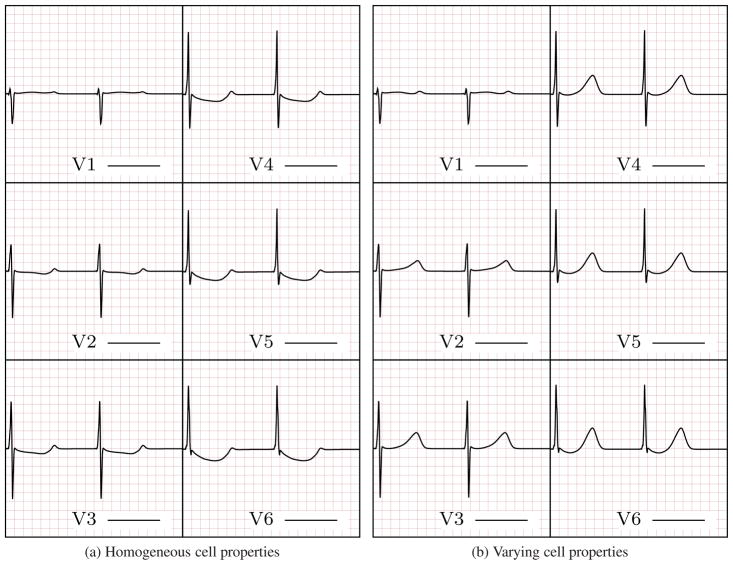
The six-lead ECG resulting from the model including the apex-to-base and transmural APD gradients contains a physiologically accurate T-wave morphology (Fig. 7b) whereas the T-wave is absent from the ECG obtained using the homogeneous heart model (Fig. 7a). This comparison illustrates the applicability of the method presented herein for including heterogeneous cell properties and, consequently, to obtain a physiologically correct ECG.
Figure 7.
ECG generated using homogeneous (left) and heterogeneous (right) cell properties. The ECG computed using cell property gradients shows physiologically accurate T-wave morphology, i.e., the T-wave is upright in all six leads and presents the correct progression and slower rising than descending phase.
We have also included the APD map obtained during the fourth simulated beat (Fig. 8) to analyze more in details the effect of cell properties gradients on APD gradients. We observe that the APD gradients are smooth across the myocardium in both the transmural and apex-to base directions despite the distinct cell properties boundaries imposed using the segmentation algorithm. Gradual APD changes are due to the smoothing effect associated with voltage diffusion during each heart beat.
Figure 8.
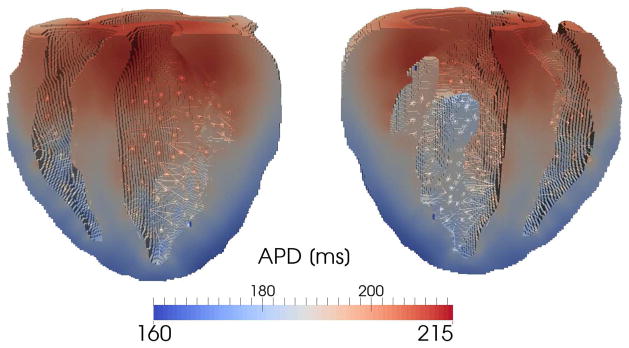
APD distribution obtained using an heterogeneous transmural and apex-to-base cell model distribution. Even tough the boundaries between adjacent cell regions with different ionic constants may be sharp — especially in the apex-to-base direction — at steady state the APD varies smoothly through the myocardium due to diffusion.
In order to assess the sensitivity of the ECG to the segmentation, we recompute the ECG by using the transmural segmentations obtained with Algorithms 2 and 3. We have already established (Section 3 and Fig. 6) that less than 5% of the total number of nodes are placed in different regions by the three presented algorithms and most differences reside where the septum is connected to the rest of the RV/LV ventricular wall. These very limited differences are not reflected in the ECG, i.e., the ECGs (not reported here) computed using the model obtained with Algorithms 2 and 3 are indistinguishable from the ECG based on Algorithm 1 (Fig. 7b). This result shows that any of the presented algorithms can be used to construct a heart model without affecting the resulting ECG. For subsequent sensitivity analyses we proceed with Algorithm 1.
Figure 6.

Heart regions receiving different IDs with the three presented segmentation algorithms. From left to right: differences between Algorithms 1 and 2 (≈ 2.0% of total nodes), differences between Algorithms 1 and 3 (≈ 4.2% of total nodes), differences between Algorithms 2 and 3 (≈ 2.2% of total nodes). As shown, the differences are localized to the region where the septum is connected to the RV/LV ventricular wall.
In the simulations just presented we used equally spaced apex-to-base ( ) and equal-width transmural (pendo = pM = pepi = 1/3) segmentation. This appears as a reasonable choice since more detailed data are lacking in the literature regarding the thickness of the different myocardial cell regions. For example, significant uncertainty is reported in the literature about the position and extension of the M cells (e.g., see Table 1 in [32]). In this regard, we investigate how sensitive the T-wave is to different widths of the M layer. In particular, in two subsequent analyses, we define a thicker (pM = 3/5) and a thinner (pM = 1/5) M layer. The epicardial and endocardial layers are assumed equal with pendo = pepi = 1/5 and pendo = pepi = 2/5 in the two analyses, respectively (Fig. 9).
Figure 9.
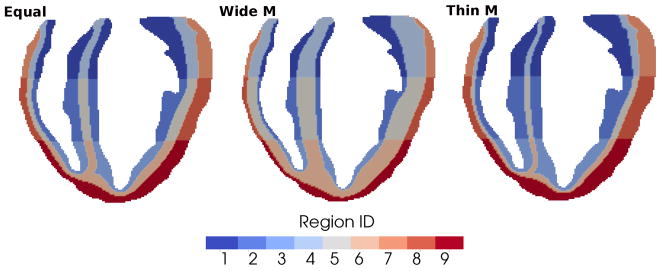
Representative sections of the heart segmentations obtained by imposing equal-width transmural layers (left - for comparison), wider M layer and equally thinner endocardial and epicardial layers (center), thinner M layer and equally wider endocardial and epicardial layers (right).
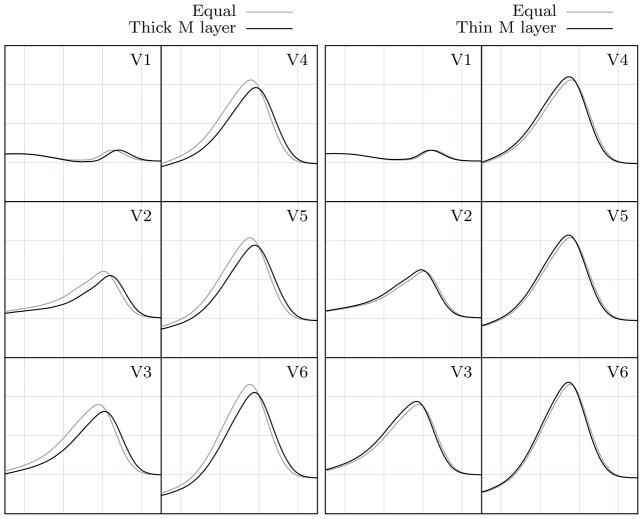
The six-lead ECG is not affected significantly by the changes in the transmural segmentation. Specifically, the QRS complex remains unchanged and the T-wave preserves its physiologically correct morphology in all cases (Fig. 10). The largest difference is obtained when comparing the equal-width transmural segmentation (pM = 1/3) and the thicker M layer (pM = 3/5) models. A wide M layer results in a slightly smaller and delayed T-wave (Fig. 10, left). In contrast, a thinner M layer (pM = 1/5) leads to a slightly taller and earlier T-wave (Fig. 10, right), even if, in this latter case, the differences with respect to the equal-width transmural segmentation model are very small.
Figure 10.
Comparison between the T-waves obtained using equal-width transmural segmentation and wider (left)/thinner (right) M layer.
We can observe here that the values of pepi, pmid, and pendo provide convenient parametric control over the transmural segmentation. In the present model, modest adjustment of these parameters yielded noticeable but not dramatic change in the ECGs. This result proves the robustness of the method with respect to parameters that are not well defined in the literature. Moreover, as more accurate physiological data for transmural heterogeneity become available, the proposed method can easily incorporate the additional information and accordingly modify the ventricular segmentation to further explore the effects of repolarization dispersion.
5. DISCUSSION
The simulations presented show the applicability and robustness of the proposed segmentation method to define heart regions with different cell properties and obtain the correct T-wave morphology. The resulting T-wave is directly linked to the cell APD gradients and therefore changes in the cell physiology due to heart diseases may be studied and related to changes in the ECG. Moreover, the method presented is applicable to any heart model and does not rely on geometrical simplifications. In an anatomically accurate heart geometry acquired, for instance, through MRI, the transmural layers cannot be defined simply based on a fixed distance measured from either the endocardial or the epicardial surfaces since they are not parallel and the thickness of the myocardial wall varies continuously. To illustrate this, an example of an ad hoc segmentation is shown in Fig. (11, right), in which the transmural layers are defined based on a fixed distance from the endocardial and epicardial walls. The resulting segmentation is not appropriate in the apical and right ventricle walls where M cells are almost missing due to the reduced myocardium thickness in those regions.
Figure 11.
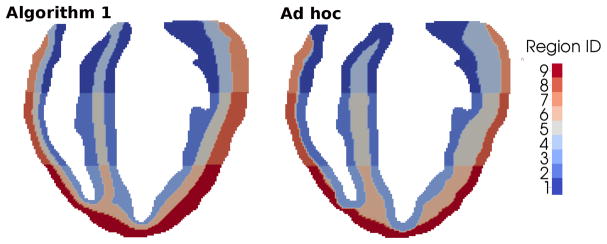
Comparison between heart segmentations obtained with Algorithm 1 (left) and ad hoc segmentation (right).
Ad hoc approaches also require some additional strategy to modify the layout of the transmural layers. In contrast, the segmentation algorithms presented in Section 3 can be modified in a straightforward way to produce a different transmural segmentation. As an example, we lay out three modifications in which we obtain:
a thicker endocardial layer in the left ventricle - Fig. (12, left);
a thicker endocardial layer in the right ventricle - Fig. (12, center);
four layers in the external myocardial wall and two layers in the septal region - Fig. (12, right).
Figure 12.
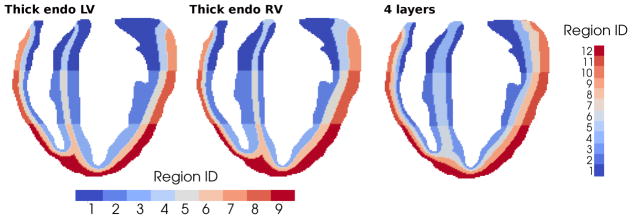
Example sections of different transmural segmentations obtainable with simple modifications of the proposed algorithms: (left) wider LV endocardium layer with and ; (center) wider RV endocardium layer with and ; and (right) four equal layers in the external free walls plus two Endo layers in the septal region with and .
These are obtained with only minor modifications to, for instance, Algorithms 1 and 3. In the modified algorithms we introduce the additional threshold values
φL = (1 − pL) φ0 + pLφ1;
and , where k = B, C refers to the diffusion analysis in which the field φ is computed.
A thicker left endocardial layer is obtained using whereas corresponds to a thicker right endocardial layer. The modifications to the algorithms listed in Section 3 are presented in Algorithms 5–7.
Algorithm 5.
Modification of Algorithm 3 to obtain thicker LV endocardial layer using diffusion analyses B and C
|
|
Algorithm 6.
Modification of Algorithm 3 to obtain thicker RV endocardial layer using diffusion analyses B and C
|
|
Algorithm 7.
Modification of Algorithm 1 to obtain a 4 layers segmentation using diffusion analyses A and B
|
|
We conclude by pointing out that the significance of a general method to subdivide the heart goes behind obtaining the physiologically correct T-wave and predicting its changes caused by an altered state of the myocardial cells during heart diseases. For example, a flexible segmentation method may be used in analyses with the objective of identifying the mechanical properties of the heart, which may be spatially inhomogeneous. In order to reduce the number of unknowns and therefore the complexity of the model, different mechanical properties may be assigned to discrete heart regions rather than varied continuously through the myocardium (e.g., [33]). The method presented herein may be used to subdivide the heart model in transmural and apex-to-base regions in which different material properties can be identified. Moreover, our method may also be combined with other regional segmentations of the heart. For instance the AHA heart regions [34] may be further subdivided in the transmural direction according to the method presented.
Lastly, it is important to highlight some of the method limitations. For instance, the algorithms presented herein do not allow to segment the papillary muscles in different transmural layers. The papillary muscles are located in the interior of the ventricles and therefore their surface is only exposed to the field φ0, i.e., no transmural gradient is created through the papillary muscles and the corresponding locally homogeneous field φ cannot be used to determine transmural layers in the papillary muscles. This limitation appears small if the presented method is used to assign transmural cell property gradients with the aim of computing the corresponding T-wave, but may be important in other particular applications.
Acknowledgments
The authors gratefully acknowledge the support from the National Institutes of Health grant P01 HL78931. L.E. Perotti is also grateful for the support of the American Heart Association through the Postdoctoral Fellowship with Award Number 14POST19890027.
References
- 1.Mattu A, Brady W, Robinson D. Electrocardiographic manifestations of hyperkalemia. The American Journal of Emergency Medicine. 2000;18(6):721–729. doi: 10.1053/ajem.2000.7344. [DOI] [PubMed] [Google Scholar]
- 2.Weiss-Guillet E, Takala J, Jakob S. Diagnosis and management of electrolyte emergencies. Best Practice & Research Clinical Endocrinology & Metabolism. 2003;17(4):623–651. doi: 10.1016/s1521-690x(03)00056-3. [DOI] [PubMed] [Google Scholar]
- 3.Ross J., Jr Electrocardiographic ST-segment analysis in the characterization of myocardial ischemia and infarction. Circulation. 1976;53(3 Suppl):I73–I81. [PubMed] [Google Scholar]
- 4.Wang K, Asinger R, Marriott H. ST-Segment Elevation in Conditions Other Than Acute Myocardial Infarction. New England Journal of Medicine. 2003;349(22):2128–2135. doi: 10.1056/NEJMra022580. [DOI] [PubMed] [Google Scholar]
- 5.Pastore J, Girouard S, Laurita K, Akar F, Rosenbaum D. Mechanism Linking T-Wave Alternans to the Genesis of Cardiac Fibrillation. Circulation. 1999;99(10):1385–1394. doi: 10.1161/01.cir.99.10.1385. [DOI] [PubMed] [Google Scholar]
- 6.Higuchi T, Nakaya Y. T wave polarity related to the repolarization process of epicardial and endocardial ventricular surfaces. American Heart Journal. 1984;108(2):290–295. doi: 10.1016/0002-8703(84)90614-8. [DOI] [PubMed] [Google Scholar]
- 7.Franz M, Bargheer K, Rafflenbeul W, Haverich A, Lichtlen P. Monophasic action potential mapping in human subjects with normal electrocardiograms: direct evidence for the genesis of the T wave. Circulation. 1987;75(2):379–386. doi: 10.1161/01.cir.75.2.379. [DOI] [PubMed] [Google Scholar]
- 8.Boulakia M, Cazeau S, Fernández MA, Gerbeau JF, Zemzemi N. Mathematical modeling of electrocardiograms: a numerical study. Annals of biomedical engineering. 2010;38(3):1071–1097. doi: 10.1007/s10439-009-9873-0. [DOI] [PubMed] [Google Scholar]
- 9.Clayton RH, Holden AV. Propagation of normal beats and re-entry in a computational model of ventricular cardiac tissue with regional differences in action potential shape and duration. Progress in biophysics and molecular biology. 2004;85(2):473–499. doi: 10.1016/j.pbiomolbio.2003.12.002. [DOI] [PubMed] [Google Scholar]
- 10.Potse M, Vinet A, LeBlanc AR, Diodati JG, Nadeau R. Understanding ST depression in the stress-test ECG. Anatolian Journal of Cardiology. 2007;7(1):145–7. [PubMed] [Google Scholar]
- 11.Potse M, Vinet A, Opthof T, Coronel R. Validation of a simple model for the morphology of the T wave in unipolar electrograms. American Journal of Physiology-Heart and Circulatory Physiology. 2009;297(2):H792–H801. doi: 10.1152/ajpheart.00064.2009. [DOI] [PubMed] [Google Scholar]
- 12.Scacchi S, Franzone PC, Pavarino L, Taccardi B. A reliability analysis of cardiac repolarization time markers. Mathematical biosciences. 2009;219(2):113–128. doi: 10.1016/j.mbs.2009.03.004. [DOI] [PubMed] [Google Scholar]
- 13.Hurtado D, Kuhl E. Computational modelling of electrocardiograms: repolarisation and T-wave polarity in the human heart. Computer Methods in Biomechanics and Biomedical Engineering. 2014;17(9):986–996. doi: 10.1080/10255842.2012.729582. [DOI] [PMC free article] [PubMed] [Google Scholar]
- 14.di Bernardo D, Murray A. Computer model for study of cardiac repolarization. Journal of Cardiovascular Electrophysiology. 2000;11(8):895–899. doi: 10.1111/j.1540-8167.2000.tb00069.x. [DOI] [PubMed] [Google Scholar]
- 15.Okada J, Washio T, Maehara A, Momomura S, Sugiura S, Hisada T. Transmural and apicobasal gradients in repolarization contribute to T-wave genesis in human surface ECG. American Journal of Physiology-Heart and Circulatory Physiology. 2011;301(1):H200–H208. doi: 10.1152/ajpheart.01241.2010. [DOI] [PubMed] [Google Scholar]
- 16.Weiss D, Seemann G, Keller D, Farina D, Sachse F, Dossel O. Modeling of Heterogeneous Electrophysiology in the Human Heart with Respect to ECG Genesis. Computers in Cardiology, 2007, IEEE. 2007:49–52. [Google Scholar]
- 17.Sainte-Marie J, Chapelle D, Cimrman R, Sorine M. Modeling and estimation of the cardiac electromechanical activity. Computers & Structures. 2006;84(28):1743–1759. [Google Scholar]
- 18.Baerentzen J, Aanaes H. Signed distance computation using the angle weighted pseudonormal. Visualization and Computer Graphics, IEEE Transactions on. 2005;11(3):243–253. doi: 10.1109/TVCG.2005.49. [DOI] [PubMed] [Google Scholar]
- 19.Chabiniok R, Moireau P, Lesault P, Rahmouni A, Deux J, Chapelle D. Estimation of tissue contractility from cardiac cine-MRI using a biomechanical heart model. Biomechanics and Modeling in Mechanobiology. 2012;11(5):609–630. doi: 10.1007/s10237-011-0337-8. [DOI] [PubMed] [Google Scholar]
- 20.Bayer J, Blake R, Plank G, Trayanova N. A novel rule-based algorithm for assigning myocardial fiber orientation to computational heart models. Annals of Biomedical Engineering. 2012;40(10):2243–2254. doi: 10.1007/s10439-012-0593-5. [DOI] [PMC free article] [PubMed] [Google Scholar]
- 21.Wong J, Kuhl E. Generating fibre orientation maps in human heart models using Poisson interpolation. Computer Methods in Biomechanics and Biomedical Engineering. 2014;17(11):1217–1226. doi: 10.1080/10255842.2012.739167. [DOI] [PMC free article] [PubMed] [Google Scholar]
- 22.Nagler A, Bertoglio C, Gee M, Wall W. Functional Imaging and Modeling of the Heart. Springer-Verlag; 2013. Personalization of Cardiac Fiber Orientations from Image Data Using the Unscented Kalman Filter; pp. 132–140. [Google Scholar]
- 23.Krishnamoorthi S, Perotti LE, Borgstrom NP, Ajijola OA, Frid A, Ponnaluri AV, Weiss JN, Qu Z, Klug WS, Ennis DB, et al. Simulation Methods and Validation Criteria for Modeling Cardiac Ventricular Electrophysiology. PloS one. 2014;9(12):e114 494. doi: 10.1371/journal.pone.0114494. [DOI] [PMC free article] [PubMed] [Google Scholar]
- 24.Keener J, Sneyd J. Mathematical Physiology: I: Cellular Physiology. Vol. 1. Springer; 2010. [Google Scholar]
- 25.Qu Z, Garfinkel A. An Advanced Algorithm for Solving Partial Differential Equation in Cardiac Conduction. Biomedical Engineering, IEEE Transactions on. 1999;46(9):1166–1168. doi: 10.1109/10.784149. [DOI] [PubMed] [Google Scholar]
- 26.Krishnamoorthi S, Sarkar M, Klug W. Numerical quadrature and operator splitting in finite element methods for cardiac electrophysiology. International journal for numerical methods in biomedical engineering. 2013;29(11):1243–1266. doi: 10.1002/cnm.2573. [DOI] [PMC free article] [PubMed] [Google Scholar]
- 27.Mahajan A, Shiferaw Y, Sato D, Baher A, Olcese R, Xie L, Yang M, Chen P, Restrepo J, Karma A, et al. A Rabbit Ventricular Action PotentialModel Replicating Cardiac Dynamics at Rapid Heart Rates. Biophysical Journal. 2008;94(2):392–410. doi: 10.1529/biophysj.106.98160. [DOI] [PMC free article] [PubMed] [Google Scholar]
- 28.Fedida D, Giles W. Regional variations in action potentials and transient outward current in myocytes isolated from rabbit left ventricle. The Journal of Physiology. 1991;442(1):191–209. doi: 10.1113/jphysiol.1991.sp018789. [DOI] [PMC free article] [PubMed] [Google Scholar]
- 29.Idriss S, Wolf P. Transmural Action Potential Repolarization Heterogeneity Develops Postnatally in the Rabbit. Journal of Cardiovascular Electrophysiology. 2004;15(7):795–801. doi: 10.1046/j.1540-8167.2004.03622.x. [DOI] [PubMed] [Google Scholar]
- 30.Mantravadi R, Gabris B, Liu T, Choi B, de Groat W, Ng G, Salama G. Autonomic Nerve Stimulation Reverses Ventricular Repolarization Sequence in Rabbit Hearts. Circulation Research. 2007;100(7):e72–e80. doi: 10.1161/01.RES.0000264101.06417.33. [DOI] [PMC free article] [PubMed] [Google Scholar]
- 31.Panfilov A, Holden A, editors. Computational Biology of the Heart. John Wiley & Son Ltd; 1997. [Google Scholar]
- 32.Keller D, Weiss D, Dossel O, Seemann G. Influence of IKs Heterogeneities on the Genesis of the T-wave: A Computational Evaluation. Biomedical Engineering, IEEE Transactions on. 2012;59(2):311–322. doi: 10.1109/TBME.2011.2168397. [DOI] [PubMed] [Google Scholar]
- 33.Sermesant M, Moireau P, Camara O, Sainte-Marie J, Andriantsimiavona R, Cimrman R, Hill D, Chapelle D, Razavi R. Cardiac function estimation from MRI using a heart model and data assimilation: Advances and difficulties. Medical Image Analysis. 2006;10(4):642–656. doi: 10.1016/j.media.2006.04.002. [DOI] [PubMed] [Google Scholar]
- 34.Cerqueira M, Weissman N, Dilsizian V, Jacobs A, Kaul S, Laskey W, Pennell D, Rumberger J, Ryan T, Verani M. Standardized Myocardial Segmentation and Nomenclature for Tomographic Imaging of the Heart. A Statement for Healthcare Professionals From the Cardiac Imaging Committee of the Council on Clinical Cardiology of the American Heart Association. Circulation. 2002;105(4):539–542. doi: 10.1161/hc0402.102975. [DOI] [PubMed] [Google Scholar]


