

Abstract
In transcription initiation by Escherichia coli RNA polymerase (RNAP), initial binding to promoter DNA triggers large conformational changes, bending downstream duplex DNA into the RNAP cleft and opening 13 base pairs to form a short-lived open intermediate (I2). Subsequent conformational changes increase lifetimes of λPR and T7A1 open complexes (OC) by >105-fold and >102-fold, respectively. OC lifetime is a target for regulation. To characterize late conformational changes, we determine effects on OC dissociation kinetics of deletions in RNAP mobile elements σ70 region 1.1 (σ1.1), β’ jaw and β’ sequence insertion 3 (SI3). In very stable OC formed by WT RNAP with λPR (RPO) and by △σ1.1 RNAP with λPR or T7A1 we conclude that downstream duplex DNA is bound to the jaw in an assembly with SI3, and bases −4 to +2 of the nontemplate strand discriminator region are stably bound in a positively-charged track in the cleft. We deduce that polyanionic σ1.1 destabilizes OC by competing for binding sites in the cleft and on the jaw with the polyanionic discriminator strand and downstream duplex, respectively. Examples of σ1.1-destabilized OC are the final T7A1 OC and the λPR I3 intermediate OC. Deleting σ1.1 and either β’ jaw or SI3 equalizes OC lifetimes for λPR and T7A1. DNA closing rates are similar for both promoters and all RNAP variants. We conclude that late conformational changes that stabilize OC, like early ones that bend the duplex into the cleft, are primary targets of regulation, while the intrinsic DNA opening-closing step is not.
Keywords: Transcription initiation, regulation, kinetics, mechanism, σ70 region 1.1
INTRODUCTION
Multisubunit RNA polymerases (RNAPs) are molecular machines with many moving parts which carry out the physical and chemical steps of transcription [1, 2]. In E. coli, the focus of most studies of bacterial transcription, RNAP holoenzyme, composed of core enzyme (α2 ββ'ω) and an initiation factor (here σ70), uses binding free energy to open promoter DNA and orient the +1 template (T) strand base in the active site for initiation. A series of conformational changes, triggered by initial specific binding, form the initial open complex (OC). Promoter DNA is bent at or near the upstream ends of both the −35 and −10 regions, forming an ensemble of closed intermediates (designated I1 ; see Figure 1) involving wrapping of far-upstream DNA on RNAP and insertion of the downstream duplex (−10 to +20) into the active site cleft. Then, in the rate-determining step, RNAP opens the entire 13-base pair transcription bubble, placing the +1 base in the active site and forming an initial, unstable OC (designated I2) [3].
Figure 1.
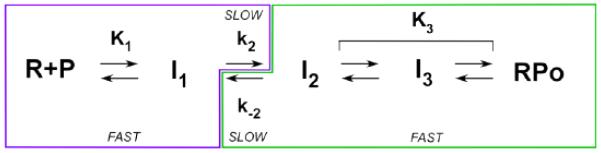
Minimal mechanism of formation and dissociation of stable OC (RPO) at λPR, showing steps that contribute to the observed kinetics (kobs, kd). Where the kinetics are single exponential [48], the initial steps (with composite equilibrium constants K1 or K3) rapidly equilibrate on the time scale of the subsequent rate-determining (k2 or k−2) step. For this situation, the dissociation rate constant kd is determined by the rate constant k−2 for DNA closing (I2 → I1) and the equilibrium constant K3 for stabilization of the open complex I2 to form longer-lived I3 and/or RPO complexes [3, 5]. Likewise, in RNAP excess, the rate constant for OC formation kobs is determined by the equilibrium constant K1 for formation of the ensemble of closed (I1) intermediates and the forward rate constant k2 of the isomerization step that includes DNA opening and converts this I1 ensemble to OCs [42, 43, 49, 50][49][50][50]. For these situations, kd = k−2/(1 + K3) (Equation 2) and kobs = k2 K1 [R]/(1 + K1 [R]).
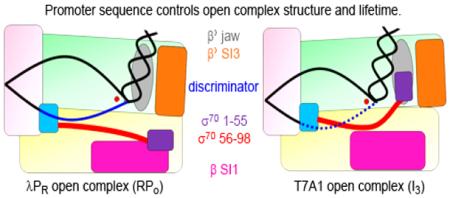
After opening, at many promoters including λPR, additional conformational changes occur to stabilize the OC and increase its lifetime. These late steps of the mechanism (see Figure 1) are best investigated by dissociation kinetic experiments [3-11]. Kinetic and fast-footprinting studies with λPR, reveal that the discriminator region of the nontemplate (NT) strand is repositioned in the cleft [3] and downstream mobile elements (DME) of RNAP (including the jaw and sequence insertion 3 (SI3) domains of β’) assemble on the DNA downstream of the transcription bubble (+3 to ~+20) [7]. The mobile in-cleft element σ region 1.1 (σ1.1) is also repositioned in these late stabilization steps [12], affecting the structure and stability of the open complex [13, 14]. These conformational changes form an exceedingly stable OC (λPR RPO), 105-fold more stable and longer-lived than I.
σ1.1 and other mobile elements are targeted by bacteriophages in order to take over the cell for viral replication. For example, β SI1, located at the top of the active site cleft (also known as the β downstream lobe or β insert 4, Figure 2), is a target for phage T4-encoded inhibitor Alc [15]. The T7 phage-encoded Gp2 inhibits initiation by binding to σ1.1 and β’ jaw [16, 17]. Region σ1.1 is highly negatively charged, consisting of a N-terminal three-helix bundle (residues 1-56; net charge −8) and a more flexible linker region (residues 57-98; net charge −12) [16, 18] (see Figure 2 and Supplemental Figure 1). Both of these regions are highly mobile. In the process of formation of a highly stable OC, σ1.1 moves out of the active site cleft [12] and this mobility appears key to its function [19]. Gp2-σ1.1 interactions prevent RNAP from binding to the downstream duplex in the stable OC [16, 17]. With Gp2 bound to RNAP, only an unstable (short-lived) open complex is formed [9, 10, 20, 21] with a shorter downstream DNase I footprint boundary and a smaller open region [10].
Figure 2.

E. coli RNAP holoenzyme (α2 ββ’ωσ70). A. View from above the active site cleft, showing RNAP as a van der Waals surface. Subunits: α2 : dark blue; β: yellow; β’: green; ω: light orange; σ residues 7-55: purple (note: 7 is the observed N-terminus); σ residues 56-98: red; σ residues 99-106: cyan; σ residues 107-613: light pink; β SI1 (residues 225-343): magenta; β’ SI3 (residues 943-1130): bright orange; β’ jaw deletion from [27] (residues 1149-1190): gray; active site Mg2+ position is indicated by an arrow. Structure adapted from PDB 4LK1 [16]. B. Same view as panel A, highlighting peptide backbone residues that contact NT strand (blue spheres) and T strand (black spheres) in a dinucleotide (GpA)-stabilized complex of Thermus thermophilus RNAP with a heteroduplex promoter fragment in which −12 to +2 (NT) and −4 to +2 (T) are ss DNA, with a 13 bp downstream duplex [34]. C. Orientation of σ70 region 1 (residues 7-106) in E. coli RNAP holoenzyme. Subunits are colored as in panel A, expanded 120%. Gaps in electron density observed within the flexible linker are labelled and represented as red dots. D. The sequences of λPR, T7A1, and rrnB P1 from the −35 element to base +2 are shown for comparison. The −10 and −35 elements are underlined; the transcription bubble bases (λPR : −11 to +2; T7A1: −12 to +2) are shown in blue; base +1A is shown in red.
Sequence insertions at the position of β SI1 (and that of β’ SI3, also known as β’i6) are common but by no means universal in bacteria [22]. Deletion of SI1 in E. coli is nonlethal, though it does lead to temperature-sensitive growth [15, 23]. By contrast, a deletion mutant of SI3 is not viable [23, 24].
The details of how mobile regions like σ1.1, β’ jaw and SI3 contribute to the basal mechanism of transcription initiation currently are not well understood. Here, we investigate the effects of single and double RNAP deletion variants that remove in-cleft (σ1.1) and/or downstream mobile elements (DME; β’ jaw, SI3) on the lifetimes of the initial (I2) and final (RPO) OCs at two well-characterized promoters, λPR and T7A1. Variants investigated include partial (residues 1-55) or total (1-98) deletion of σ1.1 (designated △55 and △98, respectively) and deletions of either β’ jaw (residues 1149-1190 (△JAW)) or β’ SI3 (residues 943-1130 (△SI3)) (Figure 2). Double variants with part or all of σ1.1 as well as either β’ jaw or β’ SI3 deleted were studied to determine the extent of coupling between these regions.
From these results, we determine the contributions of these regions to the late steps of the transcription initiation mechanism, and deduce the network of conformational changes involving these mobile elements and the discriminator DNA sequence that forms the long-lived OC at λPR . We obtain compelling evidence that σ1.1, functioning as a nucleic acid mimic, competes with both the discriminator region of the NT strand and the downstream duplex to destabilize the OC (see Discussion). These deletion variant studies also explain why the T7A1 OC is relatively short-lived, and allow us to relate the final OC at T7A1 to the intermediate (I3) OC at λPR, both in terms of lifetime and structure.
RESULTS
Effects of deleting the three-helix bundle and linker regions of σ1.1 on the lifetime of the stable open complex at the λPR and T7A1 promoters
How do σ1.1 and its mobility affect OC stability? Deletion of RNAP σ1.1 increases OC lifetime (1/kd, where kd is the dissociation rate constant) at λPR [25] and the ribosomal promoter rrnB P1 [13]. To extend this data set, and as a basis for comparison with lifetimes of OCs formed by double deletion variants of RNAP, we quantified effects of two σ1.1 deletions (△55 and △98) on lifetimes of λPR and T7A1 OCs in TB at 37 °C. At this condition, we find that the lifetime of the WT RNAP-λPR OC is 17 hours (6.3 × 10⁴s), 170-fold longer than that of the corresponding WT RNAP-T7A1 OC (370 s). Dissociation kinetic data were obtained by the nitrocellulose filter binding assay using as competitor an excess of λPR +UP, a faster, stronger binding variant of λPR (see Materials and Methods). Representative kinetic assay results are shown in Figure 3; values of kd are listed in Table 1 and compared to other variants in Figures 5 and 6.
Figure 3.

Dissociation kinetic data for stable OCs formed by WT (white circles, black fit), △55 (purple circles and fit) and △98 (red circles and fit) RNAP, obtained by nitrocellulose filter binding. Nonlinear fits to Equation 1 are obtained from Igor Pro version 5.03 as described in Methods. A. Dissociation of λPR OCs at 37 °C. B. Data from A. replotted on a logarithmic time scale. C., D. Dissociation of T7A1 OCs at 37 °C, plotted and analyzed as in A. and B.
Table 1.
Dissection of dissociation rate constants kd into DNA closing (k-2) and open complex stabilization (K3) for various RNAP variant-λPR and -T7A1 promoter complexes
| kd (s−1) | k−2 (s−1) | K3 | |
|---|---|---|---|
| RNAP variant | λPR | ||
| WT | (1.6 ± 0.3) × 10−5 a | 3.3 ± 0.2 b | (2.1 ± 0.4) × 105 |
| Δ55 | (4.8 ± 0.6) × 10−6 | ||
| Δ98 | (2.9±0.4) × 10−6 | 1.8 ± 0.6 | (6.1 ± 2.2) × 105 |
| ΔJAW | (5.0±0.7) × 10−4 d | 0.58 ± 0.12 | (1.2 ± 0.3) × 103 |
| ΔSI3 | (1.6 ± 0.3) × 10−4 | 3.5 ± 0.4 d | (2.2 ± 0.5) × 104 |
| T7A1 | |||
| WT | (2.7 ± 0.4) × 10−3 | 0.63 ± 0.21 | (2.4 ± 0.8) × 102 |
| Δ55 | (1.1 ±0.1) × 10−3 | ||
| Δ98 | (1.5 ± 0.2) × 10−5 d | 0.81 ± 0.11 | (5.6 ± 0.7) × 104 |
| ΔJAW | (3.1 ± 0.9) × 10−3 | 0.47 ± 0.05 d | (1.5 ± 0.5) × 102 |
| ΔSI3 | (7.9 ± 0.8) × 10−3 d | 0.89 ± 0.10 | (1.1 ± 0.1) × 102 |
Previous determinations of kd for WT RNAP-λPR OC: kd = (1.9 ± 0.6) × 10−5 s−1 (DNA fragment extending from −115 to +76 was cut out of a plasmid and labelled) [5]; kd = (2.2 ± 0.3) × 10−5 s−1 (890 bp fragment containing both λPR and λPRM was cut out of a plasmid and labelled) [47].
Data from [5].
c Data from [7].
Uncertainty estimated as 10%.
Figure 5.
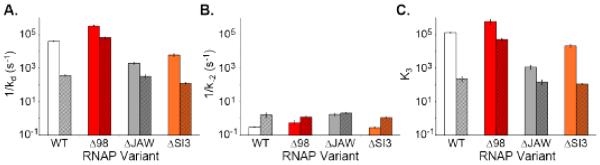
Lifetimes and stabilizations of λPR and T7A1 OCs formed with RNAP variants. Comparison of lifetimes of stable OCs (1/kd; panel A) and initial OC I2 (1/k−2; panel B), and OC stabilization equilibrium constants (K3; panel C) for λPR (unshaded, left bar of each pair) and T7A1 (shaded, right bar of each pair) promoters and for WT RNAP, σ1.1 deletion △98, and β’ deletions △JAW and △SI3. All bar graphs use same log scale vertical axis, starting at the same point, so heights can be visually compared.
Figure 6.

Comparison of lifetimes of stable OC (1/kd) and initial unstable OC (1/k−2) formed by λPR (blue) and T7A1 (red) promoters. The lifetime axis is on a logarithmic scale. Values for WT RNAP (first column) are compared with single deletions in σ1.1 (second column) and β’ DMEs (third column) and double deletions △55/△DME (fourth column) and △98/△DME (fifth column).
Figure 3 shows that the effects of deleting both the three helix bundle and the linker region of σ1.1 (△98) are very large, especially for T7A1, requiring a log time scale to compare dissociation kinetic data for △98 and WT RNAP visually. For T7A1, Figure 3 reveals that the lifetime of the △98 OC exceeds that of the WT by more than 100-fold, while for λPR the increase in OC lifetime with △98 is about 6-fold. By contrast, increases in lifetime upon deletion of only the three-helix bundle of σ1.1 (△55) are more modest (3-fold for λPR, 2.5-fold for T7A1), and slightly larger for λPR than for T7A1. The simplest interpretation of these data is that both regions of σ1.1 act to destabilize the stable OC, with the linker region (56-98) exerting a much larger effect than the three-helix bundle, especially for T7A1. These effects presumably arise from competition between these polyanionic regions of σ1.1 and polyanionic promoter DNA.
Effects of σ1.1 △98 deletion on lifetimes of T7A1 and λPR open complexes result primarily from differences in stabilization of the initial open complex (K3), not in the DNA closing rate (k−2)
What is the origin of the large differences in lifetime observed for T7A1 and λPR OCs with WT RNAP and σ1.1 variants? Kinetic-mechanistic studies of dissociation reveal that the lifetime of the stable OC is determined by the equilibrium constant K3 for converting the initial open intermediate I2 to the stable OC (RPO at λPR) and by the lifetime of the initial open complex, I2 (1/k−2; see Equation 2) [3, 5, 7]. Does the much greater lifetime of the stable OC at λPR than at T7A1 result from much greater OC stabilization (K3) and/or a much greater lifetime of I2? Does the very large increase in lifetime of the stable T7A1 OC observed upon deletion of σ1.1 (△98) result from a dramatic increase in K3, or a reduction in k−2, or both?
To determine DNA closing rate constants k−2 and thereby obtain OC stabilization equilibrium constants K3 from kd, we take advantage of the finding that K3 decreases strongly with increasing KCl concentration, while k−2 is salt-independent [5]. For the λPR promoter, kd increases with increasing salt concentration to attain a [salt]-independent plateau above ~1 M KCl where K3 is negligible (K3 << 1) and kd = k−2 = 3.3 ± 0.2 s−1 at 37 °C [5]. (Published results are replotted in Figure 4B.) Hence when RPO complexes are rapidly shifted to high [KCl], RPO immediately converts to I2, forming a high transient concentration (“burst”) of this key open intermediate which dissociates in a single exponential decay with rate constant k−2 .
Figure 4.
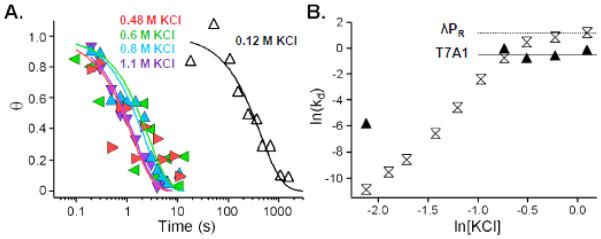
Kinetics of dissociation of T7A1-WT RNAP OCs. A. Nitrocellulose filter binding dissociation kinetic data for T7A1-WT RNAP complexes in TB (0.12 M KCl; white triangles with black fit) and after rapid mixing upshifts to 0.48 M (red triangles and line), 0.6 M (green triangles and line), 0.8 M (blue triangles and line), and 1.1 M KCl (purple triangles and line). B. Log-log dependences of dissociation rate constants kd for T7A1-WT RNAP (black triangles) OCs on KCl concentration at 37 °C. Data for λPR (white hourglasses), shown for comparison, are from [5]. At high salt concentration where K3 << 1, kd = k−2 which is found to be independent of salt concentration; these high-salt plateaus are shown by horizontal lines (T7A1: solid, average of four KCl points; λPR : dotted, from [5]).
Determinations of kd for dissociation of T7A1-WT RNAP OC after upshifts to moderate to high [KCl] (≥ 0.48 M) are compared with the corresponding kd determinations for λPR in Figure 4A. In TB at 0.12 M KCl, T7A1 is more than 100-fold faster dissociating than λPR. For upshifts to 0.48 M KCl or higher, kd for T7A1 exhibits a KCl-independent plateau value kd = 0.6 ± 0.2 s−1 (Figure 4B). As observed for λPR, this DNA closing rate is independent of salt concentration. For T7A1, I2 lifetime is approximately 5-fold longer than for λPR, while the stabilization equilibrium constant (K3 = 240 ± 80), though very significant, is almost three orders of magnitude less than for λPR (K3 = (2.1 ± 0.4) × 105) (see Table 1 and Figure 5). Hence the shorter lifetime of the T7A1-WT RNAP stable OC is entirely the result of differences in the OC stabilization step. The much smaller K3 for T7A1 explains the onset of the high salt plateau in kd at a much lower salt concentration (~0.5 vs. ~1 M KCl).
Lifetimes of initial OC (I2) formed by △98 RNAP at λPR and T7A1 promoters were also determined by this burst method, using upshifts to 1.1 M KCl. (Results are tabulated in Table 1 and compared to other variants in Figure 5 and Supplemental Figure 2). Effects of the △98 deletion on I2 lifetimes at both promoters are small: a two-fold increase for λPR and no significant effect for T7A1. Hence the effects of the △98 deletion are primarily on the OC stabilization equilibrium constant K3, especially for T7A1 where the △98 deletion increases K3 by ~250-fold (to (5.6 ± 0.7) × 104), almost to the value observed for the WT RNAP-λPR OC. By contrast, the △98 deletion results in a more modest ~3-fold increase in K3 at λPR.
Promoter-specific effects of β’ jaw DME deletion on initial and stable open complex lifetimes
Footprinting and dissociation kinetic studies revealed that the β’ jaw DME stabilizes λPR RPO by interacting with the downstream DNA duplex from +10 to +20 [7]. Recent crystal structures show that this jaw-downstream duplex interaction (centered at +15) is also present in initiation complexes [26]. Partial deletion of the jaw (β’△1149-1190; Figure 2) reduces the lifetime of the λPR stable OC to ~3% of the WT value [7, 9, 27]. Here we find that the origin of this effect is the massive destabilization of λPR RPO relative to I2 by deletion of the jaw, which reduces K3 to ~0.6% of its WT value (see Table 1, Figure 5 and 6 and Supplemental Figures 3 and 4). On the other hand, deletion of the jaw increases the lifetime of λPR I 2 (1/k−2) ~6-fold, making it comparable to that of the WT RNAP-T7A1 OC (Table 1, Figure 5, and Supplemental Figure 2).
In striking contrast to the stabilization at λPR, we find that deleting the jaw has no significant effect on the lifetime of either the stable or the initial OC at T7A1; values of kd, k−2, and K3 (Table 1, Figure 5) for OC formed with △JAW RNAP are the same within uncertainty as for WT RNAP. The lack of effect of the jaw deletion on K3 indicates that the jaw does not participate in the conformational changes and interactions with the downstream duplex that stabilize the T7A1 OC, and can explain much of the 100-fold difference in lifetimes of the stable OC with WT RNAP at these promoters.
Similar effects of SI3 DME deletion on lifetimes of λPR and T7A1 stable open complexes
The DME designated β’ SI3 (Figure 2) consists of two sandwich-barrel hybrid motifs extending from the middle of the trigger loop. Located high in the active site cleft at the downstream end, SI3 forms a large interface with the β’ jaw in the holoenzyme structure [28]. SI3 is required for proper regulation by transcription factors DksA [29] and GreB [30]. The SI3 deletion is lethal and has strong effects on initiation, elongation, pausing, and termination [23, 24]. The lethal effect of SI3 deletion is thought to result from its connection to the trigger loop. Modelling indicates that SI3 does not interact with the downstream duplex DNA in the stable OC and suggests that SI3 moves when the trigger loop folds during NTP addition cycle [28, 31]. Here we study the effects on OC lifetime and stabilization of a β’ SI3 deletion mutant (△SI3, β’ △943-1130).
Dissociation kinetic studies with stable λPR-△SI3 and T7A1-△SI3 OC (see Table 1, Figures 5 and 6, and Supplemental Figures 3 and 4) reveal a three-fold reduction in lifetime (1/kd) for T7A1 and a ten-fold decrease for λPR, relative to WT RNAP, similar to previously published results for T7A1 [23] and λPR [5]. Rapid salt upshift dissociation experiments were used to determined k−2 and the lifetime of the initial OC. As summarized in Figure 5 and Table 1 (kinetic data in Supplemental Figure 2) deletion of SI3 has at most a minor effect, possibly increasing k−2 slightly for both λPR and T7A1.
The main effect of △SI3 is therefore to reduce K3 for the I2 → RPO conversion, to 10% of the WT value for λPR and 50% for T7A1. These are significant but smaller effects relative to those of the deleting the jaw on λPR OC lifetime, or of deleting σ1.1 on T7A1 OC lifetime. This finding is consistent with the previous observation that for λPR, deleting SI3 did not significantly reduce the urea dependence of the dissociation rate constant at λPR [6], indicating no large effect of △SI3 on the folding/assembly interactions of the jaw and other regions involved in converting I2 to RPO at λPR. Like △JAW, the △SI3 mutation has a somewhat larger effect on kd and K3 for λPR than for T7A1, probably reflecting a greater degree of assembly of these DME in the stable λPR open complex than for T7A1. However, deletion of SI3 has small but detectable effects on both T7A1 kd and K3, while deletion of the jaw does not.
Striking Promoter-Specific Differences in Effects of Double Deletions of σ1.1 and a DME
Effects of double deletions (one in σ1.1, one in a β’DME) on lifetimes of stable λPR and T7A1 OC are reported in Table 2 and compared with single deletions in Figure 6. (Kinetic data are given in Supplemental Figures 3 and 4.) These data and Figure 6 reveal large context-depending differences (λPR vs T7A1, WT vs σ1.1 variant core RNAP). Fundamentally these differences appear to originate in a close coupling between effects of σ1.1 (especially linker region 56-98) and the β’ DME on OC lifetime, which we propose are present for both promoters but differ in detail for λPR and T7A1.
Table 2.
Dissociation rate constants kd for λPR and T7A1 stable open complexes with Δσ1.1/ΔDME deletion variants
| RNAP variant | λPR kd (s−1) | T7A1 kd (s−1) |
|---|---|---|
| Δ55ΔJAW | (2.6 ± 0.3) × 10−4 a | (8.4 ± 4.2) × 10−4 |
| Δ98ΔJAW | (2.1 ± 0.9) × 10−4 | (2.2 ± 0.2) × 10−4 a |
| Δ55ΔSI3 | (2.8 ± 0.3) × 10−5 a | (1.4 ± 0.1) × 10−3 |
| Δ98ΔSI3 | (1.9 ± 0.5) × 10−4 | (1.3 ± 0.5) × 10−4 |
Uncertainty estimated as 10%.
Comparison of the lifetimes of △98/△JAW RNAP OC at T7A1 and λPR with those of single deletion variants and WT RNAP (Figure 6) provides clear example of promoter-dependent linkages between σ1.1 and the jaw. Comparisons with the analogous set of lifetime data for △55 reveal large differences that implicate the chain region as the principal origin of the linked σ1.1-jaw effects on lifetime. Additional comparisons with sets of lifetime data for both single and double variants involving either △98 or △55 and the △SI3 instead of △JAW reveal quite parallel linkages between the SI3 and the σ1.1 chain region. Here, we summarize the key results.
Although deleting the jaw does not significantly affect the lifetime of the T7A1 stable OC compared to WT RNAP, deleting the jaw greatly (15-fold) reduces the lifetime of the △98 RNAP OC. This suggests that the stabilization of the T7A1 OC by the △98 deletion, relative to WT RNAP, is in large part the result of an interaction of the jaw that is absent in the WT OC.
At λPR, the effect of deleting the jaw is also greater in the context of the △98 deletion (70-fold) than in the context of WT RNAP (20-fold). For T7A1, deleting the jaw in the context of △55 has no significant effect, as for WT, while for λPR the effect of deleting the jaw in the context of △55 (50-fold) is intermediate between the △98 (70-fold) and WT (20-fold) contexts. For both promoters, context dependences of effects of SI3 deletion are broadly similar to those summarized above for deletions of the jaw, with some differences in the details. Deletion of SI3 causes as much as a 70-fold reduction in OC lifetime (in the context of △98 and λPR), but has no effect in the context of T7A1 and the △55 deletion variant.
Deletion of σ1.1 (△98) together with either DME largely eliminates the original 170-fold difference in lifetimes of WT RNAP-λPR and -T7A1 OC. Lifetimes of △98/△DME OC at both promoters are similar (4 × 10³s to 8 × 10³s), differing less than two-fold between λPR and T7A1 for either DME deletion. These lifetimes are in between those of OC with WT RNAP for the two promoters studied. △55/△JAW RNAP is almost as effective at equalizing OC lifetimes at these two promoters (3-fold difference), but △55/△SI3 RNAP is ineffective in this regard because of smaller, compensating effects of the two deletions that preserve the WT RNAP lifetimes.
In addition, deletions in σ1.1 trump DME deletions for T7A1, while the reverse is true for λPR. For T7A1, lifetimes of double variant OCs with a σ1.1 deletion and a DME deletion exceed that of WT RNAP, indicating that the increases in T7A1 lifetime expected as a result of these σ1.1 deletions (especially △98) outweigh the modest (△SI3) or minimal (△JAW) reductions in lifetime expected from the DME deletions. For λPR, the situation is reversed. Lifetimes of the double variant OCs are shorter than for WT RNAP-λPR, indicating that the reduction in λPR lifetime expected from the DME deletion outweighs the increase in lifetime expected from the σ1.1 deletion.
The only deletion investigated that approaches context-independence is △55. Deletion of this N-terminal three-helix bundle increases lifetime of stable OCs formed by WT, △JAW or △SI3 RNAP by 2-6 fold at both λPR and T7A1.
KMnO4 reactivity of T7A1 and λPR promoter DNA in stable △98 RNAP open complexes
To determine whether the increased lifetimes of OC formed by △98 RNAP at T7A1 and λPR promoters are accompanied by changes in the open region or distortions in other regions of the promoter DNA, KMnO4 footprints of both strands of WT and △98 stable OC at these promoters were obtained in TB at 37 °C (λPR: Figure 7A, B; T7A1: Figure 7C, D).
Figure 7.

Permanganate footprinting of △98 and WT RNAP OCs at T7A1 and λPR. Positions of KMnO4-reactive thymines are labelled, as determined from A+G sequencing lanes (lanes A8, B7, C1, and D1). λPR NT strand footprints (panel A) of △98 RNAP open complexes are shown in the absence (lanes 4,6) and presence (lanes 5,7) of 20 μg/ml heparin; that of WT RNAP (+ 20 μg/ml heparin) is shown in lane 3. Free DNA controls are shown in the absence (lane 1) andpresence (lane 2) of 20 μg/ml heparin.λPR T strand footprints (panel B) of △98 RNAP OC are shown in the absence (lane 5) and presence (lane 6) of 20 μg/ml heparin; that of WT RNAP (+ 20 μg/ml heparin) is shown in lane 4. Free DNA controls are shown in the absence (lanes 1,3) and presence (lane 2) of 20 μg/ml heparin. T7A1 NT strand (panel C) and T strand (panel D) footprints of △98 RNAP OC (lanes C5, D5) and WT RNAP (lanes C4, D4) are compared to free DNA controls, exposed to KMnO4 (lanes C3, D3) or not exposed to KMnO4 (lanes C2, D2). Conditions: TB, 37 °C; 0.2 mM KMnO4, 10 s [1].
These footprints show no differences in the size of the initiation bubble in △98 vs. WT OC. At λPR, T strand thymines at −11, −9, −8 and +1 are observed in both △98 and WT OCs, as are thymines at −4, −3 and +2 on the NT strand, defining a 13 base open region. MnO4− reactivities of λPR NT strand thymines are higher (for the same dose of MnO4−) for △98 than for WT RNAP on the NT strand, but appear similar for the T strand. Thymines at −10 and −7 on the NT strand are not MnO4− reactive in △98 OC or WT RNAP OC. Similar NT strand footprints were previously reported for WT and △100 RNAP OCs at λPR [14]. The lack of MnO4− reactivity of NT strand thymines at −7 and −10 is most simply explained if these bases are buried in pockets of σ region 2. From the crystal structures, evidence exists for a −7 pocket but not a −10 pocket. The −10 base is stacked on −9, which should reduce its MnO4− reactivity, but the upstream face of −10 appears accessible to MnO4− [32-34].
On the λPR T strand, for △98 but not WT OC, MnO4− hypersensitivity is observable immediately upstream of major promoter interaction sites including position −38 (at the upstream end of the −35 element), position −63 (at the upstream end of the UP element [35]), and position −81 (near the upstream end of the proposed upstream wrap [36] and near the upstream limit of the range of contact by the αCTD, according to crosslinking [12]). These MnO4− hypersensitivities indicate sites of DNA distortion/unstacking, presumably where the upstream DNA in the △98 RNAP open complex is strongly bent in wrapping it on RNAP. The precise origin of these hypersensitivities is unclear, but previous results have indicated an effect of deletion of σ1.1 on interactions with regions upstream of the active site cleft. DNase footprints with a variant RNAP lacking σ1.1 at the promoter Pmin show upstream enhancements around −40 and −50 [37]. At some promoters, the effects of σ1.1 deletion on the kinetics of OC formation and the structure of OC also depend on the length and sequence of the promoter spacer [37, 38].
At T7A1, T strand thymines at −12, −10, −6, −4 and +1 are observed in both △98 and WT OC, as are thymines at −7 and +2 on the NT strand, defining a 14 base open region. T strand MnO4− reactivity decreases from −12 to +1, with the intensity at +1T barely above background. Reactivity at each position is considerably stronger for △98 than for WT RNAP. On the NT strand, MnO4− reactivity at +2 is somewhat higher for △98 than for WT RNAP, but the reactivity difference on this strand between △98 and WT RNAP OC is not as great as for the T strand of T7A1 or for the NT strand of λPR. Thymines at −11 and −8, the analogs of −10 and −7 for λPR, are not MnO4− reactive for either △98 OC or WT RNAP OC.
In both WT-and △98-T7A1 OC, permanganate reactivity is observed in the UP element region in tracts of thymines at approximately −50 and −58 on the NT strand and −45, −55, −60, and −65 on the T strand. Presumably this reactivity is the result of DNA bending/distortion by tight binding of the αCTDs to the strong, near-consensus T7A1 UP element.
The promoter-specific increases in MnO4− reactivity of thymines in the open region of the NT strand (λPR) and the T strand (T7A1) in △98 OC are a clue to the structural differences in these complexes. Gries et al. [3] observed relatively large increases in MnO4 − reactivity in the conversion of the initial to the stable OC at λPR, as well as small increases in reactivity for −11, −9 and −8 (but not +1) thymines on the T strand. One interpretation of this result is that either the rearrangement of the discriminator region in this process and/or the tighter binding of the strand backbone in the stable OC increases MnO4− reactivity. Strong binding of the DNA phosphate-sugar backbone is observed to unstack the bases in the SSB-ss DNA complex [39] and a similar effect could explain the greater MnO4− reactivity of thymines in the stable vs. the initial λPR OC, and of one or the other strand in the λPR-△98 and T7A1 - △98 OC. Alternatively the elimination of the negatively charged σ1.1 may increase local concentrations of MnO− in the cleft of the △98 OC, leading to these reactivity increases. Neither of these possibilities explains why the increased reactivity is on the λPR NT strand and the T7A1 T strand.
DISCUSSION
Hypothesis to explain the large differences in lifetime of open complexes at different promoters and for different RNAP variants
We propose that σ1.1 and the jaw and SI3 DME participate in a sophisticated network of interactions and conformational changes, directed by the discriminator element, to determine the extent of OC stabilization. For λPR, with its 6 base discriminator and G/G bases at positions −6/−5 at the upstream end, this stabilization exceeds 105 [5]. For T7A1, with a 7 base discriminator and T/A bases at positions −7/−6, the stabilization is a very significant but more modest factor of 240, a difference which we find is due in part to the lack of involvement of the jaw.
Previously we deduced that the jaw engaged on the far downstream DNA (+10 to +20) late in the process of RPO formation at λPR, and that the complexes formed by △JAW RNAP at full-length λPR and by WT RNAP on λPR truncated downstream at +12 were analogues of the I3 intermediate OC (see Figure 8) at this promoter [7]. Based on our current findings, we propose that the stable T7A1 OC is also analogous in lifetime and structure to the late I3 intermediate at λPR.
Figure 8.
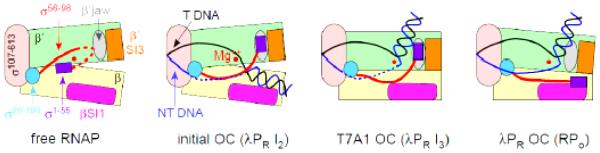
Interactions between RNAP elements and promoter DNA that define properties of the various OCs, compared with free RNAP (see Discussion). Note that only the DNA strands from ~ −10 to +20 are shown.
rrnB P1, with a 8 base discriminator and G/C bases at positions −8 and −7 (see Figure 2), exhibits little if any stabilization of the initial OC. On linear DNA in the absence of NTP the rrnB P1 OC is short-lived and thermodynamically unstable relative to closed complexes. We therefore propose that the rrnB P1 OC is an analogue in lifetime and structure of the initial OC (I2) at λPR and T7A1 promoters. In support of this proposal, I2 lifetimes are found to be similar for λPR and T7A1 for all RNAP variants studied here. Mutation of −7 C to G increases the lifetime of the rrnB P1 OC 40-fold [40], which may result entirely from the interaction with −7G, or may also involve some in-cleft and downstream elements responsible for stabilization of OC at T7A1 and λPR promoters.
Roles of the discriminator and RNAP in the conformational changes and interactions thatstabilize the open complexes at λPR and T7A1
To investigate the network of conformational changes and interactions that stabilize λPR and T7A1 OC, we have determined the effects of deletion of σ1.1, β’ jaw and β’ SI3, on OC lifetime (1/kd) and in many cases OC stabilization (K3 = k−2/kd). For purposes of this discussion, we assume that the effect of deleting a region is a direct indication of the effect of that region, though we recognize that longer range effects from changes in location and folding of nearby regions may accompany the deletion.
Interactions in highly stable open complexes
The maximum stabilization observed is K3 = 6.1 × 10⁵ for the △98-λPR OC (−8 kcal in △G°). Both WT-λPR OC (K3 = 2.1 × 10⁵) and △98-T7A1 OC (K3 = 5.6 × 10⁴) are also highly stabilized. We propose that all these long-lived OC are stabilized by similar interactions (Figure 8).
a)On the NT strand, bases −5 and −6 interact with σ1.2 while bases −4 to +2 (the CRE) are bound in a positively charged “CRE track” [34] on β in the cleft. The smaller stabilization of △98-T7A1 OC than of WT λPR and △98-λPR OCs is probably because interactions of its discriminator with σ1.2 and/or the CRE track are less favorable than for λPR.
b)The jaw is bound to the downstream duplex (in the region +10 to +20) as part of an assembly with SI3 and other DME, probably including the β’ clamp [2, 7]. This interaction is proposed to involve residues T1169, R1174, and M1189 [17]. Nonspecific coulombic interactions with the phosphate backbone are also involved, as evidenced by the greatly reduced power dependence (from 9.5 to 4.7 power) of the salt effect on kd for λPR-△JAW OC [7].
c)σ1.1 is absent or is ineffective at destabilizing this OC, probably because it is interacting with β SI1 [12] (see Figure 8).
d)The cleft is closed.
These interactions are tightly coupled, as indicated by the non-additive effects of the RNAP deletion variants. For example, deletion of σ1.1 and the jaw together result in a net stabilization of the T7A1 OC, but a net destabilization of λPR, eliminating the large difference in OC stabilization for these two promoters. Effects of β’ SI3 also appear coupled to those of σ1.1 in OC stabilization.
The ineffectiveness of σ1.1 in destabilizing WT RNAP-λPR RPO indicates that it is bound elsewhere. The N-terminal bundle of σ1.1 moves to interact with β SI1, located at the top of the cleft (Figure 2), during stable OC formation at the consensus lac promoter, which has a 6 base discriminator with upstream sequence −5T and −6G, similar to λPR [12]. The σ1.1 linker region is presumably high in the cleft, interacting with β and unable to compete with NT DNA for binding to the CRE track.
The above proposals are consistent with the structure of a stable OC between T. thermophilus RNAP (lacking σ1.1 and the jaw DME) and a short (ending at +13) DNA heteroduplex with a λPR - like discriminator (upstream GG, 6 bases long) [34]. The −5G and −6G bases interact with σ1.2 whereas bases −4 to +2 are bound to β, making interactions with β residues R371, D199, R394, and W183 [34] (E. coli residue numbering is used throughout). This β surface is net positively charged, indicating the likelihood of coulombic interactions with the discriminator DNA backbone or the negatively charged σ1.1 linker with this surface of β. In E. coli holoenzyme, helices 1 and 2 of the σ1.1 three-helix bundle are bound to a surface of β immediately above this CRE track, including H165, S166, R197, R202, and K203 [16]. This three-helix bundle almost certainly moves earlier in OC formation, perhaps to allow entry of the downstream duplex to the cleft prior to opening. The positive patch on β exposed upon this movement may be a binding site for the σ1.1 linker or the discriminator strand in one or another OC.
Interactions in moderately stable open complexes
The final WT-T7A1 OC (K3 = 240) and λPR I3 are only moderately stabilized relative to I2, indicating that key interactions that stabilize the WT-λPR OC are missing or compromised. We propose that σ1.1 (linker and bundle) exchange places and interactions with the discriminator NT strand and downstream duplex DNA in the conversion of the late λPR I3 to RPO and that the stable T7A1 OC is structurally similar to I3. In T7A1 OC (or λPR I3) we propose that:
a)The discriminator region of the NT strand is not bound to σ1.2 or to the CRE track, and presumably is higher in the cleft, possibly interacting with the same cluster of positively charged groups that bind the three-helix bundle in holoenzyme (see above), directly above the CRE track.
b)The jaw does not interact with downstream duplex DNA, and may instead interact with the 3-helix bundle of σ1.1.
c)A region of the σ1.1 linker is bound in the CRE track; and
d)The cleft may be less closed.
These proposals are consistent with the observations that deleting the jaw or SI3 has only a small effect on the lifetime and stability of the WT RNAP-T7A1 final OC, whereas deleting the entire σ1.1 dramatically stabilizes this OC, presumably by allowing the discriminator region of the NT strand to bind to σ1.2 and the CRE track, and allowing the jaw to bind to the downstream duplex. This dramatic stabilization is substantially reversed by deleting the jaw as well. We propose that a negatively charged region of the σ1.1 linker interacts with the CRE track. The highly negatively charged three-helix bundle may mimic ds DNA in interacting with the jaw or SI1.
What regions of σ1.1 might be involved in these steps? On the three-helix bundle, the eight highly conserved [14] negatively-charged (4D, 4E) residues out of 17 amino acids between residues 26-42 (Supplemental Figure 1) plausibly are a duplex DNA mimic, competing with the downstream duplex for binding to the jaw DME. A simplistic interpretation of the large effect of the jaw deletion on the power law exponent Skd = dln(kd)/dln[salt] [7] is that the jaw-duplex interaction involves +/− charge interactions with at least 6 DNA phosphates. We concluded that the jaw binds to one face of the DNA helix in the +10 to +20 region, making up to 10 phosphate interactions (similar to the 8 negative charges from residues 26-42).
There are three additional clusters of negative charge in σ1.1. The largest cluster (3D, 3E) is in the structurally-undefined region (residues 57-69). A second (2D, 2E; residues 73-78) and a third cluster (1D, 2E; residues 88-96) are separated by the uncharged α-helical region of the linker. All three clusters are moderately to highly conserved [14]. Based on charge distribution alone, the first cluster is the most logical candidate for the proposed exchange with the 6 base CRE region. However, proximity in the crystal structure suggests that the third region, which is contiguous to σ1.2, may also or instead be involved in competition with the CRE.
We propose that the key structural difference between the final OC at λPR and T7A1 is similar to that between λPR RPO and λPR I3. These differences are in the positions and interactions of the discriminator DNA and linker region of σ1.1 in the cleft, and of the downstream duplex DNA and the three helix bundle of σ1.1 relative to the jaw and SI3 DME. In converting λPR I3 to λPR RPO, the polyanionic σ1.1 N-terminal three-helix bundle changes places with duplex DNA and the polyanionic σ1.1 linker region changes places with the discriminator strand. The competition between duplex DNA and duplex DNA mimic, and between ss DNA and ss DNA mimic, determine whether the structure and lifetime of the OC are like the highly stable (λPR RPO-like) or moderately stable (T7A1-like or λPR-I3 like) OC. Since (at the level of kd) △55 deletions have much smaller effects than △98 deletions, the key element of σ1.1 is its flexible, polyanionic chain region (residues 56-98).
Deletion of a β’ DME reduces K3 for stabilization of the WT RNAP-T7A1 OC by approximately 50%, and hence β’ DME do not contribute significantly to the interactions involved in converting I2 to the T7A1 final OC or to the analogous λPR I3. What elements stabilize λPR I3 relative to I2, and stabilize T7A1 relative to rrnB P1? Various other candidates have been identified as potentially important for OC stabilization, including the β’ clamp (residues 131-347, 1260-1368). Deletion of β’ residues 215-220 reduces the OC lifetime ~40-fold at λPR and ~15-fold at rrnB P1 [41]. A comparison of effects of these deletions on k−2 and K3 for λPR and T7A1 promoters should be very informative.
Possible interactions in unstable open complexes
In the conversion of λPR I3 to RPO (or in comparison of T7A1 OC to λPR RPO) the discriminator region of the NT strand descends in the cleft and the σ1.1 linker region ascends. Possibly this pattern extends to initial (unstable) OC like I2 at λPR or T7A1, or to the unstable rrnB P1 OC. In these unstable OCs, we propose that:
a)The downstream duplex interacts with SI1 and the bubble NT strand is located high in the cleft, occupying positions that interact with the three-helix bundle and the flexible chain of σ1.1 in the most stable OCs
b)The jaw interacts with the σ1.1 three-helix bundle.
c)The region of the σ1.1 linker adjacent to σ1.2 is bound in the CRE track. A second negatively charged patch of the σ1.1 chain may interact with the positively charged region above this track, preventing the discriminator from binding there, as it may do in T7A1 or λPR I3 OC.
d)The cleft may be open, and binding interactions of the strand backbones in the cleft may be weak because the phosphates are not dehydrated.
Gries et al [3] obtained information about the condition of the open DNA in I2 at λPR and the changes in converting I2 to RPO from MnO4 footprinting. The entire initiation bubble (−11 to +2) opens in the step forming I2 from the advanced I1 intermediate. In I2, the −10 region of the NT strand is already tightly bound to σ2; thymines at −10 and −7 are not MnO4− –reactive, as is the case for RPO. Reactivities of T strand thymines in I2 and RPO are similar in the upstream region (25% less reactive in I2) and identical for the start site (+1) thymine, consistent with the proposal that in I2 this strand has descended to put the +1 base in or near the active site. But thymines in the discriminator region of the NT strand (−4, −3; also +2) are only half as reactive in I2 as in RPO. Therefore, Gries et al concluded that conversion of I2 to RPO involves a significant conformational change in the discriminator region of the NT strand, and a lesser conformational change in the upstream region of the T strand, but without a change in the start site region.
One interpretation of the difference in MnO4− reactivity of the discriminator is that the DNA backbone of this region is not as tightly held in I2, allowing these bases to stack and hence reducing their MnO4− reactivity. Likewise, the backbone of the upstream region of the T strand may be somewhat less tightly bound in I2 than in RPO. These proposals are based on the observation, discussed above, that substantial base unstacking occurs in backbone-binding of single-stranded DNA to SSB [39]. Significant base unstacking in the conversion of I2 to RPO is a likely explanation of the large positive enthalpy change (△Ho) of this conversion, which is responsible for the observed negative activation energy of the dissociation rate constant [42,43].
The DNA closing step (k−2)
DNA closing rate constants (k−2) for all RNAP variants and both promoters cluster in a small range from about 0.6 s−1(T7A1) to 3 s−1 for λPR (see Figure 6). Deletions of σ1.1 or the jaw reduce the λPR closing rate somewhat, but have no effect on the T7A1 closing rate. With △JAW RNAP, λPR and T7A1 closing rates are the same. For λPR, deletion of σ1.1 or the jaw also reduces the forward isomerization rate which includes DNA opening [7, 14], but the effect on the intrinsic opening rate is not known [1].
Because nucleic acids are so highly charged, DNA helix formation kinetics in solutionare a strong function of salt concentration [44]. The observation that the rate of the DNA closing step on RNAP is independent of salt concentration is explained by the fact that the DNA is in the cleft, and the phosphates are interacting with cationic side chains of RNAP rather than with salt ions. Likewise the kinetics of isomerization of the advanced closed intermediate at λPR, and consequently the thermodynamics of the DNA opening-closing step (K2) are only weakly salt concentration dependent [4], very different from the situation for DNA opening-closing in solution.
The lack of effect of the jaw deletion on the DNA closing rate constant k−2 for T7A1 OC, together with the similarity of k−2 values for λPR and T7A1 OC with △JAW RNAP, indicates that the DNA closing step for the WT RNAP-λPR OC with the jaw present and originally engaged is facilitated relative to the situation where the jaw is missing (△JAW) or disengaged (T7A1). For T7A1, the jaw plays no role in DNA closing and in stabilizing OC, while for λPR the jaw affects many steps, if not every step, of the mechanism, including DNA opening/closing [7].
Elsewhere we have discussed the analogy between the mechanism of OC formation and stabilization and that of enzyme catalysis [1]. The rate-determining DNA opening-closing steps are the analogues of the forward and reverse catalytic steps, which also are generally rate-determining. Regulation of the kinetics of enzyme catalysis is largely from effects of inhibitors, activators, solutes or cooperativity of multisubunit enzymes on the equilibrium constants of the initial steps of substrate binding and subsequent conformational changes, and we have proposed that the same is true of the kinetics of OC formation and dissociation. Changes in RNAP elements like σ1.1 or binding of ligands or factors in the active site cleft are likely to affect the intrinsic opening-closing process. Changes in promoter sequence, solute and salt concentration, and in concentrations of ligands and protein factors that do not bind in the active site cleft are most likely to affect the equilibrium constants of the reversible steps that bind,bend, and wrap the promoter duplex to put the downstream duplex in the cleft prior to opening, and the equilibrium constant (K3) that determines the stabilization of the OC.
Roles of these mobile elements earlier in transcription initiation
Each of the regions of RNAP investigated in this work has a large effect on OC lifetime for at least one of the two promoters studied. The presence of the β’ jaw and SI3, which form part of the DME assembly on the DNA downstream of the active site cleft, strongly increase OC lifetime at λPR while σ1.1 greatly reduces OC lifetime, especially at T7A1, and all of these effects are elaborately coupled. As discussed above, σ1.1 and the β’ jaw also influence the rate of OC formation. In particular, deletion of σ1.1 greatly reduces the rate of isomerization, including DNA opening [14]. By analogy with the behaviour of UT-47 vs. FL λPR, we propose that deletion of σ1.1 shifts the ensemble of closed complexes (I1;see Figure 1) back to less advanced species in which the downstream DNA is not fully bent into the cleft, thereby greatly reducing the isomerization rate. Deletion of the β’ jaw reduces k2 but, intriguingly, also appears to reduce K1 [7]. Deletion of SI3 increases K1, but has no significant effect on k2 (E. Ruff, unpublished data). We hypothesize that by affecting multiple steps of OC formation, these various regions make RNAP exquisitely tuneable to regulation during initiation. This is an important property of group 1 σ factors and core RNAP, which orchestrate coordinated expression of thousands of promoters that differ greatly in their sequence signatures, strength, and regulatory inputs.
MATERIALS AND METHODS
Buffers
All buffers are the same as those used previously [7]. RNAP storage buffer contains 50% v/v glycerol, 0.01 M Tris (pH 7.5 at 4 °C), 0.1 M NaCl, 0.1 mM DTT, and 0.1 mM Na2 EDTA. Tris buffer (TB) for kinetics experiments contains 0.04 M Tris (adjusted with HCl to pH 8.0 at the temperature of the experiment), 0.12 M KCl, 0.01 M MgCl2, 1 mM DTT, and 100 μg/mL BSA. DTT was omitted for permanganate footprinting experiments.
Protein preparation
WT RNAP core and holoenzyme were endogenously expressed and purified from E. coli MG1655 as described [3], or were reconstituted using core expressed from pVS10 and purified as previously described [45]. No significant difference was observed between reconstituted and endogenously expressed WT holoenzyme. △JAW RNAP core (△β’1149-1190) was prepared from pIA1024 and purified as previously described [20]. △SI3 RNAP core (△β’ 943-1130) was prepared from pIA329 and purified as previously described [23] with minor modifications. σ70 with residues 1-98 deleted (△98) was prepared from pIA389 and purified as previously described [45]. σ70 with residues 1-55 deleted (△55) was prepared from pIA1129. All protein stocks were dialyzed into RNAP storage buffer and stored at −80°C. Working stocks were stored in RNAP storage buffer at −20 °C.
RNAP holoenzymes with σ1.1 deletions (△55, △98) were reconstituted by incubating 5 μM WT, ?JAW, or △SI3 core RNAP with 5 μM σ△98 or △55 for 1 hour at 37 °C. Holoenzymes containing WT σ were reconstituted by incubating WT, △JAW, or △SI3 core RNAP with σ70 in a 1:2 ratio at either 5 or 6 μM core for 1 h at 37 °C. Essentially 100% of RNAP reconstituted from His-tagged WT core and WT σ is active in OC formation, as judged by filter binding titrations at high (X? nM) concentrations of λPR promoter DNA [42]. About 50% of RNAP reconstituted with △JAW core and WT σ is active in OC formation. However only about 10% of RNAP prepared from WT σ and △SI3 core, or from σ1.1 variants (△55, △98) and WT or variant core, is active in OC formation. The inactive RNAP in these samples should not affect dissociation kinetic assays with excess competitor, since only the decay of the population of OC is being observed.
PCR synthesis and purification of promoter DNA
All DNA oligomers were obtained from IDT (Coralville, IA) and purified using standard desalting or PAGE. Radioactive nucleotides were ordered from Perkin-Elmer (Waltham, MA). All enzymes used in DNA preparation were ordered from NEB (Ipswitch, MA), except for Sequenase, which was obtained from Affymetrix (Santa Clara, CA).
λPR DNA duplex fragments were prepared, radiolabeled and purified either as described [7] or by PCR amplification of a 120 base pair template with the WT λPR sequence from base −60 to +20. For preparation of the 120 base pair fragment, two oligonucleotides with a central overlap of 13 bp were designed to generate λPR fragment (−70 to +31): 5’ end: 5’-CCA CGAATT CGG ATA AAT ATC TAA CAC CGT GCG TGT TGA CTA TTT TAC CTC TGG CGG TG-3’; and 3’ end: 5’-ACA AAA GCT TCA TAC AAC CTC CTT AGT ACA TGC AAC CAT TAT CAC CGC CAG AGG T-3’. These oligos were mixed with an excess of short primers: HTOP: 5’-CCA GCA TTC CTC CAC GAA TTC-3’; and HBOT: 5’-CAC CTG CAC CGA CAA AAG CTT-3’, extended using Taq or Vent DNAP, and purified using QIAquick PCR purification kits (Qiagen). 32P-labeled λPR DNA was generated by PCR using γ-32P-labeled HTOP primer. Kinetic data obtained with these fragments for WT and △JAW RNAP agree with previously published results on promoter fragments prepared by other methods [5, 7, 23, 43].
T7A1 DNA duplex fragments were prepared, radiolabeled, and purified by PCR amplification of a 120 base pair template with the WT T7A1 sequence from base −60 to +1. Two oligonucleotides with a central overlap of 13 bp were designed to generate T7A1 fragment (−70 to +31): 5’ end: 5’-CCA CGA ATT CAA TTT AAA ATT TAT CAA AAA GAG TAT TGA CTT AAA GTC TAA CCT ATA G-3’; and 3’ end: 5’-ACA AAA GCT TAT TCG CCG TGT CCC TCT CGA TGG CTG TAA GTA TCC TAT AGG TTA GAC-3’. These oligos were mixed with an excess of short primers, HTOP and HBOT, extended using Taq or Vent DNAP, and purified using QIAquick PCR purification kits (Qiagen).32P-labeled T7A1 DNA was generated from PCR using γ-32P-labeled HTOP primer.
T7A1 footprinting data were obtained using a longer fragment with the T7A1 sequence from base −60 to base +2: 5’-AGT CAC TCG AGG GCC CAG GAA ACA GCT ATG ACC ATG ATT ACG CCA AGC TTG CAT GCC TGC AGG CTT GAA CAG TAT TTA AAA TTT ATC AAA AAG AGT ATT GAC TTA AAG TCT AAC CTA TAG GAT ACT TAC AGC CAT CGA GAG GGA CAC GGG GAA GGA ACA ACG CAT AAC CCT GAG ATA TCG ATC CAT GCG CG-3’ This fragment was purchased as two single strands, annealed, and then amplified by PCR using primers “T7A1_downstream_XhoI,” 5’-CGC TCG AGG ATC GAT ATC TCA GGG TTA TGC G-3’ and “T7A1_upstream_EcoRI,” 5’-AGT CAG AAT TCG GCC CAG GAA ACA G-3’. To end-label the NT strand of the PCR-amplified fragment, after cutting with XhoI (New England Biolabs), the end was filled in using Sequenase with α-32P-labeled dTTP and unlabelled dATP, dGTP and dCTP.32P-labeled T strand DNA was generated by PCR using γ-32P-labeled “T7A1_downstream_XhoI” primer.
Unlabelled +UP-λPR promoter fragment was made by PCR from the pCAD5 plasmid, prepared using a previously-described protocol [46] with minor modifications [7]. For use as competitor in the dissociation assays reported here, 172 base pair λPR +UP fragments (extending from −130 to +42) were prepared by PCR amplification of pCAD5 using the following primers: 5’ end: 5’-A GGA CCC GGG AGT CAC GAC GTT GTA AAA CGA CGG CCA GTG AAT TCG AGG-3’; 3’ end: 5’-GA GTA CTC GAG CGG GAT CCG ATA TCT AGA TAC AAC CTC CTT AGT-3’.
PCR-labelled promoter DNA for most dissociation experiments was purified using spin columns (Qiagen). PCR-labelled promoter DNA for footprinting and some dissociation experiments was purified further, either by excising the promoter band after electrophoresis on a 5% acrylamide gel and eluting from an Elutip-d Purification Minicolumn (Whatman; GE Healthcare, Pittsburgh, PA), or by electrophoresis on a 1.3% low-melt agarose gel and subsequent purification with a Wizard SV Gel and PCR Clean-Up Kit (Promega; Madison, WI).
Nitrocellulose filter binding dissociation kinetic assays
Dissociation kinetic assays were performed as previously described [7, 47]. OCs were formed by incubating 2-5 nM RNAP (total concentration) with ~0.5 nM 32P-labeled promoter DNA fragment for 0.5-3 hours at 37 °C. Irreversible dissociation was initiated by addition of heparin (at specified concentration) or 20-50 nM +UP-λPR unlabelled promoter (in ~10-fold excess over the total concentration of RNAP). For dissociation assays lasting longer than ~2 days, DTT concentration was increased to 6 mM and reactions were supplemented with DTT throughout the time course. Salt-upshift burst dissociation assays at 1.1 M KCl, used to determine rate constant k−2, were performed as previously described [5].
Analysis of kinetic data
Analysis of dissociation kinetic data
Dissociation of RNAP-promoter OC is single-exponential. Observed dissociation rate constants kd were determined by fitting data to the equation
| Equation 1 |
where θt, θ0, and θplateau are the fractions of promoter DNA present as open complexes at time t, at time t = 0, and at t → ∞, respectively, determined by filter binding as in [7]. For OC formed with WT RNAP and PCR-labelled, gel-purified promoter DNA, θ0 was typically ~90-100% (after correction for filter efficiency), and θplateau was ~5-10%. For OC formed with WT RNAP and PCR-labelled promoter DNA purified by spin columns (Qiagen), θ0 was typically ~60-70% (probably due to residual labelled primers), and θplateau (stable over ~5 days) was about 30%. For RNAP variants, θ0 was often lower, and in the worst case, for the weaker binding, less active RNAP deletion variant △98/△SI3, values of θ0 were as low as 15%, but always at least 50% larger than θplateau. Control experiments were performed comparing DNA purified by gel and by spin columns, and the kd values were found to be the same within uncertainty.
All data were fit nonlinearly to Equation 1 using the programs Sigmaplot or Igor 3.0. No significant difference was observed in fitting parameters obtained with these two programs. Determination of the DNA closing rate constant k−2 and the OC stabilization equilibrium constant K3 from salt upshift dissociation kinetics (burst experiments) Although the mechanism of dissociation is multi-step (Figure 1), the kinetics of dissociation are single exponential for both promoters and all RNAP variants studied here. Single-exponential kinetics indicates that the unstable open intermediate I2 rapidly reverses to the stable OC (RPO at λPR), on the time scale of its conversion of I2 to I1 (with DNA-closing rate constant k−2) [5]. Hence the observed dissociation rate constant kd is interpreted as:
| Equation 2 |
where K3 is the equilibrium constant for conversion of I2 to the stable OC (RPO at λPR) [5].
Salt upshift “burst” experiments with the rapid quench mixer are used to determine k−2. These take advantage of the observation that k−2 is independent of salt concentration while K3 decreases strongly with increasing salt concentration. At or above 1.1 M KCl, K3 << 1 and kd = k−2, whereas at the low salt conditions of the standard dissociation assay for kd typically K3 >> 1 and kd = k−2/K3. Since k−2 is salt-independent, K3 at the low-salt dissociation condition is obtained from K3 = k−2/kd. Uncertainties in reported values of K3 are determined by propagation of the independent uncertainties in k−2 and kd.
Determination of experimental uncertainty
Reported values of kd and k−2 for dissociation of final (stable) and initial open complexes are averages of at least two, and in some cases as many as five, independent experiments. For two determinations, experimental uncertainties are estimated from differences between the average and the individual kd values; for larger data sets, the uncertainty represents the standard error of the mean. Where the uncertainty determined by these methods was less than 10%, we have assigned a 10% uncertainty as noted in Tables 1 and 2.
KMnO4 footprinting
OC were formed by incubating 20 or 40 nM RNAP (active concentration) with ~1 nM promoter DNA in modified TB (without DTT) for 1 hour at 37 °C. When indicated, samples were challenged for 10 s with 20-50 μg/ml heparin, after which 0.2 mM KMnO4 was added for 10 s, followed by a quench with 1 M β-mercaptoethanol. Subsequent workup and analysis were as described [7].
Supplementary Material
HIGHLIGHTS.
Open complex (OC) lifetime is a transcription regulation target in E. coli .
In stable λPR OC, discriminator binds to a track in cleft and duplex binds to β’jaw.
In less stable T7A1 and λPR I3 OC, σ1.1 binds to same discriminator track and β’ jaw.
Deleting both σ1.1 and β’ jaw or β’SI3 equalizes OC lifetimes for λPR and T7A1.
Understanding roles of these RNAP mobile elements will facilitate design of antibiotics.
ACKNOWLEDGEMENTS
We thank Dr. Ruth Saecker for her insights into and discussions of RNAP and the conformational changes in transcription initiation that led to this research. We thank Dr. Ran Furman and Dr. Caroline Davis for initial experiments. We thank Prof. Richard Gourse, Prof. Robert Landick, and their laboratories for helpful discussions. This work was supported by the National Institutes of Health (GM103061 to M.T.R. and GM067153 to I.A.).
Abbreviations
- OC
open complex
- DME
downstream mobile element
- NT
nontemplate
- T
template
- CRE
core recognition element
Footnotes
Publisher's Disclaimer: This is a PDF file of an unedited manuscript that has been accepted for publication. As a service to our customers we are providing this early version of the manuscript. The manuscript will undergo copyediting, typesetting, and review of the resulting proof before it is published in its final citable form. Please note that during the production process errors may be discovered which could affect the content, and all legal disclaimers that apply to the journal pertain.
REFERENCES
- [1].Ruff EF, Artsimovitch I, Record MT., Jr. Initial Events in Bacterial Transcription Initiation. Biomolecules. 2015;5:1035–62. doi: 10.3390/biom5021035. [DOI] [PMC free article] [PubMed] [Google Scholar]
- [2].Saecker RM, Record MT, Jr., deHaseth PL. Mechanism of Bacterial Transcription Initiation: RNA Polymerase-Promoter Binding, Isomerization to Initiation-Competent Open Complexes, and Initiation of RNA Synthesis. J Mol Biol. 2011;412:754–71. doi: 10.1016/j.jmb.2011.01.018. [DOI] [PMC free article] [PubMed] [Google Scholar]
- [3].Gries TJ, Kontur WS, Capp MW, Saecker RM, Record MT., Jr. One-step DNA melting in the RNA polymerase cleft opens the initiation bubble to form an unstable open complex. Proc Natl Acad Sci USA. 2010;107:10418–23. doi: 10.1073/pnas.1000967107. [DOI] [PMC free article] [PubMed] [Google Scholar]
- [4].Kontur WS, Capp MW, Gries TJ, Saecker RM, Record MT., Jr. Probing DNA Binding, DNA Opening, and Assembly of a Downstream Clamp/Jaw in Escherichia coliRNA Polymerase-λPR Promoter Complexes Using Salt and the Physiological Anion Glutamate. Biochemistry. 2010;49:4361–73. doi: 10.1021/bi100092a. [DOI] [PMC free article] [PubMed] [Google Scholar]
- [5].Kontur WS, Saecker RM, Capp MW, Record MT., Jr. Late steps in the formation of the E. coli RNA polymerase-λPR promoter open complexes: Characterization of conformational changes by rapid [perturbant] upshift experiments. J Mol Biol. 2008;376:1034–47. doi: 10.1016/j.jmb.2007.11.064. [DOI] [PMC free article] [PubMed] [Google Scholar]
- [6].Kontur WS, Saecker RM, Davis CA, Capp MW, Record MT., Jr. Solute Probes of Conformational Changes in Open Complex (RPO) Formation by Escherichia coli RNA Polymerase at the λPR Promoter: Evidence for Unmasking of the Active Site in the Isomerization Step and for Large-Scale Coupled Folding in the Subsequent Conversion to RPO. Biochemistry. 2006;45:2161–77. doi: 10.1021/bi051835v. [DOI] [PMC free article] [PubMed] [Google Scholar]
- [7].Drennan AC, Kraemer MR, Capp MW, Gries TJ, Ruff EF, Sheppard C, et al. Key Roles of the Downstream Mobile Jaw of Escherichia coli RNA Polymerase in Transcription Initiation Biochemistry. 2012;51:9447–59. doi: 10.1021/bi301260u. [DOI] [PMC free article] [PubMed] [Google Scholar]
- [8].Mekler V, Minakhin L, Borukhov S, Mustaev A, Severinov K. Coupling of Downstream RNA Polymerase-Promoter Interactions with Formation of Catalytically Competent Transcription Initiation Complex. J Mol Biol. 2014;426:3973–84. doi: 10.1016/j.jmb.2014.10.005. [DOI] [PMC free article] [PubMed] [Google Scholar]
- [9].Mekler V, Minakhin L, Severinov K. A critical role of downstream RNA polymerase-promoter interactions in the formation of initiation complex. J Biol Chem. 2011;286:22600–8. doi: 10.1074/jbc.M111.247080. [DOI] [PMC free article] [PubMed] [Google Scholar]
- [10].Mekler V, Minakhin L, Sheppard C, Wigneshweraraj S, Severinov K. Molecular Mechanism of Transcription Inhibition by Phage T7 gp2 Protein. J Mol Biol. 2011;413:1016–27. doi: 10.1016/j.jmb.2011.09.029. [DOI] [PMC free article] [PubMed] [Google Scholar]
- [11].Mekler V, Pavlova O, Severinov K. Interaction of Escherichia coli RNA Polymerase σ70 Subunit with Promoter Elements in the Context of Free σ70, RNA Polymerase Holoenzyme, and the β'-σ70 Complex. J Biol Chem. 2011;286:270–9. doi: 10.1074/jbc.M110.174102. [DOI] [PMC free article] [PubMed] [Google Scholar]
- [12].Mekler V, Kortkhonjia E, Mukhopadhyay J, Knight J, Revyakin A, Kapanidis AN, et al. Structural organization of bacterial RNA polymerase holoenzyme and the RNA polymerase-promoter open complex. Cell. 2002;108:599–614. doi: 10.1016/s0092-8674(02)00667-0. [DOI] [PubMed] [Google Scholar]
- [13].Rutherford ST. Insights into the mechanism of DksA action at ribosomal RNA promoters in Escherichia coli. University of Wisconsin-Madison; 2008. [Google Scholar]
- [14].Wilson C, Dombroski AJ. Region 1 of σ70 is required for efficient isomerization and initiation of transcription by Escherichia coli RNA polymerase. J Mol Biol. 1997;267:60–74. doi: 10.1006/jmbi.1997.0875. [DOI] [PubMed] [Google Scholar]
- [15].Severinov K, Kashlev M, Severinova E, Bass I, McWilliams K, Kutter E, et al. A Non-essential Domain of Escherichia coli RNA Polymerase Required for the Action of the Termination Factor Alc. J Biol Chem. 1994;269:14254–9. [PubMed] [Google Scholar]
- [16].Bae B, Davis E, Brown D, Campbell EA, Wigneshweraraj S, Darst SA. Phage T7 Gp2 inhibition of Escherichia coliRNA polymerase involves misappropriation of σ70 domain 1.1. Proc Natl Acad Sci USA. 2013;110:19772–7. doi: 10.1073/pnas.1314576110. [DOI] [PMC free article] [PubMed] [Google Scholar]
- [17].James E, Liu M, Sheppard C, Mekler V, Camara B, Liu B, et al. Structural and mechanistic basis for the inhibition of Escherichia coliRNA polymerase by T7 Gp2. Mol Cell. 2012;47:755–66. doi: 10.1016/j.molcel.2012.06.013. [DOI] [PMC free article] [PubMed] [Google Scholar]
- [18].Schwartz EC, Shekhtman A, Dutta K, Pratt MR, Cowburn D, Darst S, et al. A full-length group 1 bacterial sigma factor adopts a compact structure incompatible with DNA binding. Chem Biol. 2008;15:1091–103. doi: 10.1016/j.chembiol.2008.09.008. [DOI] [PMC free article] [PubMed] [Google Scholar]
- [19].Nagai H, Shimamoto N. Regions of Escherichia coli primary sigma factor σ70 that are involved in interaction with RNA polymerase core enzyme. Genes Cells. 1997;2:725–34. doi: 10.1046/j.1365-2443.1997.1600357.x. [DOI] [PubMed] [Google Scholar]
- [20].Camara B, Liu M, Reynolds J, Shadrin A, Liu B, Kwok K, et al. T7 phage protein Gp2 inhibits the Escherichia coli RNA polymerase by antagonizing stable DNA strand separation near the transcription start site. Proc Natl Acad Sci USA. 2010;107:2247–52. doi: 10.1073/pnas.0907908107. [DOI] [PMC free article] [PubMed] [Google Scholar]
- [21].Nechaev S, Severinov K. Inhibition of Escherichia coli RNA polymerase by bacteriophage T7 gene 2 protein. J Mol Biol. 1999;289:815–26. doi: 10.1006/jmbi.1999.2782. [DOI] [PubMed] [Google Scholar]
- [22].Lane WJ, Darst S. Molecular Evolution of Multisubunit RNA Polymerases: Sequence Analysis. J Mol Biol. 2010;395:671–85. doi: 10.1016/j.jmb.2009.10.062. [DOI] [PMC free article] [PubMed] [Google Scholar]
- [23].Artsimovitch I, Svetlov V, Murakami KS, Landick R. Co-overexpression of Escherichia coli RNA polymerase subunits allows isolation and analysis of mutant enzymes lacking lineage-specific sequence insertions. J Biol Chem. 2003;278:12344–55. doi: 10.1074/jbc.M211214200. [DOI] [PubMed] [Google Scholar]
- [24].Zakharova N, Bass I, Arsenieva E, Nikiforov V, Severinov K. Mutations in and monoclonal antibody binding to evolutionary hypervariable region of E. coli RNA polymerase β’ subunit inhibit transcript cleavage and transcript elongation. J Biol Chem. 1998;273:19371–4. doi: 10.1074/jbc.273.38.24912. [DOI] [PubMed] [Google Scholar]
- [25].Drennan AC. Key conformational changes of Escherichia coli RNA polymerase and promoter DNA in transcription initiation. University of Wisconsin-Madison; 2012. [Google Scholar]
- [26].Zuo Y, Steitz TA. Crystal Structures of the E. coli Transcription Initiation Complexes with a Complete Bubble. Mol Cell. 2015;58:1–7. doi: 10.1016/j.molcel.2015.03.010. [DOI] [PMC free article] [PubMed] [Google Scholar]
- [27].Ederth J, Artsimovitch I, Isaksson LA, Landick R. The Downstream DNA Jaw of Bacterial RNA Polymerase Facilitates Both Transcriptional Initiation and Pausing. J Biol Chem. 2002;277:37456–63. doi: 10.1074/jbc.M207038200. [DOI] [PubMed] [Google Scholar]
- [28].Opalka N, Brown J, Lane WJ, Twist KA, Landick R, Asturias FJ, et al. Complete structural model of Escherichia coli RNA polymerase from a hybrid approach. PLOS Biol. 2010:8. doi: 10.1371/journal.pbio.1000483. [DOI] [PMC free article] [PubMed] [Google Scholar]
- [29].Furman R, Tsodikov OV, Wolf YI, Artsimovitch I. An insertion in the catalytic trigger loop gates the secondary channel of RNA polymerase. J Mol Biol. 2013;425:82–93. doi: 10.1016/j.jmb.2012.11.008. [DOI] [PMC free article] [PubMed] [Google Scholar]
- [30].Zhang J, Palangat M, Landick R. Role of the RNA polymerase trigger loop in catalysis and pausing. Nat Struct Mol Biol. 2010;17:99–104. doi: 10.1038/nsmb.1732. [DOI] [PMC free article] [PubMed] [Google Scholar]
- [31].Hudson B, Quispe J, Lara-Gonzalez S, Kim Y, Berman H, Arnold E, et al. Three-dimensional EM structure of an intact activator-dependent transcription initiation complex. Proc Natl Acad Sci USA. 2009;106:19830–5. doi: 10.1073/pnas.0908782106. [DOI] [PMC free article] [PubMed] [Google Scholar]
- [32].Basu RS, Warner BA, Molodtsov V, Pupov D, Esyunina D, Fernández-Tornero C, et al. Structural Basis of Transcription Initiation by Bacterial RNA Polymerase Holoenzyme. J Biol Chem. 2014;289:24549–59. doi: 10.1074/jbc.M114.584037. [DOI] [PMC free article] [PubMed] [Google Scholar]
- [33].Feklistov A, Darst SA. Structural Basis for Promoter −10 Element Recognition by the Bacterial RNA Polymerase σ Subunit. Cell. 2011;147:1257–69. doi: 10.1016/j.cell.2011.10.041. [DOI] [PMC free article] [PubMed] [Google Scholar]
- [34].Zhang Y, Feng Y, Chatterjee S, Tuske S, Ho MX, Arnold E, et al. Structural Basis of Transcription Initiation. Science. 2012;338:1076–80. doi: 10.1126/science.1227786. [DOI] [PMC free article] [PubMed] [Google Scholar]
- [35].Gaal T, Ross W, Blatter EE, Tang H, Jia X, Krishnan VV, et al. DNA-binding determinants of the alpha subunit of RNA polymerase: novel DNA-binding domain architecture. Gene Dev. 1996;10:16–26. doi: 10.1101/gad.10.1.16. [DOI] [PubMed] [Google Scholar]
- [36].Davis CA, Bingman CA, Landick R, Record MT, Jr., Saecker RM. Real-time footprinting of DNA in the first kinetically significant intermediate in open complex formation by Escherichia coli RNA polymerase. Proc Natl Acad Sci USA. 2007;104:7833–8. doi: 10.1073/pnas.0609888104. [DOI] [PMC free article] [PubMed] [Google Scholar]
- [37].Hook-Barnard IG, Hinton DM. The promoter spacer influences transcription initiation via σ70 region 1.1 of Escherichia coli RNA polymerase. Proc Natl Acad Sci USA. 2009;106:737–42. doi: 10.1073/pnas.0808133106. [DOI] [PMC free article] [PubMed] [Google Scholar]
- [38].Vuthoori S, Bowers CW, McCracken A, Dombroski AJ, Hinton DM. Domain 1.1 of the σ70 subunit of Escherichia coli RNA polymerase modulates the formation of stable polymerase/promoter complexes. J Mol Biol. 2001;309:561–72. doi: 10.1006/jmbi.2001.4690. [DOI] [PubMed] [Google Scholar]
- [39].Kozlov AG, Lohman TM. Adenine Base Unstacking Dominates the Observed Enthalpy and Heat Capacity Changes for the Escherichia coli SSB Tetramer Binding to Single-Stranded Oligoadenylates. Biochemistry. 1999;38:7388–97. doi: 10.1021/bi990309z. [DOI] [PubMed] [Google Scholar]
- [40].Haugen SP, Berkmen MB, Ross W, Gaal T, Ward C, Gourse RL. rRNA Promoter Regulation by Nonoptimal Binding of σ Region 1.2: An Additional Recognition Element for RNA Polymerase. Cell. 2006;125:1069–82. doi: 10.1016/j.cell.2006.04.034. [DOI] [PubMed] [Google Scholar]
- [41].Bartlett MS, Gaal T, Ross W, Gourse RL. RNA polymerase mutants that destabilize RNA Polymerase-Promoter complexes alter NTP-sensing by rrn P1 promoters. J Mol Biol. 1998;279:331–45. doi: 10.1006/jmbi.1998.1779. [DOI] [PubMed] [Google Scholar]
- [42].Roe JH, Burgess RR, Record MT., Jr. Kinetics and mechanism of the interaction of Escherichia coli RNA polymerase with the λPR promoter. J Mol Biol. 1984;176:495–522. doi: 10.1016/0022-2836(84)90174-8. [DOI] [PubMed] [Google Scholar]
- [43].Roe JH, Burgess RR, Record MT., Jr. Temperature dependence of the rate constants of the Escherichia coli RNA polymerase-λPR promoter interaction. Assignment of the kinetic steps corresponding to protein conformational change and DNA opening. J Mol Biol. 1985;184:441–53. doi: 10.1016/0022-2836(85)90293-1. [DOI] [PubMed] [Google Scholar]
- [44].Bloomfield VA, Crothers DM, Tinoco I. Nucleic Acids: Structure, Properties, and Functions. University Science Books; 2000. [Google Scholar]
- [45].Svetlov V, Artsimovitch I. Purification of bacterial RNA polymerase: tools and protocols. Methods in Molecular Biology. 2015;1276:13–29. doi: 10.1007/978-1-4939-2392-2_2. [DOI] [PMC free article] [PubMed] [Google Scholar]
- [46].Garger SJ, Griffith OM, Grill LK. Rapid purification of plasmid DNA by a single centrifugation in a two-step cesium chloride-ethidium bromide gradient. Biochem Bioph Res Co. 1983;117:835–42. doi: 10.1016/0006-291x(83)91672-8. [DOI] [PubMed] [Google Scholar]
- [47].Ruff EF, Kontur WS, Record MT., Jr. Using Solutes and Kinetics to Probe Large Conformational Changes in the Steps of Transcription Initiation. In: Artsimovitch I, Santangelo TJ, editors. Bacterial Transcriptional Control: Methods and Protocols. Springer; New York: 2015. pp. 241–61. [DOI] [PMC free article] [PubMed] [Google Scholar]
- [48].Tsodikov OV, Record MT., Jr. General method of analysis of kinetic equations for multistep reversible mechanisms in the single-exponential regime: application to kinetics of open complex formation between Eσ70 RNA polymerase and λPR promoter DNA. Biophys J. 1999;76:1320–9. doi: 10.1016/S0006-3495(99)77294-2. [DOI] [PMC free article] [PubMed] [Google Scholar]
- [49].McClure WR, Cech CL, Johnston DE. A Steady State Assay for the RNA Polymerase Initiation Reaction. J Biol Chem. 1978;253:8941–8. [PubMed] [Google Scholar]
- [50].Saecker RM, Tsodikov OV, McQuade KL, Schlax PE, Jr., Capp MW, Record MT., Jr. Kinetic studies and structural models of the association of E. coli σ70 RNA polymerase with the λPR promoter: Large scale conformational changes in forming the kinetically significant intermediates. J Mol Biol. 2002;319:649–71. doi: 10.1016/S0022-2836(02)00293-0. [DOI] [PubMed] [Google Scholar]
Associated Data
This section collects any data citations, data availability statements, or supplementary materials included in this article.