Abstract
Pseudomonas syringae pv. actinidiae is the major cause of bacterial canker and is a severe threat to kiwifruit production worldwide. Many aspects of the disease caused by P. syringae pv. actinidiae, such as the pathogenicity-relevant formation of a biofilm composed of extracellular polymeric substances (EPSs), are still unknown. Here, a highly virulent strain of P. syringae pv. actinidiae, NZ V-13, was studied with respect to biofilm formation and architecture using a flow cell system combined with confocal laser scanning microscopy. The biofilm formed by P. syringae pv. actinidiae NZ V-13 was heterogeneous, consisting of a thin cellular base layer 5 μm thick and microcolonies with irregular structures. The major component of the EPSs produced by P. syringae pv. actinidiae NZ V-13 bacteria was isolated and identified to be an exopolysaccharide. Extensive compositional and structural analysis showed that rhamnose, fucose, and glucose were the major constituents, present at a ratio of 5:1.5:2. Experimental evidence that P. syringae pv. actinidiae NZ V-13 produces two polysaccharides, a branched α-d-rhamnan with side chains of terminal α-d-Fucf and an α-d-1,4-linked glucan, was obtained. The susceptibility of the cells in biofilms to kasugamycin and chlorine dioxide was assessed. About 64 and 73% of P. syringae pv. actinidiae NZ V-13 cells in biofilms were killed when kasugamycin and chlorine dioxide were used at 5 and 10 ppm, respectively. Kasugamycin inhibited the attachment of P. syringae pv. actinidiae NZ V-13 to solid surfaces at concentrations of 80 and 100 ppm. Kasugamycin was bacteriostatic against P. syringae pv. actinidiae NZ V-13 growth in the planktonic mode, with the MIC being 40 to 60 ppm and a bactericidal effect being found at 100 ppm. Here we studied the formation, architecture, and composition of P. syringae pv. actinidiae biofilms as well as used the biofilm as a model to assess the efficacies of bactericidal compounds.
INTRODUCTION
Pseudomonas syringae pv. actinidiae is the main cause of kiwifruit canker, which is epidemic worldwide (1–3). The P. syringae pv. actinidiae epidemic in New Zealand is threatening the kiwifruit industry, which is the second most important horticultural export crop by monetary value in New Zealand. In New Zealand, the highly virulent strain P. syringae pv. actinidiae V was reported in 2010 in the Bay of Plenty region and caused an estimated 50% loss of vines of the Hort16A kiwifruit variety known as Zespri Gold (4–6). This bacterial disease can affect all commercial species of kiwifruit (3, 7, 8). The main distinctive symptoms of disease are cankers on the vines and trunks, gummosis, dieback of the canes, wilting, and sometimes death of the vines (5).
Similar to other pseudomonads, P. syringae pv. actinidiae can form cell communities known as biofilms. The formation of biofilms is a physiological response to environmental stresses mediated by the regulation of specific sets of genes, including genes encoding virulence factors. Biofilm formation protects cells against host defense mechanisms as well as various chemical agents. Previously, it was shown that the biofilm growth mode of P. syringae is involved in plant pathogenicity (9–11). P. syringae pv. actinidiae bacterial communities can be established outside and inside host tissues and are composed of bacterial cells embedded in a dense matrix of extracellular polymeric substances (EPSs) often composed of exopolysaccharides, proteins, and extracellular DNA. Biofilm formation by P. syringae pv. actinidiae is involved in different phases of kiwifruit infection both outside and inside the host plant (9). It is likely that plant-pathogenic bacteria can complete the pathogenic cycle, spreading and surviving on plant surfaces and within tissues through cycles of biofilm formation and dispersion (12).
In New Zealand, P. syringae pv. actinidiae disease management programs implement regular monitoring, the removal of infected plant material, and spraying with streptomycin and/or copper, which are biological control agents (BCAs) as well as host resistance elicitors. However, their lack of effectiveness and their toxicity suggest that streptomycin and copper treatments are not viable and sustainable options (5).
In 2013, New Zealand's Environmental Protection Authority approved the use of the antibiotic kasugamycin in controlling P. syringae pv. actinidiae-caused kiwifruit canker (http://www.epa.govt.nz). Kasugamycin is an aminoglycoside antibiotic isolated from Streptomyces kasugaensis (13, 14). Also, chlorine dioxide (ClO2), which has a high oxidation capability, is thought to be effective against biofilms at low concentrations (15). ClO2-based formulated products have been reported to have been used against P. syringae pv. actinidiae disease in New Zealand (http://www.kvh.org.nz).
ClO2 is formulated as Alphasan and is a broad-spectrum bactericide, fungicide, virucide, and algaecide. It is recommended that it be used at low concentrations, it is effective with short contact times, and it has received WHO approval for application in the food industry (Alpha Environmental Co., Nelson, New Zealand).
In the present study, we investigated biofilm formation by P. syringae pv. actinidiae NZ V-13 with respect to the architecture, matrix composition, and susceptibility to kasugamycin and chlorine dioxide of the biofilm using a flow cell system, confocal laser scanning microscopy (CLSM), and a solid-surface attachment (SSA) assay. Furthermore, the production and composition of the EPSs involved in biofilm formation were studied. The EPSs were isolated, and their composition and structure were analyzed.
MATERIALS AND METHODS
Bacterial strains, media, growth conditions, and chemical components.
Pseudomonas syringae pv. actinidiae strain NZ V-13 and Escherichia coli JM101 (16) were applied in this study. P. syringae pv. actinidiae NZ V-13 and E. coli were cultivated in King's broth (17) and Luria-Bertani (LB) medium at 25°C and 37°C, respectively. All chemicals were purchased from Sigma-Aldrich and Merck KGaA, unless otherwise mentioned. A liquid formulation of kasugamycin named Kasumin (containing 2.14% active ingredient) was kindly supplied by Hokko Chemical Industry Co., and ClO2 (the Alphasan liquid formulation containing 1,000 ppm the active ingredient chlorine dioxide) was kindly supplied by Alpha Enviromental Co.
Continuous-culture flow cell biofilms.
Biofilm architecture analysis and chemical treatments were performed using continuous-culture flow cells (channel dimensions, 4 mm by 40 mm by 1.5 mm) with King's broth medium at 22°C. A 500-μl suspension of cells at early stationary phase was injected into each channel and kept upside down for 3 h. Then, the flow was started at a mean flow rate of 0.3 ml min−1, corresponding to a laminar flow with a Reynolds number of 5 (18, 19). The flow cells were then incubated at 22°C for 4 days. Biofilms were stained utilizing stain from a LIVE/DEAD BacLight bacterial viability kit (Molecular Probes, Inc., Eugene, OR) and visualized using confocal laser scanning microscopy (Leica SP5 DM6000B microscope). After the flow was allowed to continue for 15 min, the biofilms were stained using the stain from the LIVE/DEAD BacLight bacterial viability kit (Molecular Probes, Inc., Eugene, OR) according to the manufacturer's recommendation. The BacLight bacterial viability kit contains both SYTO9 stain and propidium iodide; use of just the SYTO9 stain marks live and dead bacteria. No interference by chlorine dioxide and kasugamycin was found in pretests conducted on biofilm stained with stain from the BacLight bacterial viability kit and observed with a fluorescence microscope (CLSM; Leica SP5 DM6000B microscope). Leica Application Suite Advanced Fluorescence (LAS AF) software (version 2.7.3.9723, 1997 to 2012; Leica Microsystems CMS GmbH) was used. For image analysis, metrics were obtained using IMARIS software (version 7.2; Bitplane Inc.) (4, 5). Each test series was repeated twice, and in each replicate, two or three samples were analyzed per treatment.
Isolation and purification of the EPSs from P. syringae pv. actinidiae NZ V-13.
P. syringae pv. actinidiae NZ V-13 was grown at 25°C overnight in 50 ml King's broth medium, and 2 ml of this culture was centrifuged at 13,000 rpm for 3 min. Cell sediment was then washed twice in 1 volume of sterile normal saline (0.9% NaCl in Milli-Q water). Two hundred microliters of cell suspension was plated on King's broth agar medium supplemented with NaCl at concentrations ranging from 200 to 700 mM and incubated at 25°C for 120 h. Cell material and the produced EPSs were scraped off and washed twice in 25 ml sterile normal saline. The supernatants were retained for EPS purification, and the cell pellets were freeze-dried to determine cellular dry mass. The EPSs from the supernatants were precipitated with 1 volume of ice-cold isopropanol, and then the EPSs were harvested by centrifugation at 5,000 rpm for 15 min, freeze-dried, and weighed. For further purification, the precipitated EPSs were redissolved in 0.05 M Tris-HCl and 10 mM MgCl2 buffer (pH 7.4) to a final concentration of 0.5% (wt/vol), followed by incubation with 15 μg ml−1 of DNase I and 15 μg ml−1 of RNase A at 37°C with shaking for 6 h. Then, pronase E (20 μg ml−1) was added and the mixture was incubated with shaking for a further 18 h at 37°C. This mixture was then dialyzed (12-kDa limit) against 5 liters of ultrapure H2O for 30 h. Purified EPSs were harvested by precipitating them with 1 volume of ice-cold isopropanol, centrifuged, freeze-dried, and weighed (20).
Uronic acid assay.
The uronic acid content in the EPSs produced under the stress of 300 mM NaCl was estimated using a method described previously (21) and alginic acid from brown seaweed (Sigma-Aldrich) as the standard (250, 125, 65.5, and 31.25 mg ml−1). Briefly, the EPS samples were dissolved in 200 μl ultrapure H2O to achieve concentrations of between 0.25 and 0.05 mg ml−1. The sample was mixed with 1.2 ml tetraborate solution (0.0125 M disodium tetraborate in concentrated sulfuric acid), and then it was incubated on ice for 10 min. The mixtures were incubated at 100°C for 5 min and then cooled on ice for a further 5 min. Twenty microliters of m-hydroxybiphenyl reagent (0.15% m-hydroxybiphenyl in 0.125 M NaOH) was added, and the reaction mixtures were mixed for 1 min. For each sample or dilution, there was a negative control, which was assayed by using 0.0125 M NaOH instead of the m-hydroxybiphenyl reagent. The uronic acid concentrations were measured spectrophotometrically at a wavelength of 520 nm (22). This experiment was performed with three replications for each concentration.
Anthrone assay.
An anthrone-sulfuric acid assay was used to determine the soluble carbohydrate concentration in the EPS samples by using the anthrone reagent (0.2 g anthrone; Unilab), 8 ml ethanol (96% [vol/vol]), 30 ml H2O, and 100 ml H2SO4 (95 to 97% [vol/vol]), and glucose was used as the standard (250, 125, 65.5, and 31.25 mg ml−1). Briefly, dilutions of 125 μg ml−1 and 250 μg ml−1 from a 1-mg ml−1 stock solution of an EPS sample were used. One hundred microliters of EPS samples was mixed with 1 ml of ice-cold anthrone reagent. As a control, ultrapure H2O was also added to another tube in place of the sample. For equilibration, the sample was cooled on ice for 5 min and heated at 95°C for 7 min. After the sample was cooled, the soluble carbohydrate concentrations were measured spectrophotometrically at a wavelength of 644 nm. This experiment was performed with three repetitions for each concentration (23).
Protein, DNA, and RNA content analysis.
The protein concentrations were determined by the Bradford protein assay (24, 25) and the bicinchoninic acid (BCA) assay (Pierce, Rockford, IL, USA) using bovine serum albumin (Gibco) as the standard. EPS samples were analyzed by sodium dodecyl sulfate-polyacrylamide gel electrophoresis (SDS-PAGE) as described elsewhere (26). Bis-Tris polyacrylamide gels which had acrylamide concentrations of 8% and 12% for the resolving gel and 4% for the stacking gel were used. The 12% gels were stained with 0.1% (wt/vol) Coomassie brilliant blue R-250 for at least 20 min and destained overnight, and the 8% gels were stained with silver. A Qubit fluorometer (Invitrogen) was used to measure the DNA and RNA contents of the EPS samples.
Lipid profile analysis.
EPSs were analyzed for lipids utilizing gas chromatography-mass spectrometry (GC-MS). The sample was prepared as described previously (26, 27). The GC-MS instrument (a GCMS/QP5050A quadrupole mass spectrometer coupled with a GC17a gas chromatograph; Shimadzu) was equipped with a Restek Rxi-5ms column (size, 30 m by 0.25 mm [inside diameter] by 0.25 μm [film thickness]). The carrier gas was helium, which was used at a flow rate of 1.0 ml min−1. The following temperature gradient program was used: the initial temperature was 35°C for 5 min, and the injector and interface temperatures were 220 and 250°C, respectively; the temperature was increased from 35 to 100°C at a rate of 5°C per min and from 100 to 285°C at a rate of 15°C per min with operation in the scan mode. The m/z 33 to m/z 500 peaks, representing mass-to-charge ratios characteristic of the lipid fractions, were compared with those in the mass spectrum library of the corresponding fatty acid.
Constituent sugar analysis.
The constituent sugar composition of purified EPSs was determined by high-performance anion-exchange chromatography (HPAEC), after hydrolysis of the polysaccharides present to their component monosaccharides, as described by De Ruiter et al. (28), with modifications (29). Briefly, samples (0.5 mg) were hydrolyzed with methanolic HCl (3 N, 0.5 ml, 80°C, 18 h), followed by aqueous trifluoroacetic acid (TFA; 2.5 M, 0.5 ml, 120°C, 1 h). Standard sugar mixes were hydrolyzed at the same time as the samples. The resulting hydrolysates were dried and redissolved in distilled water (0.05 mg ml−1), and aliquots (20 μl) were separated at 30°C on a CarboPac PA-1 column (4 by 250 mm) equilibrated in 25 mM NaOH, eluted with simultaneous gradients of NaOH and sodium acetate, and monitored by pulsed amperometric detection, using a Dionex standard carbohydrate waveform (29). The sugars were identified from their elution times relative to those of the standard sugars and quantified from response calibration curves generated with different concentrations of each sugar. Monosaccharide yields are expressed as the weight percent of the anhydro-sugar because this is the form of sugar present in a polysaccharide.
Glycosyl linkage analysis.
EPS samples (0.5 mg in duplicate) were dispersed in dimethyl sulfoxide (DMSO; 0.2 ml) and methylated as described by Ciucanu and Kerek (30). After extraction into chloroform, the methylated polysaccharides were hydrolyzed with TFA and the products were reduced and acetylated before analysis by GC-MS, as described by Carnachan et al. (31). Identifications were based on peak retention times and by comparison of electron impact mass spectra with the spectra obtained from reference compounds.
Nuclear magnetic resonance (NMR) spectroscopy.
Purified EPS was exchanged with deuterium by freeze-drying with D2O (99.9 atom%) three times. Samples were dissolved in D2O, and 1H and 13C spectra were recorded on a Bruker Avance DPX-500 spectrometer at 60°C. The 1H and 13C chemical shifts were measured relative to an internal standard of DMSO (1H, 2.70 ppm; 13C, 39.5 ppm) (32). Assignments were made from distortionless enhancement by polarization transfer (DEPT) with a 135° decoupler pulse (DEPT 135), 1H-1H correlation spectroscopy (COSY), 1H-13C heteronuclear single quantum coherence (HSQC; uncoupled), and 1H-13C HSQC-total correlation spectroscopy (TOCSY) experiments and by comparing the spectra with published data.
Treatment of EPSs with α-amylase.
Purified EPSs were dissolved in water (5 mg ml−1), and 15 units of porcine pancreatic α-amylase (Megazyme International Ireland, Bray, Ireland), prepared by dissolving the enzyme in water (10 mg ml−1), was added. The mixture was incubated at 40°C overnight.
Size-exclusion chromatography.
Purified EPSs (5 mg ml−1 in water) and α-amylase-treated EPSs were centrifuged (14,000 × g, 5 min) before injection (50 μl) and eluted with 0.1 M LiNO3 (0.7 ml min−1) from two columns (TSK-Gel G5000PWXL and G4000PWXL columns; 300 by 7.8 mm; Tosoh Corp., Tokyo, Japan) connected in series. The eluent was monitored by determination of the refractive index. Molecular masses were estimated by comparison of the elution volumes with those of pullulan molecular mass standards (12 to 830 kDa).
Qualitative and quantitative analysis of biofilms.
For qualitative and quantitative analysis of biofilms, IMARIS image analysis software (Bitplane, Inc.) was employed. Biofilm architecture and appearance, biovolume (in micrometers cubed), the ratio of the biovolume per unit area (in micrometers cubed per micrometer squared), the dead cell-to-live cell ratio, compactness, and the thickness of the base layers were analyzed (19, 33). Dead cell-to-live cell ratios corresponding to the colocalization scatter graph were used to compare chemical treatments. To obtain the volume per unit area (in micrometers cubed per micrometer squared), a ratio between the total volume and the total area covered by the biofilm was calculated. The compactness of the biofilm was assessed as the total fluorescence per volume of biofilm. To obtain the ratio between the numbers of dead cells to the number of living cells per biofilm volume, the ratio between red fluorescence and green fluorescence was calculated (19). Live (green) and dead (red) cells of chemically treated and untreated biofilms were counted for 9 independent replications considered in a total area of 1,550 μm2.
SSA assay.
A bacterial suspension with an optical density at 600 nm (OD600) of 0.05 was utilized to inoculate sterile flat-bottom polystyrene 96-well microtiter plates. The wells were filled with 100 μl of suspension, and the plates were incubated at 25°C for 36 h. Then, the microtiter plates were vigorously and repeatedly washed with running tap water to remove planktonic/nonadherent bacteria. The biofilm formed in a solid-surface attachment (SSA) assay was analyzed by staining each well with 100 μl of a 1% (wt/vol) crystal violet solution, which was inoculated for 20 min at room temperature. Residual crystal violet was washed off, and the wells were filled with 100 μl of dimethyl sulfoxide. The absorbance (OD595) was measured using an Ultra microplate reader (Bio-Tek Instruments, Inc.). All assays were performed in eight repetitions and repeated three independent times (34).
Chemical treatments of continuous-culture flow cell biofilms and SSA assay.
To treat biofilms with chemicals, chlorine dioxide at 10, 20, and 50 ppm and kasugamycin at 5, 10, and 20 ppm were gently injected into each channel of continuous-culture flow cells containing 4-day-old P. syringae pv. actinidiae NZ V-13 biofilms, and the flow cells were incubated for 1 h without flow. Then, medium was allowed to flow through the chamber to wash off the chemical residues, and the treated biofilms were stained for visualization by confocal laser scanning microscopy. Normal saline-treated biofilms were considered negative controls. Each treatment was repeated twice with three replicates each time. In the SSA assay, treatment of the formed biofilms with 100 μl of kasugamycin was performed to achieve final concentrations of 5, 10, 20, 50, 60, 80, 100, 120, 140, 150, and 200 ppm. Treated wells were incubated at 25°C for an hour. Then, the chemical solutions were removed from the wells and washed off under sterile normal saline three times. One hundred microliters of King's broth medium was added in each treatment, and the mixture was incubated at 25°C for 24 h under sterile conditions and then stained with 1% (wt/vol) crystal violet solution.
Assessment of bacteriostatic effect of kasugamycin on P. syringae pv. actinidiae NZ V-13 to determine MICs.
Appropriate aliquots of kasugamycin were added to 15 ml of P. syringae pv. actinidiae NZ V-13 culture with a predefined OD600 of 0.44 to achieve final concentrations of 5, 10, 20, 30, 40, 50, 60, 70, 80, 90, 100, 110, and 120 ppm. The cultures were incubated at 25°C for 24 h. A similarly treated (100 ppm of kasugamycin) E. coli JM101 culture was also prepared as a positive control and was incubated at 30°C for 24 h. A normal saline-treated sample was considered a negative control. The bacteriostatic effect was measured using determination of the optical density of the cultures at 600 nm after the treatments and incubation. The lowest concentration of antibiotic preventing bacterial growth was considered the MIC (the minimal concentration that inhibited growth by ≥95%). The more effective that a concentration was, the less that the OD600 deviated from the initial density. This experiment was performed three independent times with three repetitions each time (35).
Assessment of bactericidal effect of kasugamycin on P. syringae pv. actinidiae NZ V-13.
Following assessment of the bacteriostatic effect, treated and untreated cultures were subsequently prepared at dilutions for plating on King's broth agar or LB agar plates. Plates treated with P. syringae pv. actinidiae NZ V-13 and E. coli JM101 were incubated at 25 and 30°C, respectively, for 24 h. The numbers of CFU of treated samples were compared to the initial numbers of CFU (before treatment) and the numbers of CFU of the normal saline-treated culture to determine the bactericidal effect (36). This experiment was performed in triplicate with three repetitions each time.
RESULTS
P. syringae pv. actinidiae NZ V-13 biofilm formation and architecture.
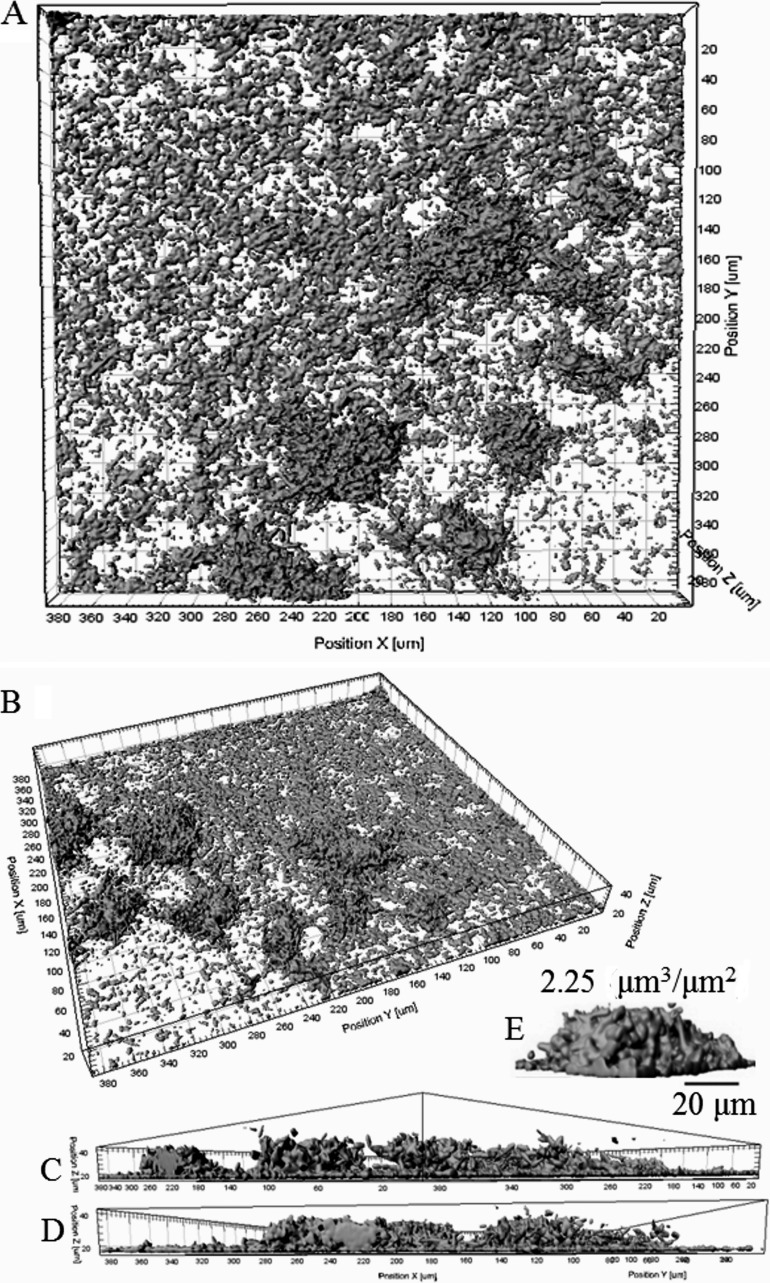
Here, a continuous-culture flow cell system was employed to assess the ability of P. syringae pv. actinidiae NZ V-13 to form three-dimensional (3D) biofilms. The CLSM images were reconstructed into 3D images using IMARIS software, which enabled calculation of the biovolume, thickness, and compactness of the P. syringae pv. actinidiae NZ V-13 biofilm (Fig. 1). When it was incubated for 4 days at 22°C in the flow cell system, P. syringae pv. actinidiae NZ V-13 established a heterogeneous biofilm consisting of a base multilayer of cells (thickness, ∼5 μm) scattered across the slide surface and some irregular dome-shaped microcolonies with a maximum biovolume of 2.25 μm3 μm−2 (Fig. 1A to E).
FIG 1.
CLSM images of P. syringae pv. actinidiae NZ V-13 biofilm architecture in the flow cell system. (A and B) Top views of the biofilm structure, consisting of a base layer of cells scattered across the surface of the cover slide and microcolonies. (C and D) Side views of highly structured cells. (E) Typical architecture of an irregular dome-shaped microcolony. Cells and cell communities are presented in gray.
Isolation and identification of EPSs produced by P. syringae pv. actinidiae NZ V-13.
The production of EPSs constituting the biofilm matrix is drastically influenced by osmolarity. Here, P. syringae pv. actinidiae NZ V-13 was exposed to increasing concentrations of NaCl on solid medium to stimulate EPS production and to evaluate the impact on the yield and composition of the EPSs. The EPSs produced in response to different concentrations of salt were quantified (Fig. 2). The greatest yield of EPSs (0.103 g/cell dry mass [CDM; in grams]) was obtained in response to 600 mM NaCl, which gave a 4-fold lower CDM than 300 mM NaCl. On the other hand, 300 mM NaCl produced the greatest dry weight of EPSs per culture volume (Fig. 2).
FIG 2.
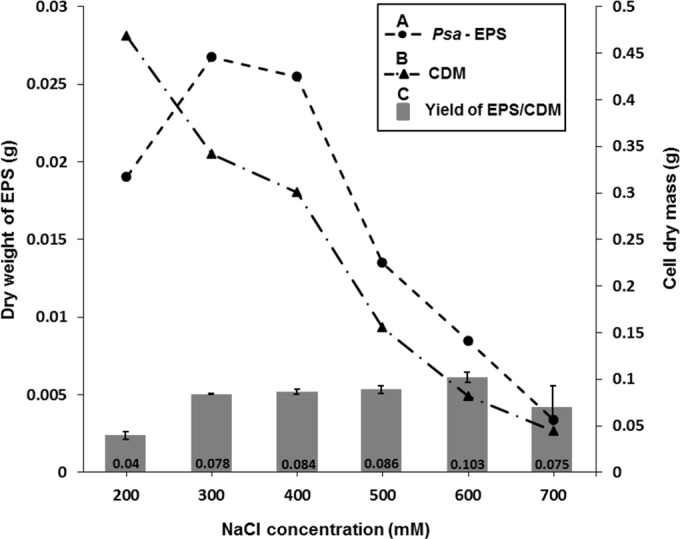
Assessment of EPS yield obtained by exposing P. syringae pv. actinidiae (Psa) NZ V-13 to different concentrations of NaCl (in millimolar) on solid medium. (A) Dry weight of EPS (in grams); (B) CDM (in grams); (C) yield of EPS (in grams) per CDM (in grams). Values and error bars represent the averages and standard deviations from 3 independent replicates, respectively.
Analysis of EPS composition.
Colorimetric analysis showed that the purified EPSs contained 21.9% neutral sugars (0.006 g of sugar per CDM [in grams]) and 9.3% uronic acid (0.0026 g of uronic acid per CDM [in grams]). The amounts of DNA, RNA, and protein present in the purified EPSs were quantified to be 0.36, 0.75, and 6.54%, respectively. SDS-PAGE analysis (on an 8% acrylamide gel) followed by staining with Coomassie brilliant blue R-250 did not reveal any major bands, apart from a band for pronase E, which was added during isolation of the EPSs (see Fig. S1 in the supplemental material). A smear observed on a silver-stained gel suggested the presence of trace amounts of lipopolysaccharide (see Fig. S1 in the supplemental material).
The purified EPSs revealed the presence of fatty acids, mainly including octadecane, 5-methyl (total lipid content [X] of octadecane, 5-methyl [Xoctadecane, 5-methyl] = 0.18), methyl 3-hydroxytetradecanoate (Xmethyl 3-hydroxytetradecanoate = 0.15), hexadecanoic acid, 2-hydroxy-, methyl ester (Xhexadecanoic acid, 2-hydroxy-, methyl ester = 0.11), a C12 fatty acid methyl ester (FAME)-lauric acid (XC12 FAME-lauric acid = 0.9), and methyl 3-hydroxydecanoate (Xmethyl 3-hydroxydecanoate = 0.9), and other kinds of fatty acids with a total lipid content of less than 0.5 (see Fig. S2 in the supplemental material).
Constituent sugar analysis showed that the EPSs purified from P. syringae pv. actinidiae NZ V-13 contained 59.4% carbohydrate, comprised mostly of rhamnose, fucose, and glucose in an approximate ratio of 5:1.5:2 (Table 1). The noncarbohydrate fraction of total EPSs contained 15% moisture, and the remaining part could be phospholipid or lipopolysaccharide derivatives originated from membrane-derived fatty acids, as indicated by GC-MS analysis.
TABLE 1.
Sugar composition of EPSs isolated from P. syringae pv. actinidiae NZ V-13a
| Sugar | % dry wt | % total sugar wt |
|---|---|---|
| Fuc | 9.9 | 16.7 |
| Rha | 32.0 | 53.8 |
| GalN | 0.9 | 1.5 |
| GlcN | 1.9 | 3.2 |
| Gal | 1.3 | 2.2 |
| Glc | 12.3 | 20.6 |
| Rib | 1.2 | 1.9 |
| Total | 59.4 | 100.0 |
Data are means from duplicate analyses, but any more than that was probably not possible.
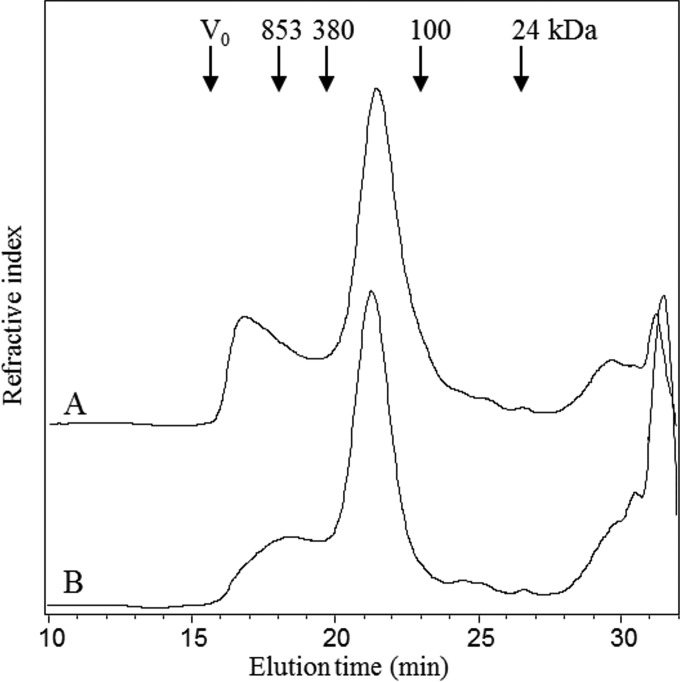
In order to investigate the impact of different salt concentrations on the carbohydrate composition, the molar ratios and total sugar dry weight of the EPSs were analyzed (Fig. 3). While the composition of the EPSs was not affected, the total sugar content of the EPSs varied, with the largest amount of sugar being obtained with 300 mM NaCl (Fig. 3). The purified EPSs were eluted as a minor peak at the exclusion limit of the columns and a major peak eluting from 20 to 23 min (Fig. 4). Following treatment of the EPSs with α-amylase, the early-eluting peak was smaller than that for the untreated EPSs, suggesting that this early-eluting peak may be α-glucan. Compared to the findings for the pullulan standards, the elution of the EPSs showed two peaks when analysis was performed by size-exclusion chromatography. The first peak corresponded to the exclusion limit of the column, which is greater than 850 kDa, and the second corresponded to a molecular mass of about 200 kDa (Fig. 4).
FIG 3.
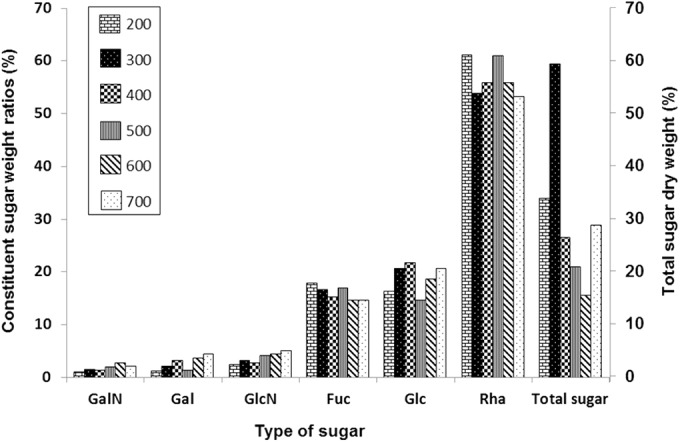
Analysis of constituent sugar weight ratios and total sugar dry weight of EPSs from P. syringae pv. actinidiae NZ V-13 when cultivated with different concentrations of NaCl (in millimolar) on solid media.
FIG 4.
Chromatogram of size exclusion of an EPS sample before (A) and after (B) treatment with α-amylase. V0, initial volume.
Glycosyl linkage analysis.
The glycosyl linkage analysis of purified EPSs showed mostly 2-, 3-, and 3,4-linked rhamnopyranosyl residues, together with terminal fucofuranosyl residues (Table 2), consistent with the structure of the O-polysaccharides reported for some other Pseudomonas syringae strains (37–40). The other major linkage observed was 4-linked glucopyranose; α-1,4-glucan has been reported to be the O-polysaccharide chain from certain strains of Pseudomonas syringae (37, 41) and Pseudomonas fluorescens (42). The ratios of rhamnose, fucose, and glucose from the linkage analysis were similar to those determined from the constituent sugar analyses.
TABLE 2.
Glycosyl linkage analysis of the composition of EPSs isolated from P. syringae pv. actinidiae NZ V-13
| Sugar | Linkage | Amt (mol%a) | Molar ratio |
|---|---|---|---|
| Rhamnopyranose | Terminal | 1.6 | 0.1 |
| 2- | 23.2 | 1.0 | |
| 3- | 21.9 | 0.9 | |
| 2,3- | 1.2 | 0.1 | |
| 3,4- | 14.2 | 0.6 | |
| Fucofuranose | Terminal | 17.8 | 0.8 |
| Glucopyranose | Terminal | 2.2 | 0.1 |
| 2- | 1.2 | 0.1 | |
| 4- | 14.7 | 0.8 | |
| 2,4- | 0.1 | ||
| 4,6- | 0.7 | ||
| Xylitolb | 1.2 | 0.1 |
Mole percent of total sugar.
Detected as nondeuterated pentitol pentacetate.
The high-resolution 1H NMR spectrum (see Fig. S3 in the supplemental material) of the purified EPSs showed five major signals in the anomeric region from 4.98 to 5.36 ppm, in agreement with the five major linkages detected by glycosyl linkage analysis. Signals from 1.2 to 1.4 ppm were assigned to H-6 (CH3) of rhamnopyranosyl and fucofuranosyl residues. Similarly, the proton-decoupled 13C NMR spectrum (see Fig. S4 in the supplemental material) showed five signals for anomeric carbons (100.4 to 103 ppm) and four CH3 signals assigned to C-6 of the rhamnopyranosyl and fucofuranosyl residues. A DEPT 135 spectrum showed an unsubstituted CH2OH signal at 61.1 ppm. The 1H and 13C resonances for the sugar residues of the EPSs (see Table S1 in the supplemental material) were assigned using a combination of DEPT and two-dimensional NMR (COSY, HSQC, TOCSY) experiments (see Fig. S5 to S8 in the supplemental material) and comparing the spectra with published data (37–39, 41, 43–47).
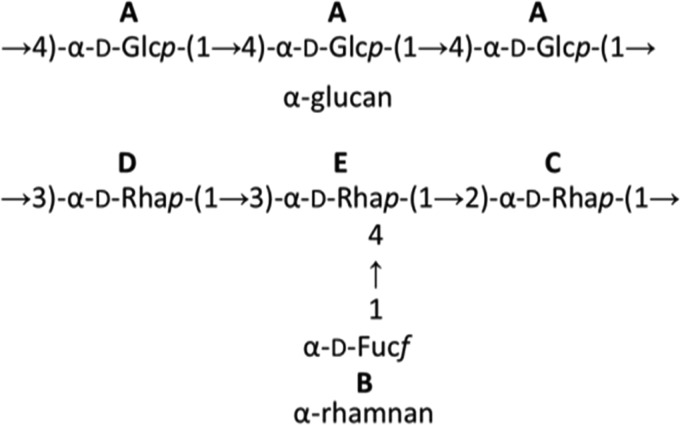
The NMR data were consistent with the presence of the major sugars and glycosyl linkages determined by the constituent sugar and glycosyl linkage analyses (Tables 1 and 2). Signals at H-1 and C-1 of 5.36 and 100.4 ppm, respectively, were assigned to →4)-α-d-Glcp-(1→, with a C-4 signal at 77.7 ppm being consistent with an O-4 substitution. Signals at H-6 and C-6 of from 3.87 to 3.81 and 61.1 ppm, respectively, were also consistent with the signals for this residue (see Table S1 in the supplemental material). The four other major anomeric signals were assigned to the deoxysugars α-d-rhamnose and α-d-fucose and were consistent with the presence of four CH3 signals. The anomeric signals at H-1 and C-1 of 5.27 and 102.0 ppm, respectively, were assigned to α-d-Fucf-(1→, while the other three signals were assigned to the three rhamnose linkages (38, 39). Weak signals at C and H of 56.6 ppm and 3.44 ppm, respectively, indicated the presence of an O-methyl group, as observed previously for similar molecules (37, 39), but the position of this substituent was not investigated further. On the basis of the sugar, glycosyl linkage, and NMR data, Fig. 5 shows possible structures for these two polysaccharides.
FIG 5.
Proposed repeat unit structures of the polysaccharide identified through EPS analysis. A through E refer to major NMR signals as shown in Fig. S3 and S4 in the supplemental material.
Effect of antimicrobial agents on viability of biofilm-grown P. syringae pv. actinidae NZ V-13 cells.
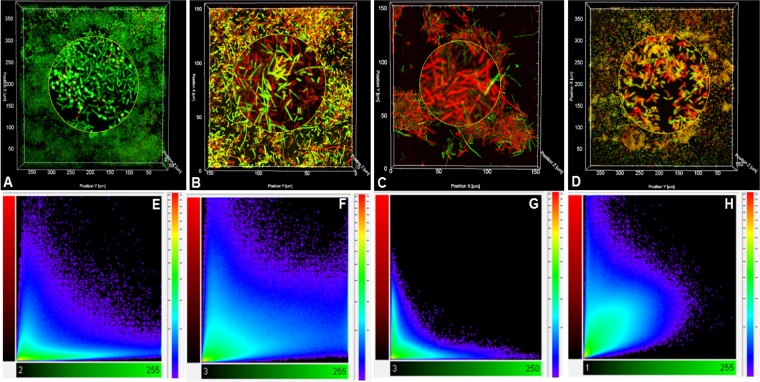
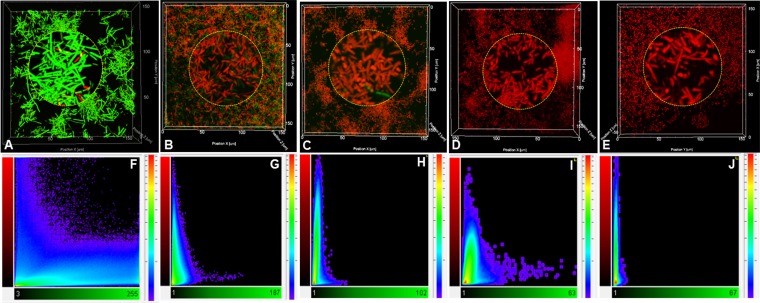
Generally, bacterial biofilms show greater resistance to antibacterial agents than free-living cells. Here, the susceptibility of biofilm-grown P. syringae pv. actinidiae NZ V-13 cells to commonly used antimicrobial agents was studied. Kasugamycin and chlorine dioxide were applied to P. syringae pv. actinidiae NZ V-13 biofilms. The biofilms were treated with different concentrations of these compounds, and the ratio of live (green) and dead (red) cells was visualized and calculated (Fig. 6). After staining of treated biofilms with SYTO9-propidium iodide, different intermediate fluorescent colors, such as yellow, orange, and brown, were visualized, and cells that stained these colors were considered dead and to have impaired membrane integrity due to treatment with the reagent (Fig. 7 and 8) (25). Analysis of the images showed that cells in biofilms were susceptible to kasugamycin and chlorine dioxide and the percentage of dead cells was directly correlated with increasing concentrations of the respective reagent. Kasugamycin caused ∼64% killing at 5 ppm, and the killing increased to ∼83% at 20 ppm. Chlorine dioxide showed ∼73% killing at 10 ppm, and the level of killing increased to >99% at concentrations of 20 ppm or higher. Normal saline-treated biofilms served as controls and contained 92.5% living cells (Fig. 6). The two-channel laser confocal images of the biofilm cells treated with kasugamycin and chlorine dioxide are shown in Fig. 7 and 8, respectively. Colocalization scatter graphs were obtained for biofilms treated with kasugamycin (Fig. 7) and chlorine dioxide (Fig. 8) using IMARIS software. The scatter graphs in Fig. 7 and 8 were developed to analyze the codistribution and intensity of pixels corresponding to the prevalence of live (green) and dead (red) cells. Colocalization scatter graphs of kasugamycin-treated biofilms (Fig. 7E to H) showed that the intensity of the pixels was arrayed toward the red channel (dead cells) compared to the pixel intensity for the normal saline-treated biofilm, which showed more fluorescence intensities toward the green channel (live cells). This array of pixel intensities toward the red channel was also clearly demonstrated for biofilms treated with different concentrations of chlorine dioxide (Fig. 8F to J). In summary, these data show the effectiveness of kasugamycin and chlorine dioxide against P. syringae pv. actinidiae NZ V-13 grown in biofilm growth mode.
FIG 6.
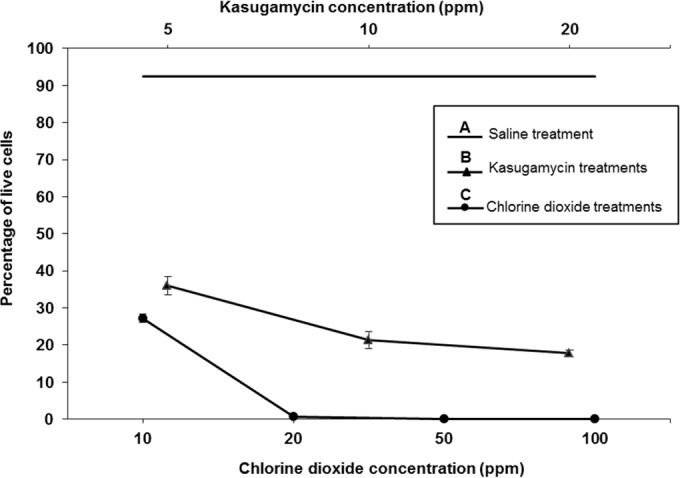
Ratios of live and dead cells of P. syringae pv. actinidiae NZ V-13 in biofilms treated with different concentrations of chlorine dioxide and kasugamycin grown in a flow cell system. (A) Results for P. syringae pv. actinidiae strain NZ V-13 treated with normal saline as a control; (B) results for P. syringae pv. actinidiae NZ V-13 treated with different concentrations of kasugamycin; (C) results obtained by use of different concentrations of chlorine dioxide to kill P. syringae pv. actinidiae NZ V-13 in biofilms. Values and error bars represent averages and standard deviations from 9 independent replicates, respectively, for an area of biofilm growth of 1,550 μm2.
FIG 7.
CLSM images of a P. syringae pv. actinidiae NZ V-13 biofilm treated with different concentrations of kasugamycin and normal saline in a flow cell system. (A) Normal saline-treated biofilm (control); (B to D) biofilms treated with 5 ppm (B) 10 ppm (C), and 20 ppm (D) of kasugamycin; (E to H) colocalization intensity graphs representing the green fluorescent channel (horizontal axis) versus the red fluorescent channel (vertical axis) corresponding to each frame in panels A to D, respectively. For all frames and colocalization graphs, green fluorescent pixels are live cells, red fluorescent pixels are dead cells, and pixels of intermediate colors (orange or yellow) are membrane-damaged cells, which are considered dead.
FIG 8.
CLSM images of a P. syringae pv. actinidiae NZ V-13 biofilm treated with different concentrations of chlorine dioxide and normal saline in a flow cell system. (A) Normal saline-treated biofilm (control); (B to E) biofilms treated with 10 ppm (B), 20 ppm (C), 50 ppm (D), and (E) 100 ppm of chlorine dioxide. (F to J) Colocalization intensity graphs representing the green fluorescent channel (horizontal axis) versus the red fluorescent channel (vertical axis) corresponding to each frame in panels A to E, respectively. For all frames and colocalization graphs, green fluorescent pixels are live cells, red fluorescent pixels are dead cells, and pixels of intermediate colors (orange or yellow) are membrane-damaged cells, which are considered dead.
Kasugamycin effect on P. syringae pv. actinidiae NZ V-13 with respect to attachment to solid surfaces.
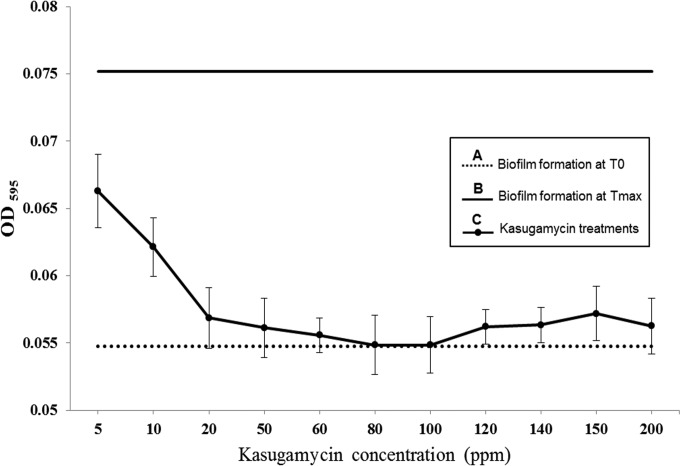
The first stage of biofilm formation is the attachment of the cells to surfaces. The SSA assay was conducted to evaluate the effect of kasugamycin on the attachment of planktonic P. syringae pv. actinidiae NZ V-13 cells to a solid surface at the initial stages of biofilm development (Fig. 9). Incubation of microplates inoculated with P. syringae pv. actinidiae NZ V-13 for 24 h provided an OD595 of 0.054, which was considered time zero (T0), or the initial attachment phase before treatment. Treatment of initially attached cells with kasugamycin at different concentrations ranging from 5 to 200 ppm prevented further attachment, while normal saline-treated cells continued their growth and attachment to the maximum of an OD595 of 0.075 (which was considered the time of maximum attachment [Tmax]). The most inhibitive effect of kasugamycin on surface attachment was found at concentrations of 80 and 100 ppm (Fig. 9).
FIG 9.
Effect of different concentrations of kasugamycin on P. syringae pv. actinidiae NZ V-13 in the SSA assay. (A) Biofilm formation attachment phase (T0); (B) biofilms with maximum adherence treated with normal saline (Tmax); (C) effect of different concentrations of kasugamycin on biofilm formation. Values and error bars represent the averages and standard deviations from 24 independent replicates, respectively.
Assay of bacteriostatic and bactericidal effects of kasugamycin.
In this study, kasugamycin was found to be lethal against P. syringae pv. actinidiae NZ V-13 grown in biofilm mode and to prevent surface attachment. Here, the bacteriostatic and bactericidal properties of kasugamycin at its different concentrations (5 ppm and 10 to 120 ppm at 10-ppm intervals) were evaluated. The bacteriostatic effect of kasugamycin against cells grown in planktonic mode with an initial OD600 of 0.44 was assessed, and then cultures were treated with kasugamycin at the above-mentioned concentrations. Compared with the growth of the bacteria in the normal saline-treated culture (OD600 = 1.97), kasugamycin prevented the growth of the bacteria at all concentrations tested (Fig. 10). The concentration of antibiotic where ≥95% of growth was inhibited (MIC) was 40 ppm, with the mean OD600 being 0.47. This analysis was followed by assessment of the bactericidal effect, which was measured by a conventional growth-based approach on solid cultures by counting of the number of CFU. Figure 11 shows the number of viable P. syringae pv. actinidiae NZ V-13 cells (number of CFU per milliliter) recovered after application of kasugamycin at various concentrations. Kasugamycin at 100 ppm showed a bactericidal effect against P. syringae pv. actinidiae NZ V-13. In these experiments, E. coli was used as the species with known susceptibility to kasugamycin and was considered a positive control (16).
FIG 10.
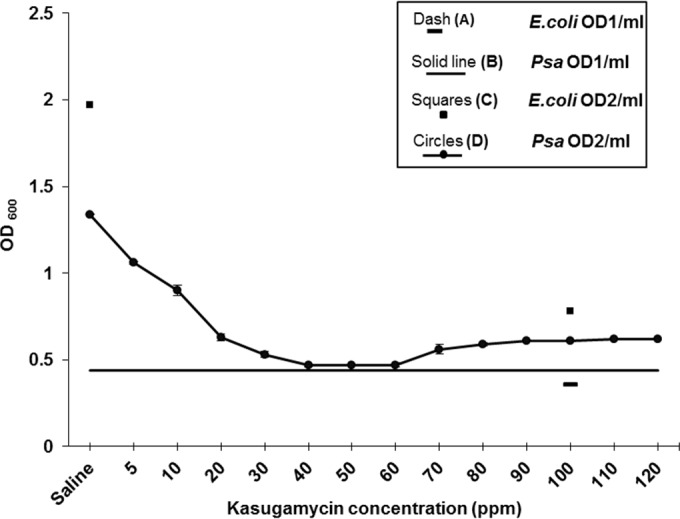
Assessment of bacteriostatic effect of kasugamycin at 600 nm on P. syringae pv. actinidiae NZ V-13 grown in planktonic mode and E. coli JM101, applied as a positive control. Dash (A), initial OD600 of untreated E. coli cells (E. coli OD1/ml; OD600 = 0.36); Solid line (B), initial OD600 of untreated P. syringae pv. actinidiae NZ V-13 cells (Psa OD1/ml; OD600 = 0.44); Squares (C), final OD600 of E. coli cells treated with 100 ppm of kasugamycin (E. coli OD2/ml) (OD600 = 0.78) and normal saline (OD600 = 1.97); Circles (D), final OD600 of P. syringae pv. actinidiae NZ V-13 cells treated with different concentrations of kasugamycin and normal saline (Psa OD2/ml; OD600 = 1.34). Values and error bars (<0.03 in all treatments) represent the averages and standard deviations from 3 independent replicates, respectively.
FIG 11.
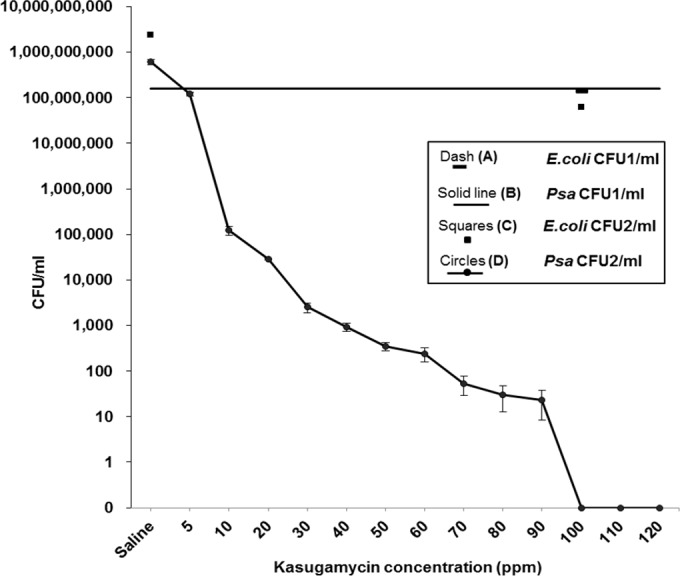
Assessment of bactericidal effect of kasugamycin on P. syringae pv. actinidiae NZ V-13 grown in planktonic mode and E. coli JM101, applied as a positive control. Dash (A), number of CFU per milliliter of untreated E. coli cells (E. coli CFU1/ml) (1.4E+08 CFU ml−1); Solid line (B), number of CFU per milliliter of untreated P. syringae pv. actinidiae NZ V-13 cells (Psa CFU1/ml) (1.58E+08 CFU ml−1); Squares (C), number of CFU per milliliter ml−1 of E. coli cells treated with 100 ppm of kasugamycin (E. coli CFU2/ml) (6.19E+07 CFU ml−1) and normal saline (2.39E+09 CFU ml−1); Circles (D), number of CFU per milliliter of P. syringae pv. actinidiae NZ V-13 cells treated with different concentrations of kasugamycin and normal saline (Psa CFU2/ml) (6.10E+08 CFU ml−1). Values and error bars represent the averages and standard deviations from 3 independent replicates, respectively.
DISCUSSION
In the present study, the ability of P. syringae pv. actinidiae NZ V-13 to form structured biofilms was investigated. Here, the biofilms formed by P. syringae pv. actinidiae NZ V-13 were shown to be heterogeneous and contained cellular aggregations and microcolonies (Fig. 1). Previous studies showed that some characteristics of plant-associated bacterial biofilms, such as cell size, density, and the presence of an exopolymeric matrix, were affected by physical parameters and the availability of water and nutrients. Several authors suggested that the biofilm growth mode is critical for plant-microbe interactions (48–53). The type of biofilm and cell aggregation observed here potentially mimics that of biofilms formed by bacteria outside and inside plant tissues; i.e., it shows the ability of P. syringae pv. actinidiae to attach to surfaces in an aqueous environment and to form three-dimensional biofilms. Here, the ability of P. syringae pv. actinidiae to form structured biofilms made of polysaccharides with novel compositions was established. Previously, it was reported that P. syringae pv. actinidiae NZ V-13 can form biofilms on the external and internal surfaces of plants, and these are likely involved in different phases of infection (9).
During biofilm maturation, the expression of sets of genes associated with virulence and production of the biofilm matrix causes enhancement of bacterial survival and resistance to antimicrobial compounds, host defense mechanisms, desiccation, UV damage, and predation (54–57). The biofilm growth mode and associated cell density-dependent gene regulation were found to be crucial to the pathogenicity of P. syringae for plants (58, 59).
Biofilms are composed of cells embedded in a matrix composed of EPSs (55). The EPSs protect embedded cells against plant recognition and defense mechanisms as well as antibacterial treatment (60). In this study, the ability of P. syringae pv. actinidiae NZ V-13 to produce EPSs likely involved in biofilm formation was assessed (Fig. 2). EPSs were isolated from P. syringae pv. actinidiae (Fig. 2), and their molecular mass (Fig. 4) and composition (Fig. 5 and Table 1) induced in response to increased osmolarity (300 mM NaCl) were analyzed. Our analysis shows that purified EPSs are mainly composed of rhamnose, fucose, and glucose (Table 1). Although the total amount of sugar in EPSs is significantly affected by a change in the osmolarity, the structure and composition of the constituent sugars were not significantly impacted (Fig. 3).
Further analysis of the EPSs revealed that they likely consist of two polysaccharides, a branched α-d-rhamnan with side chains of a terminal α-d-Fucf and an α-d-1, 4-linked glucan (Fig. 5; Table 2). Similar rhamnose-rich polysaccharides have been reported to be O-polysaccharide chains of lipopolysaccharides from P. syringae pv. phaseolicola (38) and Pseudomonas putida (43) and from strains of Xanthomonas campestris (39) and Halomonas alkaliantarctica (46). However, this is the first time that such branched rhamnans have been reported to be exopolysaccharides from Pseudomonas species. Rhamnose-rich exopolysaccharides have also been reported from Bifidobacterium animalis subsp. lactis (42) and Lactococcus lactis subsp. cremoris B39 (60), but in both cases the rhamnose was reported to be α-l-rhamnose. α-d-Glucans, similar to those reported here, have been shown to coextract with lipopolysaccharides from strains of P. syringae pv. morsprunorum (37, 41).
Here, the effect of two commonly used bacterial growth control reagents, kasugamycin and chlorine dioxide, on the survival of P. syringae pv. actinidiae NZ V-13 biofilm cells was studied, in view of the need to manage P. syringae pv. actinidiae-caused disease, i.e., the need to prevent the spread of P. syringae pv. actinidiae and treat infected plants. Kasugamycin and chlorine dioxide were found to efficiently kill cells grown in biofilm mode at low concentrations (Fig. 6 to 8). Kasugamycin inhibits the proliferation of bacteria by targeting the ribosome, consequently blocking proper mRNA placement; i.e., it inhibits translation (61). It was noted that kasugamycin can be more effective against Pseudomonas than various other bacteria (62). This antibiotic was approved for use for the control of P. syringae pv. actinidiae NZ V-13 disease in kiwifruit by New Zealand's Environmental Protection Authority (http://www.epa.govt.nz). In contrast, ClO2 was previously reported to be able to penetrate biofilms and cause the detachment of biofilm clusters. It is a strongly oxidizing reagent which can inactivate cells. The advantage of this compound is that it is effective at low concentrations (15, 63, 64). Kasugamycin was shown to inhibit further attachment of P. syringae pv. actinidiae NZ V-13 cells in the SSA assay; i.e., it interferes with the initial stages of biofilm formation (Fig. 9).
The effect of different concentrations of kasugamycin on P. syringae pv. actinidiae NZ V-13 growth in planktonic mode was measured, and it was shown that the bactericidal level of kasugamycin was about 2-fold the MICs for various Pseudomonas spp. (Fig. 10 and 11) (62).
In this study, P. syringae pv. actinidiae NZ V-13, a highly virulent strain causing kiwifruit canker, was studied with respect to biofilm formation and EPS composition as well as its susceptibility to chlorine dioxide and kasugamycin. We have provided experimental evidence for the effectiveness of chlorine dioxide and kasugamycin for the control of P. syringae pv. actinidiae NZ V-13. On the basis of EPS compositional analyses and comparison of the findings with those in the literature, the polysaccharide identified in this study can be cautiously considered a new polysaccharide. Overall, this study has shed light on P. syringae pv. actinidiae biofilm formation and composition as well as the control of P. syringae pv. actinidiae growth. These findings will aid with the development of a management program to control the spread of P. syringae pv. actinidiae.
Supplementary Material
ACKNOWLEDGMENTS
The present research was funded by Massey University research grants to Bernd H. A. Rehm (Institute of Fundamental Sciences, Massey University). Shirin Ghods is funded by a Massey University doctoral scholarship.
We are grateful to M. S. Savoian (Manawatu Microscopy & Imaging Centre, Institute of Fundamental Sciences, Massey University) for his technical assistance and Adrian Turner (School of Biological Sciences, University of Auckland) for permission to use IMARIS software.
The mention of trade names or commercial products in this article is solely for the purpose of providing specific information and does not imply recommendation or endorsement by Massey University.
Footnotes
Supplemental material for this article may be found at http://dx.doi.org/10.1128/AEM.00194-15.
REFERENCES
- 1.Takikawa Y, Serizawa S, Ichikawa T, Goto M, Takanashi K. 1989. Pseudomonas syringae pv. actinidiae pv. nov.: the causal of canker bacterium of canker of kiwifruit in Japan. Ann Phytopathol Soc Jpn 55:437–444. doi: 10.3186/jjphytopath.55.437. [DOI] [Google Scholar]
- 2.Koh YJ, Chung HJ, Cha BJ, Lee DH. 1994. Outbreak and spread of bacterial canker in kiwifruit. Plant Pathol 10:68–72. [Google Scholar]
- 3.Balestra GM, Mazzaglia A, Quattrucci A, Renzi M, Rossetti A. 2009. Current status of bacterial canker spread on kiwifruit in Italy. Australas Plant Dis Notes 4:34–36. doi: 10.1071/DN09014. [DOI] [Google Scholar]
- 4.Ferrante P, Scortichini M. 2010. Molecular and phenotypic features of Pseudomonas syringae pv. actinidiae isolated during recent epidemics of bacterial canker on yellow kiwifruit (Actinidia chinensis) in central Italy. Plant Pathol 59:954–962. doi: 10.1111/j.1365-3059.2010.02304.x. [DOI] [Google Scholar]
- 5.Young JM. 2012. Pseudomonas syringae pv. actinidiae in New Zealand. J Plant Pathol 94:5–10. [Google Scholar]
- 6.McCann HC, Rikkerink EHA, Bertels F, Fiers M, Lu A, Rees-George J, Andersen MT, Gleave AP, Haubold B, Wohlers MW, Guttman DS, Wang PW, Straub C, Vanneste JL, Vanneste J, Rainey PB, Templeton MD. 2013. Genomic analysis of the kiwifruit pathogen Pseudomonas syringae pv. actinidiae provides insight into the origins of an emergent plant disease. PLoS Pathog 9:e1003503. doi: 10.1371/journal.ppat.1003503. [DOI] [PMC free article] [PubMed] [Google Scholar]
- 7.Everett KR, Taylor RK, Romberg MK, Rees-George J, Fullerton RA, Vanneste JL, Manning MA. 2011. First report of Pseudomonas syringae pv. actinidiae causing kiwifruit bacterial canker in New Zealand. Australas Plant Dis Notes 6:67–71. doi: 10.1007/s13314-011-0023-9. [DOI] [Google Scholar]
- 8.Greer G, Saunders C. 2012. The costs of Psa-V to the New Zealand kiwifruit industry and the wider community. Agribusiness and Economics Research Unit report. Lincoln University, Christchurch, New Zealand. [Google Scholar]
- 9.Renzi M, Copini P, Taddei AR, Rossetti A, Gallipoli L, Mazzaglia A, Balestra GM. 2012. Bacterial canker on kiwifruit in Italy: anatomical changes in the wood and in the primary infection sites. Phytopathology 102:827–840. doi: 10.1094/PHYTO-02-12-0019-R. [DOI] [PubMed] [Google Scholar]
- 10.Chen X, Stewart PS. 2000. Biofilm removal caused by chemical treatments. Water Res 34:4229–4233. doi: 10.1016/S0043-1354(00)00187-1. [DOI] [Google Scholar]
- 11.Donlan RM, Costerton JW. 2002. Biofilms: survival mechanisms of clinically relevant microorganisms. Clin Microbiol Rev 15:167–193. doi: 10.1128/CMR.15.2.167-193.2002. [DOI] [PMC free article] [PubMed] [Google Scholar]
- 12.Dow JM, Crossman L, Findlay K, He Y-Q, Feng J-X, Tang J-L. 2003. Biofilm dispersal in Xanthomonas campestris is controlled by cell-cell signaling and is required for full virulence to plants. Proc Natl Acad Sci U S A 100:10995–11000. doi: 10.1073/pnas.1833360100. [DOI] [PMC free article] [PubMed] [Google Scholar]
- 13.Umezawa H, Okami Y, Hashimoto T, Sukara M, Hamada M, Takeuchi T. 1965. A new antibiotic, kasugamycin. J Antibiot A 18:101–103. [PubMed] [Google Scholar]
- 14.Suhara Y, Maeda K, Umezawa H. 1966. Chemical studies on kasugamycin. V. The structure of kasugamycin. Tetrahedron Lett 12:1239–1244. [DOI] [PubMed] [Google Scholar]
- 15.Behnke S, Camper AK. 2012. Chlorine dioxide disinfection of single and dual species biofilms, detached biofilm and planktonic cells. Biofouling 28:635–647. doi: 10.1080/08927014.2012.700705. [DOI] [PubMed] [Google Scholar]
- 16.Suvorov A, Van Gemen B, Van Knippenberg P. 1988. Increased kasugamycin sensitivity in Escherichia coli caused by the presence of an inducible erythromycin resistance (erm) gene of Streptococcus pyogenes. Mol Gen Genet 215:152–155. doi: 10.1007/BF00331317. [DOI] [PubMed] [Google Scholar]
- 17.King EO, Ward MK, Raney DE. 1954. Two simple media for the demonstration of pyocyanin and fluorescin. J Lab Clin Med 44:301–307. [PubMed] [Google Scholar]
- 18.Hay ID, Remminghorst U, Rehm BHA. 2009. MucR, a novel membrane-associated regulator of alginate biosynthesis in Pseudomonas aeruginosa. Appl Environ Microbiol 75:1110–1120. doi: 10.1128/AEM.02416-08. [DOI] [PMC free article] [PubMed] [Google Scholar]
- 19.Ghafoor A, Hay ID, Rehm BHA. 2011. Role of exopolysaccharides in Pseudomonas aeruginosa biofilm formation and architecture. Appl Environ Microbiol 77:5238–5246. doi: 10.1128/AEM.00637-11. [DOI] [PMC free article] [PubMed] [Google Scholar]
- 20.Rehman ZU, Wang Y, Moradali MF, Hay ID, Rehm BHA. 2013. Insights into the assembly of the alginate biosynthesis machinery in Pseudomonas aeruginosa. Appl Environ Microbiol 79:3264–3272. doi: 10.1128/AEM.00460-13. [DOI] [PMC free article] [PubMed] [Google Scholar]
- 21.Blumenkrantz N, Asboe-Hansen G. 1973. New method for quantitative determination of uronic acids. Anal Biochem 489:484–489. [DOI] [PubMed] [Google Scholar]
- 22.Hay ID, Rehman ZU, Rehm BHA. 2010. Membrane topology of outer membrane protein AlgE, which is required for alginate production in Pseudomonas aeruginosa. Appl Environ Microbiol 76:1806–1812. doi: 10.1128/AEM.02945-09. [DOI] [PMC free article] [PubMed] [Google Scholar]
- 23.Yemm EW, Willis AJ. 1954. The estimation of carbohydrates in plant extracts by anthrone. Biochem J 57:508–514. [DOI] [PMC free article] [PubMed] [Google Scholar]
- 24.Bradford MM. 1976. A rapid and sensitive method for the quantitation of microgram quantities of protein utilizing the principle of protein-dye binding. Anal Biochem 72:248–254. doi: 10.1016/0003-2697(76)90527-3. [DOI] [PubMed] [Google Scholar]
- 25.Stoscheck CM. 1990. Quantitation of protein. Methods Enzymol 182:50–68. doi: 10.1016/0076-6879(90)82008-P. [DOI] [PubMed] [Google Scholar]
- 26.Laemmli UK. 1970. Cleavage of structural proteins during the assembly of the head of bacteriophage T4. Nature 227:680–685. doi: 10.1038/227680a0. [DOI] [PubMed] [Google Scholar]
- 27.Jan S, Roblot C, Goethals G, Courtois J, Courtois B, Saucedo JEN, Seguin JP, Barbotin JN. 1995. Study of parameters affecting poly(3-hydroxybutyrate) quantification by gas chromatography. Anal Biochem 225:258–263. doi: 10.1006/abio.1995.1151. [DOI] [PubMed] [Google Scholar]
- 28.De Ruiter G, Schols H, Voragen A, Rombouts F. 1992. Carbohydrate analysis of water-soluble uranic acid-containing polysaccharides with high-performance chromatography using methanolysis combined with TFA hydrolysis is superior to four other methods. Anal Biochem 207:176–185. doi: 10.1016/0003-2697(92)90520-H. [DOI] [PubMed] [Google Scholar]
- 29.Wee M, Matia-Merino L, Carnachan SM, Sims IM, Goh KK. 2014. Structure of a shear-thickening polysaccharide extracted from the New Zealand black tree fern, Cyathea medullaris. Int J Biol Macromol 70:86–91. doi: 10.1016/j.ijbiomac.2014.06.032. [DOI] [PubMed] [Google Scholar]
- 30.Ciucanu I, Kerek F. 1984. A simple and rapid method for permethylation of carbohydrates. Carbohydr Res 131:209–217. doi: 10.1016/0008-6215(84)85242-8. [DOI] [Google Scholar]
- 31.Carnachan SM, Bootten TJ, Mishra S, Monro JA, Sims IM. 2012. Effects of simulated digestion in vitro on cell wall polysaccharides from kiwifruit (Actinidia spp.). Food Chem 133:132–139. doi: 10.1016/j.foodchem.2011.12.084. [DOI] [Google Scholar]
- 32.Sims IM, Furneaux RH. 2003. Structure of the exudate gum from Meryta sinclairii. Carbohydr Polym 52:423–431. doi: 10.1016/S0144-8617(02)00326-0. [DOI] [Google Scholar]
- 33.Kuehn M, Hausner M, Bungartz H, Wagner M, Wilderer PA, Wuertz S. 1998. Automated confocal laser scanning microscopy and semiautomated image processing for analysis of biofilms. Appl Environ Microbiol 64:4115–4127. [DOI] [PMC free article] [PubMed] [Google Scholar]
- 34.Merritt JH, Kadouri DE, O'Toole GA. 2005. Growing and analyzing static biofilms. Curr Protoc Microbiol Chapter 1:Unit 1B.1. doi: 10.1002/9780471729259.mc01b01s00. [DOI] [PMC free article] [PubMed] [Google Scholar]
- 35.Everett K. 2011. Product screening test for kasumin and phyton. Part 1. Growth rate test. Plant & Food Research Pseudomonas syringae pv. actinidiae (Psa) research note. The New Zealand Institute for Plant & Food Research Ltd, Auckland, New Zealand: http://www.kvh.org.nz/vdb/document/1141. [Google Scholar]
- 36.Hall J, Orth E. 1962. Actinospectacin: an in vitro study of effectiveness against pathogenic bacteria. Am J Med Sci 12:30–39. [DOI] [PubMed] [Google Scholar]
- 37.Spitali M, Patel M, Smith ARW. 1995. Structures of lipopolysaccharide side-chains of NCPPB 2995, the neopathotype strain of Pseudomonas syringae pv. mors-prunorum and three other strains, in relation to O-serogroup. J Phytopathol 143:671–677. [Google Scholar]
- 38.Zdorovenko EL, Ovod VV, Zatonsky GV, Shashkov AS, Kocharova NA, Knirel YA. 2001. Location of the O-methyl groups in the O polysaccharide of Pseudomonas syringae pv. phaseolicola. Carbohydr Res 330:505–510. doi: 10.1016/S0008-6215(01)00005-2. [DOI] [PubMed] [Google Scholar]
- 39.Senchenkova SN, Huang X, Laux P, Knirel YA, Shashkov AS, Rudolph K. 2002. Structures of the O-polysaccharide chains of the lipopolysaccharides of Xanthomonas campestris pv. phaseoli var. fuscans GSPB 271 and X. campestris pv. malvacearum GSPB 1386 and GSPB 2388. Carbohydr Res 337:1723–1728. doi: 10.1016/S0008-6215(02)00268-9. [DOI] [PubMed] [Google Scholar]
- 40.Ovod VV, Knirel YA, Samson R, Krohn KAIJ. 1999. Immunochemical characterization and taxonomic evaluation of the O-polysaccharides of the lipopolysaccharides of Pseudomonas syringae serogroup O1 strains. J Bacteriol 181:6937–6947. [DOI] [PMC free article] [PubMed] [Google Scholar]
- 41.Smith ARW, Munro SM, Wait R, Hignett RC. 1994. Effect on lipopolysaccharide structure of aeration during growth of a plum isolate of Pseudomonas syringae pv. morsprunorum. Microbiology 140:1585–1593. [DOI] [PubMed] [Google Scholar]
- 42.Veremeichenko SN, Zdorovenko GM, Zdorovenko EL, Zatonskii GM. 2005. Characterization of lipopolysaccharides from Pseudomonas fluorescens IMB 2108 (biovar II) and IMB 2111 (biovar IV) with O-chains represented by α-glucan. Mikrobiologiia 74:633–641. (In Russian.) doi: 10.1007/s11021-005-0102-z. [DOI] [PubMed] [Google Scholar]
- 43.Knirel YA, Shashkov AS, Senchenkova SN, Ajiki Y, Fukuoka S. 2002. Structure of the O-polysaccharide of Pseudomonas putida FERM P-18867. Carbohydr Res 337:1589–1591. doi: 10.1016/S0008-6215(02)00216-1. [DOI] [PubMed] [Google Scholar]
- 44.Sato N, Nakazawa F, Ito T, Hoshino T, Hoshino E. 2003. The structure of the antigenic polysaccharide produced by Eubacterium saburreum T15. Carbohydr Res 338:923–930. doi: 10.1016/S0008-6215(03)00049-1. [DOI] [PubMed] [Google Scholar]
- 45.Kaczynski Z, Karapetyan G, Evidente A, Iacobellis NS, Holst O. 2006. The structure of a putative exopolysaccharide of Burkholderia gladioli pv. agaricicola. Carbohydr Res 341:285–288. doi: 10.1016/j.carres.2005.10.020. [DOI] [PubMed] [Google Scholar]
- 46.Pieretti G, Nicolaus B, Poli A, Corsaro MM, Lanzetta R, Parrilli M. 2009. Structural determination of the O-chain polysaccharide from the haloalkaliphilic Halomonas alkaliantarctica bacterium strain CRSS. Carbohydr Res 344:2051–2055. doi: 10.1016/j.carres.2009.06.022. [DOI] [PubMed] [Google Scholar]
- 47.Leivers S, Hidalgo-Cantabrana C, Robinson G, Margolles A, Ruas-Madiedo P, Laws AP. 2011. Structure of the high molecular weight exopolysaccharide produced by Bifidobacterium animalis subsp. lactis IPLA-R1 and sequence analysis of its putative eps cluster. Carbohydr Res 346:2710–2717. doi: 10.1016/j.carres.2011.09.010. [DOI] [PubMed] [Google Scholar]
- 48.Morris CE, Monier J-M. 2003. The ecological significance of biofilm formation by plant-associated bacteria. Annu Rev Phytopathol 41:429–453. doi: 10.1146/annurev.phyto.41.022103.134521. [DOI] [PubMed] [Google Scholar]
- 49.Ramey BE, Koutsoudis M, Von Bodman SB, Fuqua C. 2004. Biofilm formation in plant-microbe associations. Curr Opin Microbiol 7:602–609. doi: 10.1016/j.mib.2004.10.014. [DOI] [PubMed] [Google Scholar]
- 50.Leveau JHJ, Lindow SE. 2001. Appetite of an epiphyte: quantitative monitoring of bacterial sugar consumption in the phyllosphere. Proc Natl Acad Sci U S A 98:3446–3453. doi: 10.1073/pnas.061629598. [DOI] [PMC free article] [PubMed] [Google Scholar]
- 51.Monier J-M. 2002. Biological significance of bacterial aggregation of leaf surfaces: the social life of epiphytic bacteria. Environmental Science Policy and Management, University of California, Berkeley, Berkeley, CA. [Google Scholar]
- 52.Morris CE. 2001. Phyllosphere. In Encyclopedia for life sciences. National Publishing Group, London, United Kingdom: http://www.els.net. [Google Scholar]
- 53.Steinberger RE, Allen AR, Hansa HG, Holden PA. 2002. Elongation correlates with nutrient deprivation in Pseudomonas aeruginosa-unsaturated biofilms. Microb Ecol 43:416–423. doi: 10.1007/s00248-001-1063-z. [DOI] [PubMed] [Google Scholar]
- 54.Prigent-Combaret C, Vidal O, Dorel C, Lejeune P. 1999. Abiotic surface sensing and biofilm-dependent regulation of gene expression in Escherichia coli. J Bacteriol 181:5993–6002. [DOI] [PMC free article] [PubMed] [Google Scholar]
- 55.Costerton JW, Lewandowski Z, Caldwell DE, Korber DR, Lappin-Scott HM. 1995. Microbial biofilms. Annu Rev Microbiol 49:711–745. doi: 10.1146/annurev.mi.49.100195.003431. [DOI] [PubMed] [Google Scholar]
- 56.Davey ME, O'Toole GA. 2000. Microbial biofilms: from ecology to molecular genetics. Microbiol Mol Biol Rev 64:846–867. doi: 10.1128/MMBR.64.4.847-867.2000. [DOI] [PMC free article] [PubMed] [Google Scholar]
- 57.Watnick P, Kolter R. 2000. Biofilm, city of microbes. J Bacteriol 182:2675–2679. doi: 10.1128/JB.182.10.2675-2679.2000. [DOI] [PMC free article] [PubMed] [Google Scholar]
- 58.Von Bodman SB, Bauer WD, Coplin DL. 2003. Quorum sensing in plant-pathogenic bacteria. Annu Rev Phytopathol 41:455–482. doi: 10.1146/annurev.phyto.41.052002.095652. [DOI] [PubMed] [Google Scholar]
- 59.Quiñones B, Dulla G, Lindow SE. 2005. Quorum sensing regulates exopolysaccharide production, motility, and virulence in Pseudomonas syringae. Mol Plant Microbe Interact 18:682–693. doi: 10.1094/MPMI-18-0682. [DOI] [PubMed] [Google Scholar]
- 60.Van Casteren WHM, Dijkema C, Schols HA, Beldman G, Voragen AGJ. 2000. Structural characterisation and enzymic modification of the exopolysaccharide produced by Lactococcus lactis subsp. cremoris B39. Carbohydr Res 324:170–181. doi: 10.1016/S0008-6215(99)00292-X. [DOI] [PubMed] [Google Scholar]
- 61.Mankin A. 2006. Antibiotic blocks mRNA path on the ribosome. Nat Struct Mol Biol 13:858–860. doi: 10.1038/nsmb1006-858. [DOI] [PubMed] [Google Scholar]
- 62.Levitan AA. 1967. In vitro antibacterial activity of kasugamycin. Appl Microbiol 15:750–753. [DOI] [PMC free article] [PubMed] [Google Scholar]
- 63.Benarde MA, Snow WB, Olivieri VP. 1967. Kinetics and mechanism of bacterial disinfection by chlorine dioxide. Appl Microbiol 15:257–265. [DOI] [PMC free article] [PubMed] [Google Scholar]
- 64.Mayack LA, Soracco RJ, Wilde EW, Pope DH. 1984. Comparative effectiveness of chlorine and chlorine dioxide biocide regimes for biofouling control. Water Res 18:593–599. doi: 10.1016/0043-1354(84)90209-4. [DOI] [Google Scholar]
Associated Data
This section collects any data citations, data availability statements, or supplementary materials included in this article.


