Abstract
Alterations in oxidative metabolism are considered to be one of the major contributors to Huntington's disease (HD) pathogenesis. However, existing data about oxidative metabolism in HD are contradictory. Here, we investigated the effect of mutant huntingtin (mHtt) on oxidative metabolism in YAC128 mice. Both mHtt and wild-type huntingtin (Htt) were associated with mitochondria and the amount of bound Htt was four-times higher than the amount of bound mHtt. Percoll gradient-purified brain synaptic and non-synaptic mitochondria as well as unpurified brain, liver and heart mitochondria, isolated from 2- and 10-month-old YAC128 mice and age-matched WT littermates had similar respiratory rates. There was no difference in mitochondrial membrane potential or ADP and ATP levels. Expression of selected nuclear-encoded mitochondrial proteins in 2- and 10-month-old YAC128 and WT mice was similar. Cultured striatal and cortical neurons from YAC128 and WT mice had similar respiratory and glycolytic activities as measured with Seahorse XF24 analyzer in medium containing 10 mm glucose and 15 mm pyruvate. In the medium with 2.5 mm glucose, YAC128 striatal neurons had similar respiration, but slightly lower glycolytic activity. Striatal neurons had lower maximal respiration compared with cortical neurons. In vivo experiments with YAC128 and WT mice showed similar O2 consumption, CO2 release, physical activity, food consumption and fasted blood glucose. However, YAC128 mice were heavier and had more body fat compared with WT mice. Overall, our data argue against respiratory deficiency in YAC128 mice and, consequently, suggest that mitochondrial respiratory dysfunction is not essential for HD pathogenesis.
Introduction
Huntington's disease (HD) is a fatal neurodegenerative disorder that belongs to the family of polyglutamine (polyQ) diseases (1) and manifests in motor, cognitive, psychiatric and behavioral abnormalities (2). In 1993, HD was linked to a mutation in huntingtin (Htt), a 350 kDa protein that in healthy individuals contains no more than 35 glutamines at a site near the N-terminus (3). An increased number of glutamines in the poly-glutamine (polyQ) stretch of Htt correlates with neuronal dysfunction in the striatum and cerebral cortex, and eventually results in neuronal loss (4). The exact mechanism of the deleterious effect of mutant Htt (mHtt) on neurons is not yet clear, but may include altered gene transcription (5), abnormal autophagy (6), defective mitochondrial biogenesis (7) and aberrant mitochondrial dynamics (8–10) and trafficking (7,11). In addition, bioenergetic defects are considered to be major contributing factors to neuronal dysfunction in HD (12), although the mechanism by which mHtt affects energy metabolism is not completely understood. It has been shown that HD patients at early stages of the disease have impaired glucose metabolism (13). In postmortem brain tissue from HD patients, decreased respiratory activity of HD caudate mitochondria (14) and defects in mitochondrial Complexes II, III and IV were found (15,16). However, it is not clear whether these mitochondrial defects contribute to HD pathogenesis or if they are a consequence of late stage of HD pathology. In support of the hypothesis that mHtt affects energy metabolism, Kim et al. (17) found a significant reduction in respiration of succinate-fueled striatal mitochondria from pre-symptomatic transgenic D9-N171–98Q mice, compared with their wild-type littermates, suggesting Complex II impairment. In another study, Damiano et al. (18) detected defects in respiration of mitochondria from forebrains of N171-82Q transgenic mice.
However, other investigators failed to find definitive evidence for a deleterious effect of mHtt on energy metabolism. Guidetti et al. (19) and Olah et al. (20) failed to find a difference in activity of mitochondrial Complexes I–IV in brain mitochondria of HD mice compared with mitochondria from wild-type animals. Milacovic and Johnson (21) also did not find a difference in the activities of mitochondrial Complexes I–IV in mutant STHdhQ111/Q111 striatal neuronal progenitor cells compared with wild-type STHdhQ7/Q7 cells. Oliveira et al. (22) found that respiratory activity of striatal neurons from heterozygous knock-in Hdh150/+ mice and WT littermates was similar. Gourane et al. (23) also found no difference in respiration of striatal neurons from transgenic BACHD rats compared with wild-type neurons, when cells were fueled with 25 mm glucose and 1 mm pyruvate. Thus, whether mHtt affects oxidative metabolism and the potential mechanisms of this mHtt effect remains unclear.
In the present study, we, for the first time, evaluated the effect of mHtt on oxidative metabolism using isolated Percoll gradient-purified brain mitochondria (synaptic and non-synaptic), and unpurified brain, heart and liver mitochondria from 2- and 10-month-old YAC128 and wild-type FVB/NJ mice (WT) as well as primary striatal and cortical neurons from postnatal Day 1 WT and transgenic animals. Additionally, we evaluated oxidative metabolism in in vivo experiments with YAC128 and WT mice. Despite all our efforts, we did not find evidence for mHtt-induced impairment of oxidative metabolism in YAC128 mice.
Results
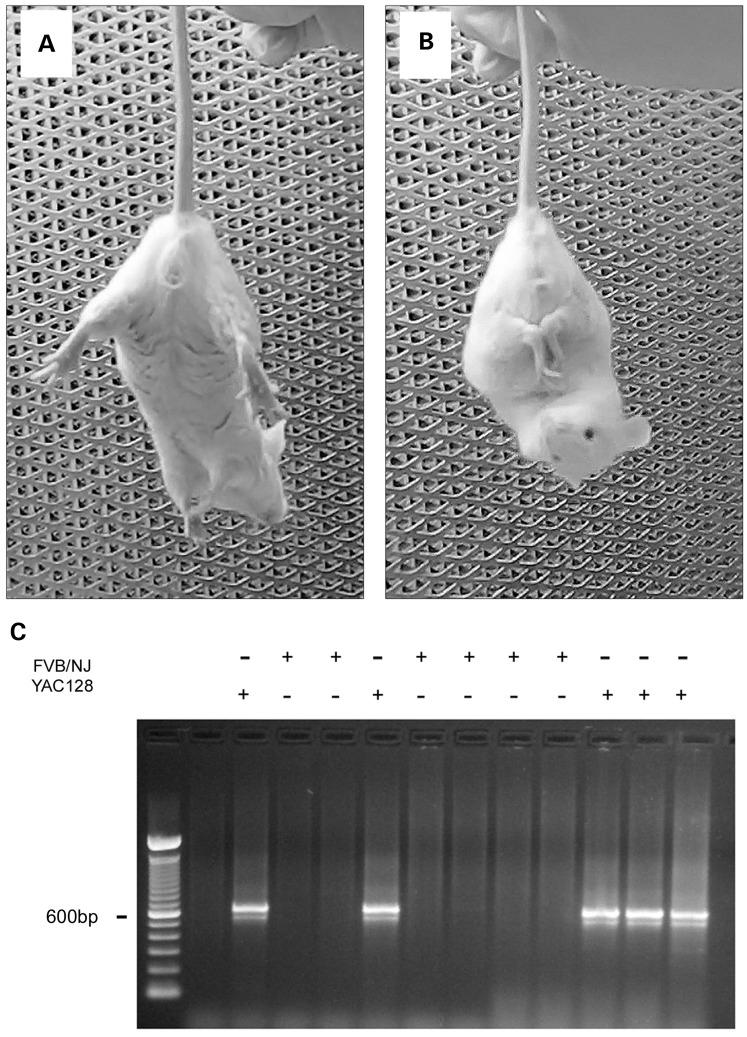
In our experiments, we used YAC128 mice, which express full-length human mHtt with a 128-glutamine stretch near the N-terminus (24). At 2 months of age, these mice begin to demonstrate a behavioral abnormality characterized by clasping of fore- and hind-limbs when suspended by the tail (Fig. 1A and B). This behavior is typical for transgenic HD mice (25,26). We regularly observed clasping behavior in 2-month-old YAC128 mice. Overall, out of 288 2-month-old YAC128 mice of both sexes (162 males and 126 females) tested for clasping behavior, clasping behavior was detected in 158 animals (96 males and 62 females). In our study, we used early symptomatic 2-month-old YAC128 mice and their WT littermates as well as 10-month-old YAC128 mice at the later stage of pathology and their age-matched littermates to prepare isolated brain mitochondria. We used animals of both sexes.
Figure 1.
Behavioral phenotype of 2-month-old YAC128 mice and a representative genotyping. (A) The normal response of a wild-type (WT) FVB/NJ mouse to suspension by the tail with limbs extended out. (B) Clasping behavior of a YAC128 mouse that was usually observed within 15–45 s of suspension. C. Representative genotyping data of tail tissue from WT and YAC128 mice.
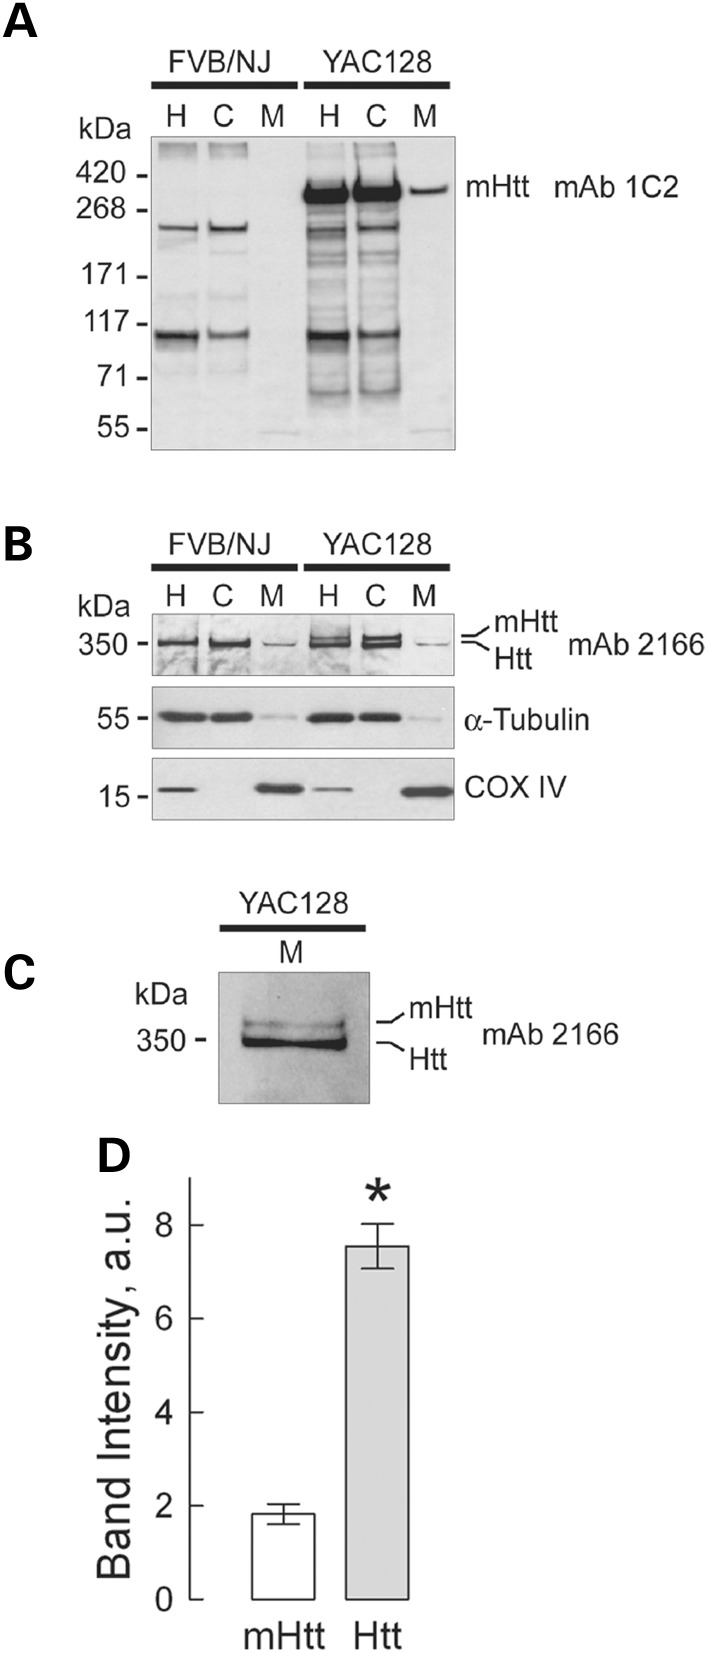
Every mouse used in our experiments was genotyped (Fig. 1C). In addition, western blotting was used to confirm the presence of mHtt in all samples used. In immunoblotting experiments with brain homogenates and cytosolic and purified synaptic (neuronal) mitochondrial fractions from WT and YAC128 mice, we used two different antibodies for total Htt and mHtt: monoclonal anti-Htt antibody 2166 (mAb 2166, Millipore), which recognizes both wild-type Htt and mHtt, and monoclonal anti-polyQ antibody 1C2 (mAb 1574, Millipore), which recognizes mHtt. With mHtt-specific mAb 1C2, a 350 kDa band, representing mHtt, was detected in homogenates, cytosolic and mitochondrial fractions from YAC128 mice, but not in samples from WT animals (Fig. 2A). Probing purified brain synaptic mitochondria with mAb 1C2 produced a distinct band indicating that mHtt is associated with isolated mitochondria. A similar result was produced with non-synaptic mitochondria (data not shown). Probing with anti-Htt mAb 2166, we detected a 350 kDa band, corresponding to wild-type Htt, in both WT and YAC128 samples (Fig. 2B). In brain homogenates and cytosolic fractions from YAC128 mice, mAb 2166 detected an additional band with a slightly higher molecular weight that represents mHtt. The level of expression of human mHtt was similar to the expression of endogenous wild-type Htt (Fig. 2B), which is consistent with previously reported data for YAC128 mice (24,27). α-Tubulin and cytochrome c oxidase subunit IV (COX IV) were used as cytosolic and mitochondrial markers, respectively. The weak α-tubulin bands seen in mitochondrial fractions were most likely due to tubulin binding to voltage-dependent anion channel (VDAC) in the outer mitochondrial membrane (28). Interestingly, with mAb 2166, only wild-type Htt was easily detected in purified mitochondria from both WT and YAC128 mice, whereas the mHtt level in YAC128 mitochondria appeared to be much lower (Fig. 2B). Only with increased protein loading (50 µg/lane) and extended film exposure, did a mHtt band become evident (Fig. 2C). Similar results were obtained with non-synaptic mitochondria (data not shown). Figure 2D shows the results of densitometry of wild-type mouse Htt and human mHtt bands.
Figure 2.
Detection of wild-type mouse huntingtin (Htt) and mutant human huntingtin (mHtt) in homogenates, and cytosolic and synaptic mitochondrial fractions from 2-month-old YAC128 and WT mice. In (A) mHtt was detected with anti-polyQ 1C2 antibody as a single band exclusively in samples from YAC128 mice. The bands with lower molecular weights (∼200 kDa and 100 kDa) are present in both WT and YAC128 samples and most likely represent a result of non-specific cross-reaction with unidentified polyglutamine-containing proteins. In (B) Htt and mHtt were detected using western blotting with 2166 antibody, which recognizes both Htt and mHtt. In homogenates and cytosolic fractions from WT and YAC128 mice, a 350 kDa band, belonging to wild-type Htt, was detected, whereas two bands, most likely representing both Htt and mHtt, were detected in homogenates and cytosolic fractions from YAC128 mice. Tubulin and COX IV were used as cytosolic and mitochondrial markers, respectively. In mitochondrial fractions from both WT and YAC128 mice, faint bands corresponding to Htt were detected, whereas amounts of mHtt attached to mitochondria were too low to be reliably detected with 2166 antibody. Only after an increase in protein loading (50 µg/lane) and in exposure time of the film, did mHtt band become evident (C). In A–C: H, homogenate; C, cytosolic fraction; M, mitochondrial fraction. In (D), the results of densitometry of mHtt and Htt bands obtained with 2166 antibody applied to mitochondrial samples. Data are mean ± SEM, N = 7, *P < 0.01 comparing band intensity for mHtt and wild-type Htt.
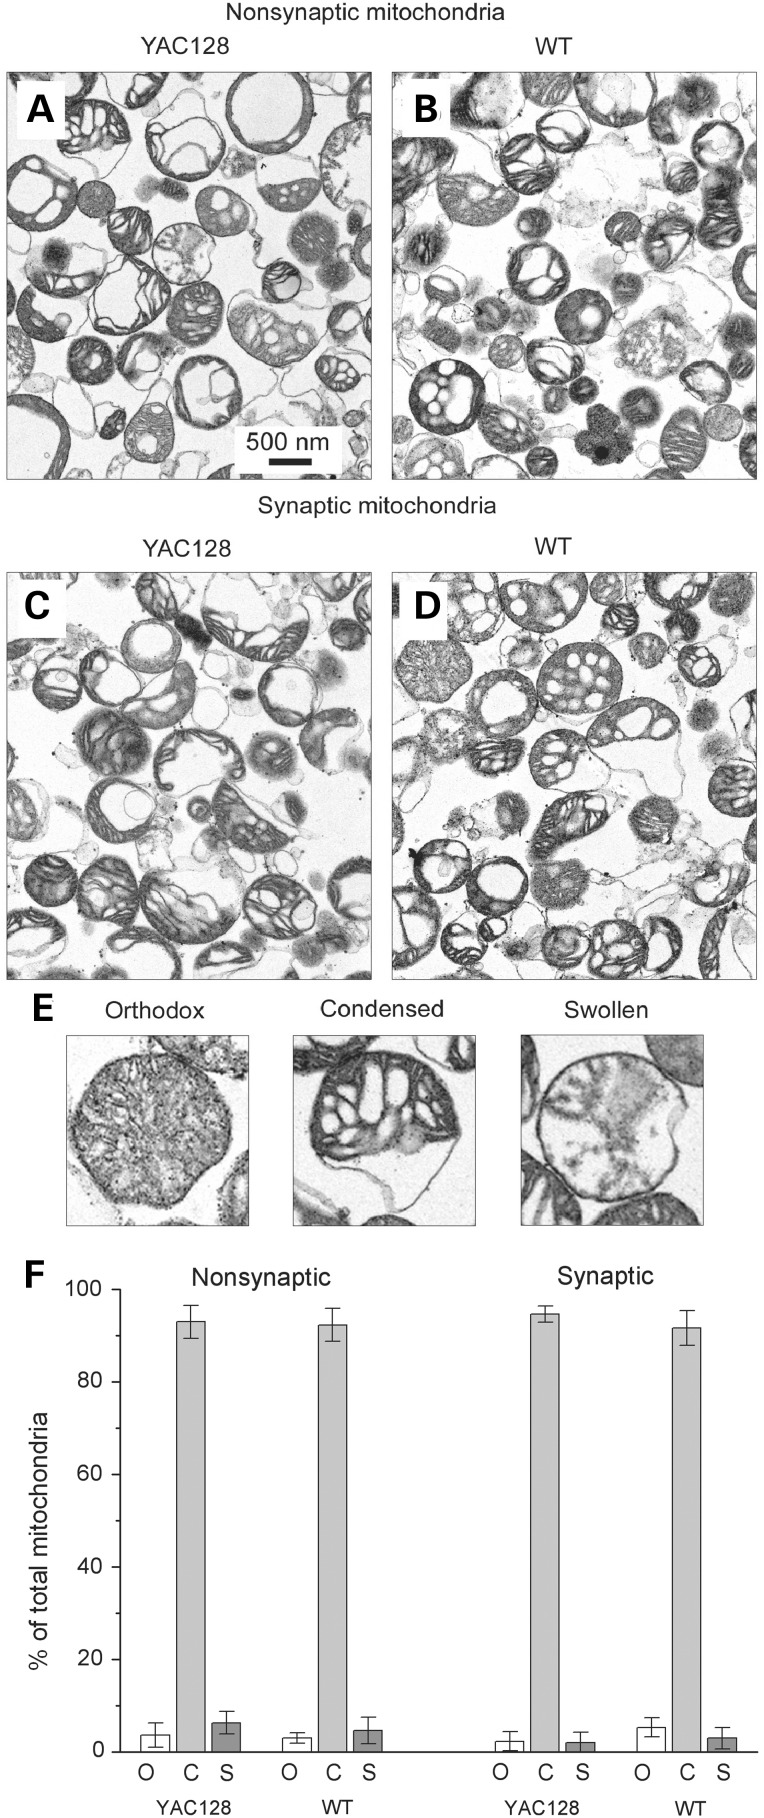
In our experiments, we used Percoll gradient-purified synaptic and non-synaptic brain mitochondria isolated from YAC128 and WT mice. To characterize the isolated mitochondria, we performed transmission electron microscopy (TEM). The TEM did not reveal overt morphological differences in non-synaptic (Fig. 3A and B) and synaptic (Fig. 3C and D) mitochondria isolated from 2-month-old YAC128 (Fig. 3A and C) and WT mice (Fig. 3B and D). From these images, mitochondria were categorized into three distinct groups based on morphology (Fig. 3E): orthodox mitochondria with uniform, gray matrices, condensed mitochondria with compacted, dark matrices and swollen mitochondria with light, vacuolarized matrices. A similar approach was used by us and others previously (29–31). In all cases, the majority of mitochondria appeared to be in a condensed state (Fig. 3F), consistent with previously reported morphology of isolated brain mitochondria (29,30). It has to be mentioned that it is very well known that isolated mitochondria do not retain native morphology typical for the organelles inside of the cell. Nevertheless, isolated mitochondria retain biochemical functions such as respiration, membrane potential generation and ATP synthesis. This makes isolated mitochondria a valuable model to study the effects of different agents, in our case mHtt, under tightly controlled experimental conditions and easy access to the organelles. Thus, the purpose of Figure 3 is to illustrate the lack of overt morphological differences in synaptic and non-synaptic mitochondria isolated from WT and YAC128 mice. This, however, does not imply the lack of morphological differences in situ.
Figure 3.
Representative electron micrographs of non-synaptic (A, B) and synaptic (C, D) brain mitochondria isolated from YAC128 (A, C) and WT (B, D) mice. Prior to fixation with 2.5% glutaraldehyde, mitochondria were incubated for 10 min at 37°C in the standard incubation medium. In (E), representative images of orthodox, condensed and swollen mitochondria. In (F) morphometric analysis of isolated mitochondria: o, orthodox mitochondria; c, condensed mitochondria; s, swollen mitochondria. Data are expressed as a percentage of the total number of analyzed mitochondria. Mitochondria were analyzed in a blind manner as described previously (29,31). The total number of mitochondria analyzed from each type of animal and each type of mitochondria was 450–500.
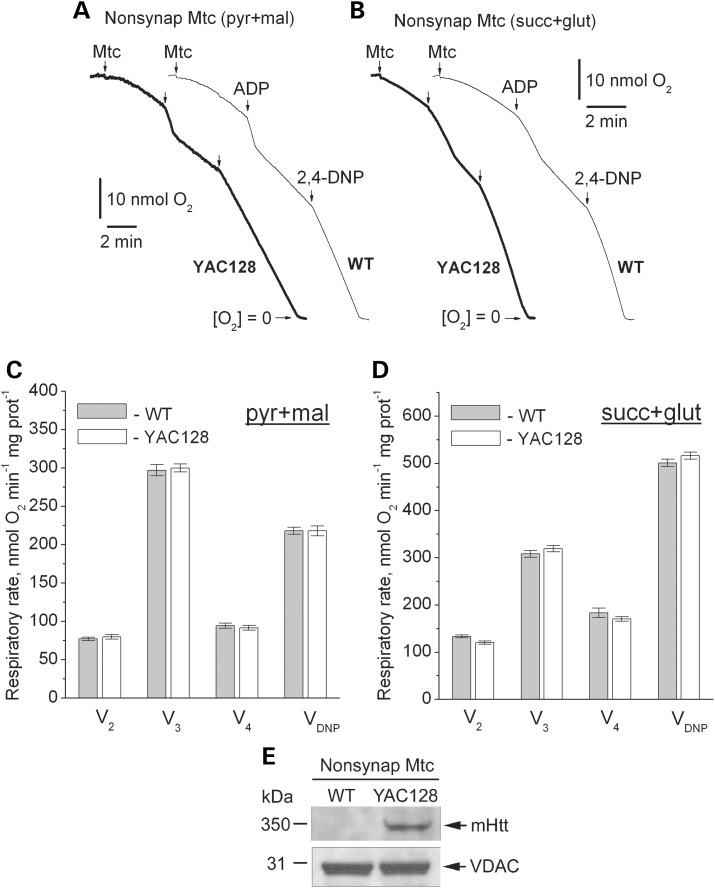
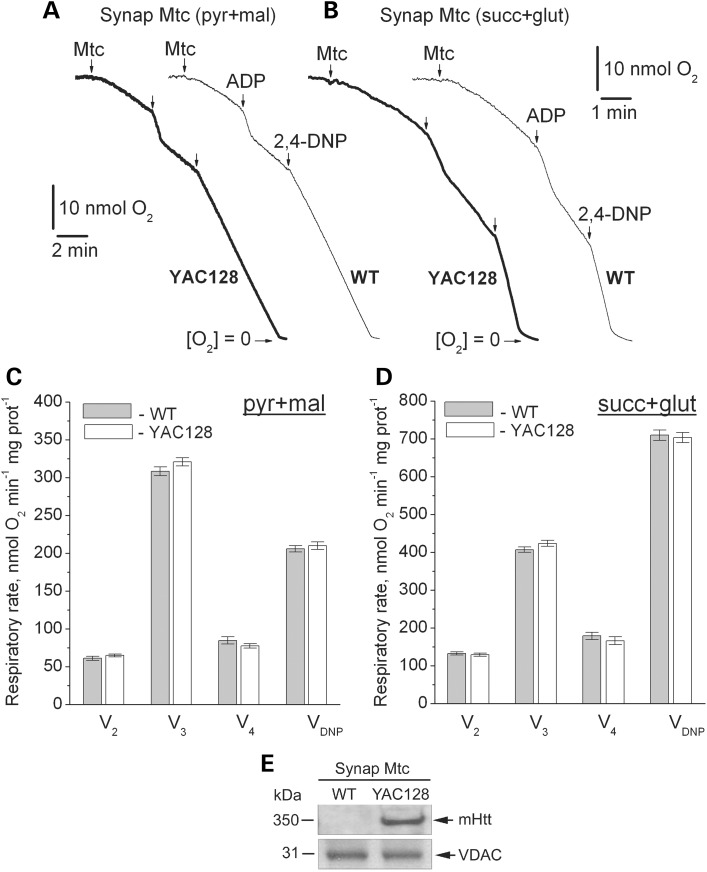
Next, we investigated the effect of mHtt expression on respiration of mitochondria isolated from brain (synaptic and non-synaptic), heart and liver of WT and YAC128 mice. Previously, it was hypothesized that bovine serum albumin (BSA), usually used to preserve mitochondrial integrity during isolation and purification (32), might interfere with mHtt binding to mitochondria and hence could eliminate a functional difference between mitochondria from HD transgenic mice and WT animals (33). To avoid the possible confounding effect of BSA, we omitted BSA from all isolation and incubation media. We measured mitochondrial respiratory activity with either a combination of Complex I substrates malate (1 mm) and pyruvate (3 mm), or with the Complex II substrate succinate (3 mm). In the latter case, incubation medium was supplemented with 3 mm glutamate to remove oxaloacetate, an endogenous inhibitor of succinate dehydrogenase (34), via a transaminase reaction (35). We assessed basal respiration with only substrates present in the incubation medium (V2), respiration stimulated by ADP (V3), respiration after exogenous ADP was consumed by mitochondria (V4) and maximal, uncoupled respiration in the presence of 2,4-dinitrophenol (2,4-DNP, VDNP). Purified brain non-synaptic and synaptic mitochondria isolated from 2- (Figs. 4 and 5) or 10-month-old YAC128 mice (Supplementary Material, Figs S1 and S2) had similar respiratory rates under all tested conditions compared with mitochondria isolated from age-matched WT animals. KCN (5 mm) completely inhibited respiration, indicating that mitochondria solely contributed to oxygen consumption (Supplementary Material, Fig. S3). Immunoblotting confirmed the presence of mHtt in mitochondria isolated from YAC128 mice (Figs. 4E and 5E). Unpurified brain (mixture of mitochondria and synaptosomes), liver and heart mitochondria isolated from YAC128 and WT mice also had similar respiratory rates (Supplementary Material, Figs S4–S6). These results suggest that mHtt does not affect respiration of mitochondria isolated from YAC128 mice.
Figure 4.
Respiratory activity of brain non-synaptic mitochondria isolated from 2-month-old WT (thin traces) and YAC128 (thick traces) mice. In (A and B) representative traces for mitochondrial O2 consumption. Where indicated, non-synaptic mitochondria (Mtc), 200 μm ADP and 60 μm 2,4-dinitophenol (2,4-DNP) were added. In (A), incubation medium was supplemented with 3 mm pyruvate (pyr) and 1 mm malate (mal). In (B), incubation medium was with 3 mm succinate (succ) and 3 mm glutamate (glut). In (C and D) statistical analysis of respiratory rates. Data are mean ± SEM, N = 10. In (E) western blot, indicating the presence of mHtt in non-synaptic mitochondria from YAC128 mice. VDAC was used as a loading control.
Figure 5.
Respiratory activity of brain synaptic mitochondria isolated from 2-month-old WT (thin traces) and YAC128 (thick traces) mice. (A and B) representative traces for mitochondrial O2 consumption. Where indicated, synaptic mitochondria (Mtc), 200 μm ADP and 60 μm 2,4-dinitophenol (2,4-DNP) were added. In (A), incubation medium was supplemented with 3 mm pyruvate (pyr) and 1 mm malate (mal). In (B), incubation medium was supplemented with 3 mm succinate (succ) and 3 mm glutamate (glut). In (C and D), statistical analysis of respiratory rates. Data are mean ± SEM, N = 10. (E) Western blot, showing the presence of mHtt in synaptic mitochondria from YAC128 mice. VDAC was used as a loading control.
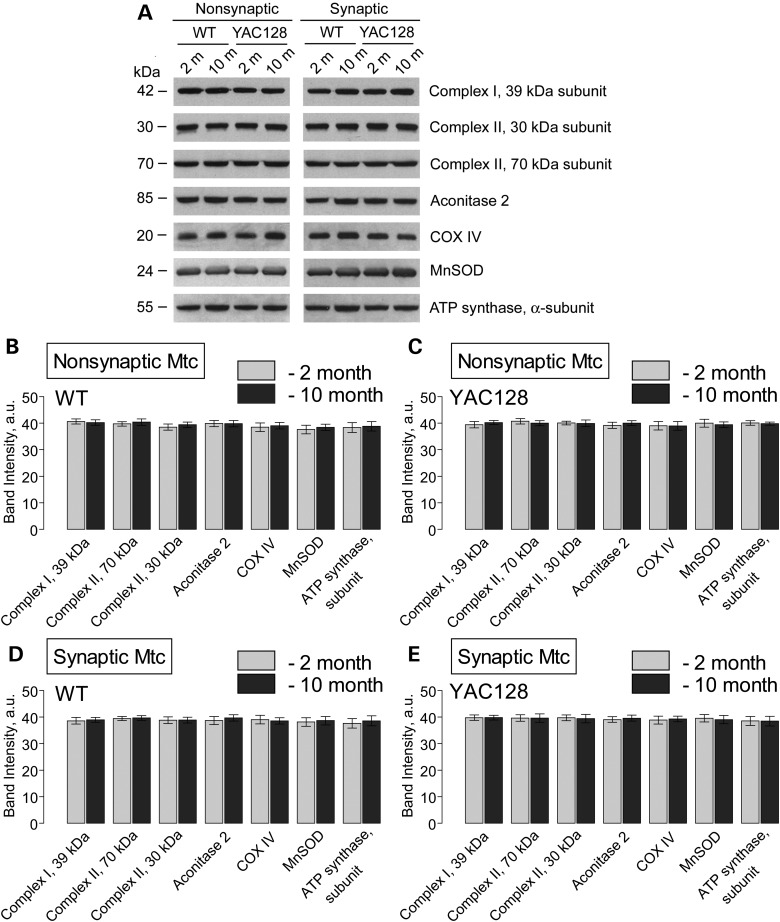
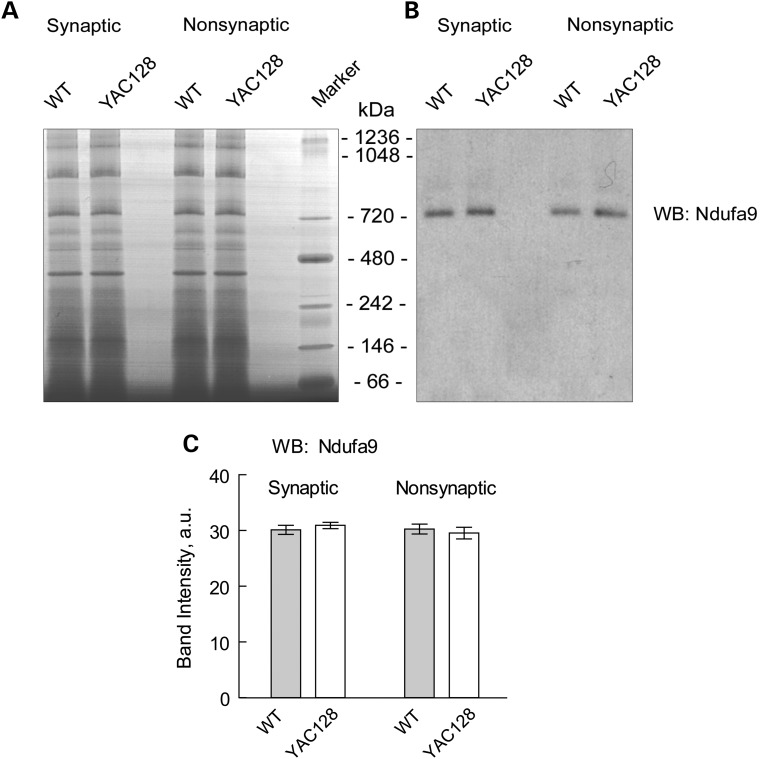
Consistent with our data, in a recent study, Yano et al. (36) did not find a difference in respiration of synaptic and non-synaptic mitochondria from R6/2 mice compared with mitochondria from WT animals. However, the authors presented evidence for mHtt-induced inhibition of protein import into mitochondria, and suggested that such an inhibition might affect mitochondrial functions later in the disease progression (36). According to the authors, this inhibition of mitochondrial protein import should result in a decreased amount of nuclear encoded mitochondrial proteins. However, the authors did not provide immunoblotting data supporting this hypothesis (36). In an earlier study, Orr et al. (37) demonstrated that expression of nuclear encoded Mn-dependent superoxide dismutase (MnSOD) as well as 30 and 70 kDa subunits of succinate dehydrogenase (Complex II) is similar in brain mitochondria isolated from 3- and 10-month-old heterozygous knock-in 150Q/7Q mice as well as in 3-month-old wild-type 7Q/7Q mice. Milakovic and Johnson (21) also failed to find a difference in expression of 30 and 70 kDa subunits of Complex II in mutant STHdhQ111/Q111 striatal cells compared with wild-type STHdhQ7/Q7 cells. We analyzed expression of several nuclear-encoded mitochondrial proteins, including 39 kDa subunit of Complex I, 30 and 70 kDa subunits of Complex II, aconitase 2, subunit IV of cytochrome oxidase (COX IV), MnSOD and α-subunit of ATP synthase in brain mitochondria isolated from 2- and 10-month-old YAC128 and WT mice. In these immunoblotting experiments, we did not find any evidence for decreased expression of the analyzed proteins in mitochondria of YAC128 compared with mitochondria from WT mice regardless of their age (Fig. 6). In addition, we performed Blue Native–PAGE followed by western blotting analysis of expression of Ndufa9, a nuclear-encoded subunit of Complex I (Fig. 7). Using this approach, we confirmed the lack of difference in expression of the Complex I subunit in mitochondria isolated from YAC128 and WT mice. These findings argue against mHtt-induced inhibition of the mitochondrial protein import and its potential role in inhibition in mitochondrial respiration.
Figure 6.
Expression of nuclear encoded mitochondrial proteins in non-synaptic and synaptic mitochondria isolated from 2- and 10-month-old WT and YAC128 mice. (A) Representative western blots generated with antibodies against nuclear encoded mitochondrial proteins including 39 kDa subunit of Complex I, 30 and 70 kDa subunits of Complex II, aconitase 2, subunit IV of cytochrome oxidase (COX IV), MnSOD and α-subunit of ATP synthase. (B–E) The results of densitometry performed with NIH ImageJ 1.48v software. Data are mean ± SEM, N = 7.
Figure 7.
Blue Native gel electrophoresis and western blotting with brain mitochondria lysates. Lysates were prepared with brain synaptic and non-synaptic mitochondria from 10-month-old WT and YAC128 mice as described in Materials and Methods. (A) A representative Blue Native gel. (B) Western blotting with anti-Ndufa9 antibody. Molecular weight of Ndufa9 is 39 kDa. However, after Blue Native–PAGE Ndufa9 is detected in the Complex I with molecular weight above 720 kDa (38). (C) The results of densitometry performed with NIH ImageJ 1.48v software. Data are mean ± SEM, N = 6.
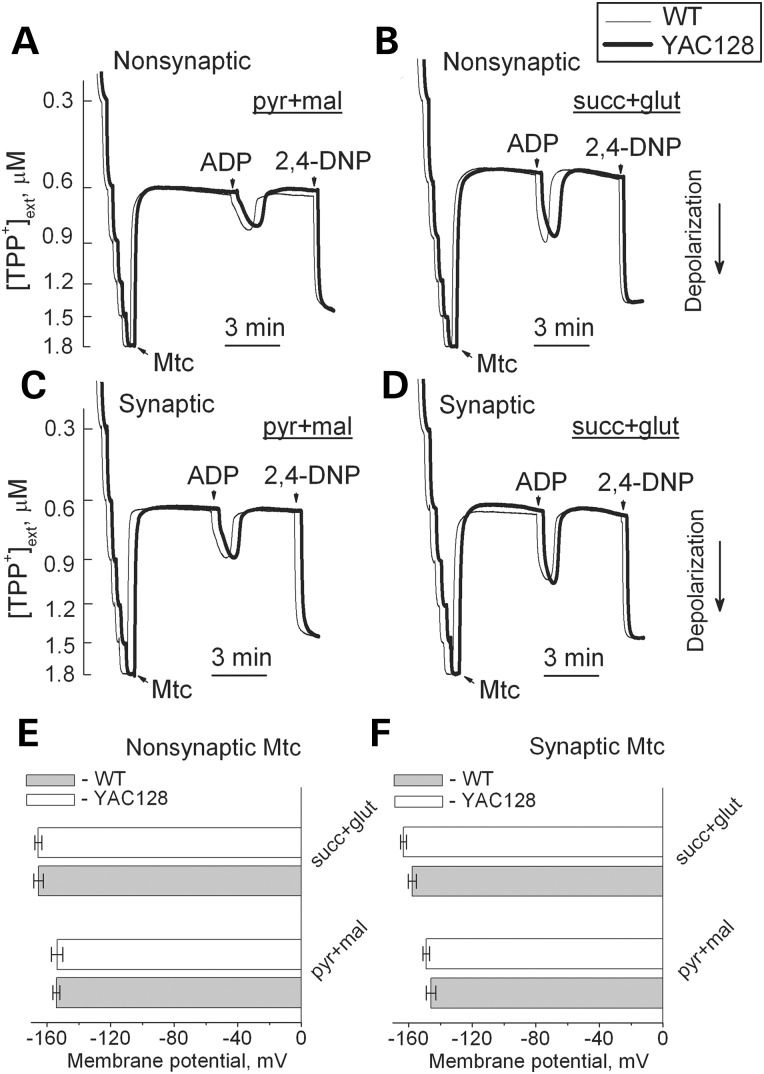
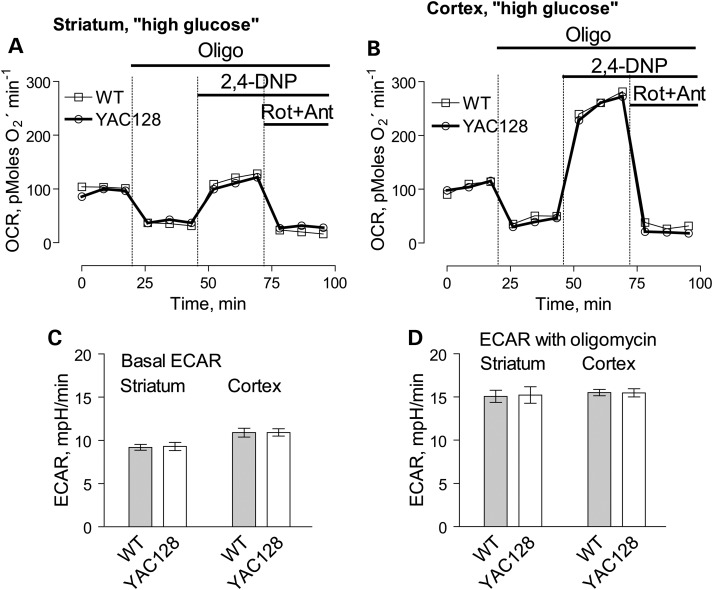
In addition to respiration, we also evaluated mitochondrial membrane potential (Δψ) in brain non-synaptic and synaptic mitochondria by measuring distribution of the lipophilic cation tetraphenylphosphonium (TPP+) across the inner mitochondrial membrane (39,40). The basal mitochondrial membrane potential and responses to ADP were identical in mitochondria from YAC128 and WT mice (Fig. 8). BSA increased membrane potential to the same extent in both YAC128 and WT mitochondria (Supplementary Material, Fig. S7) most likely due to binding and removal of free fatty acids (41) thus decreasing free fatty acid-mediated proton permeability of the inner mitochondrial membrane and leading to more polarized mitochondria (42). Mitochondrial membrane potential appeared to be similar in both non-synaptic and synaptic mitochondria from YAC128 and WT mice, indicating the lack of dysfunction in mitochondria with mHtt. To further examine a possible effect of mHtt on oxidative metabolism, we evaluated the respiratory activity of striatal and cortical neurons at 9 days in vitro (DIV) derived from YAC128 and WT mice (Fig. 9). To measure cell respiration, we used Seahorse XF24 flux analyzer. Cellular respiration was evaluated by measuring oxygen consumption rate (OCR). Simultaneously with respiration, we measured glycolytic activity by following the extracellular acidification rate (ECAR). However, the conditions and experimental design for ECAR measurements were not optimized and, therefore, the ECAR data should be considered as preliminary. Nevertheless, we believe that even preliminary ECAR data may provide valuable information. To accentuate mitochondrial respiration, in addition to 10 mm glucose, the bath solution was supplemented with 15 mm pyruvate (22). We measured basal respiratory activity, oligomycin-sensitive respiration coupled to ATP synthesis, and maximal, uncoupled respiration in the presence of 2,4-dinitophenol (2,4-DNP). At the end of the experiment, cells were treated with a combination of rotenone and antimycin A (both in 1 µm), to assess non-mitochondrial respiration. The experiments with striatal and cortical neurons revealed no difference in respiratory rates between cells from YAC128 and WT mice (Fig. 9A and B). Interestingly, maximal respiratory activity of striatal neurons was considerably lower than maximal, uncoupled respiration of cortical neurons (Fig. 9A and B). It is possible that this contributes to increased vulnerability of striatal neurons in HD.
Figure 8.
Mitochondrial membrane potential in non-synaptic (A, B) and synaptic (C, D) mitochondria isolated from 2-month-old WT (thin traces) and YAC128 (thick traces) mice. In (A–D), representative traces for TPP+ accumulation indicating changes in mitochondrial membrane potential (Δψ) in response to 200 μm ADP and 60 µm 2,4-dinitrophenol. In (A and C), incubation medium was supplemented with 3 mm pyruvate (pyr) and 1 mm malate (mal). In (B and D), incubation medium was supplemented with 3 mm succinate (succ) and 3 mm glutamate (glut). In (E and F), statistical analysis of mitochondrial membrane potential measured 2 min prior to ADP addition. Data are mean ± SEM, N = 7.
Figure 9.
OCR and ECAR of cultured neurons from YAC128 and WT mice: ‘high glucose conditions’. In these experiments, we used striatal and cortical neurons derived from postnatal Day 1 YAC128 and WT mice. The cells were grown for 9 days in vitro (9 DIV) before measurements. The bath solution contained 10 mm glucose and 15 mm pyruvate to accentuate mitochondrial respiration (22). Where indicated, cells were treated with 1 µm oligomycin (Oligo), 60 µm 2,4-dinitrophenol (2,4-DNP), 1 µm rotenone (Rot) and 1 µm antimycin A (Ant). In (A and B), OCR of striatal and cortical neurons, respectively. In (C and D), ECAR of striatal and cortical neurons. The OCR and ECAR were measured with Seahorse XF24 flux analyzer (Seahorse Bioscience, Billerica, MA, USA) at 37°C with 105 cells per well. Data are mean ± SEM, N = 7.
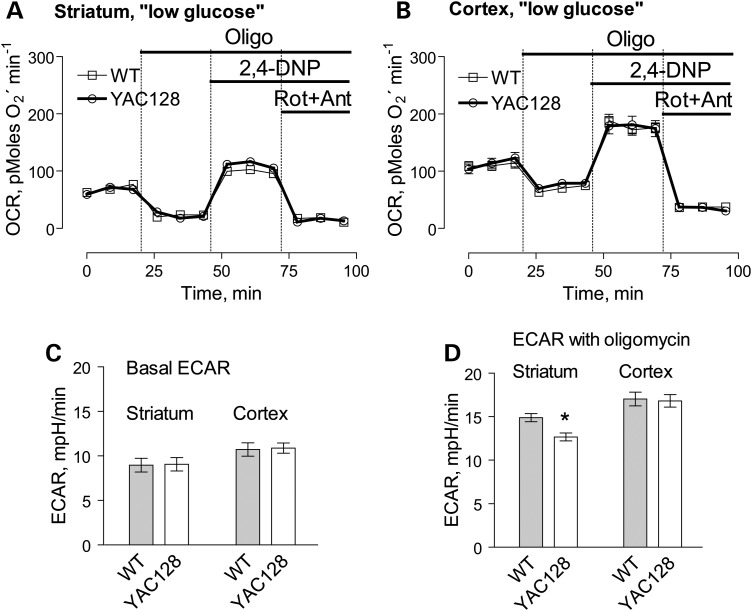
Oligomycin inhibits oxidative phosphorylation and stimulates glycolysis that is manifested in increased ECAR (43,44). However, because 2,4-DNP increases proton permeability of membranes and increases proton extrusion from the cell, ECAR cannot be used as an indicator of glycolytic activity in the presence of protonophore (23). Therefore, similarly to Gouarne et al. (23), we did not analyze ECAR data obtained after 2,4-DNP injection. Consequently, Figures 9C and D and 10C and D show bar graphs that illustrate basal and oligomycin-stimulated ECARs in cultured striatal and cortical neurons from YAC128 and WT mice.
Figure 10.
OCR and ECAR of cultured neurons from YAC128 and WT mice: ‘low glucose conditions’. In these experiments, we used striatal and cortical neurons derived from postnatal Day 1 YAC128 and WT mice. The cells were grown for 9 days in vitro (9 DIV) before measurements. The bath solution contained 2.5 mm glucose. Where indicated, cells were treated with 1 µm oligomycin (Oligo), 60 µm 2,4-dinitrophenol (2,4-DNP), 1 µm rotenone (Rot) and 1 µm antimycin A (Ant). In (A and B), OCR of striatal and cortical neurons, respectively. In (C and D), ECAR of striatal and cortical neurons. The OCR and ECAR were measured with Seahorse XF24 flux analyzer (Seahorse Bioscience, Billerica, MA, USA) at 37°C with 105 cells per well. Data are mean ± SEM, N = 7.
In our experiments, basal as well as oligomycin-stimulated ECARs were similar in neurons from YAC128 and WT mice, suggesting similar glycolytic activities in YAC128 and WT cells incubated in ‘high glucose medium’ (Fig. 9C and D). Recently, Gouarne et al. (23) reported that neurons from BACHD rats have lower maximal respiratory rates compared to cells from WT animals, but only if neurons were incubated in the ‘low glucose medium’ (2.5 mm glucose, no pyruvate). We therefore examined respiratory activities of striatal and cortical neurons from YAC128 and WT mice in the ‘low glucose medium’ and did not find a significant difference (Fig. 10A and B). However, following oligomycin application, striatal neurons from YAC128 mice demonstrated slightly, but statistically significant decrease in oligomycin-stimulated ECAR compared with cells from WT animals, suggesting some decline in glycolytic activity under these conditions (Fig. 10C and D). This is consistent with previously reported data (23). Thus, measurements of respiratory and glycolytic activities with primary striatal and cortical neurons from YAC128 and WT mice revealed the lack of respiratory deficits in cells expressing mHtt and only a marginal decrease in oligomycin-stimulated glycolytic rate when cells were incubated in the ‘low glucose medium’.
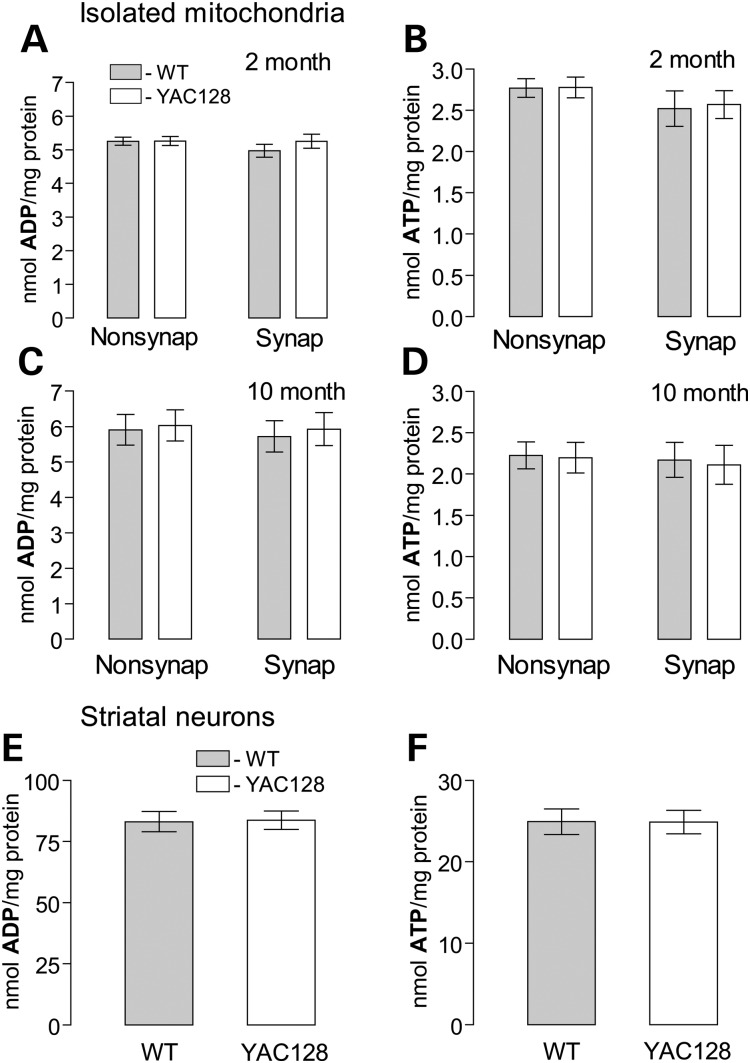
Consistent with the lack of respiratory defects, we did not find a difference in ATP and ADP levels in isolated nonsynaptic and synaptic brain mitochondria isolated from 2- and 10-month-old animals or in primary striatal neurons (10 DIV) from YAC128 and WT mice (Fig. 11). These results support the lack of bioenergetic deficiency in brain mitochondria and cultured neurons from YAC128 mice.
Figure 11.
ADP and ATP content in brain mitochondria (A–D) and cultured striatal neurons (E and F) derived from YAC128 and WT mice. Synaptic and non-synaptic mitochondria were isolated from 2- (A and B) or 10-month-old (C and D) mice. Mitochondria (50 µg protein) were incubated for 10 min at 37°C in the standard incubation medium supplemented with 3 mm succinate and 3 mm glutamate. In (E and F), cultured striatal neurons (10 DIV) were lysed on ice with Releasing Reagent (Sigma). Then, ADP (A, C, E) and ATP (B, D, F) were measured with ATP bioluminescent somatic cell assay kit (Sigma) using Glomax 20/20 luminometer (Promega) as described in Materials and Methods. In (A–D), data are mean ± SEM, N = 7. In (E and F), data are mean ± SEM, N = 10–11 dishes from five platings.
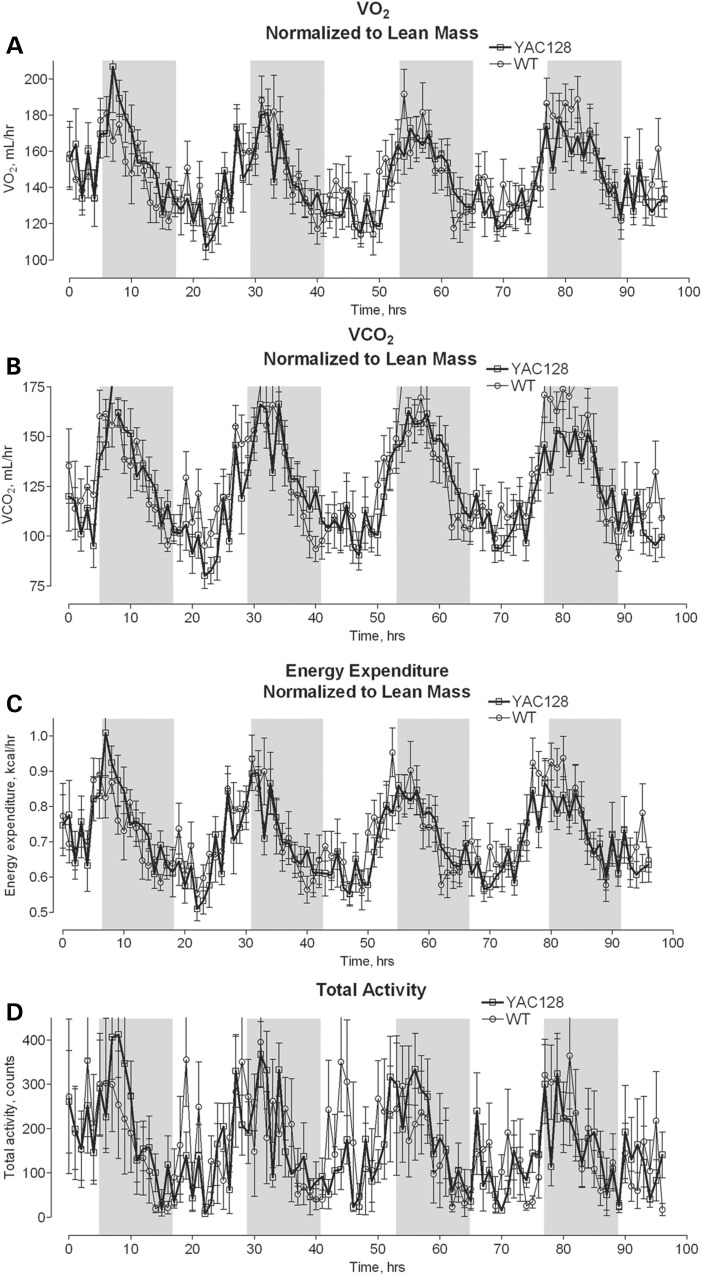
Although we did not find any difference in respiration of isolated mitochondria or cultured neurons from YAC128 and WT mice, these results could not exclude an effect of mHtt on mitochondrial respiration in vivo. Considering this, we tested oxidative metabolism of YAC128 and WT mice in vivo. In these experiments, we chose to use 10-month-old animals, an age that HD mice have previously been found to show evidence of neurodegeneration (striatal atrophy) (24). Mice were kept in metabolic cages (Animal Monitoring System, Lab Master, TSE Systems, Midland, MI, USA) for 72 h for acclimation and then for the following 96 h, animal OCR, CO2 release rate and motor activity were monitored. Because adipose tissue does not significantly contribute to overall O2 consumption, the lean body mass was determined for each mouse by dual-energy X-ray absorptiometry (DEXA) scanning and the OCRs and CO2 release rates were normalized to animal lean body mass (45). Our experiments revealed that YAC128 mice and WT littermates have similar motor activity and comparable in vivo OCRs and CO2 release rates (Fig. 12). The respiratory exchange ratio (RER, CO2 produced/O2 consumed), which is indicative of the preferential fuel source for energy metabolism—carbohydrate or lipid—, was also similar in YAC128 compared with WT mice (data not shown). This finding suggests a lack of significant changes in energy metabolism in YAC128 mice. Additionally, we measured food consumption and fasted blood glucose in YAC128 and WT mice and found no difference in these parameters. However, YAC128 mice were heavier compared with age-matched WT mice and had larger percentage of body fat (Table 1). Thus, whole animal respirometry with YAC128 and WT mice confirmed the lack of respiratory deficiency and supported the conclusion that respiratory activity in YAC128 mice is not affected by mHtt.
Figure 12.
Oxygen consumption (A), CO2 release (B), energy expenditure (C) and total physical activity (D) of 10-month-old YAC128 and WT mice. The animals were analyzed by indirect calorimetry in metabolic cages. Oxygen consumption, CO2 release and energy expenditure were normalized to lean mouse body mass determined by DEXA scanning. The shaded areas correspond to the 12-h dark cycles. Data are mean ± SEM, N = 8.
Table 1.
Weight, food consumption, fasted blood glucose, fat and lean mass of 10-month-old YAC128 and WT mice
| WT | YAC128 (P-value) | |
|---|---|---|
| Number of mice | 8 | 8 |
| Weight, g | 33.1 ± 1.2 | 39.6 ± 1.3 (0.003) |
| Food consumption, g/24 h | 5.64 ± 0.88 | 5.12 ± 0.56 (0.13) |
| Fasted blood glucose, mg/dl | 66.3 ± 14.6 | 70.3 ± 17.7 (0.63) |
| Fat mass, % | 18.9 ± 1.3 | 22.9 ± 1.4 (0.048) |
| Lean mass, % | 81.1 ± 1.3 | 77.1 ± 1.4 (0.048) |
Data were analyzed using two-tailed unpaired t-test.
Discussion
In the present study, we, for the first time, evaluated the effect of mHtt on oxidative metabolism using a combination of three different experimental models: isolated mitochondria, neurons in culture and whole YAC128 and WT animals. All three models produced consistent results strongly arguing against a noteworthy deleterious effect of mHtt on mitochondrial oxidative metabolism and neuronal glycolysis in YAC128 mice. The lack of respiratory defects suggests that mHtt does not impair mitochondrial oxidative metabolism in YAC128 mice. Consequently, mitochondrial respiratory deficiency most likely does not contribute to HD pathology in YAC128 mice, and if it occurs later in disease progression, it most likely represents a consequence of HD pathology rather than its cause.
In our study, we took extra effort to confirm that mHtt is present in cultured neurons from YAC128 mice and that mHtt is associated with mitochondria isolated from transgenic animals. We invariably performed genotyping with every animal and immunoblotting with every sample of isolated mitochondria and cultured neurons to confirm the presence of mHtt in biological materials from YAC128 mice. Consistent with previously reported data (24,27), in western blotting experiments performed with brain homogenates and cytosolic fractions from YAC128 mice, we found that human mHtt was expressed at the same level as wild-type mouse Htt. Using mAb 2166, which recognizes both wild-type Htt and mHtt, we detected wild-type Htt associated mitochondria from both WT and YAC128 mice (Fig. 2B). With mAb 2166, we also detected mHtt associated with mitochondria from YAC128 mice. Surprisingly, the amount of mHtt associated with mitochondria was four times lower than the amount of mitochondria-bound wild-type Htt. Keeping in mind that similar amounts of mHtt could be easily detected with mAb 2166 in homogenates and cytosolic fractions from YAC128 mice, this suggests that mHtt has lower affinity for mitochondria compared with wild-type Htt. This also suggests that a considerable amount of wild-type Htt is associated with mitochondria and, presumably, wild-type Htt plays some role in regulation of mitochondrial functions. Indeed, a recent study with mouse embryonic stem cells (mESC) revealed that the lack of wild-type Htt in htt−/− mESCs results in extensive metabolic aberrations (44). On the other hand, mESCs expressing mHtt with an expanded poly-Q stretch (Htt-Q140/Q7 mESCs) were bioenergetically indistinguishable from mESCs expressing wild-type Htt (Htt-Q7/Q7 mESCs) (44), which is, again, consistent with our results. This study (44), as well as our finding regarding the association of wild-type Htt with brain mitochondria, supports a potential role of wild-type Htt in regulation of mitochondrial functions. However, many questions concerning the relationship between wild-type Htt and mitochondria remain to be answered. Is wild-type Htt located on the outer side of the outer mitochondrial membrane, in the intermembrane space or in the mitochondrial matrix? Is it inserted into the outer membrane or only peripherally attached to the membrane like mHtt? How does wild-type Htt affect mitochondrial respiration, Ca2+ uptake and PTP induction? Does mHtt interfere with wild-type Htt-mediated regulation of mitochondrial functions? These and many other questions need to be answered to gain insight into the role of wild-type Htt in the regulation of mitochondrial functions and to better understand possible deleterious effect of mHtt on mitochondria or reasons for the lack of such an effect.
In our experiments, we chose to use both early symptomatic, 2-month-old YAC128 mice as well as 10-month-old YAC128 mice at a more advanced HD stage, expecting to see overt alterations in mitochondrial functions. The 2-month-old YAC128 mice used in our experiments already demonstrated clasping, a clear sign of HD-associated behavioral abnormalities reported previously with other mouse models of HD (25,26). This observation assured us that if mitochondrial respiratory dysfunction plays a role in neuronal alterations leading to behavioral abnormalities, then at this stage of HD progression, we should be able to detect this change in mitochondrial respiratory activity. This would allow for the further investigation of the mechanism of respiratory deficiency induced by mHtt. Even more so, we expected to see mitochondrial dysfunction with 10-month-old YAC128 mice. However, despite all our efforts, we found no difference in respiratory activity of isolated mitochondria and cultured neurons, from YAC128 and WT mice. Moreover, we did not find differences in mitochondrial membrane potential or in ADP and ATP levels in isolated mitochondria and cultured striatal neurons from YAC128 and WT mice. Finally, oxygen consumption rates of YAC128 and WT mice were similar. These results strongly argue against mitochondrial bioenergetic deficit as a cause of neuronal malfunction and behavioral abnormalities in YAC128 mice.
In the present study, we found a minute but statistically significant decline in oligomycin-stimulated ECAR in striatal neurons from YAC128 mice incubated with 2.5 mm glucose. This suggested a decreased glycolytic activity in striatal neurons from YAC128 mice. However, interpretation of ECAR in the presence a protonophore 2,4-DNP appears to be problematic. Since 2,4-DNP increases proton permeability of lipid membranes and enhances proton extrusion from the cell, ECAR cannot be used for evaluation of glycolytic activity in the presence of the protonophore (23). Thus, similar to Gouarne et al. (23), we did not analyze ECAR data produced in the presence of 2,4-DNP. Previously, oligomycin-stimulated extracellular acidification was interpreted as an indicator of glycolysis activation under conditions of inhibition of oxidative phosphorylation (43,44). However, under these conditions, cellular respiration is significantly suppressed and, consequently, we cannot correlate respiratory rate and glycolytic activity based on the data obtained in the presence of oligomycin.
Since the discovery of a link between the mutation in huntingtin and HD pathogenesis (3), numerous hypotheses concerning the mechanism of detrimental mHtt action have been put forward and numerous studies have been performed to untangle these mechanisms. The studies regarding possible defects in oxidative metabolism can be divided into two groups: one of which generated experimental data indicating impairment of mitochondrial functions either in animal or cell models of HD (13–18,46,47), whereas the other group produced data arguing against defects in oxidative metabolism (19–23,36,48–50). The reasons for these contradictory data are not clear, but it might be related to methodological differences and the use of different experimental models of HD. Interestingly, recent studies with HD patients revealed that oxidative metabolism remains properly operating despite expression of mHtt (51–53). These observations support the point of view that mHtt does not directly and severely affect mitochondrial functions. This is also in line with the lack of alterations in oxidative metabolism in YAC128 mice examined in the present study.
The lack of alterations in oxidative metabolism in YAC128 mice suggests that mHtt in these mice does not directly and acutely affect mitochondria. Therefore, mHtt neurotoxicity most likely is mediated by mechanisms unrelated to mitochondria, such as oxidative stress associated with elevated NAD(P)H oxidase activity (54) and/or alterations in cholesterol metabolism (55). Therefore, mitochondrial bioenergetic impairment, if it can be detected, most likely lies downstream of mHtt-induced alterations in other neuronal functions. However, it is also possible that in other cell or animal HD models, full-length or truncated mHtt with different levels of expression and different Htt/mHtt ratio does influence mitochondrial functions. Consequently, further investigations with alternative HD models and cell lines derived from HD patients are necessary to demonstrate and clarify possible deleterious effects of mHtt on oxidative metabolism.
Materials and Methods
Materials
Pyruvate, malate, succinate, glutamate, EGTA, ADP, oligomycin, rotenone, antimycin A and 2,4-dinitrophenol were purchased from Sigma (St Louis, MO, USA). Tetraphenylphosphonium chloride was from Fluka (Buchs, Switzerland). BSA, free from free fatty acids, was from MP Biomedicals (Irvine, CA, USA).
Animals
All procedures with animals were performed in accordance with the Institutional Animal Care and Use Committee approved protocol. Transgenic YAC128 and wild-type FVB/NJ mice were purchased from Jackson Laboratories (Bar Harbor, ME, USA) and breeding colonies were established in Laboratory Animal Resource Center at Indiana University School of Medicine, Indianapolis, IN, USA. Male YAC128 mice were bred with female FVB/NJ mice (background strain). The mice were housed under standard conditions with free access to water and food. For our experiments, we used early symptomatic 2-month-old YAC128 mice and their wild-type (WT) littermates (background: FVB/NJ) as well as 10-month-old YAC128 and age-matched WT littermates. In our study, mice of both sexes were used. To evaluate the expression of nuclear encoded mitochondrial proteins, we used 2- and 10-month-old YAC128 mice and their age-matched WT littermates. YAC128 mice express full-length human mHtt containing 128 glutamines in polyglutamine stretch in addition to wild-type mouse Htt (24).
Genotyping
All offspring were genotyped using a PCR assay on tail DNA. Briefly, PCR of tail DNA was carried out following the protocol provided by Jackson Laboratory with oligonucleotide primers oIMR6533 (GGCTGAGGAAGCTGAGGAG) and TmoIMR1594 (CCGCTCAGGTTCTGCTTTTA) obtained from Invitrogen. The PCR reaction mixture consisted of 1 µl DNA template and 23 µl Platinum PCR SuperMix (Invitrogen) supplemented with 0.39 µm of each primer (Invitrogen), total volume 25 µl. Cycling conditions were 5 min at 95°C, 35 cycles at 30 s at 95°C, 30 s at 56°C, 60 s at 72°C, 10 min at 72°C. Reaction products were analyzed on 1.2% agarose gel run at 100 V for 60 min with Tris–acetate–EDTA running buffer containing 1X GelRedTM Nucleic Acid Gel Stain (Biotium, CA, USA).
Isolation of brain, liver and heart mitochondria
Percoll gradient-purified brain non-synaptic and synaptic mitochondria as well as unpurified brain, liver and heart mitochondria from 2- and 10-month-old YAC128 and age-matched WT mice were isolated as we described previously (40,56). Earlier, it was hypothesized that BSA can displace mHtt from its binding sites on mitochondria (33). Therefore, BSA was omitted from all solutions used in our experiments with isolated mitochondria unless stated otherwise. Liver and heart mitochondria were isolated as we described earlier (56), but without Percoll gradient purification.
Mitochondrial respiration and membrane potential
Mitochondrial respiration was measured under continuous stirring in 0.4 ml thermostated chamber at 37°C in the standard incubation medium containing 125 mm KCl, 0.5 mm MgCl2, 3 mm KH2PO4, 10 mm Hepes, pH 7.4, 10 µm EGTA supplemented either with 3 mm pyruvate plus 1 mm malate or 3 mm succinate plus 3 mm glutamate. The chamber was equipped with a Clark-type oxygen electrode and a tightly closed lid. The slope of the oxygen electrode trace corresponded to the respiratory rate. Mitochondrial membrane potential was measured at 37°C with a tetraphenylphosphonium (TPP+) electrode by following TPP+ distribution between the incubation medium and mitochondria (39). A decrease in external TPP+ concentration corresponds to mitochondrial polarization, while an increase in TPP+ in the incubation medium corresponds to depolarization.
Transmission electron microscopy
Electron microscopy of isolated mitochondria was performed as described earlier (30). Briefly, prior to fixation, mitochondria were incubated for 10 min at 37°C in the standard incubation medium. Then, mitochondria were fixed in 2.5% glutaraldehyde in the same incubation medium at room temperature for 15 min. Electron micrographs were taken using a Tecnai G12 BioTwin electron microscope (FEI, Hillsboro, OR, USA) equipped with an AMT 2.6 × 2.6 K digital CCD camera. Mitochondrial morphology was analyzed in a blind manner as described previously (29–31). Briefly, mitochondrial population was categorized into three classes: (i) condensed mitochondria with dark, shrunk matrices and distinct vacuolization, (ii) swollen mitochondria with light, expanded matrices and (iii) orthodox mitochondria with evenly spread grey matrices. Mitochondria were counted and morphological distribution was statistically analyzed using one-way analysis of variance followed by Bonferroni's post hoc test (GraphPad Prism® 4.0, GraphPad Software Inc., SanDiego, CA, USA).
ATP and ADP content
ADP and ATP were determined using a luciferin/luciferase-based ATP bioluminescent somatic cell assay kit (Sigma) and a GloMax 20/20 luminometer (Promega). Mitochondria were incubated for 10 min at 37°C in the standard incubation medium supplemented with 3 mm succinate plus 3 mm glutamate and then ADP and ATP were measured. Cultured striatal neurons (10 DIV) were lysed on ice with the Releasing Reagent (Sigma) according to manufacturer's instructions. In all cases, ATP was measured in 4% perchloric acid extracts neutralized by KOH following kit manufacturer's suggestions. ADP was converted to ATP using pyruvate kinase in the presence of phosphoenolpyruvate (57).
Immunoblotting
Brain homogenates, cytosolic fractions and isolated mitochondria pretreated with Protease Inhibitor Cocktail (Roche) were solubilized by incubation in NuPAGE LDS sample buffer (Invitrogen, Carlsbad, CA, USA) supplemented with a reducing agent at 70°C for 15 min. Bis–Tris Mops gels (12%, Invitrogen) and Tris–Acetate gels (3–8%, Invitrogen) were used for electrophoresis (20 µg protein per lane). After electrophoresis, proteins were transferred to Hybond-ECL nitrocellulose membrane (Amersham Biosciences). Blots were incubated for 1 h at room temperature in blocking solution of 5% dry milk, phosphate-buffered saline, pH 7.2 and 0.15% Triton X-100. Then, blots were incubated with one of the following primary antibodies: mouse monoclonal anti-Htt 2166 (mAb 2166, Millipore, 1:1000), mouse monoclonal anti-polyQ 1C2 (mAb 1574, Millipore, 1:1000), mouse monoclonal anti-α-tubulin (Sigma, St. Louis, MO, 1:20000), mouse monoclonal anti-COX IV (Invitrogen, Carlsbad, CA, 1:1000), mouse monoclonal anti-Complex I 39 kDa subunit (Invitrogen, 1:1000), mouse monoclonal anti-Complex II 30 kDa subunit (Invitrogen, 1:1000), mouse monoclonal anti-Complex II 70 kDa subunit (Invitrogen, 1:1000), mouse monoclonal anti-aconitase 2 (Abcam, 1:1000), rabbit polyclonal anti-manganese superoxide dismutase (MnSOD, Millipore, 1:2000), mouse monoclonal anti-ATP synthase α subunit (Abcam, 1:1000). Blots were incubated with goat anti-mouse or goat anti-rabbit IgG (1:20000) coupled with horseradish peroxidase (Jackson ImmunoResearch Laboratories, West Grove, PA, USA) and developed with Supersignal West Pico chemiluminescent reagents (Pierce, Rockford, IL, USA). Molecular mass markers See Blue Plus 2 Standards (5 µl) and HiMark Pre-stained High Molecular Weight Protein Standards (10 µl) (Invitrogen) were used to determine molecular masses of the bands. NIH ImageJ 1.48v software (http://rsb.info.nih.gov//ij) was used to quantify band densities
Blue Native–PAGE and western blotting
Synaptic and non-synaptic mitochondria from WT and YAC128 mice were solubilized in a sample buffer (Invitrogen) with 1% digitonin and Proteinase Inhibitor Cocktail (Roche) for 15 min on ice and then centrifuged at 100 000g for 30 min. Mitochondrial proteins (15 µg) were separated on NativePAGE™ 3–12% Bis–Tris gel. Following electrophoresis, protein bands were stained with SimplyBlue™ SafeStain. NativeMark™ was used as molecular weight marker. All reagents were from Invitrogen. For western blotting, the proteins were transferred on Immobilon™-FL PVDF membrane (EMD Millipore) and mitochondrial Complex I subunit Ndufa9 was detected using monoclonal antibodies against Ndufa9 (mAb 14713, Abcam, MA, USA).
Cell culturing
Primary cultures of striatal and cortical neurons were prepared from individual postnatal Day 1 mouse pups as previously described (58), but without pooling cells from different animals together. For respirometry experiments, neurons were plated on Seahorse plates without preplated glia as previously described for calcium imaging experiments (58). For all platings, 35 mg·ml−1 uridine plus 15 mg·ml−1 5-fluoro-2′-deoxyuridine were added 24 h after plating to inhibit proliferation of non-neuronal cells. Neuronal cultures were maintained in a 5% CO2 atmosphere at 37°C in Neurobasal medium with B27 supplement (Life Technologies).
Cell respirometry
OCRs of cultured striatal and cortical neurons (9 DIV) were measured using Seahorse XF24 flux analyzer (Seahorse Bioscience, Billerica, MA, USA) following the manufacturer's instructions. Neuronal cultures were grown in the assay plates at 105 cells per well. Before measuring, the growth medium was replaced by the standard bath solution supplemented with 10 mm glucose and 15 mm pyruvate or 2.5 mm glucose alone as indicated. The standard bath solution contained 139 mm NaCl, 3 mm KCl, 0.8 mm MgCl2, 1.8 mm CaCl2, 10 mm HEPES, pH 7.4. In experiments, in which 2.5 mm glucose was used, sucrose was supplemented to maintain osmolarity similar to that in the growth medium (300 mosm). At the end of experiments, cell density and survival rate were analyzed after loading cells with 2 µg/ml calcein-AM as described previously (23). In our study, we analyzed only Seahorse data from wells with similar cell density and survival rates.
Calorimetric analysis
Calorimetric analysis was performed as described previously (45). Briefly, O2 consumption, CO2 release, energy expenditure, food consumption and motor activity were measured in 10-month-old YAC128 and WT mice with an Animal Monitoring System (LabMaster, TSE Systems, Midland, MI, USA). The system consists of an eight-cage open-circuit system equipped with an air pump, a control unit, a sample switch unit to draw air samples from the cages and an air-drying unit. After 72 h acclimation in the calorimetric cages, the mice were recorded for 96 h for the measurements listed earlier. The system measures O2 consumed and CO2 produced. These values were averaged to determine the hourly rate of each parameter. Energy expenditure was calculated by the Weir equation (59) as modified by Bruss et al. (60): Energy expenditure (kcal/h)¼[(3.815 + 1.232 × RER) × VO2]/1000, where VO2 is in milliliters/hour.
Mouse body composition
Fat mass and lean body mass of WT and YAC128 mice were estimated by DEXA scanning. A PIXImus II mouse densitometer (Lunar Corp., Madison, WI, USA) was used in the Department of Cell Biology and Anatomy, Indiana University School of Medicine. During scanning, the mice were maintained in the anesthetized state by a constant flow of isoflurane gas (2% with oxygen at a rate of 1 l/min) administered by a nose cone. The duration of the scan was 4–5 min.
Statistics
Power analysis was performed using G*Force software version 3.1.9.2 (by Franz Faul, Universitat Kiel, Germany) to establish the sample size necessary to detect a 10 and 20% difference between mitochondria from WT and YAC128 mice. The results of this analysis are shown in Supplementary Material, Table S1. Based on this power analysis, the number of experiments that gives an 80% likelihood (the accepted level in statistical analysis) of detecting 10% difference between two means at the significance level of α = 0.05 is within the range of 6–10 experiments. Experimental data shown in the paper are means ± SEM of indicated number of independent experiments. Statistical analysis of the experimental results consisted of unpaired t-test or one-way ANOVA followed by Bonferroni's post hoc test (GraphPad Prism® 4.0, GraphPad Software Inc., San Diego, CA, USA).
Supplementary Material
Funding
This work was supported by National Institutes of Health grant R01 NS078008 to N.B.
Supplementary Material
Acknowledgements
The authors are very thankful to Dr Alex Robling (Indiana University School of Medicine, Indianapolis, IN, USA) for help with DEXA scanning and to Oun Kheav (Richard L. Roudebush VA Medical Center, Indianapolis, IN, USA) for assistance with metabolic cage measurements. The authors are very grateful to Caroline Miller (Electron Microscopy Center, Indiana University School of Medicine) for help with electron microscopy and to George J. Eckert, MAS, Biostatistician Supervisor (Dept. of Biostatistics, Indiana University School of Medicine), for help with a power analysis.
Conflict of Interest statement. None declared.
References
- 1.Zoghbi H.Y., Orr H.T. (2000) Glutamine repeats and neurodegeneration. Annu. Rev. Neurosci., 23, 217–247. [DOI] [PubMed] [Google Scholar]
- 2.Roze E., Bonnet C., Betuing S., Caboche J. (2010) Huntington's disease. Adv. Exp. Med. Biol., 685, 45–63. [PubMed] [Google Scholar]
- 3.MacDonald M.E., Ambrose C.M., Duyao M.P., Myers R.H., Lin C., Srinidhi L., Barnes G., Taylor S.A., James M., Groot N. et al. (1993) A novel gene containing a trinucleotide repeat that is expanded and unstable on Huntington's disease chromosomes. Cell, 72, 971–983. [DOI] [PubMed] [Google Scholar]
- 4.Zuccato C., Valenza M., Cattaneo E. (2010) Molecular mechanisms and potential therapeutical targets in Huntington's disease. Physiol Rev., 90, 905–981. [DOI] [PubMed] [Google Scholar]
- 5.Sugars K.L., Rubinsztein D.C. (2003) Transcriptional abnormalities in Huntington disease. Trends Genet., 19, 233–238. [DOI] [PubMed] [Google Scholar]
- 6.Martinez-Vicente M., Talloczy Z., Wong E., Tang G., Koga H., Kaushik S., de Vries R., Arias E., Harris S., Sulzer D., Cuervo A.M. (2010) Cargo recognition failure is responsible for inefficient autophagy in Huntington's disease. Nat. Neurosci., 13, 567–576. [DOI] [PMC free article] [PubMed] [Google Scholar]
- 7.Shirendeb U.P., Calkins M.J., Manczak M., Anekonda V., Dufour B., McBride J.L., Mao P., Reddy P.H. (2012) Mutant huntingtin's interaction with mitochondrial protein Drp1 impairs mitochondrial biogenesis and causes defective axonal transport and synaptic degeneration in Huntington's disease. Hum. Mol. Genet., 21, 406–420. [DOI] [PMC free article] [PubMed] [Google Scholar]
- 8.Costa V., Giacomello M., Hudec R., Lopreiato R., Ermak G., Lim D., Malorni W., Davies K.J., Carafoli E., Scorrano L. (2010) Mitochondrial fission and cristae disruption increase the response of cell models of Huntington's disease to apoptotic stimuli. EMBO Mol. Med., 2, 490–503. [DOI] [PMC free article] [PubMed] [Google Scholar]
- 9.Song W., Chen J., Petrilli A., Liot G., Klinglmayr E., Zhou Y., Poquiz P., Tjong J., Pouladi M.A., Hayden M.R. et al. (2011) Mutant huntingtin binds the mitochondrial fission GTPase dynamin-related protein-1 and increases its enzymatic activity. Nat. Med., 17, 377–382. [DOI] [PMC free article] [PubMed] [Google Scholar]
- 10.Shirendeb U., Reddy A.P., Manczak M., Calkins M.J., Mao P., Tagle D.A., Reddy P.H. (2011) Abnormal mitochondrial dynamics, mitochondrial loss and mutant huntingtin oligomers in Huntington's disease: implications for selective neuronal damage. Hum. Mol. Genet., 20, 1438–1455. [DOI] [PMC free article] [PubMed] [Google Scholar]
- 11.Trushina E., Dyer R.B., Badger J.D., Ure D., Eide L., Tran D.D., Vrieze B.T., Legendre-Guillemin V., McPherson P.S., Mandavilli B.S. et al. (2004) Mutant huntingtin impairs axonal trafficking in mammalian neurons in vivo and in vitro. Mol. Cell Biol., 24, 8195–8209. [DOI] [PMC free article] [PubMed] [Google Scholar]
- 12.Beal M.F., Hyman B.T., Koroshetz W. (1993) Do defects in mitochondrial energy metabolism underlie the pathology of neurodegenerative diseases? Trends Neurosci., 16, 125–131. [DOI] [PubMed] [Google Scholar]
- 13.Kuhl D.E., Markham C.H., Metter E.J., Riege W.H., Phelps M.E., Mazziotta J.C. (1985) Local cerebral glucose utilization in symptomatic and presymptomatic Huntington's disease. Res. Publ. Assoc. Res. Nerv. Ment. Dis., 63, 199–209. [PubMed] [Google Scholar]
- 14.Brennan W.A. Jr., Bird E.D., Aprille J.R. (1985) Regional mitochondrial respiratory activity in Huntington's disease brain. J. Neurochem., 44, 1948–1950. [DOI] [PubMed] [Google Scholar]
- 15.Gu M., Gash M.T., Mann V.M., Javoy-Agid F., Cooper J.M., Schapira A.H. (1996) Mitochondrial defect in Huntington's disease caudate nucleus. Ann. Neurol., 39, 385–389. [DOI] [PubMed] [Google Scholar]
- 16.Browne S.E., Bowling A.C., MacGarvey U., Baik M.J., Berger S.C., Muqit M.M., Bird E.D., Beal M.F. (1997) Oxidative damage and metabolic dysfunction in Huntington's disease: selective vulnerability of the basal ganglia. Ann. Neurol., 41, 646–653. [DOI] [PubMed] [Google Scholar]
- 17.Kim S.H., Thomas C.A., Andre V.M., Cummings D.M., Cepeda C., Levine M.S., Ehrlich M.E. (2011) Forebrain striatal-specific expression of mutant huntingtin protein in vivo induces cell-autonomous age-dependent alterations in sensitivity to excitotoxicity and mitochondrial function. ASN. Neuro., 3, e00060. [DOI] [PMC free article] [PubMed] [Google Scholar]
- 18.Damiano M., Diguet E., Malgorn C., D'Aurelio M., Galvan L., Petit F., Benhaim L., Guillermier M., Houitte D., Dufour N. et al. (2013) A role of mitochondrial complex II defects in genetic models of Huntington's disease expressing N-terminal fragments of mutant huntingtin. Hum. Mol. Genet., 22, 3869–3882. [DOI] [PMC free article] [PubMed] [Google Scholar]
- 19.Guidetti P., Charles V., Chen E.Y., Reddy P.H., Kordower J.H., Whetsell W.O. Jr., Schwarcz R., Tagle D.A. (2001) Early degenerative changes in transgenic mice expressing mutant huntingtin involve dendritic abnormalities but no impairment of mitochondrial energy production. Exp. Neurol., 169, 340–350. [DOI] [PubMed] [Google Scholar]
- 20.Olah J., Klivenyi P., Gardian G., Vecsei L., Orosz F., Kovacs G.G., Westerhoff H.V., Ovadi J. (2008) Increased glucose metabolism and ATP level in brain tissue of Huntington's disease transgenic mice. FEBS J., 275, 4740–4755. [DOI] [PubMed] [Google Scholar]
- 21.Milakovic T., Johnson G.V. (2005) Mitochondrial respiration and ATP production are significantly impaired in striatal cells expressing mutant huntingtin. J. Biol. Chem., 280, 30773–30782. [DOI] [PubMed] [Google Scholar]
- 22.Oliveira J.M., Jekabsons M.B., Chen S., Lin A., Rego A.C., Goncalves J., Ellerby L.M., Nicholls D.G. (2007) Mitochondrial dysfunction in Huntington's disease: the bioenergetics of isolated and in situ mitochondria from transgenic mice. J. Neurochem., 101, 241–249. [DOI] [PubMed] [Google Scholar]
- 23.Gouarne C., Tardif G., Tracz J., Latyszenok V., Michaud M., Clemens L.E., Yu-Taeger L., Nguyen H.P., Bordet T., Pruss R.M. (2013) Early deficits in glycolysis are specific to striatal neurons from a rat model of huntington disease. PLoS. ONE., 8, e81528. [DOI] [PMC free article] [PubMed] [Google Scholar]
- 24.Slow E.J., van Raamsdonk J., Rogers D., Coleman S.H., Graham R.K., Deng Y., Oh R., Bissada N., Hossain S.M., Yang Y.Z. et al. (2003) Selective striatal neuronal loss in a YAC128 mouse model of Huntington disease. Hum. Mol. Genet., 12, 1555–1567. [DOI] [PubMed] [Google Scholar]
- 25.Reddy P.H., Charles V., Williams M., Miller G., Whetsell W.O. Jr., Tagle D.A. (1999) Transgenic mice expressing mutated full-length HD cDNA: a paradigm for locomotor changes and selective neuronal loss in Huntington's disease. Philos. Trans. R. Soc. Lond B Biol. Sci., 354, 1035–1045. [DOI] [PMC free article] [PubMed] [Google Scholar]
- 26.Milnerwood A.J., Cummings D.M., Dallerac G.M., Brown J.Y., Vatsavayai S.C., Hirst M.C., Rezaie P., Murphy K.P. (2006) Early development of aberrant synaptic plasticity in a mouse model of Huntington's disease. Hum. Mol. Genet., 15, 1690–1703. [DOI] [PubMed] [Google Scholar]
- 27.Pouladi M.A., Morton A.J., Hayden M.R. (2013) Choosing an animal model for the study of Huntington's disease. Nat. Rev. Neurosci., 14, 708–721. [DOI] [PubMed] [Google Scholar]
- 28.Carre M., Andre N., Carles G., Borghi H., Brichese L., Briand C., Braguer D. (2002) Tubulin is an inherent component of mitochondrial membranes that interacts with the voltage-dependent anion channel. J. Biol. Chem., 277, 33664–33669. [DOI] [PubMed] [Google Scholar]
- 29.Shalbuyeva N., Brustovetsky T., Bolshakov A., Brustovetsky N. (2006) Calcium-dependent spontaneously reversible remodeling of brain mitochondria. J. Biol. Chem., 281, 37547–37558. [DOI] [PubMed] [Google Scholar]
- 30.Brustovetsky T., Li T., Yang Y., Zhang J.T., Antonsson B., Brustovetsky N. (2010) BAX insertion, oligomerization, and outer membrane permeabilization in brain mitochondria: role of permeability transition and SH-redox regulation. Biochim. Biophys. Acta, 1797, 1795–1806. [DOI] [PMC free article] [PubMed] [Google Scholar]
- 31.Scorrano L., Ashiya M., Buttle K., Weiler S., Oakes S.A., Mannella C.A., Korsmeyer S.J. (2002) A distinct pathway remodels mitochondrial cristae and mobilizes cytochrome c during apoptosis. Dev. Cell, 2, 55–67. [DOI] [PubMed] [Google Scholar]
- 32.Lai J.C.K., Clark J.B. (1989) In Boulton A.A., Baker G.B., Butterworth R.F. (eds), Neuromethods pp. 43–98.
- 33.Panov A.V., Burke J.R., Strittmatter W.J., Greenamyre J.T. (2003) In vitro effects of polyglutamine tracts on Ca2+-dependent depolarization of rat and human mitochondria: relevance to Huntington's disease. Arch. Biochem. Biophys., 410, 1–6. [DOI] [PubMed] [Google Scholar]
- 34.Wojtczak A.B. (1969) Inhibitory action of oxaloacetate on succinate oxidation in rat-liver mitochondria and the mechanism of its reversal. Biochim. Biophys. Acta, 172, 52–65. [DOI] [PubMed] [Google Scholar]
- 35.Oestreicher A.B., van den Bergh S.G., Slater E.C. (1969) The inhibition by 2,4-dinitrophenol of the removal of oxaloacetate formed by the oxidation of succinate by rat-liver and -heart mitochondria. Biochim. Biophys. Acta, 180, 45–55. [DOI] [PubMed] [Google Scholar]
- 36.Yano H., Baranov S.V., Baranova O.V., Kim J., Pan Y., Yablonska S., Carlisle D.L., Ferrante R.J., Kim A.H., Friedlander R.M. (2014) Inhibition of mitochondrial protein import by mutant huntingtin. Nat. Neurosci., 17, 822–831. [DOI] [PMC free article] [PubMed] [Google Scholar]
- 37.Orr A.L., Li S., Wang C.E., Li H., Wang J., Rong J., Xu X., Mastroberardino P.G., Greenamyre J.T., Li X.J. (2008) N-terminal mutant huntingtin associates with mitochondria and impairs mitochondrial trafficking. J. Neurosci., 28, 2783–2792. [DOI] [PMC free article] [PubMed] [Google Scholar]
- 38.Gomez L.A., Monette J.S., Chavez J.D., Maier C.S., Hagen T.M. (2009) Supercomplexes of the mitochondrial electron transport chain decline in the aging rat heart. Arch. Biochem. Biophys., 490, 30–35. [DOI] [PMC free article] [PubMed] [Google Scholar]
- 39.Kamo N., Muratsugu M., Hongoh R., Kobatake Y. (1979) Membrane potential of mitochondria measured with an electrode sensitive to tetraphenyl phosphonium and relationship between proton electrochemical potential and phosphorylation potential in steady state. J. Membr. Biol., 49, 105–121. [DOI] [PubMed] [Google Scholar]
- 40.Brustovetsky N., Brustovetsky T., Jemmerson R., Dubinsky J.M. (2002) Calcium-induced cytochrome c release from CNS mitochondria is associated with the permeability transition and rupture of the outer membrane. J. Neurochem., 80, 207–218. [DOI] [PubMed] [Google Scholar]
- 41.Spector A.A., John K., Fletcher J.E. (1969) Binding of long-chain fatty acids to bovine serum albumin. J. Lipid Res., 10, 56–67. [PubMed] [Google Scholar]
- 42.Skulachev V.P. (1991) Fatty acid circuit as a physiological mechanism of uncoupling of oxidative phosphorylation. FEBS Lett., 294, 158–162. [DOI] [PubMed] [Google Scholar]
- 43.Wu M., Neilson A., Swift A.L., Moran R., Tamagnine J., Parslow D., Armistead S., Lemire K., Orrell J., Teich J. et al. (2007) Multiparameter metabolic analysis reveals a close link between attenuated mitochondrial bioenergetic function and enhanced glycolysis dependency in human tumor cells. Am. J. Physiol. Cell Physiol., 292, C125–C136. [DOI] [PubMed] [Google Scholar]
- 44.Ismailoglu I., Chen Q., Popowski M., Yang L., Gross S.S., Brivanlou A.H. (2014) Huntingtin protein is essential for mitochondrial metabolism, bioenergetics and structure in murine embryonic stem cells. Dev. Biol., 391, 230–240. [DOI] [PMC free article] [PubMed] [Google Scholar]
- 45.DePaoli-Roach A.A., Segvich D.M., Meyer C.M., Rahimi Y., Worby C.A., Gentry M.S., Roach P.J. (2012) Laforin and malin knockout mice have normal glucose disposal and insulin sensitivity. Hum. Mol. Genet., 21, 1604–1610. [DOI] [PMC free article] [PubMed] [Google Scholar]
- 46.Siddiqui A., Rivera-Sanchez S., Castro M.R., Acevedo-Torres K., Rane A., Torres-Ramos C.A., Nicholls D.G., Andersen J.K., Ayala-Torres S. (2012) Mitochondrial DNA damage is associated with reduced mitochondrial bioenergetics in Huntington's disease. Free Radic. Biol. Med., 53, 1478–1488. [DOI] [PMC free article] [PubMed] [Google Scholar]
- 47.Napoli E., Wong S., Hung C., Ross-Inta C., Bomdica P., Giulivi C. (2013) Defective mitochondrial disulfide relay system, altered mitochondrial morphology and function in Huntington's disease. Hum. Mol. Genet., 22, 989–1004. [DOI] [PMC free article] [PubMed] [Google Scholar]
- 48.Higgins D.S., Hoyt K.R., Baic C., Vensel J., Sulka M. (1999) Metabolic and glutamatergic disturbances in the Huntington's disease transgenic mouse. Ann. NY Acad. Sci., 893, 298–300. [DOI] [PubMed] [Google Scholar]
- 49.Lee J.M., Ivanova E.V., Seong I.S., Cashorali T., Kohane I., Gusella J.F., MacDonald M.E. (2007) Unbiased gene expression analysis implicates the huntingtin polyglutamine tract in extra-mitochondrial energy metabolism. PLoS. Genet., 3, e135. [DOI] [PMC free article] [PubMed] [Google Scholar]
- 50.Boussicault L., Herard A.S., Calingasan N., Petit F., Malgorn C., Merienne N., Jan C., Gaillard M.C., Lerchundi R., Barros L.F. et al. (2014) Impaired brain energy metabolism in the BACHD mouse model of Huntington's disease: critical role of astrocyte-neuron interactions. J. Cereb. Blood Flow Metab, 34, 1500–1510. [DOI] [PMC free article] [PubMed] [Google Scholar]
- 51.Powers W.J., Videen T.O., Markham J., McGee-Minnich L., Antenor-Dorsey J.V., Hershey T., Perlmutter J.S. (2007) Selective defect of in vivo glycolysis in early Huntington's disease striatum. Proc. Natl Acad. Sci. USA, 104, 2945–2949. [DOI] [PMC free article] [PubMed] [Google Scholar]
- 52.Gaba A.M., Zhang K., Marder K., Moskowitz C.B., Werner P., Boozer C.N. (2005) Energy balance in early-stage Huntington disease. Am. J. Clin. Nutr., 81, 1335–1341. [DOI] [PubMed] [Google Scholar]
- 53.Turner C., Cooper J.M., Schapira A.H. (2007) Clinical correlates of mitochondrial function in Huntington's disease muscle. Mov Disord., 22, 1715–1721. [DOI] [PubMed] [Google Scholar]
- 54.Valencia A., Sapp E., Kimm J.S., McClory H., Reeves P.B., Alexander J., Ansong K.A., Masso N., Frosch M.P., Kegel K.B. et al. (2013) Elevated NADPH oxidase activity contributes to oxidative stress and cell death in Huntington's disease. Hum. Mol. Genet., 22, 1112–1131. [DOI] [PMC free article] [PubMed] [Google Scholar] [Retracted]
- 55.Trushina E., Canaria C.A., Lee D.Y., McMurray C.T. (2014) Loss of caveolin-1 expression in knock-in mouse model of Huntington's disease suppresses pathophysiology in vivo. Hum. Mol. Genet., 23, 129–144. [DOI] [PMC free article] [PubMed] [Google Scholar]
- 56.Shalbuyeva N., Brustovetsky T., Brustovetsky N. (2007) Lithium desensitizes brain mitochondria to calcium, antagonizes permeability transition, and diminishes cytochrome C release. J. Biol. Chem., 282, 18057–18068. [DOI] [PubMed] [Google Scholar]
- 57.Kimmich G.A., Randles J., Brand J.S. (1975) Assay of picomole amounts of ATP, ADP, and AMP using the luciferase enzyme system. Anal. Biochem., 69, 187–206. [DOI] [PubMed] [Google Scholar]
- 58.Dubinsky J.M. (1993) Intracellular calcium levels during the period of delayed excitotoxicity. J. Neurosci., 13, 623–631. [DOI] [PMC free article] [PubMed] [Google Scholar]
- 59.Weir J.B. (1949) New methods for calculating metabolic rate with special reference to protein metabolism. J. Physiol, 109, 1–9. [DOI] [PMC free article] [PubMed] [Google Scholar]
- 60.Bruss M.D., Khambatta C.F., Ruby M.A., Aggarwal I., Hellerstein M.K. (2010) Calorie restriction increases fatty acid synthesis and whole body fat oxidation rates. Am. J. Physiol Endocrinol. Metab, 298, E108–E116. [DOI] [PMC free article] [PubMed] [Google Scholar]
Associated Data
This section collects any data citations, data availability statements, or supplementary materials included in this article.


