

Abstract
A size and shape tuned, multifunctional metal chalcogenide, Cu2S-based nanotheranostic agent is developed for trimodal imaging and multimodal therapeutics against brain cancer cells. This theranostic agent was highly efficient in optical, photoacoustic and x-ray contrast imaging systems. The folate targeted, NIR-responsive photothermal ablation in synergism with the chemotherapeutic action of doxorubicin proved to be a rapid precision guided cancer-killing module. The multi-stimuli, i.e., pH-, thermo- and photo-responsive drug release behavior of the nanoconjugates opens up a wider corridor for on-demand, triggered drug administration. The simple synthesis protocol, combined with the multitudes of interesting features packed into a single nanoformulation, clearly demonstrates the competing role of this Cu2S nanosystem in future cancer treatment strategies.
Keywords: Cu2S Nanocrystals, Intracellular drug trafficking, Photoexcitation, Photothermal therapy, Photoacoustic Imaging, X-ray contrast imaging
Solid tumors, due to their multilevel intricacies and vast diversity in genetic content, protein expression, and cellular/tissue microenvironment are considered to be one of the most urgent challenging health issues.1-3 Several therapeutic approaches have been developed and adopted to target malignancy and exterminate them for good.4,5 Unfortunately, even after continuous progress in the research and development of such strategies, malignancy continues to evolve with a high recurrence rate.6 Of the various options for identifying and treating cancer, nanotechnology has been a promising prospect to reckon with.7-10
Main objectives of nanotechnology in medicine, nanomedicine, for cancer therapy include specific identification of cancerous cells from the vast number and diversity of normal cells surrounding the tumor, augmenting the therapeutic ability of the drugs, and tracing the location of the drug/cargo inside the biological system.11-13 Initially, nanoparticles (NPs) for therapeutics were formulated solely to transport drugs to lesion sites without any added functionalities.14-16 However recent advances in nanotechnology have nurtured the engineering of precision nanomaterials with multiple, discrete function-related components integrated into a single nanosystem for efficient biomedical applications.17-21 These multifunctional nanocarriers could dramatically overhaul the treatment and diagnostic options for cancer and there is an ever-increasing interest in developing the same. A variety of such carriers have already been investigated with substantially improved cancer theranostics that can harbor therapeutics, fluorescent moieties and utilize the inherent signature properties of the carrier.22-24 Additional conjugation to aptamers, antibodies, peptides etc., renders high level of cellular specificity to the nanocarrier, which could be utilized for focusing on the desired cells and negating non-specific cellular adhesion and or internalization.25-28
Few examples of recently reported theranostic agents include a multifunctional magnetic-plasmonic nanoagent that possess magnetic resonance and photoacoustic imaging guided tumor photothermal therapy property;29 LDL labeled Au nanocrystals (NCs) that help the analysis and localization of LDL in vivo using multimodal whole body computed and spectral imaging;30 Tumor angiogenesis mapping utilizing NaLuF4:Yb,Tm@NaGdF4(153Sm) NCs that can confer signals for upconversion luminescence imaging, X-ray contrast imaging, magnetic resonance imaging and single-photon emission computed tomography;31 Magnetic mesoporous silica nanoparticles that can image and deliver drugs to cancer;32 Fe5C2 NPs based targeted theranostic platform for magnetic resonance imaging and photoacoustic tomography-guided photothermal therapy (PTT) etc.33 These multi-agent nanocarriers report significantly improved therapeutic outcomes.
Recently, Cu based NCs are gaining interest in biomedical applications. Numerous reports have demonstrated the synthesis and photothermal therapy of cancer employing copper sulfide semiconductor NCs due to their excellent NIR absorption and efficient heat generation abilities.34-36 However, the investigation of multimodal applications of copper sulfide NCs other than photothermal cancer therapy, such as optical imaging and/or drug delivery is still in its infancy. Unlike previously documented CuS based works, the current report emphasizes on the optical imaging ability and multifunctionalilty of the NCs. Here, we report a multimodal drug delivery system with precise targeting capabilities, trimodal imaging, multiple drug release mechanisms with enhanced chemo and PTT. PEGylated highly cytocompatible Cu2S NCs with superior visible luminescence and NIR-absorbance that could be utilized as imaging cum photothermal agents were synthesized. The application of PEG-Cu2S NCs as multimodal imaging agent that finds application in optical, photoacoustic and X-ray contrast imaging are reported. Folate mediated cancer cell targeting was utilized for to deliver NCs-DOX conjugates, minimizing the off target effects and increase the therapeutic efficacy of non-targeted chemotherapeutics. Synergistic drug release via external stimuli induced by the excitation of NCs, were observed to inflict severe cytocidal effects on the brain cancer cell line, Gl-1. The overall potential of this nanosystem supports its practical applications for future comprehensive theranostic approaches to treat cancer.
DSPE-PEG (Lipid-polymer) coated Cu2S NCs were prepared by a two-step method. First, luminescent Cu2S NCs were prepared by hot injection based simple colloidal approach utilizing a mixture of Cu and S precursors dissolved in 1-octadecene and oleylamine at a relatively high temperature without using any cytotoxic ligands. In the second step, the NCs were coated with lipid-polymer conjugates that possess free amine group by thin film lipid hydration method, to yield PEGylated Cu2S NCs (PEG-Cu2S NCs). The non-PEGylated NCs were characterized for morphological features, elemental analysis, optical absorption, photoluminescence and surface chemical characteristics. Transmission electron microscopy (TEM) revealed monodisperse, spherical NCs with size ranging from 15 nm to about 20 nm (Figure. 1a). The HR-TEM observation of Cu2S NCs with SAED pattern revealed well-resolved lattice patterns, signifying the high crystallinity of the as-prepared NCs (Figure. 1b). The lattice distance was measured to be about 0.189 nm, matching the (573) planes characteristic of orthorhombic phase of Cu2S (JCPDS No 02-1294). Figure 1c presents Cu and S peaks in EDS analysis and accordingly the elemental composition of Cu2S was found to be Cu1.94S (with an atomic percentage of Cu being 66 and S, 34). The existence of monodisperse particles with uniform shape and size was further confirmed with SEM (Figure. 1d, S1). The composition and valence states of Cu2S NCs were studied by XPS analysis (Figure. S2). The analysis spectrum of Cu 2p and S 2p demonstrated the presence of S and Cu elements in sample. The doublet features of Cu 2p spectrum arise because of spin orbit splitting, resulted in 2p3/2 and 2p1/2 peaks with a separation of 6.74 eV. The spectrum of the Cu 2p signal revealed the centering of Cu 2p3/2 and Cu 2p1/2 signal at 932.5 eV and 952.5 eV respectively, implying the existence of Cu ion in the Cu (I) state. The peak maxima were observed at 932.5 and 952.5 eV for Cu 2p3/2 and Cu 2p1/2 with a FWHM 2.1 and 1.56 eV respectively with clear separation of peaks by 20 eV. There was no ‘shake-up’ in the higher binding energy course, which indicated absence of Cu (II) and their oxides. The S 2p level was resolved into single spin orbit splitting, S 2p3/2 and S 2p½ with binding energy maxima at 161.2 eV and 162.06 eV respectively with a 0.84 eV separation and the intensity ratio between the two peaks was found to be 1:2. A peak maximum at 161 eV indicated copper sulfide and any peak beyond 165 eV denoted nonexistence of oxidized sulfur. This observation clearly showed that the Cu2S formed were pure nanocrystals. The peak at 400 eV can be attributed to the occurrence of nitrogen that arises from oleylamine capping on surface of Cu2S NCs. Pondering the closeness of the binding energies of Cu (0) and Cu (1), Cu LMM was examined to confirm the valence state of Cu in the samples. The binding energy of Cu LMM was centered at 569.5 eV. This obviously ruled out the presence of Cu (0) in the samples, as the binding energy of monatomic Cu LMM is centered at 568 eV. Diffraction peaks observed in the XRD pattern of NCs matched well with the crystal phase of chalcocite Cu2S (Orthorhombic, JCPDS 02-1294) (Figure. S3). The surface chemical nature of the Cu2S NCs was analyzed with FT-IR (Figure. S4). Two sharp peaks at 2925 & 2857 cm−1 were assigned to the asymmetric methyl stretching and asymmetric methylene stretching modes respectively, which arise from capped oleylamine. Absence and/or weak presence of oleylamine signature peaks at 3074 (denoting the –NH stretching) and 1639 cm−1 (–NH bending vibration) and at 720 cm−1 (–NH2 wagging vibration) were due to complete coordination (surface binding to NCs) and reduction of oleylamine, confirming the capping on NCs. Typical optical absorption spectrum of Cu2S NCs dissolved in chloroform is shown in Figure. 2. We could not observe any sharp shoulder peaks in the visible region barring an absorption onset at 600 nm. It could be clearly visualized that the absorption spectrum was blue shifted compared with the bulk counterpart. An intense peak at NIR region can be accredited to the localized surface plasmon resonance (LSPR) that arises owing to the presence of minority carriers (holes) in the NCs. The photoluminescence of Cu2S NCs exhibited a broad blue-green emission centered at 420 nm when excited using 365 nm (Figure. 2 inset). The origin of the photoluminescence exhibited by the NCs was not well understood at this stage, however it was speculated to arise from d-d transition occurring at Cu-oleylamine complex present on the NC's surface. In addition, the photoluminescence of the NCs, interestingly was found to be pH dependent. An increase in luminescence by 4-fold was observed when the NCs were suspended in acidic pH solution. In addition, we also observed a blue shift in the luminescence centered at 410 nm when suspended in acidic pH (Figure. S5). Though this mechanism is not fully understood, the pH dependent PL property implies that the surface defects of NCs capture carriers leading to correlated luminescence. Also, this pH dependent luminescence may correspond to the protonation and deprotonation of the surface groups that may lead to electrostatic doping/charging and alter the Fermi level.37-39 This pH-sensitive luminescence property could be used for fluorescent and visual colorimetric assays. In addition, they could also serve as imaging enrichers at the cancer niche due to the acidic environment of tumor pathologies.
Figure 1.
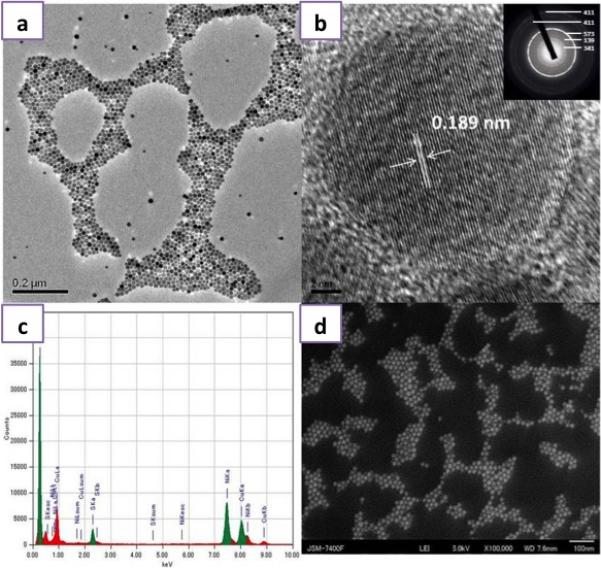
Structural and Elemental Characterization of the Cu2S NCs a) TEM image of Cu2S NCs, b) HR-TEM of Cu2S NCs exhibiting the crystal lattice distance with an inset presenting the SAED pattern, c) EDS analysis of Cu2S NCs and d) SEM image of Cu2S NCs.
Figure 2.
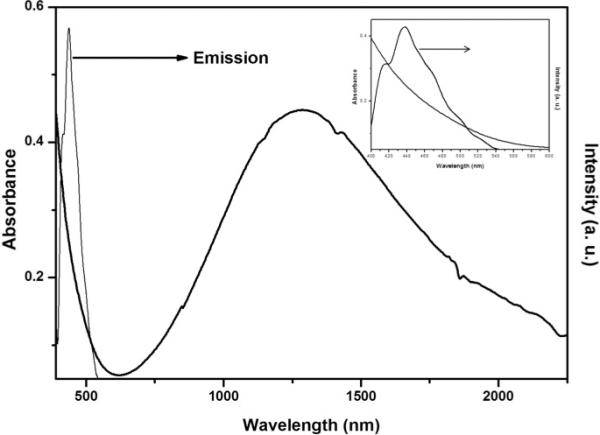
Optical properties of the Cu2S NCs: UV-Vis spectra of Cu2S NCs exhibiting broad LSPR in the NIR. The inset shows the visible absorbance and photoluminescence spectra of Cu2S NCs.
The bare Cu2S NCs as such were not suitable for bio-applications owing to several reasons. Firstly, high level of nanocrystal aggregation was observed at physiological pH and ionic strength. Secondly, plasma proteins are expected to replace the hydrophobic capping by binding to the Cu2S NCs surface, thus resulting in elimination from the circulation by reticulo-endothelial system. Finally, the hydrophobicity of the NCs does not permit monodispersion in biological media. We therefore modified the surface of the NCs with biocompatible PEG-lipid hybrid conjugates to yield the polymer-lipid coated NCs (Scheme. S1). PEG is a biocompatible polymer that is used widely in pharmaceutical industry as solubilizer and stabilizer.40-42 In addition, it helps stealth the NCs from opsonization and reticuloendothelial clearance, thus increases the circulation life in blood plasma. After surface modification, the PEG-Cu2S NCs exhibited excellent stability in physiological PBS (pH 7.4) for over a year. The mean hydrodynamic diameter of PEG-Cu2S NCs was 162.5 nm by DLS (Figure. S6). The TEM micrographs of the PEG-Cu2S NCs (Figure. S7) showed monodispersed lipid-PEG coated aggregates of Cu2S NCs. Each core consists of NC aggregates of size approximately 100 nm surrounded by lipid-PEG shell. The aggregates are made up of approximately 70 – 90 NCs. In addition the PEG-Cu2S NCs exhibited an average zeta potential of −39.1 mV (Figure. S8). The UV-Vis-NIR absorbance spectra of PEG-Cu2S NCs remained identical to that of the bare NCs which assures that PEG coating does not hinder the optical characteristics of the NCs (Figure. S9). In addition, the PEG-Cu2S NCs exhibited superior suspension/dispersion ability in aqueous solvents. The FT-IR analysis of PEG-Cu2S NCs displayed signature peaks of PEG-lipid grafts at around 1175 (C–O–C ether stretch band), 2918 (–CH2 stretching vibrations) and 981 cm−1 (–CH out-of-plane bending vibrations), confirming successful NCs PEGylation (Figure. S4).
With all nanoparticle preparations, the issue of toxicity remains a factor in determining their specific biological applications. We assessed the compatibility of PEG-Cu2S NCs in vitro using human brain cortical neurons HCN-1A and human brain cancer, gliomas. The PEG-Cu2S NCs were non-toxic to both cell lines at the tested concentration range (0.01 mg – 1 mg/ml) till day 7 (Figure. 3a). Besides, to assess the toxic effects of degradation products of PEG-Cu2S NCs (if any), we analyzed the toxicity of NCs (prior incubated at acidic pH 4) to the cell lines. Though a slight decrease in cellular viability was observed on day 7, it was highly insignificant when compared to cells treated with normal (non-acidic pH incubated) NCs (Figure. S10). The above 80 % viability over a standard period of time confirmed the stability and safe nature of the NCs with regards to any possible degradation products. In addition, these NCs, post exposure did not induce or exhibit significant ROS production in both the cell lines under study (data not shown). The cellular entry of PEG-Cu2S NCs was studied with the help of confocal microscopy. Post incubation with the PEG-Cu2S NCs, the cells were repeatedly washed and stained for nuclei with DAPI and lysosomes with lysotracker-red. The luminescence of the NCs green emission under 488 nm excitation was evident in both cancer and normal cells. In addition, the accumulation of NCs was preferentially localized in lysosomes, depicting endo-lysosomal uptake and processing of particles by cells (Figure. 3b).
Figure 3.
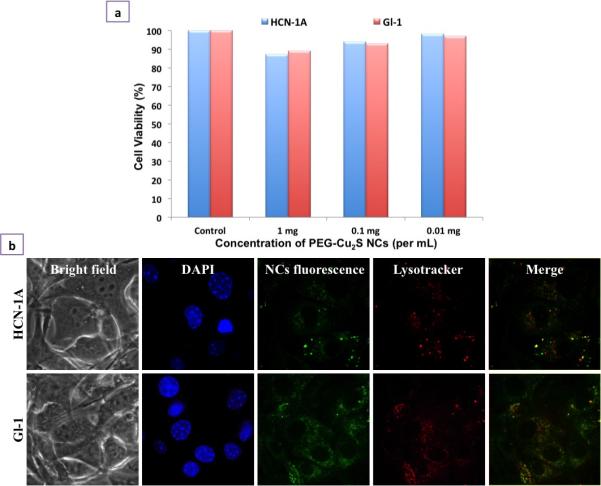
Cellular interaction analysis of PEGylated Cu2S NCs. a) In vitro cell viability analysis of PEGylated Cu2S NCs at different concentrations (0.01 – 1 mg/mL) for 7 days b) Cellular entry analysis of PEGylated Cu2S NCs confirmed the entry of NCs into the cell's cytoplasm (NC's fluorescence) in both normal as well cancer cell line. The nuclear staining (DAPI) and lysosomal staining (Lysotracker) can be seen. The internalization of NCs was found to be endocytosis mediated which is confirmed by the co-localization of NCs signal with lysosomal mapping (Merge).
Due to the discrete broad absorption in NIR region due to LSPR that arises from minority carriers (Figure. 4a) the possible photoacoustic (PA) contrast ability of PEG-Cu2S NCs was assessed. For PA, in general, the contrast agent must have high absorption coefficients. This broad absorption at NIR region is advantageous as the absorption coefficient of blood, the natural photoacoustic source is low at NIR wavelengths. The PA sensitivity of PEG-Cu2S NCs in the NIR region was tested by analyzing the PA signal amplitude using NC filled vinyl tubing. The spectroscopic imaging of NCs generated a photoacoustic signal spectrum that peaked around 900 nm. Moreover, the broad absorption of the NCs opens up the possibility of using cost-effective laser sources for PAI. In addition, the NCs showed exceptionally broad spectral response (Figure. 4). When assessed at a preclinical frequency (21 MHz), the NCs could be nicely visualized with PA imaging system (Figure. 4b right panel), however they produced poor signal with ultrasound alone (Figure. 4b left panel).
Figure 4.
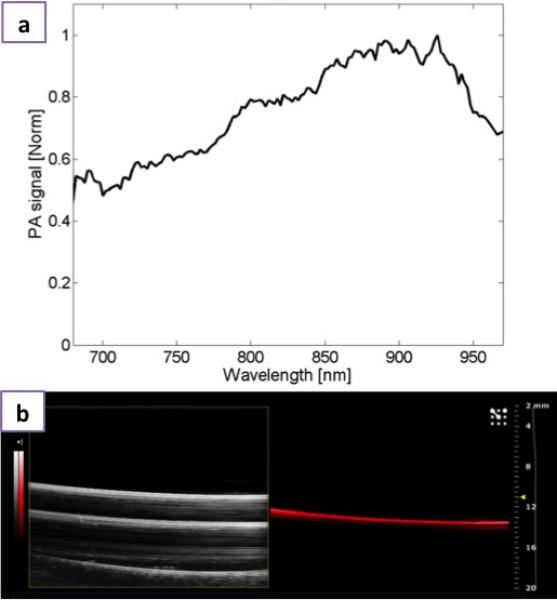
Photoacoustic imaging a) Normalized photoacoustic signal spectrum of PEGylated Cu2S and b) Ultrasound B-mode image (left) and photoacoustic image (right) of PEGylated Cu2S filled vinyl tube phantom obtained with the VisualSonics Vevo 2100-LAZR system.
Besides the optical and PA imaging abilities of PEG-Cu2S NCs, we examined whether these NCs could act as X-ray attenuation based contrast agents for microCT imaging, a broadly used imaging method in diagnostic medicine owing to their deep tissue penetration and high resolution. The elements with atomic numbers ranging from 22 to 83 and having linear attenuation coefficients are expected to produce enough contrast for X-ray imaging. When compared to the linear attenuation coefficients of hydrogen, carbon, oxygen, nitrogen, fat, muscle, water, air and bone (that make up the human body), the attenuation coefficient of Cu stays very much higher and could be possibly used as contrast agent for X-ray imaging. Figure 5 showed the X-ray CT image of PEG-Cu2S NCs and their cross-sectional Z-stacked images displaying noticeable signal enrichment, demonstrating the prospective application of PEG-Cu2S NCs as CT contrast agent.
Figure 5.
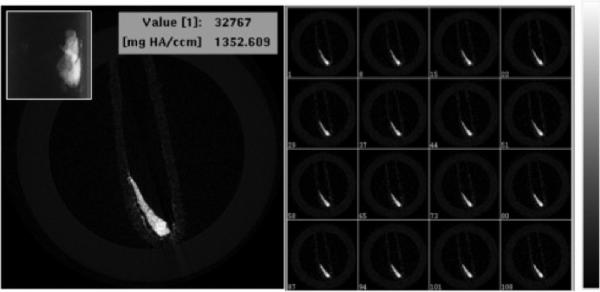
X-ray microCT imaging of PEG-Cu2S NCs at tube voltage of 45 KeV. Cross sectional X-ray contrast imaging of phantom with PEG-Cu2S NCs (left). The inset in the left shows the guide view of the same. Z-stacked contrast image of the PEG-Cu2S NCs is shown in right with the intensity scale.
NCs were further targeted specifically towards cancer cells by grafting lipid-polymer-folate along with lipid-polymer conjugates (at a molar ratio of 0.1:1) during thin film hydration (PEG-Cu2S-Fol NCs) (Scheme. S1). DOX was physically boundto the NCs forming PEG-Cu2S-Fol-DOX. The DOX attachment is mainly attributed to its inherent hydrophobic nature which binds to the hydrophobic lipid part of the lipid-polymer functionalized NCs at neutral or basic pH. Once functionalization was completed, conjugates were purified by repeated centrifugation to remove unbound drug. This functionalization did not affect the zeta-potential (−34.9 mV) and the value remained more or less same, as that of PEG-Cu2S NCs (Figure. S8). DOX loading did not deter the stability of the NCs as we found the PEG-Cu2S-Fol-DOX suspension being stable for more than a month. The loading of DOX was further confirmed with FT-IR (Figure. S4). The peak at 3306 cm−1 and 1607 cm−1 denotes the NH stretching and C=O stretching that arises from DOX (which are evidently absent in PEG-Cu2S NCs). The drug-loading efficiency was found to be approximately 87 % (0.87 mg of DOX loaded onto 10 mg of NCs). To study the drug release behavior, DOX loaded NCs were suspended in PBS buffers at different pH (4.0, 5.0, 6.0 and 7.4). The supernatants were collected at defined time intervals to determine the drug release kinetics. pH sensitive drug release was observed (Figure. 6). Acidic pH (4, 5 and 6) enhanced the release of drugs within the time of study. Color of the supernatant at pH 4 was orange-red, indicative of the released DOX, whereas the supernatant at pH 7 stayed more or less clear (Figure. 6 inset). Nearly 96 % of drug was released within 48 h at pH 4, whereas the release at pH 7 reached its maximum, approximately 10 % at 24 h and remained plateaued thereafter till the end of the study, 120 h. This indicates the advantageous pH responsive behavior of the nanoconstruct applicable in triggered drug release. This observation can be attributed primarily to the amine group present in DOX that protonates at low pH, rendering it hydrophilic and leading to faster release. Such a phenomenon is highly advantageous, as it would enhance therapeutic efficacy specifically at acidic pH, which is a hallmark of cancer tissues. Therefore at the physiological pH of normal cells, the release of DOX from NCs will be limited or non-existent. This minimizes the non- specific spread of toxic drugs leading to efficient anti-cancer therapy.
Figure 6.
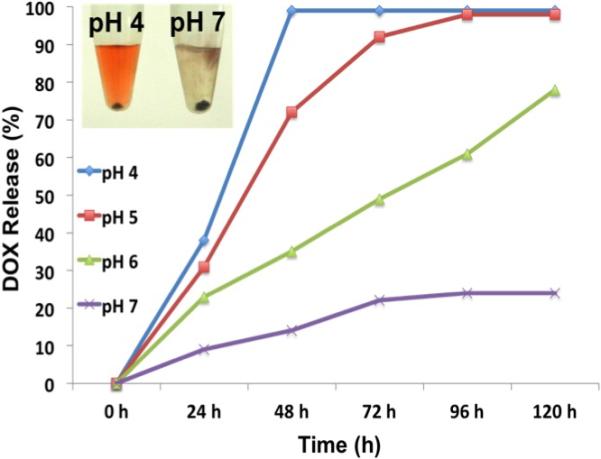
pH dependent DOX release from PEG FOL-Cu2S-DOX conjugate.
Next, we investigated the chemotherapeutic ability of the PEG-Cu2S-Fol-DOX. The drastic decrease in cellular viability of glioma cells compared to HCN-1A cells was a direct evidence of precise cancer targeting and drug delivery. The slight compromise in the viability of HCN-1A could be due to the static nature of NCs present in the media and minimal drug release occurring thereof (Figure. 7a). Gliomas were incubated with different concentrations of free DOX (2 – 10 μg/mL) and PEG-Cu2S-Fol-DOX carrying 2 – 10 μg/mL DOX (corresponding weight of the PEG-Cu2S-Fol-DOX being 0.2 - 1.2 mg/mL), and the cell viability measured post 24 h. The IC50 values of PEG-Cu2S-Fol-DOX and free DOX against glioma cells were found to be 5.3 and 4.2 μg/mL respectively. These results suggested that glioma cells were comparatively more sensitive to free DOX than to PEG-Cu2S-Fol-DOX. The lower toxicity of PEG-Cu2S-Fol-DOX to glioma cells is in a good agreement with the literature for other micelle mediated DOX release. Moreover the drug-facilitated toxicity is dependent on the release rate of DOX from the NCs at cellular level.43 Though the IC50 value of PEG-Cu2S-Fol-DOX is higher than that of free DOX, the favored targeting of cancer cells achieved by PEG-Cu2S-Fol-DOX is extremely beneficial for a drug delivery system. The PEG-Cu2S-Fol-DOX were found to preferentially accumulate in glioma cells (Figure. 7b), confirmed by discrete luminescent signals of both NCs and DOX whereas HCN-1A, showed any such signals, confirming the high level of targeting efficiency achieved.
Figure 7.
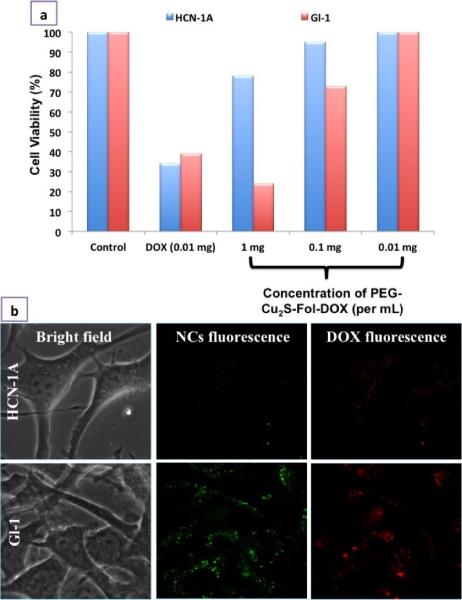
Selectivity and specificity of PEG-FOL-Cu2S-DOX towards cancer cells. a) In vitro selective tumoricidal activity of PEG-FOL-Cu2S-DOX at different concentrations (0.01 – 1mg/mL) in comparison to free DOX post 24 h incubation with cells. b) Cancer specific cellular entry of PEG-FOL-Cu2S-DOX NCs. The specificity of NC entry only into cancer cell (Gl-1) could be attributed to the folate targeting.
To track the release of DOX and its pharmacological effects, we analyzed the intracellular trafficking of PEG-Cu2S-Fol-DOX in cancer cells (Figure. 8a). The NCs were added at 0 min and the luminescence mediated tracking of NCs and DOX was performed using confocal microscopy. The bright field and luminescence of both were imaged at equal intervals from 0 min to 120 min. From 0 – 30 min, the luminescence of NCs as well as of DOX (Supplementary Video 1 shows the discrete dots of DOX signal in cytoplasm) was found to co-localize in endosomes. Post 60 min, we could find the luminescence of DOX in the nuclear region (Supplementary Video 2 shows the accumulation of DOX in nucleus, thus staining the nucleus in red), whereas the NCs were confined to cytoplasmic zone. This suggests release of DOX in the acidic environment of lysosomes, followed by DOX gaining entry into nuclear spaces. DOX is known to localize in nuclear region and intercalate DNA, thus halting cellular replication, growth and division. Post 90 min, DOX was seen concentrated in nuclear region. At this juncture, cancer cells exposed to PEG-Cu2S-Fol-DOX showed signs of cell death such as membrane blebbing, nuclear membrane disruption, cytoplasmic volume shrinkage and deformed morphology. After 120 min, most of the cells expressed necrosis that was confirmed with live/dead cell staining (Figure. 8b). This study helped to understand the intracellular itinerary of the NCs and DOX, from the point of entry to the induced necrosis of cancer cells. In addition, this study reinforced the role of pH-mediated release of DOX from NCs.
Figure 8.
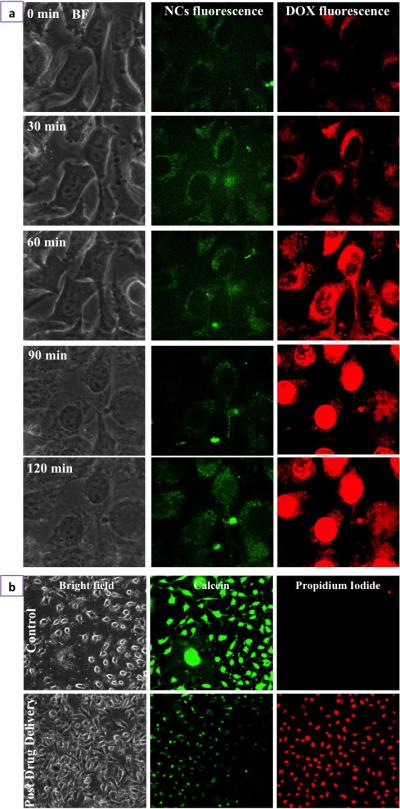
Drug delivery and Cancer cell death a) Time lapse imaging of Folate targeted PEGylated Cu2S NCs mediated intracellular trafficking of DOX. b) Gl-1 cancer cell death mediated by drug, DOX, pre and post drug delivery was confirmed with live/dead staining. Post drug delivery, after 120 min, most of the cells stained positive for propidium iodide indicating cell death.
Recently external stimuli responsive controllable release of drugs is garnering interest, one of them being photo-induced drug release. A few previous reports state that visible light excitation of the NCs could induce electron transfer to the drug and help in faster release.44-46 To analyze whether such photoresponsive release could occur in the present NC-drug conjugate system, we carried out an in situ photoexcitation study. Cu2S exhibits light absorption at 488 nm and emits green fluorescence. To understand whether the photoexcitation of NCs can induce immediate and steadfast release of drug, we carried out photoexcitation of NCs using 488 nm for 10 min. Interestingly, post photoexcitation, the release of drug increased by 4-fold in both neutral as well acidic pH, compared to non-photoexcited NCs. To assess whether such photoexcitation can induce faster release of drug under in vitro conditions, we photoexcited the targeted NC-drug conjugate treated cancer cells for 10 min (Figure. 9a). Post exposure, the cells were imaged for DOX fluorescence which was found to accumulate in the nuclei, depicting the sudden photo-excitation mediated release from the NCs. The targeted NC-drug conjugate treated cells, without photo-excitation did not show any immediate DOX accumulation at the nuclear region. Most of the DOX was still seen co-localized with the NCs in endosomes as confirmed with cellular entry confocal studies. It was evident from the cellular trafficking study that the release and the accumulation of DOX in the nuclear compartment happened only after 1 h of incubation with cells. Whereas the photo-excitation of NCs, induced rapid release of drug that escaped lysosomes and entered nucleus within 10 min. Though not clear, we attribute this induced drug release to the energy or electron transfer from the NCs to the drug, upon photoexcitation. In addition, post photoexcitation experiment, cancer cells stained positive for PPi (Figure. 9b) indicating their compromised viability. In stark contrast to the longer times taken for DOX release and initiation of cell death in the normal scenario, the accelerated release and action of DOX aided by photoexcitation culminated in a faster pace sequence of events leading to cell death. This scenario of sudden drug release upon visible light excitation can hold great promises against skin melanomas or topical cancers. Though this initial study narrates a newer and simpler route of drug delivery upon excitation with visible light, more studies are essential to understand the scope of such materials in the nanomedicine arena.
Figure 9.

NC photoexcitation mediated drug release a) Photoexcitation of NCs speeds up the release of DOX. The DOX was seen to localize nuclear region within 10 min of photosensitization of NCs using 488 nm excitation light. b) Cancer cell death mediated by photoexcitation mediated drug release could be visualized with positive propidium iodide staining of cancer cells.
As discussed earlier, additional functionalities of NPs provide enticing options to impart the multi-modal approach towards cancer diagnosis and treatment. In this regard, the NIR-responsive photothermal effect of Cu2S NCs was utilized against cancer cells. The LSPR facilitated thermal energy release capability of these PEG-Cu2S NCs was tested when irradiated with NIR laser. Different concentrations of PEG-Cu2S NCs were irradiated with 800 nm NIR laser to investigate the photothermal heating effects. The aqueous solutions of the NCs showed a concentration dependent temperature increase (Figure. 10a) when compared to water sample. To investigate the photothermal transduction efficiency of PEG-Cu2S NCs at a concentration of 100 ppm, the heating profile and cooling profile was tested (Figure. 10c). The rise and fall of the temperature during the heating (laser on; 600 sec) and cooling period (post laser off; until the temperature reaches the room temperature) of the sample as a function of time was recorded. Based on the observation, a plot of cooling period versus negative logarithm of temperature (Figure. 10d) is obtained and the time constant for heat transfer is determined. According to the obtained data the photothermal conversion efficiency of PEG-Cu2S NCs was calculated to be ~25.3%.47 To test whether the temperature rise can guide the release of drug, we investigated the thermo-responsive drug release behavior. Nearly 10-fold increase in drug release from NCs was found at pH 4 under NIR irradiation compared to the release induced by pH 4 alone (non-irradiated) within 10 min. This clearly depicted that DOX release can be controlled precisely by NIR irradiation. To evaluate the efficacy of PTT, Gl-1 cells were incubated with targeted NCs either with or without drug at a concentration of 50 μg/mL. After incubation for 1 h at 37 °C, the cells were irradiated with an 800 nm laser for 3 min. The irradiated cells were stained with Calcein AM and PPi to visualize the live and dead cells, respectively (Figure. 11). The results show a clear zone of irradiation, a red-fluorescent region of dead cells (PPi stained) surrounded by green-fluorescent live cells (calcein stained). The spatiotemporal temperature distributions of temperature rise are shown in Figure. S11. As the irradiation time increased, an observable temperature rise was witnessed with an increase in the diameter of spatiotemporal temperature distribution in the cells treated with NCs. Whereas no obvious rise in temperature and distribution thereof was noted in the experimental controls. For the cells treated with NCs, after irradiation, the temperature in the irradiated area elevated to 68.5 °C from 27 °C, with a hot spot obviously visible. It is known that cancer cells are characterized by being sensitive to heat in comparison to normal cells, especially at temperatures higher than 42 °C. The occurrence of isothermal phases established that the temperature raise in the non-irradiated zone was due to the diffusion of heat from the hot spots that are seen in irradiated zone. In contrast, cells with NC treatment, without laser irradiation were alive and no cell death was observed in the control cells (devoid of NCs) post irradiation, negating the cytocidal role of laser irradiation alone. In addition, the NIR-responsive heating ability of Cu2S NCs hold great promises in deep tissue cancer therapeutics, as the NIR laser can penetrate deeper into tissues with little or any harm. When targeted NC-drug conjugate treated cells were exposed to NIR laser at same power density, the temperature rose immediately and the PPi stained necrotic zone enlarged with nearly 100 % of cells dead. A proof of the synergistic effect that the NCs can achieve by combining photo-thermal therapy and chemotherapy is evidenced. This particular observation could hold immense advantage in the case of in vivo solid tumors, where it is speculated that the released drug may in fact enter the surrounding cancerous cells and invoke toxicity. Remarkably, targeted NC-drug conjugate along with phothothermal heating provided synergistic and effective cancer cell destruction. The synergistic effect of cancer killing is attributable to: folate, which greatly enhanced the NCs entry into folate receptor positive cancer cells, photothermal heating triggered by NIR irradiation and the DOX-induced chemotherapy.
Figure 10.
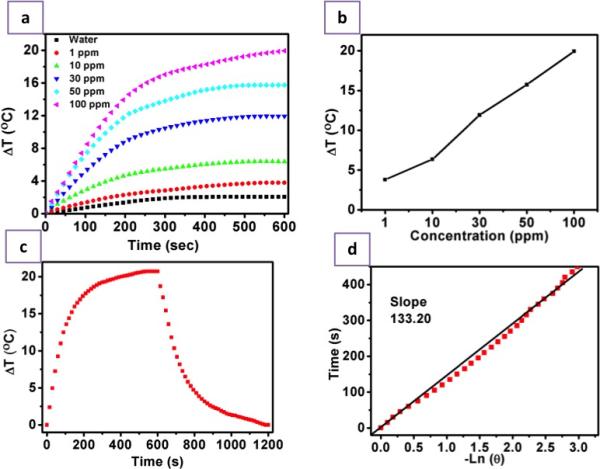
Photothermal Efficacy of PEG-Cu2S NCs. a) Heating profile of different concentrations (1, 10, 30, 50, 100 ppm) of PEG-Cu2S NCs (suspended in water) upon NIR irradiation. b) Plot of difference in temperature attained upon 600 sec (10 min) NIR irradiation of different concentrations of PEG-Cu2S NCs. c) The heating and cooling profile of 100 ppm PEG-Cu2S NCs in terms of difference in temperature. The sample was irradiated for 600 sec, post that the laser is shut down and the gradual drop in temperature was recorded until the temperature attains initial room temperature. d) Plot of cooling period (after 600 s) versus negative natural logarithm of driving force temperature. Time constant (τs) for heat transfer is determined to be 133.20 s.
Figure 11.
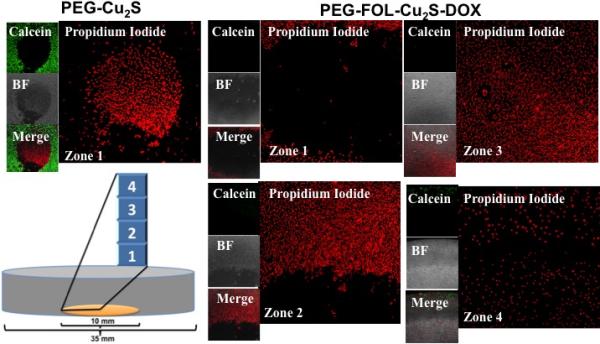
Photothermal ablation of cancer cells by dual synergistic effect of drug and heat. The culture area (10 mm in diameter) is depicted in orange in the pictorial representation of confocal dish. When treated with PEG-Cu2S and irradiated with 800 nm laser, only cells present in the zone of irradiation exhibited positive staining of propidium iodide with surrounding regions exhibiting calcein stained live cells. Whereas with PEG-FOL-Cu2S-DOX, most of the Gl-1 cells in the plate ranging from center (zone of irradiation, zone 1) to corner of the culture area of the dish (zone 4) exhibited positive propidium iodide staining with no viable cells.
In summary, we have developed a new generation Cu based NCs for chemophotothermal theranostics. It is reported that the PEGylated Cu2S NCs exhibit excellent compatibility in physiological environments, remaining stable as a homogeneous suspension in PBS, showing no observable toxicity, and as a highly effective photoacoustic and photothermal agent. These NCs could also be employed as a unique class of nanocarriers for ultra-high loading of a variety of therapeutic drugs. In addition, the photoluminescence of the NCs in the visible region helps track the NCs at intracellular level. Moreover, the X-ray based contrast imaging potentiality helps in deep tissue imaging with high resolution. Using DOX loaded NCs, the combined photothermal and chemotherapy is demonstrated in vitro, achieving commendable synergistic anti-cancer effects. The multiple modes of stimuli-responsive drug release as pH-sensitive, photo-sensitive and heat-sensitive characteristics opens up a wide horizon for on-demand, controlled drug administration for a variety of cancers. The multitude of enticing features presented by this single nanosystem offers a highly promising and viable option for future comprehensive and decisive cancer treatment.
Supplementary Material
ACKNOWLEDGEMENTS
Part of this study has been supported by a grant for the program of strategic research foundation at private universities S1101017, organized by the Ministry of Education, Culture, Sports, Science and Technology (MEXT), Japan since April 2012. Imaging studies were supported in part by a National Institutes of Health Cancer Center Support Grant (P30 CA016672). Authors thank Prof. Katsumata (Department of Applied Chemistry, Toyo University) for XRD analysis.
Footnotes
Supporting Information Available: Methodology and additional experimental results are available in Supporting Information File.
REFERENCES
- 1.Siegel R, DeSantis C, Virgo K, Stein K, Mariotto A, Smith T, Cooper D, Gansler T, Lerro C, Fedewa S, Lin C, Leach C, Cannady RS, Cho H, Scoppa S, Hachey M, Kirch R, Jemal A, Ward E. CA Cancer J. Clin. 2012;62:220. doi: 10.3322/caac.21149. [DOI] [PubMed] [Google Scholar]
- 2.Siegel R, Naishadham D, Jemal A. CA Cancer J Clin. 2012;62:10. doi: 10.3322/caac.20138. [DOI] [PubMed] [Google Scholar]
- 3.Yin W, Yan L, Yu J, Tian G, Zhou L, Zheng X, Zhang X, Yong Y, Li J, Gu Z, Zhao Y. ACS Nano. 2014;8:6922. doi: 10.1021/nn501647j. [DOI] [PubMed] [Google Scholar]
- 4.Scott AM, Wolchok JD, Old LJ. Nat. Rev. Cancer. 2012;12:278. doi: 10.1038/nrc3236. [DOI] [PubMed] [Google Scholar]
- 5.DeVita VT, Jr., Chu E. Cancer Res. 2008;68:8643. doi: 10.1158/0008-5472.CAN-07-6611. [DOI] [PubMed] [Google Scholar]
- 6.Elkhuizen PH, van de Vijver MJ, Hermans J, Zonderland HM, van de Velde CJ, Leer JW. Int. J. Radiat. Oncol. Biol. Phys. 1998;40:859. doi: 10.1016/s0360-3016(97)00917-6. [DOI] [PubMed] [Google Scholar]
- 7.Wang R, Billone PS, Mullett WM. J. Nanomater. 2013:2013. Article ID 629681. [Google Scholar]
- 8.Muthu MS, Singh S. Nanomedicine-UK. 2009;4:105. doi: 10.2217/17435889.4.1.105. [DOI] [PubMed] [Google Scholar]
- 9.Fan Z, Fu PP, Yu H, Ray PC. J. Food Drug Anal. 2014;22:3. doi: 10.1016/j.jfda.2014.01.001. [DOI] [PMC free article] [PubMed] [Google Scholar]
- 10.Tzeng SY, Green JJ. Ther. Deliv. 2013;4:687. doi: 10.4155/tde.13.38. [DOI] [PMC free article] [PubMed] [Google Scholar]
- 11.Bhaskar S, Tian F, Stoeger T, Kreyling W, de la Fuente JM, Grazú V, Borm P, Estrada G, Ntziachristos V, Razansky D. Part. Fibre Toxicol. 2010;7:3. doi: 10.1186/1743-8977-7-3. [DOI] [PMC free article] [PubMed] [Google Scholar]
- 12.Kang B, Afifi MM, Austin LA, El-Sayed MA. ACS Nano. 2013;7:7420. doi: 10.1021/nn403351z. [DOI] [PubMed] [Google Scholar]
- 13.Mohamed MS, Veeranarayanan S, Baliyan A, Poulose AC, Nagaoka Y, Minegishi H, Iwai S, Shimane Y, Yoshida Y, Maekawa T, Kumar DS. Macromol. Biosci. 2014 doi: 10.1002/mabi.201400248. DOI: 10.1002/mabi.201400248. [DOI] [PubMed] [Google Scholar]
- 14.Bamrungsap S, Zhao Z, Chen T, Wang L, Li C, Fu T, Tan W. Nanomedicine-UK. 2012;7:1253. doi: 10.2217/nnm.12.87. [DOI] [PubMed] [Google Scholar]
- 15.De. Jong WH, Borm PJA. Int. J. Nanomedicine. 2008;3:133–149. doi: 10.2147/ijn.s596. [DOI] [PMC free article] [PubMed] [Google Scholar]
- 16.Mamaeva V, Rosenholm JM, Bate-Eya LT, Bergman L, Peuhu E, Duchanoy A, Fortelius LE, Landor S, Toivola DM, Lindén M, Sahlgren C. Mol. Ther. 2011;19:1538. doi: 10.1038/mt.2011.105. [DOI] [PMC free article] [PubMed] [Google Scholar]
- 17.Bao G, Mitragotri S, Tong S. Annu. Rev. Biomed. Eng. 2013;15:253. doi: 10.1146/annurev-bioeng-071812-152409. [DOI] [PMC free article] [PubMed] [Google Scholar]
- 18.Subbiah R, Veerapandian M, Yun KS. Curr. Med. Chem. 2010;17:4559. doi: 10.2174/092986710794183024. [DOI] [PubMed] [Google Scholar]
- 19.Hoskins C, Min Y, Gueorguieva M, McDougall C, Volovick A, Prentice P, Wang Z, Melzer A, Cuschieri A, Wang L. J. Nanobiotechnol. 2012;10:27. doi: 10.1186/1477-3155-10-27. [DOI] [PMC free article] [PubMed] [Google Scholar]
- 20.Lee DE, Koo H, Sun IC, Ryu JH, Kim K, Kwon IC. Chem. Soc. Rev. 2012;41:2656. doi: 10.1039/c2cs15261d. [DOI] [PubMed] [Google Scholar]
- 21.Sotiriou GA. Wiley Interdiscip. Rev. Nanomed. Nanobiotechnol. 2013;5:19. doi: 10.1002/wnan.1190. [DOI] [PubMed] [Google Scholar]
- 22.Yu MK, Park J, Jon S. Theranostics. 2012;2:3. doi: 10.7150/thno.3463. [DOI] [PMC free article] [PubMed] [Google Scholar]
- 23.Accardo A, Tesauro D, Morelli G. Polym. J. 2013;45:481. [Google Scholar]
- 24.Ting G, Chang CH, Wang HE. Anticancer Res. 2009;29:4107. [PubMed] [Google Scholar]
- 25.Veeranarayanan S, Poulose AC, Mohamed MS, Varghese SH, Nagaoka Y, Yoshida Y, Maekawa T, Kumar DS. Small. 2012;8:3476. doi: 10.1002/smll.201200874. [DOI] [PubMed] [Google Scholar]
- 26.Mohamed MS, Veeranarayanan S, Poulose AC, Nagaoka Y, Minegishi H, Yoshida Y, Maekawa T, Kumar DS. Biochim. Biophys. Acta. 2014;1840:1657. doi: 10.1016/j.bbagen.2013.12.020. [DOI] [PubMed] [Google Scholar]
- 27.Poulose AC, Veeranarayanan S, Mohamed MS, Raveendran S, Nagaoka Y, Yoshida Y, Maekawa T, Kumar DS. J. Fluoresc. 2012;22:931. doi: 10.1007/s10895-011-1032-y. [DOI] [PubMed] [Google Scholar]
- 28.Aravind A, Veeranarayanan S, Poulose AC, Nair R, Nagaoka Y, Yoshida Y, Maekawa T, Kumar DS. BioNanoScience. 2012;2:1. [Google Scholar]
- 29.Li Z, Yin S, Cheng L, Yang K, Li Y, Liu Z. Adv. Funct. Mater. 2014;24:2312. [Google Scholar]
- 30.Allijn IE, Leong W, Tang J, Gianella A, Mieszawska AJ, Fay F, Ma G, Russell S, Callo CB, Gordon RE, Korkmaz E, Post JA, Zhao Y, Gerritsen HC, Thran A, Proksa R, Daerr H, Storm G, Fuster V, Fisher EA, Fayad ZA, Mulder WJM, Cormode DP. ACS Nano. 2013;7:9761. doi: 10.1021/nn403258w. [DOI] [PMC free article] [PubMed] [Google Scholar]
- 31.Sun Y, Zhu X, Peng J, Li F. ACS Nano. 2013;7:11290. doi: 10.1021/nn405082y. [DOI] [PubMed] [Google Scholar]
- 32.Wang Y, Gu H. Adv. Mater. DOI: 10.1002/adma.201401124. [Google Scholar]
- 33.Yu J, Yang C, Li J, Ding Y, Zhang L, Yousaf MZ, Lin J, Pang R, Wei L, Xu L, Sheng F, Li C, Li G, Zhao L, Hou Y. Adv. Mater. 2014;26:4114. doi: 10.1002/adma.201305811. [DOI] [PubMed] [Google Scholar]
- 34.Song G, Han L, Zou W, Xiao Z, Huang X, Qin Z, Zou R, Hu JA. Nano-Micro Letters. 2014;6:169. [Google Scholar]
- 35.Jiang J. Ann. J. Materials Sci. Eng. 2014;1:1. [Google Scholar]
- 36.Tian Q, Jiang F, Zou R, Liu Q, Chen Z, Zhu M, Yang S, Wang J, Wang, Hu J. ACS Nano. 2011;5:9761. doi: 10.1021/nn203293t. [DOI] [PubMed] [Google Scholar]
- 37.Fan J, Chu PK. Small. 2010;6:2080. doi: 10.1002/smll.201000543. [DOI] [PubMed] [Google Scholar]
- 38.Zhao W, Song C, Pehrsson PE. J. Am. Chem. Soc. 2002;124:12418. doi: 10.1021/ja027861n. [DOI] [PubMed] [Google Scholar]
- 39.Jia X, Li J, Wang E. Nanoscale. 2012;4:5572. doi: 10.1039/c2nr31319g. [DOI] [PubMed] [Google Scholar]
- 40.Kadajji VG, Betageri GV. Polymers. 2011;3:1972. [Google Scholar]
- 41.Knop K, Hoogenboom R, Fischer D, Schubert US. Angew. Chem. Int. Ed. 2010;49:6288. doi: 10.1002/anie.200902672. [DOI] [PubMed] [Google Scholar]
- 42.Pasut G, Veronese FM. Prog. Polym. Sci. 2007;32:933. [Google Scholar]
- 43.Lin J, Shigdar S, Fang DZ, Xiang D, Wei MQ, Danks A, Kong L, Li L, Qiao L, Duan W. PLOS One. 2014;9:e103736. doi: 10.1371/journal.pone.0103736. [DOI] [PMC free article] [PubMed] [Google Scholar]
- 44.Wijtmans M, Rosenthal SJ, Zwanenburg B, Porter NA. J. Am. Chem. Soc. 2006;128:11720. doi: 10.1021/ja063562c. [DOI] [PubMed] [Google Scholar]
- 45.Xu X, Qian J, Yu J, Zhang Y, Liu S. Chem. Commun. 2014;50:7607. doi: 10.1039/c4cc01717j. [DOI] [PubMed] [Google Scholar]
- 46.Liu Z, Lin Q, Huang Q, Liu H, Bao C, Zhang W, Zhong X, Zhu L. Chem. Commun. 2011;47:1482. doi: 10.1039/c0cc04676k. [DOI] [PubMed] [Google Scholar]
- 47.Roper DK, Ahn W, Hoenfner M. J. Phys. Chem., C. 2007;111:3636. doi: 10.1021/jp064341w. [DOI] [PMC free article] [PubMed] [Google Scholar]
Associated Data
This section collects any data citations, data availability statements, or supplementary materials included in this article.