

Abstract
To characterize the role of neurotrophin receptors on macrophages, we investigated the ability of nerve growth factor (NGF) and its precursor, proNGF, to regulate human macrophage phenotype. The p75 neurotrophin receptor (p75NTR) and TrkA were concentrated within overlapping domains on membrane ruffles. NGF stimulation of macrophages increased membrane ruffling, calcium spiking, phagocytosis and growth factor secretion. In contrast, proNGF induced podosome formation, increased migration, suppressed calcium spikes and increased neurotoxin secretion. These results demonstrate opposing roles of NGF and proNGF in macrophage regulation providing new avenues for pharmacological intervention during neuroinflammation.
Keywords: neurotrophin, inflammation, monocyte, calcium, actin, neurodegeneration
1. Introduction
Macrophages are dynamic cells that can express a wide range of phenotypes driven by external cues. The phenotypes range from strong inflammatory responses designed for elimination of invading pathogens to anti-inflammatory, protective and wound healing activities essential for tissue repair. To highlight the different functional states, many studies have focused on characterizing the phenotypes of macrophages as classically or alternatively activated based on their receptor composition, secretion profiles, morphology and response to external cues. Classically activated inflammatory macrophages have been shown to arise from interferon gamma (IFN-γ), tumor necrosis factor alpha (TNF-α), and lipopolysaccharide (LPS) stimulation leading to secretion of pro-inflammatory cytokines and chemokines, often with accompanying tissue damage. Alternative activation of macrophages is stimulated by interleukin-4 (IL-4), IL-10, transforming growth factor-β (TGF-β), or IL-13 and leads to the secretion of anti-inflammatory cytokines, chemokines, growth factors and other reparative factors(Laskin et al., 2011). In addition to these well characterized stimuli, macrophages in various tissues can be regulated by a wide array of external cues causing phenotypes that may intertwine these subgroups through mechanisms that are not fully understood.
A potentially important but poorly explored set of cues may be neurotrophic factors. Although it has been over two decades since the first studies identified neurotrophin interactions within the immune system,(Levi-Montalcini et al., 1996) our knowledge of their functions is limited. Multiple studies have documented expression of various neurotrophins and their receptors in macrophages suggesting that they may play a role in control of the innate immune system (Nakajima et al., 1998, Aronica et al., 2004, Artico et al., 2008, Barouch et al., 2001, Dowling et al., 1999, Elkabes et al., 1998, Levanti et al., 2001, Samah et al., 2008b, Tonchev et al., 2008). Relatively, few studies have looked closely at the functions of these receptors on macrophages. Most information regarding the functions of the neurotrophin receptors comes from studies in the nervous system where neurotrophins are important factors for development, maintenance, survival and differentiation of neurons(Reichardt, 2006). The neurotrophin family includes nerve growth factor (NGF), brain derived neurotrophic factor (BDNF), neurotrophin-3 (NT-3) and neurotrophin-4 (NT-4). Neurotrophins bind to tyrosine protein kinases known as tropomyosin related kinase (Trk) receptors, TrkA (NGF), TrkB (BDNF and NT-4), and TrkC (NT-3) with high affinity. An additional member of the neurotrophin receptor family, the p75 neurotrophin receptor (p75NTR) is a member of the tumor necrosis receptor family and binds all neurotrophins with low affinity. The neurotrophin receptors function as homomeric or heteromeric complexes, providing opportunities for various signaling actions. The p75NTR in particular can interact with any of the Trk receptors where it facilitates receptor activation by increasing the affinity of mature neurotrophin binding.
The neurotrophins are synthesized as precursors (pro-neurotrophins) that must be processed by proteolysis to form the mature protein. All pro-neurotrophins (proNGF, proBDNF, proNT3, proNT4) bind the p75NTR when it associates with alternative co-receptors such as sortilin. Signaling of mature and pro-neurotrophins through their respective receptors often have opposing effects in target cells. Mature neurotrophin signaling has been associated with neuronal survival, growth and differentiation while proNGF signaling often leads to neuronal degeneration and apoptosis (Hempstead, 2009, Ibanez, 2002). These differences have led to the hypothesis that the balance of pro-neurotrophins versus mature neurotrophins may regulate the course of neurodegenerative diseases (Hempstead, 2009). Regulation of macrophage and microglial functions by neurotrophins may be particularly important in the nervous system where neurotrophin expression is high. In addition to neurons macrophages also secrete neurotrophins. Neurotrophin mRNA expression has been documented in microglial/macrophages in multiple sclerosis plaques (Dowling et al., 1999) as well as HIV-infected macrophages (Samah et al., 2009). NGF has been shown to increase CXCR4 mediated migration of macrophage precursor cells, monocytes (Samah et al., 2008b) and to induce the secretion of plasminogen and urokinase-type plasminogen activator from microglia (Nakajima et al., 1998). No studies have yet compared the functional activation of these receptors by pro- versus mature neurotrophins. The following studies were designed to further characterize the expression of neurotrophin receptors on human monocytes and monocyte-derived macrophages (hMDM) and determine the functional role of mature versus pro-neurotrophins. We show that monocytes and macrophages express both p75NTR and TrkA within the same membrane domains and exhibit very different phenotypes in response to mature NGF and proNGF.
2. Materials and Methods
2.1 Isolation and culture of human monocyte-derived macrophages
Human buffy coat leukocytes were purchased and shipped within 24 hours after blood draw from healthy donors at the New York Blood Center (http://nybloodcenter.org/), a non-profit organization for the collection and distribution of blood for clinical and research purposes. All research use was screened by the center and no personal identifiers were sent with the shipment. Blood was diluted 1:1 with phosphate buffered saline (PBS) and was layered on top of Ficoll-Paque (GE Healthcare 17-1440-03). Blood/Ficoll-plaque was centrifuged at 500 × g for 25 min and the peripheral blood mononuclear cells (PBMCs) were collected from the PBS/Ficoll-Paque interface. PBMCs were washed in red blood cell lysis buffer (Sigma R7757) to remove any red blood cell contamination. PBMCs were centrifuged at 450 × g, the supernatant aspirated and the pellet re-suspended in Dulbecco's modified eagle medium (DMEM) with high glucose, 10% fetal bovine serum (Gibco 160000-044) and 20 μg/ml gentamicin (Gibco 15750-60). Cells were aliquoted into low adhesion 6 well plates (Corning 3471) at a density of approximately 107 cells/well. PBMCs were cultured for 5-7 days to allow monocyte attachment. Remaining white blood cells were washed, from the plate yielding a pure monocyte/macrophage culture. The adherent cells were differentiated into monocyte-derived macrophages (hMDM) using human GM-CSF (15 ng/ml) in complete DMEM for one week. Monocyte experiments were carried out within 1 hour of PBMC isolation to prevent cell attachment.
2.2 Primary cultures of rat forebrain
All animal work was done in accordance with NIH animal welfare guidelines and was approved by the University of North Carolina- Chapel Hill Institutional Animal Care and Use Committee (approval number 14-147.0). Timed gestational embryonic day 9 (E9) pregnant female Long-Evans rats were delivered from Charles Rivers and allowed to rest in UNC animal husbandry until the time of experiments. At gestational day E17, rats were sacrificed by anesthetizing with isoflurane until breathing and heart stopped. The uterus was removed, rinsed briefly in 70% ethanol and placed in HEPES-buffered Hank's balanced salt solution (HBSS) on ice. The brain was removed from each fetus, extensively washed, and the cortex/hippocampus was dissected from each brain and cleaned of dura-arachnoid membrane and visible vessels. The tissue was transferred to a 15 ml tube containing 5 ml calcium-magnesium free-HBSS + 2.4 U/ml dispase + 2 U/ml DNase I and incubated for 25-30 min at 36° C. Tissue was triturated and allowed to settle for 2 min. The suspended cells were transferred to a 50 ml culture tube containing 25 ml of minimum essential medium (MEM) with glutamine + 10% fetal bovine serum + 20 μg/ml gentamicin. After several rounds of trituration in 2-3 ml fresh calcium-magnesium free HBSS, dissociated cells were seeded at a density 20,000 cells/cm2 on poly-D-lysine-treated coverslips for imaging and staining or 50,000-100,000 cells/cm2 in 100 mm plastic dishes for Western blots. After 24 hours, cultures were transferred to Neurobasal medium with B27 supplement. The resulting cultures were >95% neurons at day 4 after seeding.
2.3 Immunostaining
Differentiated hMDM grown on poly-D-lysine coated coverslips were transferred to DMEM containing 1% FBS and stimulated for 1 or 24 hours using three different conditions: NGF human recombinant protein (100 ng/mL, Sigma N1408), proNGF human recombinant protein targeted to high affinity sites (1 ng/ml, Alamone N-280), or vehicle. The cells were gently washed and fixed in 2% paraformaldehyde in PBS. Cells were washed 3× in PBS and incubated in 3% normal goat serum for one hour. Incubation of primary antibodies was carried out overnight at 4° C. Cells were stained using antibodies to: p75NTR (Millipore cat #07-476, 1:500), TrkA (Santa Cruz cat #SC-80961, 1:500), TrkB (Millipore 07-225, 1:500), TrkC (Santa Cruz SC14025, 1:500) and sortilin (Millipore AB9712, 1:500). Cells were washed in PBS and incubated with species specific secondary antibodies conjugated to Alexa 488, 568 or 593 (Molecular Probes) in the dark for 1 hour at room temperature. Coverslips were then mounted using Fluoromount (Southern Biotech 0100-01) and digitally imaged on an Olympus XI71 microscope.
Analysis of stain intensity and morphology for individual cells or regions of interest within the cells was accomplished using Metamorph software. Co-localization of p75NTR foci with TrkA or sortilin staining was analyzed by staining one receptor red and the other green followed by thresholding by intensity of stain, computer identification of stained objects and then documentation of each object's central X/Y coordinate for each wavelength. Objects with X/Y coordinates that overlapped within 0.46 microns were scored as co-localized.
2.4 F-actin and live-dead stains
F-actin was stained using Alexa488 phalloidin (1:50, Molecular Probes) to show structural changes. Podosomes were visible in the hMDM as small, intensely fluorescent puncta whereas ruffles appeared as moderate to brightly stained extensions of the membrane. Cell viability was assessed by incubating cells with the live cell stain, calcein AM (1 μM, Invitrogen/Molecular Probes) and the dead cell nuclear stain, ethidium homodimer (1 μM, Invitrogen/Molecular Probes), for 30 min at 36°. Cells were washed with aCSF and imaged live. Healthy macrophages with bright green fluorescence were counted. The unstained “ghosts” of dead cells were often visible and were counted separately. The number of ethidium stained nuclei was counted to quantify dead cells with multinucleated cells counted as a single cell. Some ethidium stained cells were observed floating on the surface which were difficult to quantify. Thus, the count of live cells was preferentially used as the best index of cell survival. Some cultures were fixed with 2% paraformaldehyde and stained with 100 nM bisbenzimide to assess total and condensed, fragmented, apoptotic nuclei.
2.5 Western blots
Human monocyte-derived macrophages were stimulated with NGF or proNGF for time periods of 0, 10, 30, 60 min and 1 day. At the appropriate time, cells from two 60 mm or one 100 mm dish were harvested using 1.5 ml lysis buffer (1× Ripa buffer (Thermo Scientific 89900), 1 mM phenylmethylsulfonyl fluoride (PMSF, Pierce Chemicals PI 36978), 1:100 Halt® protease inhibitor cocktail (Thermo scientific cat# 1861228). Protein concentration was measured by BCA assay (Thermo Scientific 23225). Protein lysate was resolved on SDS-Page gels (Biorad cat# 456-1034) and transferred to a nitrocellulose membrane (Biorad 162-0112). The membranes were blocked in 2% Bovine Serum Albumin (BSA, Sigma BP1605-100), Odyssey Blocking Buffer (1:1 dilution, Licor 927-40000 for Odyssey) and PBS or milk plus 0.01%Tween (for film) for one hour at room temperature. The primary antibodies were incubated overnight at four degrees. The membranes were then washed in PBS+1% Tween and incubated in secondary antibody for one hour at room temperature. The membranes were washed again and imaged using the Odyssey or film imaging system. The primary antibodies used were 1:500 p75NTR (Millipore 07-476), 1:500 TrkA (Santa Cruz SC80961), 1:1000 Akt (Cell Signaling 9272S), 1:1000 pAkt (Millipore 05-1003). Secondary Antibodies were goat anti-rabbit 680RD (Licor 926-68071) and donkey anti-mouse 800CW (Licor 926-32212), for Odyssey. Film was processed using hoseradish peroxidase (HRP) conjugated secondary antibody and SuperSignal West Pico detection (Thermo Scientific, #34080). .
2.6 Phagocytosis of fluorescent beads
Human MDMs were stimulated overnight in 1% DMEM with NGF or proNGF. Fluorescent 1 micron beads (Molecular Probes/Invitrogen F-8887) were placed into each well for 4 hours at a concentration of 4.3 × 10⁵/beads ml. Excess beads not phagocytosed by hMDMs were washed from the plate. The hMDMs were stained with the live cell stain calcein AM (1 μM, 20 min) and digital images of the live cells were captured at a magnification of 674×. Some cells were then fixed in 2% paraformaldehyde and stained with phalloidin-Alexa488 (1:50). Cells were individually traced and Metamorph software was used to measure the number of beads in each cell for each condition. The bead density was calculated by dividing the number of beads by the area of the cell. The average bead density was then calculated and compared between the treatment conditions.
2.7 RT-PCR
The hMDM were stimulated in DMEM with 1% FBS plus NGF or proNGF overnight. Cells were lysed using Trizol Reagent (Invitrogen 15596-026) and RNA was purified according to RNeasy protocol (Qiagen cat# 74104). Reverse transcription was carried out according to SuperScript III First-strand Synthesis Kit (Invitrogen cat# 18080-051). The reaction was performed using an ABI 7500 system (Applied Biosystems) and Absolute SYBR Green Rox mix (AB-1163/A). mRNA levels were determined by the cycle threshold. The results were normalized to GADPH. Primers used were TrkA (Forward: 5’ATG CTG CGA GGC CAG CGG CA 3’ Reverse:5’ CCT GAC AGG GTC AAG TCC TG 3’), TrkB (Forward: 5’ CTG GAC CAC GCC AAC TGA CAT 3’ Reverse: 5’ GCA TCG GGC CCG CCC TCC GAA 3’), p75NTR (Forward: 5’ ATC TTG GCT GCT GTG GTT G 3’ Reverse: 5’ TGT AGA GGT TGC CAT CAC CC 3’), GADPH (Forward: 5’ CCC ATC ACC ATC TTC CAG GA 3’ Reverse: 5’ TTG TCA TAC CAG GAA ATG AGC 3’).
2.8 Transmigration Assay
Following an overnight stimulation of hMDMs with NGF or proNGF in DMEM with 1% FBS, cells were harvested by incubating in ice-cold calcium-, magnesium-free HBSS for approximately 20-30 minutes to facilitate release of the hMDM from the low adhesion plate. Cells were washed from the plate with a 1 ml Rainin pipette using the flow of medium from the tip of the pipette to dislodge any remaining cells. The hMDM were centrifuged at 80 × g for 5 min, the supernatant carefully aspirated and the soft pellet was re-suspended in DMEM containing 1% FBS. The cells were counted and seeded into 8.0 micron Matrigel invasion chambers (BD Biocoat cat# 354480) at a density of105 cells/chamber. Migratory behavior was measured by the number of cells entering the bottom chamber which also contained DMEM with 1% FBS. Cells in the bottom chamber were labeled with the fluorescent live cell marker calcein AM (Life Technologies, C3100MP, 1 μM 20 minutes) and counted at 1 and 3 days after seeding.
2.9 Flow Cytometry
PBMCs and hMDMs were stimulated with NGF or proNGF in 1% DMEM for 1 hour (PBMCs) or overnight (hMDM). Cells were removed from low adhesion wells and centrifuged for 5 minutes at 450 × g. Cellular pellets were re-suspended and fixed in a Fluorfix solution (Biolegend 420801) for 20 minutes at room temperature. Fixed cells were then treated with permeabilization buffer (EBioscience 020-8333-56) and centrifuged for five minutes at 450 × g at 4° C. The wash step was repeated followed by re-suspension in 100 μl of permeabilization buffer plus antibody (1.5 μl p75; Alomone Labs ANT-007-F and 20μl; TrkA R&D Systems FAB1715P; 5μl CD 206 Biolegend 321114; 5μl CD16 Biolegend 302008 and 5μl CD 163 Biolegend 333607) at room temperature for twenty minutes. The stained cells were washed three times in cell staining buffer (Biolegend 420201). Flow cytometry was performed on a FACS Calibur (Becton Dickinson, San Jose, CA) using direct immunofluorescence with at least 100,000 events. Monocytes were determined by populations of cells with high forward scatter and low side scatter. All cells were gated to remove debris. Three color staining analysis was utilized. Cells were analyzed according to side scatter and receptor bound fluorescence, and data was collected with logarithmic amplifiers. Fluorescence spillover compensation was estimated using single-stained and unstained samples with the Cell Quest software (BD). After collection, data was further analyzed with FlowJo software (TreeStar Inc., Ashland, OR).
2.10 Protein profiles of macrophage conditioned medium
The hMDMs were chronically stimulated for 3 days in 1% DMEM with NGF or proNGF. Medium was collected and centrifuged at 400 × g for 5 minutes to remove any floating cells in the medium. The cell free medium was added to a RayBiotech human antibody array L-507 and processed according to the RayBiotech Biotin Label-based human antibody array protocol. Slide arrays were scanned using an Agilent technologies DNA microarray scanner and the analysis was carried out using MetaMorph® software. Internal negative controls were used to establish basal fluorescence and variation across the array. The minimum detectable fluorescence signal was set at 3.2 standard deviation units above the average background to give a probability of 0.001 that a protein signal would be identified as positive by chance. The linearity of signal detection was verified from internal positive standards. Since signal intensity varied between different arrays, protein expression was normalized to the total signal for all proteins on the array and expressed as a relative optical density value to indicate the strength of each signal. Expression of each protein was compared for NGF or proNGF versus matched untreated controls. A comparison of NGF versus proNGF was then run to determine if the pro and mature peptides activate different secretory pathways. Proteins on the array that met the cutoff for a significant change were clustered into functional groups using David software (Huang da et al., 2009b, Huang da et al., 2009a) and the relative enrichment of various functional classes determined taking into account the focused nature of the array. Based in part on this information, specific functional subgroups were analyzed in greater detail to determine which classes of proteins were preferentially modified by NGF or proNGF.
2.11 Neurotoxicity of macrophage-conditioned medium
Pilot studies indicated that a 30 minute stimulation of hMDM was sufficient to induce secretion of toxic factors which persisted for several hours after removal of the stimulus. Thus, the cells could be primed with neurotrophin, washed and the neurotrophin free medium subsequently tested for activity. Macrophages were stimulated with NGF or proNGF in serum free DMEM for 30 minutes. The medium was then replaced with serum free DMEM and the medium collected after 1 hour or 24 hours. The macrophage-conditioned medium (MCM) was centrifuged at 2500 rpm for 10 minutes to remove any cells and then frozen in aliquots at −80° C. The neurotoxic activity of the medium was tested on primary rat neurons cultured on coverslips. Neurons at 6-12 days in vitro were loaded with the calcium indicator, Fluo-4 AM (2 μM, Molecular Probes, Inc., Eugene, OR) in aCSF (aCSF: NaCl 137 mM, KCl 5.0 mM, CaCl2 2.3 mM, MgCl2 1.3 mM, glucose 20 mM). After 30 minutes, the coverslip was transferred to a specialized stage for imaging. Cells were maintained in aCSF and time lapse digital images were captured automatically by the MetaMorph® System. Images were captured every 6 seconds for 6 minutes to assess acute effects and every min for 60 minutes to assess delayed effects. Three pre-stimulation measurements were taken to establish basal levels of fluorescence at the beginning of each experiment. Neurons were stimulated with MCM at a 1:5 dilution. The increase in fluorescence intensity within each cell was then measured relative to the baseline fluorescence to correct for cell to cell differences in dye loading and intrinsic fluorescence. For most studies, cellular responses were averaged across all cells from at least triplicate runs to provide an indication of the “typical” response. In some cases individual cell response patterns are shown where the average masked important cell-specific profiles.
2.12 Macrophage calcium responses to NGF and proNGF
Macrophages cultured on coverslips were incubated with NGF or proNGF and the calcium indicator, Fluo-4 AM in aCSF for 30 minutes. Time lapse digital images were captured automatically and changes in fluorescence intensity within each cell measured as described above.
2.13 Statistical analyses
Graphpad Prism software was used for data summaries and graphics. Parametric statistics were used to evaluate most changes induced by NGF or proNGF relative to matched or unmatched control samples depending on the experiment. In cases where the data were not normally distributed non-parametric statistics were used. Means ± standard error of the mean were calculated for at least three replicate experiments. T-tests were used for paired comparisons, analysis of variance with repeated measures for temporal data and Chi-square for the analysis of cell populations as indicated. A probability of <0.05 for rejection of the null hypothesis was considered significant.
3. Results
3.1 Macrophages display distinctly different morphological phenotypes in culture
In culture, hMDM exhibited different morphologies which were, in part, dependent on the culture and stimulation conditions. Examples of prevalent morphological features are summarized in Figure 1. Three major structural features were identified which were found to correlate with macrophage phenotype: 1) ruffled membranes on the surface and edges of the cell and cellular processes (Fig 1A, arrows), 2) “fried egg” morphology with finger-like projections along the outer edges of the membrane (Fig 1B, arrow) and 3) flat ameboid cells with few readily visible membrane specializations (Fig 1C). The full range of morphologies could often be seen in the same culture although under particular stimulus conditions a single morphological type typically predominated. Occasionally, individual cells would display a combination of the above features although a single feature would usually dominate. To provide insight into the potential functional role of these specializations, each morphological feature was related to particular macrophage phenotypes described below.
Figure 1.
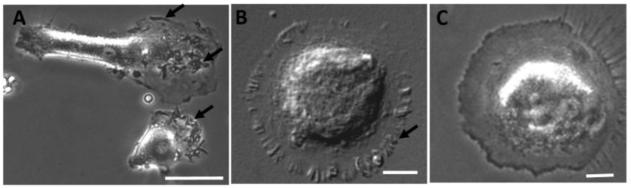
Varied appearance of human monocyte-derived macrophages (hMDM) in culture. A-C. Bright field images of hMDMs in culture illustrating ruffled membranes (A, arrows), flat, fied egg-like morphology with finger like folds in the outer membrane (B, arrow) and flat ameboid appearance with few membrane specializations (C). Scale bar = 20 μm in all images.
3.2 TrkA and p75NTR are co-localized to discrete domains on macrophages
To investigate the expression and localization of neurotrophin receptors, we stained hMDMs for each class of neurotrophin receptor. Strong focal expression of p75NTR (Fig 2A) and TrkA (Fig 2B) was seen in regions of the macrophages containing ruffles (Fig 2C, arrow) or finger-like membrane specializations (see Fig 6). Although both receptors were expressed within the same structural domain, p75NTR expression was typically more focal and surrounded by a more diffuse TrkA stain (Fig 2D). TrkA and p75NTR staining were also seen in small endosome-like structures throughout the cell (Fig 2D, arrowhead). TrkB immunoreactivity was low with little or no expression localized to ruffles (Fig 2E, arrow) and occasional staining in endosomal-like structures (Fig 2E, arrowhead). Staining for TrkC was consistently negative as were control hMDM stained with secondary antibody in the absence of primary antibody (Fig 2F). It is notable that the structural specializations were highly dynamic. Even washing the cells too aggressively could trigger changes in shape and morphology as well as the ability to detect foci of both p75NTR and TrkA. It was difficult to unambiguously identify staining in large flat cells that had no clear membrane specializations (Fig 2G, outline of cell marked with dashed lines). Overall, the percentage of macrophages with readily identifiable staining was 47.4% p75NTR-positive and 44.3% TrkA-positive. Macrophage expression of p75NTR and TrkA was confirmed by Western blot (Fig 2H). RT-PCR also verified mRNA transcript for p75NTR and TrkA with comparable delta cycle thresholds for each receptor (11.54 ± 0.54 and 11.95 ± 0.84, respectively). Consistent with the staining results, weak or no significant mRNA expression was detected for TrkB or TrkC.
Figure 2.

Neurotrophin receptors p75NTR and TrkA were concentrated in discrete domains on human macrophages. A-C. A single macrophage stained for p75NTR (A, red), TrkA (B, green) illustrating the localization of immunoreactivity to ruffled areas . C. DIC image overlay showing the merged receptor stain for p75NTR(red) and TrkA (green) associated with membrane ruffles on the surface of the macrophage. D. Highly magnified view of the outer edge of a macrophage showing p75NTR (red) immunoreactivity surrounded by more diffuse labeling of TrkA (green). Immunoreactivity for p75NTR and/or TrkA was seen in endosome like structures (arrowhead) at these foci as well as throughout the cell. E. Immunoreactivity for TrkB was typically weak with little expression at membrane specializations (arrow). However, a few cells showed immunoreactivity in endosome-like structures (arrowhead). F. hMDMs stained with secondary antibody in the absence of specific primary antibody showed no significant immunoreactivity. G. hMDM with no expression of p75NTR or TrkA within the cell or along the outer membrane (membrane border identified with a dashed line). The cell is adjacent to a stained cell illustrating the variable nature of the expression of p75NTR and TrkA. H. Western blot of hMDM lysate confirming immunoreactive bands at 75 kDa and 140 kDa for p75NTR and TrkA, respectively.
Figure 6.

Neurotrophin Receptors p75NTR and TrkA are co-localized to the same microdomains on hMDMs. A. Immunoreactivity of TrkA (green), p75NTR(red) and co-localized foci of p75NTR and TrkA (yellow, merged) found on finger-like membrane specializations of hMDMs. At higher magnification (inset) the partial overlap of p75NTR and TrkA can be seen indicating that the two receptors are closely associated but only occasionally within the same microdomain. B. The proportion of TrkA labeling co-localized to p75NTR at a resolution of 0.46 μm was increased after 24 h treatment with 100 ng/ml NGF compared to control and 1 ng/ml proNGF (** p's < 0.001). A smaller yet significant increase in co-localization of TrkA and p75NTR was seen with proNGF (*p<0.001).
Since p75NTR and TrkA are potential signaling partners, the extent of co-localization of p75NTR and TrkA was determined in double-stained macrophages. At the whole cell level, 56.3 ± 8.0% of the hMDM expressed both TrkA and p75NTR. However, to determine if TrkA and p75NTR were co-localized to the same microdomains, the overlap of the stained foci was determined with a resolution of ± 0.46 μm using MetaMorph® software. TrkA was co-localized to 15.7 ± 4.8% of the p75NTR foci (range 4.9 to 33.6%). Some of the co-localization of p75NTR and TrkA was seen in small endosome-like structures. Thus, while p75NTR and TrkA were expressed in the same general location in most cells (e.g. Fig 2C) only a subset of the receptors overlapped.
3.3 p75NTR and TrkA are expressed on monocytes
Expression of p75NTR and TrkA on hMDM was confirmed with flow cytometry using a different set of antibodies. By flow cytometry, 53.0 ± 8.5% of the macrophages were p75+ and 14.1 ± 1.7% were TrkA+. To explore whether p75NTR and TrkA were also present on monocytes, the precursors of mature macrophages, we used flow cytometry to measure the expression on freshly isolated PBMCs from healthy donors. Cells were stained and analyzed from seven separate donors with similar results. On average, 59.2 ± 14.9% of the gated monocyte subset were p75+ and 29.5 ± 12.6% were TrkA+. The p75NTR expression was similar to the expression seen on the macrophages whereas TrkA expression was higher on the monocytes. The cellular co-localization of p75NTR and TrkA by flow indicated that, on average, 88.8% of the TrkA+ monocytes were also positive for p75NTR. This was slightly higher than the 56.3% cellular co-expression seen in the immunostained hMDM.
The above results established the expression of p75NTR and TrkA under normal culture conditions. The presence of both p75NTR and TrkA suggested that macrophages may be subject to the differential actions of NGF and proNGF as suggested for neurons. Therefore, we assessed responses to stimulation with NGF or proNGF to determine determined how these neurotrophins influence the phenotype and functions of the macrophages.
3.4 Survival versus death in human monocyte derived macrophages
To determine if neurotrophins support survival of macrophages as they do for neurons, hMDM were cultured in serum free medium in the presence or absence of various concentrations of NGF (0, 3, 10, 30 or 100 ng/ml). After 28-32 hours, hMDM were stained with the live cell marker, calcein AM, imaged, and normalized to control hMDM maintained in medium containing 10% FBS. The percentage of live, healthy hMDMs stimulated with NGF in culture medium lacking serum increased in a dose dependent manner from 38.1 ± 10.7% at 0 ng/ml NGF to 101.2 ± 6.0% at 100 ng/ml NGF (Fig 3A) with an estimated EC50 of 14.0 ng/ml. A separate set of hMDM maintained in medium containing 10% FBS and stimulated with each concentration of NGF showed no changes at any concentration with a mean survival of 100.6 ± 2.2% (relative to control hMDMS). In parallel with the survival data, a dose-dependent decrease in ethidium homodimer staining was seen with maximal protection at 100 ng/ml NGF (not shown).
Figure 3.

Neurotrophins promote cell survival in hMDMs. A. NGF increases survival of hMDMs in a dose-dependent fashion (0 ng/ml,3 ng/ml,10 ng/ml,30 ng/ml and 100 ng/ml) with an estimated EC50 =14.0 ng/ml. B. Time course (0,10, 30, 60, 240 min) of changes in the ratio of pAKT: total AKT levels after addition of 100 ng/ml NGF or 1 ng/ml proNGF. Phosphorylation (activation) of AKT determined from quantification of bands in western blots was increased with NGF or proNGF in each of five different runs followed by recovery although magnitude and timing of peak response varied between runs. Results are expressed as mean ± sem. treatment effect over time (p=0.03, two-way ANOVA and Wilcoxin signed rank test of peak response, p's = 0.031). C. Live cultures of treated or untreated hMDM were stained with the dead cell marker, ethidium homodimer. The total number of dead cell nuclei stained with ethidium was low and was not changed after 1 day stimulation with 100 ng/ml NGF or 1ng/ml proNGF. D. The same cultures of hMDMs were fixed and counterstained with the nuclear stain bis-benzamide to reveal apoptotic nuclei. The number of condensed, fragmented apoptotic nuclei was very low and did not change after stimulation with 100ng/ml NGF or 1ng/ml proNGF.
The pro-survival actions of NGF were consistent with the phosphorylation of Akt, a known pathway for NGF mediated survival in neurons. However, as illustrated in Fig 3B, stimulation with NGF or proNGF both resulted in a time-dependent increase in phosphorylation of Akt (33.2 ± 7.0% and 69.0 ± 31.2%, maximal increase respectively, p=0.032) relative to controls, followed by recovery (Fig 3B). This suggested that neurotrophin receptors p75NTR and TrkA both mediate pro-survival functions on hMDMs.
Since signaling of pro-neurotrophins through the p75NTR receptor can promote cell death in neurons, we stained hMDMs stimulated with neurotrophins overnight with the dead cell marker ethidium homodimer and then fixed the cells in 2% paraformaldehyde before staining with the nuclear stain bisbenzimide to identify all nuclei as well as apoptotic nuclei. On average, 10.1 ± 1.4% of the hMDM nuclei stained positive for ethidium homodimer. This value did not change significantly after overnight treatment with 1 ng/ml proNGF (9.6 ± 1.2%) or 100 ng/ml NGF (12.2 + 2.2%) (Fig 3C). Condensed and/or fragmented nuclei represented 7.2 ± 1.1% of the total population in the vehicle-treated cells and also did not change with proNGF or NGF treatment (6.5 ± 1.0% and 7.3 ± 1.2%, respectively; Fig 3D).
3.5 Expression of the p75NTR and TrkA in monocytes and macrophages stimulated with NGF or proNGF
To investigate whether neurotrophin stimulation of human monocytes or macrophages would alter neurotrophin receptor expression, we stimulated hMDM with 100 ng/ml NGF or 1 ng/ml proNGF for 24 hours and analyzed receptor expression by flow cytometry (Figure 4A). Untreated cells were 53.0 ± 8.5% p75+ and 14.1 ± 1.7% TrkA+. NGF stimulation of hMDMs resulted in a small but significant decrease in p75NTR expression relative to both controls (−20.4 ± 7.3%, p=0.046) and proNGF (−22.5%, p=0.053). Expression of TrkA was not significantly affected (−11.2 ± 16.8%). Treatment with proNGF did not have a significant effect on p75NTR or TrkA expression (+2.6 ±.08% and +0.6 ±13.6%, respectively).
Figure 4.

Neurotrophin receptor expression on hMDM and monocytes quantified by flow cytometry. Receptor expression of TrkA and p75NTR was assessed by flow cytometry analysis on cultured hMDM (A) and freshly prepared human PBMCs (B). A. hMDM stimulated with 1 ng/ml proNGF or 100 ng/ml NGF for 1 day had no effect on TrkA expression. NGF stimulation slightly reduced p75NTR expression. B. Human monocytes stimulated with 100 ng/ml NGF or 1ng/ml proNGF for 1 hr showed no significant change in cells expressing p75NTR or TrkA. **p=0.046 relative to control and p=0.053 relative to proNGF.
Freshly isolated PBMCs were also stimulated with NGF or proNGF for 1 hour and total gated monocytes were analyzed. Untreated cells were 59.2 ± 14.9% p75+ and 29.5 ± 12.6% TrkA+. NGF and proNGF did not affect p75NTR or TrkA total expression (Figure 4B). However, as illustrated in Figure 5, monocytes positive for p75NTR (Fig. 5A) or TrkA (Fig. 5B) could be subdivided into two subpopulations expressing low and high receptor content. NGF stimulation slightly increased the proportion of TrkAhigh expressing monocytes (Fig 5C) compared to both matched controls (+14.1 ± 21.6% p=0.021) and proNGF (21.6% p=0.02). ProNGF stimulation did not affect the p75high or TrkAhigh populations (Fig 5C).
Figure 5.
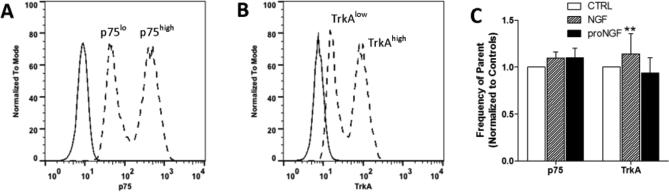
Monocytes expressed high and low levels of p75NTR and TrkA. A. Representative histogram of p75NTR low and high populations seen in monocytes (dashed lines) relative to unstained cells (solid line). B. Representative histogram of TrkA low and high populations (dashed lines) seen in monocytes relative to unstained cells (solid lines). C. Monocytes stimulated with 100 ng/ml NGF or 1 ng/ml proNGF for 1 hr had no effect on the proportion of p75high expressing monocytes. NGF stimulation induced a small but significant increase in monocytes with high expression of TrkA. ** p=0.021 relative to controls and p=0.02 relative to proNGF.
3.6 Co-localization of the p75NTR and TrkA on hMDM is influenced by NGF and proNGF
At the cellular level by flow cytometry we did not see a significant difference in p75NTR/TrkA co-expressing cells; however we sought to understand whether regional co-localization of p75NTR and TrkA immunoreactivity within individual hMDM was sensitive to neurotrophin stimulation. Cultured hMDMs were double stained for p75NTR and TrkA and the overlap of the staining (Figure 6A) was analyzed at a resolution of 0.46 μm (Merged inset). In the absence of stimulation, an average of 15.7 ± 4.8% of p75NTR staining co-localized to TrkA foci (Fig 6B). When the hMDM were exposed to NGF or proNGF, co-localization of TrkA with p75NTR increased significantly to 60.0 ± 2.4% and 30.4 ± 5.1%, respectively, (p<0.001 for both). The co-localization of p75NTR and TrkA induced by NGF was twice that of proNGF (p<0.001) indicating a preferred mobilization of these receptors to the same domain by NGF. The double-labeled profiles were typically seen in ruffled regions and small endosome-like structures as described above (Figure 2).
3.7 Sortilin receptor expression on hMDM
A well-recognized action of proNGF in some cell types is fostered by the interaction between p75NTR and the sortilin receptor. To determine if sortilin receptors were also present on human macrophages, we evaluated its expression by immunostaining. Sortilin was expressed at moderate levels on hMDMs, typically in small focal regions associated with ruffles (Figure 7A). A low level of diffuse stain was often seen throughout the cell. High to moderate sortilin expression was seen in approximately 43% of the cells whereas 57% of cells showed weak staining. Since the focal expression of sortilin on ruffles was similar to p75NTR expression (green), double staining was performed to co-localize the p75NTR and sortilin receptors (Figure 7A, co-localized and Figure 7B). On average 16.3 ± 1.4% of the p75+ foci overlapped with sortilin (arrows). However, the degree of overlap within each cell varied widely from 0 to 100%. Most cells (86%) had less than 20% overlap of the two receptors. Treatment of the hMDM with NGF or proNGF had differential effects on sortilin expression and co-localization with p75NTR. NGF increased the co-localization of p75NTR with sortilin by 104% (Fig. 7B, p<0.001) relative to controls and 42.6% relative to proNGF (p<0.001; arrows, Fig 7B). ProNGF also significantly increased co-localization relative to controls by 49.8% (p<0.001, Fig 7B). Treatment with NGF and proNGF had similar effects on co-localization of the receptors at 24 hrs indicating that the effects were relatively rapid and persistent. Total sortilin expression, based on the fluorescence stain intensity, was slightly (−10%) yet significantly reduced by NGF (Fig. 7C, p<0.001) but increased 36.8% by proNGF relative to controls (Fig 7C, p<0.001) and 50.8% relative to NGF (p<0.001). As noted above, these conditions did not lead to an increase in cell death suggesting that interactions with sortilin may serve other functions.
Figure 7.

Sortilin Receptors are expressed and co-localize with p75NTR on hMDMs. A. Example of focal immunostaining for sortilin (Red) and p75NTR (Green) in control hMDM and hMDM treated with 100 ng/ml NGF or 1 ng/ml proNGF for 1 h. Many p75NTR foci were not co-localized with sortilin. B. Overlap of p75NTR and sortilin staining was quantified as in Figure 5. NGF (100 ng/ml) and proNGF (1 ng/ml) stimulation increased sortilin co-localization with p75NTR (6A arrows) compared to control (**p<0.001 relative to control). C. Sortilin immunoreactivity expression intensity was increased after 1 h stimulation with 1 ng/ml proNGF but not 100 ng/ml NGF (**p<0.001 relative to control or NGF; 6A, ProNGF arrow). Results are expressed as mean ± sem.
3.8 Neurotrophin modification of macrophage structure
To view changes in macrophage structure as a result of neurotrophin stimulation, cultured hMDM were stimulated with NGF or proNGF for a period of 1 hour or 24 hours followed by fixation in 2% paraformaldehyde and staining for F-actin with phalloidin-Alexa488. Structural changes were seen within the first hour after stimulation. Examples of the appearance of the hMDMs are illustrated in Figure 8A. F-actin (green) is shown as well as the presence of red fluorescent beads which were used to measure phagocytosis (Fig 9A). Vehicle-treated control cultures initially contained a mixture of cells with podosome-like structures (22.9% of cells, Fig 8A, podosome rich), focal ruffles (37.0% of cells, Fig 8A, ruffled), or no distinctive membrane specializations (40.1% of cells, Fig 8A, no specializations). Cells with podosomes often exhibited a highly polarized expression of podosomes (Fig 8A, polarized). In untreated cultures similar numbers of ruffled versus podosome-containing cells were seen with an average ruffled:podosome ratio ranging from 0.94 to 1.61. After 1 hour in the presence of 100 ng/ml NGF, 27.8% of the cells predominantly expressed ruffles and 10.5% podosomes yielding an increased ruffled to podosome ratio of 2.65 ± 0.06 (Fig 8B, p<0.001, compared to controls). This was largely due to a decrease in the expression of podosomes. Stimulation with NGF for 24 hrs resulted in a similar ruffled to podosome ratio of 2.14 ± 0.06_(Fig 8B, p<0.001 NGF vs. control or proNGF) although in this case there was a large increase in the number of hMDM with ruffles. After exposure to proNGF for 1 hour the opposite pattern was seen with 44.7% of the cells expressing podosomes and 24.2% ruffles decreasing the ruffled to podosome ratio to 0.54 ± 0.14 (Fig 8B, p<0.001, vs. Control or NGF). However 24 hour stimulation with proNGF did not affect the ruffled to podosome ratio relative to controls (Fig 8B, 0.83 ± 0.17 vs. 0.94 ± 0.20, respectively). The effect of NGF on ruffle formation was further illustrated by a concentration-dependent increase in the number of cells with ruffles from 36.4 ±4.2% at 0 ng/ml NGF to 79.7 ± 7.3% at 100 ng/ml NGF (Fig 8C). The increase in ruffled cells seen after 100 ng/ml NGF stimulation (62.0±0.46 %, Fig 8D, p=0.028) was blocked by inhibiting TrkA signaling with a specific inhibitor, GW 441756 (Fig 8D, p=0.01 NGF vs NGF+ GW 441756). Inhibiting p75NTR signaling with a neutralizing antibody prior to NGF stimulation increased the number of cells with ruffles by 35.7% compared to NGF stimulated cells (Fig 8D; p<0.05). This data indicated that NGF drives the formation of actin rich ruffled structures via TrkA but not p75NTR signaling in hMDM. In contrast to NGF, podosome formation was increased from 22.57+2.99% in control cells to 44.67+4.04% with proNGF stimulation(Fig 8E; p<0.05). Incubation of hMDM with a p75NTR neutralizing antibody prior to stimulation with proNGF, completely reversed the effects on podosome formation (p<0.05). Addition of the p75NTR antibody to normal cultures also strongly inhibited the formation of podosomes (p=0.05). Together these effects indicate that p75NTR is strongly linked to podosome formation. However, proNGF- induced podosome formation was also suppressed by inhibiting TrkA signaling with the specific inhibitor GW 441756 although many cells in this group failed to express either ruffles or podosomes.
Figure 8.

Morphological changes in hMDMs are regulated by neurotrophins. A. hMDMs stained with the F-actin marker phalloidin (Green) following phagocytosis of 1micron latex beads (Red). Four morphologies were often seen in cultures: hMDMs rich in podosomes (podosome rich, arrow), hMDMs containing focal ruffles (ruffled, arrows), hMDMs with no significant membrane specializations (no specializations) and polarized hMDM with podosomes concentrated at one end of the cell (polarized, arrow). Small red fluorescent beads are visible reflecting phagocytosis summarized below. B. The expression of ruffles versus podosomes in hMDMs changed in opposite directions in response to100 ng/ml NGF or 1 ng/ml proNGF as summarized by the ratio of ruffled cells to cells predominantly expressing podosomes. An increase in ruffled cells by NGF was seen after 1 and 24 h **, p<0.001 vs Control and proNGF. An increase in podosome rich cells was seen 1 h after treatment with proNGF vs control (*,p<0.001) but was not sustained. C. Dose response increase in the percentage of F-actin rich ruffled hMDMs after overnight stimulation with various concentrations of NGF (0, 3, 10, 30 and 100 ng/ml). D. The distribution of cells with ruffles versus podosomes was significantly increased by NGF (100ng/ml). Specific inhibition of TrkA signaling with GW 441756 in the presence of 100 ng/ml NGF decreased the percentage of cell with ruffles compared to both controls and NGF alone. Blockade of p75NTR signaling with a neutralizing antibody prior to NGF stimulation further increased the percentage of ruffled cells. Treatment with p75NTR neutralizing antibody alone increased ruffled cells whereas the TrkA inhibitor GW 441756 had no effect (a; p<0.001 vs control, b; p<0.001 vs NGF, Chi square analyses). E. ProNGF increased podosome formation in culture. Inhibiting p75NTR signaling with a neutralizing antibody (p75Ab) or inhibition of TrkA with GW 441756 suppressed podosome expression (a; p<0.001 vs control, b; p<0.001 vs proNGF, Chi square analyses). The p75NTR neutralizing antibody also suppressed podosome formation under normal conditions. F. To assess polarization of the hMDMs, cultured cells containing podosomes were scored from 1(no polarity) to 5 (high podosome density localized to one quadrant of the cell). NGF (100 ng/ml) increased polarization of hMDM after 1 h (**p=0.0248 NGF vs Control), and 24 h (**,p<0.001 NGF vs Control) of stimulation. ProNGF (1 ng/ml) induced a greater polarization compared to NGF after both 1h (p<0.001 proNGF vs Control, and p<0.001 proNGF vs NGF) and 24hrs, (*,p<0.001 proNGF vs Control and p=0.001 proNGF vs NGF).
Figure 9.

Regulation of phagocytosis and migration by NGF and proNGF. A. Phagocytosis of 1 μm fluorescent latex beads by hMDMs with ruffled morphologies was significantly greater than non-ruffled hMDMs *p<0.001. B.The ability of hMDMs to transmigrate through a matrigel barrier was increased after 3 days stimulation with 1 ng/ml proNGF compared to controls or 100 ng/ml NGF. **P=0.051 vs. Control, p=0.011 vs. NGF.
Treatment with either NGF or proNGF increased the relative number of cells with polarized podosome-like structures after 1 and 24 hours. When ranked based on the degree of polarization from 1 (no polarity) to 5 (highly polarized - podosomes concentrated in one quadrant of the cell), controls had little polarization (1.25 ± 0.04). After 24 h, NGF- and proNGF-treated cells showed increased polarization (1.71 ± 0.12, p=0.0248 and 2.27 ± 0.12%, p<0.001, respectively, Fig 8F. The degree of polarization was significantly greater for proNGF versus NGF (p<0.001). This trend was particularly evident in the relative number of cells in the 3-5 polarization categories: 3.38%, 20.17% and 35.09% for control, NGF and proNGF, respectively.
3.9 Phagocytosis of fluorescent beads
Macrophages are important in removal of cellular debris and infectious agents through phagocytosis and the appearance of ruffles has been associated with calcium-dependent phagocytic activity (Kruskal, 1987). To verify that the ruffled morphological phenotype was associated with phagocytic activity, we measured the phagocytosis of 1 micron fluorescent beads over a period of 4 hours. Cells were stained with calcein AM for live cell imaging and/or fixed and stained with phalloidin to determine ruffled vs non-ruffled cells (e.g. Fig 8A). Cells containing ruffled specializations phagocytosed more beads (Fig 9A) than non-ruffled cells (64,295 ± 2,825 and 31,552 ± 5,861 beads/mm2, respectively * p<0.001).
3.10 MDM transmigration across a matrigel barrier
As podosomes have been implicated in migration and invasion, we investigated the roles of NGF and proNGF during macrophage migration. Macrophages were incubated in DMEM +1% FBS with or without proNGF or NGF. An aliquot of 105 cells from each condition was added to the upper well of an 8.0 micron matrigel invasion chamber for 1 or 3 days with similar medium in the lower well. NGF did not change migration relative to untreated controls. ProNGF had no effect on migration after 1 day but significantly increased the transmigration of hMDM relative to controls (104.8% increase, p=0.051) and NGF treated cells (149% increase, p=0.011) by day 3 (Fig 9B). Thus, the transmigration of the cells was consistent with the expression and polarization of podosomes by proNGF.
3.11 NGF and proNGF regulate intracellular calcium spiking activity in macrophages
Calcium signaling has been linked to various types of activity in macrophages. Macrophages responded to both NGF and proNGF with increases in intracellular calcium but the patterns were different. A plot of the average calcium responses (61-92 cells/condition), illustrated in Figure 10A, showed that both NGF and proNGF provoked a small acute response (Fig 10A, arrow) that was not seen in vehicle-treated macrophages. Over time, both the untreated and NGF-treated macrophages showed a gradual increase in intracellular calcium that was not apparent in the presence of proNGF (Fig 10A). The average acute increase in calcium was 32.5 ± 3.4 fluorescence units in hMDM stimulated with NGF and 34.3 ± 8.0 in hMDM stimulated with proNGF (Fig 10C, p's < 0.001 relative to control, 1.2 ± 1.9). A gradual rise in intracellular calcium over time was seen in 39.1% of the control hMDM. Many fewer cells showed a gradual accumulation in the presence of NGF (16.9%) and the gradual rise was almost absent in the presence of proNGF (1.6%)(p<0.001, Chi square). These average response profiles, however, obscured the presence of brief calcium spikes that occurred at random intervals. Comparison of the spiking patterns in individual cells showed considerable variation in the magnitude and frequency of the calcium responses. Examples of the various patterns seen are provided in Figure 10B. To quantify the different response patterns, we examined the acute responses (Fig 10C) and spiking frequency (Fig 10D). The average acute calcium increase was significantly greater than controls for both NGF and proNGF (Fig 10C). Calcium spikes were seen in 39.1% of the unchallenged hMDM and 39.8% of NGF-treated cells but was reduced to 16.4% in the presence of proNGF (p=0.0027, Chi square). Analysis of the individual cell calcium spike frequencies indicated that NGF increased calcium spikes (Fig. 10D,p= 0.013 vs aCSF) whereas proNGF decreased calcium spikes (p < 0.031 vs aCSF) . Thus, both the number of cells showing calcium changes and the spike frequency were altered in different directions by NGF versus proNGF. The effect of NGF on calcium spiking was blocked by the TrkA inhibitor GW 441756 (Fig 10D; p=0.0002 vs NGF) although a basal level of spiking remained indicating that NGF facilitated spike activity but may not be the source of the spikes. Similarly, blockade of the p75NTR by a neutralizing antibody prior to application of proNGF resulted in a high level of spike activity that exceeded basal activity (Fig 10D; p<0.0001 vs proNGF), indicating not only that the effect of proNGF was mediated through the p75NTR but also that there was intrinsic suppression of spike activity via the p75NTR.
Figure 10.

Mature NGF and proNGF have different effects on macrophage calcium regulation. A. Incubation of hMDM with 100 ng/ml NGF induced a small acute calcium response followed by a gradual accumulation over time that paralleled the accumulation in aCSF controls. In contrast, incubation of hMDM with1 ng/ml proNGF induced an acute calcium response similar to NGF but failed to stimulate calcium accumulation over time. B. Calcium traces for individual cells illustrating representative patterns of calcium spikes for control, 100 ng/ml NGF and 1 ng/ml proNGF treated hMDMs. C. NGF (100ng/ml) and proNGF (1 ng/ml) treatment of hMDMs induced an acute calcium rise after stimulation (*; p's < 0.001, NGF vs. control and proNGF vs. control). D. NGF increased individual calcium spike frequency (a;p=0.013 vs aCSF). Inhibition of TrkA signaling with the specific inhibitor GW441756 blocked NGF calcium spiking (b;p<0.05 vs NGF). ProNGF also suppressed calcium spiking compared to aCSF (a;p=0.031 vs aCSF). Inhibiting p75NTR with a neutralizing antibody reversed proNGF suppression of calcium spiking (c;p<0.05 vs proNGF).
3.12 Effects of NGF and proNGF on protein secretion
Macrophages secrete a wide array of proteins in response to external cues that reflect the diversity of responses of these cells. To understand the full range of the secretory profiles, macrophages were stimulated with NGF or proNGF for 3 days to allow accumulation of proteins in the macrophage conditioned medium (MCM). The medium was then analyzed in duplicate for cytokine, chemokine and growth factor content using the Ray Biotech L-Series Human Antibody Array L-507. Medium from cells challenged with NGF or proNGF were compared to the untreated MCM and to each other to assess individual effects and potential differences between the two peptides. Pre-treatment and post-treatment samples were tightly matched with correlations of protein content ranging from r=0.982 to r= 0.995 indicating that most proteins did not change. Using the 99.8% confidence limit as a cutoff, 9% (46 out of 507 proteins) of the proteins were significantly changed by proNGF and 10% (53 out of 507) significantly changed by NGF. A summary of proteins changed by NGF or proNGF is provided in Table 1. Stimulation of secretion was twice as likely than suppression suggesting preferential activation of secretory pathways by each peptide. While the number of positive proteins was similar, NGF and proNGF induced different secretory patterns from the cells with only 10 proteins overlapping. Of these ten proteins, five (GDF, HB-EGF, CXCR2, CCR9, CCR7) changed in opposite directions leaving five for which NGF and proNGF produced similar effects. Four proteins were increased by NGF and proNGF compared to controls (GCSF-R, IL-17F, IL-29, MIP-1β). One protein, IL-13, was decreased compared to controls for both proNGF and NGF, although the suppression was greater for proNGF.
To understand the differences in the secretory profiles between NGF and proNGF, proteins were segregated into categories by function using the Database for Annotation, Visualization and Integrated Discovery (DAVID version 6.7(Huang da et al., 2009b, Huang da et al., 2009a), a bioinformatics tool. Six major functional groups were identified with the following Benjamini scores reflecting strength of association: response to injury (4.8 × 10⁻¹³) > inflammatory response (1.4 × 10⁻⁹) >, chemotaxis (1.1 × 10⁻⁶), secretion (4.1× 10⁻⁶) > immune regulation (8.5 × 10⁻⁴), cytokine production (2.0 × 10⁻⁴) and angiogenesis (7.1 × 10⁻³). Significant “hits” for categories such as cytokine production would be expected due to the nature of the array, (cytokine panel) but the very high association seen for response to injury and chemotaxis indicated a close relationship between the neurotrophins and these functions. In addition to the above categories, it is worth noting that DAVID also identified bone processes as a significant functional group for NGF but not proNGF. Conversely, adhesion/virus-associated processes was a relevant functional group for proNGF but not NGF.
Although similar functional groups were identified by DAVID for both NGF and proNGF, the minimal overlap of the proteins indicated that the pro and mature forms were regulating the pathways in different ways. To provide a more detailed examination of the patterns of protein secretion after NGF or proNGF stimulation, the positive proteins were grouped into four major clusters (growth factors, cytokines, chemokines and other proteins) with up to seven functional families within each group. Of the four major clusters, growth factors were most highly represented (40/98; 40.8%) followed by cytokines (28/98; 28.6%), chemokines (19/98; 19.4%) and other proteins (11/98; 11.2%). Within the growth factor cluster, seven families were assessed (neurotrophic factors, EGF, TGF, FGF, CSF, IGF and angiogenic factors). NGF and proNGF induced very different growth factor secretory profiles, summarized in Table 1. Most of the time a growth factor was altered by one but not the other peptide. The most notable effects of NGF, illustrated in Figure 11, were on proteins within the TGF family where the largest increases were seen in TGF-β3, GDF11, neurturin and follistatin and decreases in GDF3, GDF5 and GDF8. ProNGF increased GDF5, chordin-like 2 and GDF9 and decreased BMPR-IA and GASP-1. Other notable changes (Table 1) included increases in FGF-18, FGF-19, IGFI soluble receptor and ErbB2. In contrast, the most notable changes following stimulation with proNGF were within the family of angiogenic factors illustrated in Figure 12. Increases were seen in factors associated with suppression of angiogenesis: thrombospondin, thrombospondin-1, angiostatin. Decreases were seen in factors that promote angiogenesis: angiopoieitin, angiopoietin-like 1. No angiogenic proteins were significantly changed with NGF stimulation. Overall, this pattern suggested that proNGF stimulation of hMDMs induced an anti-angiogenic environment whereas NGF may regulate a variety of growth functions.
Figure 11.

Changes in TGF-β family proteins in macrophage conditioned medium induced by NGF or proNGF. Values represent the change in fluorescence signal intensity on the protein array for NGF or proNGF treated cells relative to matched control medium collected prior to stimulation. Differential effects of 100 ng/ml NGF versus 1 ng/ml proNGF were seen for most proteins. Significance limit for the difference scores was ±9207 fluorescence units.
Figure 12.

Changes in angiogenesis family proteins in macrophage conditioned medium induced by NGF or proNGF. Values represent the change in fluorescence signal intensity on the protein array for cells treated with 100 ng/ml NGF or 1 ng/ml proNGF relative to matched control medium collected prior to stimulation. Only proNGF induced changes in this family of proteins. Significance limit for the difference scores was ±9207 fluorescence units.
Chemokine secretion (Table 1) was also differentially regulated by NGF and proNGF. Opposing effects (NGF-induced increases, proNGF-induced decreases) were seen for CXCL16, CCR9, CXCR2 and CCR7. Increases in MCP-1, CXCL14, MCP-3, CCL27, MIP 2 and CCR4 were seen after stimulation with proNGF relative to NGF. NGF and proNGF both increased secretion of MIP-1β and CXCR1.
In the cytokine group (Table 1), IL17C, IL-17F, IL-17BR, IL-23, IL-23R, IL-24, IL-26, IL-27, IL-28A and IL-29 were increased by NGF relative to control or proNGF. IL-4R, IL-17F, IL-18R and IL-29 were increased by proNGF. Notably, IL-13 was decreased by both NGF and proNGF while IL-10 was decreased by NGF. Many of these proteins are in the IL-17 family and the changes induced for IL-17 related cytokines by NGF or proNGF are summarized in Figure 13. This pattern suggested that the neurotrophins play a role in the secretion of cytokines that regulate immune responses via IL-17 mediated pathways.
Figure 13.

Changes in IL-17 family proteins in macrophage conditioned medium induced by NGF or proNGF. Values represent the change in fluorescence signal intensity on the protein array for 100 ng/ml NGF or 1 ng/ml proNGF treated cells relative to matched control medium collected prior to stimulation. Differential effects of NGF and proNGF were seen for most proteins except IL-17F where both NGF and proNGF increased expression. IL-23 showed a large differential between NGF vs. proNGF but each individual change ase not significant relative to controls. Significance limit for the difference scores was ±9207 fluorescence units.
The most notable of other proteins altered by NGF or proNGF (Table 1, Fig 14) were the MMPs. The relative differences in MMP secretion in response to NGF or proNGF are illustrated in Figure 14 where a distinct dichotomy is seen between the actions of NGF versus proNGF. NGF selectively induced the release of MMP-7, MMP-8 and MMP-11 whereas MMP-9 secretion was increased after proNGF stimulation. MMP-1 did not meet the cutoff relative to controls but showed a significant differential increase for NGF relative to proNGF.
Figure 14.

Changes in MMP family proteins in macrophage conditioned medium induced by NGF or proNGF. Values represent the change in fluorescence signal intensity on the protein array for cells treated with 100 ng/ml NGF or 1 ng/ml proNGF relative to matched control medium collected prior to stimulation. NGF increased MMP-7, 8, and 11 whereas proNGF induced a selective increase in MMP-9. A borderline increase in MMP-1 was induced by NGF (significant differential relative to proNGF). Significance limit for the difference scores was ±9207 fluorescence units.
Since macrophages are commonly categorized as classically activated (M1) or alternatively activated (M2)(Laskin et al., 2011), we examined markers typically used to distinguish these phenotypes. M1 markers were TNF-α, IL-12p70, Il-6, Il-23 IFN-γ, IL-1α,β and IP10. M2 markers were IL-4, IL-10, IL-13, TGF-β (1, 2, 3 & 5), and MCP-1. Changes in the M1 and M2 cytokines, plotted from high to low, are illustrated in Figure 15. The dashed lines show the confidence limits for positive or negative changes. The pattern of increases and decreases did not reveal a clear inflammatory or anti-inflammatory profile for NGF or proNGF with most cytokines showing no change. The most notable effect of NGF was a decrease in IL-1 (M1) and IL-10 and IL-13 (M2). The only increase was for TGF-β3. Stimulation with proNGF did not affect the M1 cytokines. For the M2 cytokines an increase in MCP-1 and a decrease in IL-13 were the only notable effects.
Figure 15.

Release profile of proteins typically associated with M1 (inflammatory) or M2 (anti-inflammatory) macrophage polarization in response to NGF or proNGF. The dashed line represents the magnitude of change needed to be considered significant. NGF (100ng/ml) suppressed the release of several proteins (IL-1α,β, IL-10 and IL-13) and increased TGF-β3. ProNGF (1ng/ml) affected the release of only two proteins, an increase in MCP-1 and a decrease in IL-13. Overall, there was no strong trend toward either an M1 or M2 phenotype. Significance limit for the difference scores was ±9207 fluorescence units (dashed lines).
The lack of a clear M1-like or M2-like effect of NGF and proNGF on inflammatory or anti-inflammatory proteins was paralleled by the absence of acute changes in the activation markers CD16 and CD163 analyzed by flow cytometry (not shown). However, a small decrease in cells expressing CD206high was seen in monocytes treated with either NGF or proNGF for 1 hour (19.1% in controls to 12.3% NGF and 10.9% proNGF, p=0.03) suggesting a small shift away from the M2 phenotype.
3.13 Neurotoxic activity of the hMDM
A prominent response of macrophages to inflammatory stimuli is the secretion of factors that are toxic to neurons (Pulliam et al., 1991, Giulian et al., 1990, Xiong et al., 2000, O'Donnell et al., 2006, Tovar et al., 2013, White et al., 2011). Since neurotrophins are prominent in the nervous system we evaluated the ability of the neurotrophins to modulate toxic activity in the macrophage conditioned medium (MCM). Cells were stimulated with NGF or proNGF for 30 min, washed and medium from the conditioned cells was collected after 1 or 24 hours. Toxicity of the MCM was tested on rat cortical/hippocampal neurons pre-loaded with the calcium indicator dye Fluo-4. Previous studies have shown that macrophages activated by inflammatory stimuli release factors that injure neurons via a destabilization of intracellular calcium (Meeker et al., 2012, Bragg et al., 2002). The effects of the pre-conditioned MCM on calcium regulation are illustrated in Figure 16. MCM from hMDM pre-treated with proNGF resulted in a large acute calcium rise followed by partial recovery and then a delayed calcium increase which correlated with the appearance of cell damage in the form of focal varicosities. MCM from cells pre-treated for 30 minutes with NGF showed a larger acute calcium response but no significant delayed rise relative to untreated hMDM. Conditioned medium collected 24 hours after a 30 minute neurotrophin pre-treatment showed negligible calcium responses for both NGF and proNGF (2.2-11.3% of the maximum rise seen in the 1 hour samples) indicating that the toxic effect decays over time. Removal of the NGF or proNGF was necessary for the decay of activity since continuous treatment with NGF or proNGF for 24 hour resulted in similar toxic effects from the proNGF treated cells. Medium collected after prolonged stimulation with NGF showed some toxic activity albeit at a reduced level relative to proNGF. Thus, proNGF provokes the secretion of neurotoxic substances from the macrophages whereas NGF offered partial protection.
Figure 16.

NGF and proNGF have opposing effects on the secretion of neurotoxic factors by hMDM. Toxic effects on neuronal calcium regulation were monitored by measuring acute (every 6 s for 6 min) and delayed changes in intracellular calcium (every min for 60 min) with Fluo-4. A-B. Conditioned medium from hMDMs after stimulation with 100 ng/ml NGF or 1 ng/ml proNGF was collected and placed onto cultured rat cortical neurons to assess calcium dysregulation. Macrophages were pretreated with neurotrophins to establish a change in phenotype and then washed and incubated for 1 h in serum free DMEM to generate the macrophage conditioned medium (MCM). A. Addition of MCM at a dilution of 1:5 resulted in an acute increase in calcium for both proNGF and NGF treated cells. NGF caused a larger acute increase compared to proNGF. However, the delayed accumulation of calcium which correlates with the development of structural pathology was induced by MCM from proNGF treated cells but not NGF-treated cells. Basal calcium levels are illustrated for neurons treated with aCSF. B. Conditioned medium collected 1 day after treatment failed to provoke significant changes in intracellular calcium. Data points are mean ± sem.
4. Discussion
Trk and p75NTR expression on hMDM
Since the early observation that neurotrophins may regulate the immune response(Levi-Montalcini et al., 1996) only a handful of studies have explored neurotrophin receptor gene transcript expression or immunoreactivity in cells of monocyte lineage (Aronica et al., 2004, Artico et al., 2008, Barouch et al., 2001, Dowling et al., 1999, Elkabes et al., 1998, Levanti et al., 2001, Nakajima et al., 1998, Samah et al., 2008b, Tonchev et al., 2008). These studies showed neurotrophin receptor expression on macrophages but the specific receptor profiles varied depending on the tissue and conditions (Hikawa et al., 2002, Nakajima et al., 1998, Garaci et al., 1999a). In our study of monocytes and hMDM, we found that 47-59% were immunoreactive for p75NTR and 29-44% for TrkA. TrkB was expressed at a much lower level and we observed no significant staining of TrkC. Receptor expression on both macrophages and monocytes varied from cell to cell suggesting that different phenotypes may be dynamically expressed in vitro and in vivo depending on local influences.
In neurons, p75NTR can form homodimers or heteromeric complexes with Trk receptors and other signaling partners such as sortilin. The strong co-localization of p75 NTR with both TrkA and sortilin in actin rich ruffled regions on the outer extremities of the cells indicated that these receptors are poised for interactions. In addition, the presence of both p75NTR and TrkA indicated that macrophages might be susceptible to differential signaling with NGF and proNGF. A large literature on the actions of NGF and proNGF in neurons has highlighted the opposing effects of the pro-form versus mature neurotrophin (Hempstead, 2009). Prominent among these effects are the ability of proNGF to induce apoptosis in neurons when p75NTR associates with sortilin (Harrington et al., 2004, Nykjaer et al., 2004) and the ability of NGF engagement with TrkA/p75NTR to promote survival (Reichardt, 2006). The current studies indicate that, like neurons, separate signaling pathways exist for the regulation of innate immune responses.
NGF and proNGF induce different functional macrophage phenotypes
NGF has been shown to increase SDF-dependent migration in human monocytes(Samah et al., 2008a), enhance TNF production in mouse macrophages after lipopolysaccharide (LPS) stimulation(Barouch et al., 2001) and increase macrophage viability during HIV infection(Garaci et al., 1999b). These studies indicate that NGF plays a role in trafficking and survival of macrophages. Consistent with these functions we found that NGF increased the co-localization of TrkA and p75NTR in hMDM, promoted phosphorylation of Akt, and increased survival in serum free medium. NGF also induced TrkA-dependent ruffling of the actin cytoskeleton in the macrophages. Although the role of p75NTR and TrkA accumulation at these membrane specializations is not well understood, Patel et al. (2008) suggested that the ruffling of the membrane was associated with phagocytic activity (Patel and Harrison, 2008). Indeed, the ruffled cells in our studies showed significantly more phagocytic activity than non-ruffled cells. Other studies in macrophages and microglia have shown that increases in intracellular calcium were necessary for cytokine and chemokine release (Hoffmann et al., 2003) and that calcium spikes, in particular, were correlated with ruffled actin structures and increased phagocytosis (Myers and Swanson, 2002, Kruskal and Maxfield, 1987, Ohsawa et al., 2000). Consistent with this data, NGF caused an acute calcium rise followed by increased calcium spiking in macrophages. The NGF-induced increase in spike frequency was blocked by the TrkA inhibitor GW but basal spiking activity remained indicating that TrkA activation facilitated spike activity but was unlikely to be the source of the spikes. The role of the calcium spikes is not known but their relationship to expression of membrane ruffles and increased phagocytosis suggest a role in these functions.
The effects of proNGF on hMDM function differed substantially from the effects of NGF. No effects were seen on neurotrophin receptor co-localization relative to controls following stimulation with proNGF indicating that the pro-neurotrophin does not promote interactions between p75NTR and TrkA. However, expression of sortilin and its colocalization with p75NTR was increased in the presence of proNGF. Sortilin has been described on rat peritoneal macrophages and bone marrow derived macrophages (Wong et al., 2010) and a microglial cell line, C13NJ (Martin et al., 2005). In neurons, sortilin/p75NTR signaling after engagement with proNGF often leads to apoptosis of the cell (Nykjaer et al., 2004). However, in the macrophages, proNGF did not induce cell death. Instead, proNGF, like NGF, increased phosphorylation of Akt. A similar effect was seen in the C13NJ microglial cells where stimulation with neurotensin, another endogenous ligand of sortilin, resulted in Akt-dependent extension of actin rich filopodia and migration (Martin et al., 2003, Martin et al., 2005). Although the sortilin-mediated death pathway has been studied extensively in neurons, sortilin participates in other cellular processes such as sorting of proteins in the Golgi compartment (Nykjaer et al., 2004) and anterograde transport of neurotrophin receptors to enhance neurotrophin signaling (Vaegter et al., 2011). While we cannot totally rule out a potential role in cell death, our results suggest that sortilin receptors may have alternative functions in macrophages.
ProNGF was also closely tied to changes in the cytoskeleton but, in contrast to NGF, induced the expression of podosomes. This effect was evident at low concentration of proNGF and was reversed by the p75NTR neutralizing antibody indicating that the proNGF effect was mediated through binding to the p75NTR. The podosomes often accumulated in one quadrant of the cell suggesting a polarization that might be associated with migration. This possibility was supported by the transmigration of an increased number of proNGF-treated hMDM across the transwell Matrigel barrier. Podosome bearing cells showed less phagocytic activity and fewer calcium spikes relative to NGF-treated and control cells. The reversal of calcium spike supression with a p75NTR neutralizing antibody indicated that the actions of proNGF were mediated through the p75NTR. These differences support an antagonistic relationship between NGF and proNGF in the control of macrophages functions.
Differences in hMDM secretory profiles induced by NGF and proNGF
Secretion of proteins is a primary macrophage function in response to various external cues. Of the 507 proteins assessed in this study, approximately 20% changed in response to NGF or proNGF. NGF and proNGF induced very different secretory responses indicating that each induces a distinctively different macrophage phenotype. The highest scoring functional groups using the bioinformatics tool DAVID were response to injury, inflammatory response, chemotaxis and secretion, all consistent with the structural and functional changes in the cells. Many studies have categorized macrophages into two or three distinct groups based on their secretory profiles and receptor content (Laskin et al., 2011). However, categorizing the response based on classical pro-inflammatory (M1) and anti-inflammatory (M2) cytokines provided little insight into the actions of the neurotrophins as neither peptide induced a clear M1 or M2 secretory profile. We also failed to see changes in surface receptors CD16 or CD163 although NGF stimulation produced a slight downregulation of CD206, an M2 marker in monocytes. The changes seen in proteins within many different functional groups reinforce a growing number of studies emphasizing the wide variety of phenotypes that extend beyond the traditional categories (Ransohoff and Perry, 2009). Our study in particular indicated that specific protein changes tended to segregate into four functional groups: growth factors, IL-17 family cytokines, angiogenic factors and matrix metalloproteases.
GrowthFactors
The functional group most affected by proNGF and NGF was growth factors. This response highlights the potential importance of neurotrophins in the control of protective and restorative properties of macrophages in disease processes (Murray and Wynn, 2011). While macrophages/microglia have previously been shown to secrete neurotrophic factors (Nakajima et al., 1998, Garaci et al., 1999b) our profile indicated that growth factors in the TGF-β family including TGF-β3, growth and differentiation factors (GDF3, 5, 8, 9 and 11) and neurturin were affected predominantly by NGF. The few that were changed by proNGF were invariably in the opposite direction as NGF, again highlighting the opposing actions of the pro and mature forms of the peptide. These proteins are thought to play a role in growth and differentiation of the nervous system although studies of the GDFs in particular have been limited. The high levels of expression indicate that GDF secretion is an area worthy of further exploration.
Angiogenic Factors
Other growth factors that were almost exclusively affected by proNGF were proteins that control angiogenesis. ProNGF increased angiostatin, thrombospondin and thrombospondin -1, factors that inhibit angiogenesis while also decreasing factors that promote angiogenesis, angiopoietin and angiopoietin-like 1. Many studies have reported a positive role for NGF (Nico et al., 2008) and a negative role for the p75NTR(Krygier and Djakiew, 2002) in angiogenesis however proNGF's role is less well understood. Together these resultsidentify a novel role for proNGF in the induction of anti-angiogenic activity.
IL-17 Cytokines
IL-17 cytokines share structural features with NGF (Zhang et al., 2011) and are involved in host defense against extracellular bacterial and fungal infection(Curtis and Way, 2009) as well as the pathogenesis of autoimmune inflammatory diseases(Zhu and Qian, 2012). The IL-17 family of cytokines was affected predominantly by NGF. Increases were seen in the secretion of IL-17C, IL-17F and IL-23R. We have found no previous reports of IL-17 secretion in response to NGF although studies have noted increases in both IL-17 and NGF at sites of wounding(Carvalho et al., 2008) A reciprocal relationship between IL-17 and NGF has been suggested by some studies. IL-17 stimulation of human PBMCs has been shown to upregulate NGF mRNA levels and PBMCs isolated from relapsing-remitting multiple sclerosis patients had reduced levels of NGF after IL-17 stimulation (Urshansky et al., 2010). This relationship is likely to be a fruitful area which could reveal new insights into regulation of neuroinflammation.
Matrix Metalloproteinases
The dichotomy between the actions of NGF versus proNGF persisted for the MMP family of proteins. NGF induced secretion of MMP-7 may be of particular importance. In vitro, MMP-7 has been shown to induce atrophy of neuronal synapses via inhibition of vesicle recycling (Szklarczyk et al., 2007). While this would suggest that MMP-7 secretion in response to NGF is deleterious, a study by Le et al. (Le and Friedman, 2012) indicated that the MMP-7 had a protective function during kainic acid-induced seizures by converting proNGF to NGF. More work is needed to clarify the role of macrophage-derived MMP-7. In contrast to NGF, ProNGF increased MMP-9 secretion from macrophages. The secretion of MMP-9 by macrophages is thought to be mediated in part by podosomes (Buccione et al., 2004) which is consistent with proNGFs ability to induce podosome formation. Increases in MMP-9 have also been seen in the CSF in many neurodegenerative diseases where macrophage infiltration and/or microglial activation often play a key role in the etiology of neuronal damage such as Alzheimer disease and HIV associated dementia (Block et al., 2007). Given the many functions of monocytes and macrophages, the differential regulation of MMPs by NGF and proNGF may have widespread relevance to CNS pathogenesis, tumorigenesis, atherosclerosis and other diseases (Xia et al., 2013, Malemud, 2006).
The neuropathology of these neuroinflammatory diseases has been linked in some cases to the secretion of soluble factors that are toxic to neurons (Pulliam et al., 1996, Giulian et al., 1996) although the actions of these factors is still poorly understood. A decrease in the ratio of NGF to proNGF in degenerative diseases such as Alzheimer disease has been suggested as an underlying factor that contributes to disease progression (Capsoni et al., 2011, Tiveron et al., 2013, Al-Shawi et al., 2007). Our studies showed that the balance of pro- and mature forms may also differentially influence the secretory response and toxic activity of macrophages/microglia. ProNGF supported the secretion of toxins that destabilize neuronal calcium in much the same fashion as seen in MCM from virally activated macrophages (Meeker et al., 2012), whereas NGF facilitated growth factor secretion and neuroprotection. Though these studies could not identify the neurotoxins secreted from hMDMs that is responsible for the neuronal calcium dysregulation, these differences have important implications for the control of macrophage activity by neurotrophins and indicate that p75NTR and TrkA signaling pathways may be fertile ground for the development of strategies to regulate macrophage phenotypes that impact neurodegenerative diseases.
5. Conclusions
These studies provide an initial characterization of the ability of neurotrophins to influence the phenotype of macrophages and for the first time show that, like neurons, macrophages are poised to respond to pro- and mature neurotrophins in different ways. . NGF and proNGF induce changes in the actin cytoskeleton which favor ruffling of the membranes or formation of podosomes, respectively. Ruffles, induced by NGF, appear to be a focal point for the expression of p75NTR and TrkA and correlate with phagocytosis, calcium spiking, phosphorylation of Akt and the release of growth factors, IL-17 related cytokines and various MMPs. In contrast, proNGF facilitated podosome formation, the secretion of anti-angiogenic factors, MMP-9 and factors that induce toxicity in neurons. These differences offer the potential for development of neurotrophin-based therapeutic approaches that adjust the balance between beneficial and deleterious macrophage functions.
Highlights.
Neurotrophin receptors p75NTR and TrkA are expressed on monocytes and macrophages
NGF and proNGF differentially regulate macrophage phenotypes; no evidence of M1/M2
NGF promotes membrane ruffling, calcium spiking and growth factor secretion.
ProNGF induces podosome formation, migration and neurotoxin production
Novel therapeutic avenue for macrophage control during neuroinflammation
Table 1.
Soluble protein changes in macrophage conditioned medium in response to NGF or proNGF.
| Major Families | SubFamilies | Common Name | Protein Name | ProNGF | NGF |
|---|---|---|---|---|---|
| Growth Factors | Neurotrophin | beta- Nerve Growth Factor | beta-NGF | −1906 | 11832 |
| Ciliary neurotrophic factor | CNTF | −18712 | −879 | ||
| Ciliary neurotrophic factor receptor alpha | CNTF R alpha | −2373 | 7573 | ||
| GDNF family receptor alpha-2 | GFR alpha-2 | −25026 | 1454 | ||
| GDNF family receptor alpha-3 | GFR alpha-3 | −5592 | 6571 | ||
| GDNF family receptor alpha-4 | GFR alpha-4 | 4081 | 9819 | ||
| Neurturin | Neurturin | 855 | 9621 | ||
| Angiogenic | Angiogenin | Angiogenin | 10434 | −879 | |
| Angiogenin-1 | Angiopoietin-1 | −12531 | −409 | ||
| Angiopoietin-like 1 | Angiopoietin-like 1 | −70270 | 2873 | ||
| Angiostatin | Angiostatin | 37867 | 36 | ||
| Thrombospondin | Thrombospondin (TSP) | 22839 | −879 | ||
| Thrombospondin-1 | Thrombospondin-1 | 32165 | −879 | ||
| Thrombospondin-2 | Thrombospondin-2 | −14164 | −3587 | ||
| Osteoactivin | Osteoactivin / GPNMB | 8 | 15189 | ||
| EGF | Receptor tyrosine-protein kinase erbB-2 | ErbB2 | −803 | 13109 | |
| Cripto-1 | Cripto-1 | −966 | −11589 | ||
| Heparin-binding Epidermal like growth factor | HB-EGF | 15410 | −10820 | ||
| Neuregulin 2 | NRG2 | 14881 | −879 | ||
| Neuregulin 3 | NRG3 | 26006 | 5257 | ||
| Sensory and motor neuron-derived factor/Neuregulin 1 Isoform | SMDF / NRG1Isoform | 385 | 9711 | ||
| TGF | Bone morphogenic protein 3 | BMP-3 | −856 | 8762 | |
| Bone morphogenic protein receptor-1A | BMPR-IA / ALK-3 | −13242 | 3412 | ||
| Chordin-Like 2 | Chordin-Like 2 | 18113 | −317 | ||
| Follistatin | Follistatin | 151 | 13139 | ||
| Growth/ differentiation factor 3 | GDF3 | −2856 | −20946 | ||
| Growth/ differentiation factor 5 | GDF5 | 20785 | −20505 | ||
| Growth/ differentiation factor 8 | GDF8 | 4214 | −10327 | ||
| Growth/ differentiation factor 9 | GDF9 | 9003 | −3250 | ||
| Growth/ differentiation factor 11 | GDF11 | 670 | 16710 | ||
| Transforming growth factor-beta 3 | TGF-beta 3 | 539 | 9859 | ||
| Bone morphogenic protein receptor-1B | BMPR-IB / ALK-6 | −1841 | 7282 | ||
| FGF | Fibroblast growth factor receptor 4 | FGF R4 | −15624 | 187 | |
| Keratinocyte growth factor | FGF-7 / KGF | 1430 | −14409 | ||
| Fibroblast growth factor-13 1B | FGF-13 1B | −10447 | −337 | ||
| Fibroblast growth factor-18 | FGF-18 | 1507 | 28892 | ||
| Fibroblast growth factor-19 | FGF-19 | −4230 | 11039 | ||
| Fibroblast growth factor-11 | FGF-11 | −5817 | −12787 | ||
| CSF | Granulocyte colony-stimulating factor | GCSF | 14252 | −2688 | |
| Granulocyte colony-stimulating factor receptor | G-CSF R / CD 114 | 16035 | 9283 | ||
| IGF | Insulin-like growth factor 1 Soluble Receptor | IGF-I SR | −649 | 8704 | |
| Inflammatory | Inflammatory | Interferon-gamma | IFN-gamma | −1563 | 9178 |
| Interleukin-1 alpha | IL-1 alpha | 7040 | −21787 | ||
| Interleukin-26 | IL-26 | −6437 | 27520 | ||
| Interleukin-27 | IL-27 | −2125 | 11950 | ||
| Soluble glucoprotein 130 | sgp130 | −566 | −10926 | ||
| Oncostatin M | OSM | −23091 | −910 | ||
| Interleukin-1 beta | IL-1 beta | −1625 | −10394 | ||
| Anti-Inflammatory | Interleukin-4 receptor | IL-4 R | 66873 | −879 | |
| Interleukin-10 | IL-10 | 4650 | −19883 | ||
| Interleukin-13 | IL-13 | −22859 | −11407 | ||
| Interleukin-13 receptor alpha 1 | IL-13 R alpha 1 | −1344 | 10114 | ||
| Interleukin-10 receptor alpha | IL-10 R alpha | −771 | −9682 | ||
| Interleukin-22 | IL-22 | 9719 | −1403 | ||
| Interleukin-24 | IL-24 | −1352 | 34953 | ||
| Interleukin-28A | IL-28A | −2606 | 31042 | ||
| Interleukin-29 | IL-29 | 28702 | 26242 | ||
| TNF | Tumor necrosis factor receptor superfamily member 5 | CD40 liagand / TNFSF5 / CD154 | 12839 | 2302 | |
| Lymphotoxin beta receptor | Lymphotoxin beta R / TNFRSF3 | −514 | 14473 | ||
| Tumor necrosis factor ligand superfamily member 13 | April | 10082 | 863 | ||
| Il-17 | Interleukin-17B receptor | IL-17B R | −1742 | 25671 | |
| Interleukin-17C | IL-17C | −1552 | 17632 | ||
| Interleukin-18-binding protein a | IL-18 BPa | −2343 | −12256 | ||
| Interleukin-18 receptor alpha | IL-18 R alpha (IL-1 R5) | 37642 | −4101 | ||
| Interleukin-21 receptor | IL-21 R | 1289 | −13178 | ||
| Interleukin-23 | IL-23 | −6551 | 6152 | ||
| Interleukin-23 receptor | IL-23 R | 143 | 22000 | ||
| Galectin-4 | Galectin-4 | −18362 | 0 | ||
| Interleukin-17F | IL-17F | 10426 | 17047 | ||
| Chemokines | Chemokines | Interleukin-8 | IL-8 | −10328 | −879 |
| Monocyte Chemoattractant Protein-1 | MCP-1 | 12636 | −879 | ||
| Monocyte Chemoattractant Protein-3 | MCP-3 | 18210 | −620 | ||
| Macrophage inflammatory protein-1b | MIP-1b | 24631 | 13195 | ||
| Macrophage inflammatory protein-2 | MIP 2 | 34862 | −514 | ||
| C-C chemokine receptor type 4 | CCR4 | 39880 | 1276 | ||
| C-C chemokine receptor type 7 | CCR7 | −36858 | 25721 | ||
| C-C chemokine receptor type 9 | CCR9 | −25369 | 12536 | ||
| C-C chemokine ligand 27 | CTACK / CCL27 | 25312 | −879 | ||
| C-X-C chemokine ligand 14 | CXCL14 / BRAK | 12268 | −2114 | ||
| C-X-C chemokine ligand 16 | CXCL16 | −16041 | 8315 | ||
| C-X-C chemokine receptor type 1 | CXCR1 / IL-8 RA | 25821 | 7695 | ||
| C-X-C chemokine receptor type 2 | CXCR2 / IL-8 RB | −32262 | 27759 | ||
| C-X-C chemokine receptor type 6 | CXCR6 | 524 | 13340 | ||
| C-X-C chemokine ligand 1 | GRO | 3051 | −13418 | ||
| Human CC chemokine-4 | HCC-4 / CCL16 | −2532 | −16397 | ||
| Lymphotactin | Lymphotactin/ XCL1 | −1283 | −13629 | ||
| Monokine induced by gamma interferon | MIG | −14265 | −879 | ||
| C-X-C chemokine ligand 1 | GRO-a | 704 | 9793 | ||
| Other | MMP | Matrix metalloproteinase-7 | MMP-7 | 350 | 17410 |
| Matrix metalloproteinase-8 | MMP-8 | −2563 | 10171 | ||
| Matrix metalloproteinase-9 | MMP-9 | 31915 | −879 | ||
| Matrix metalloproteinase-11 | MMP-11 (Stromelysin-3) | −3399 | 9606 | ||
| Matrix metalloproteinase-1 | MMP-1 | −965 | 8110 | ||
| Adhesion | Intercellular Adhesion Molecule-1 | ICAM-1 | 9536 | −2207 | |
| Sialic acid-binding Ig-like lectin-9 | Siglec-9 | −7361 | −16393 | ||
| Misc. | Leukemia inhibitory factor receptor alpha | LIF R alpha | −4998 | 5291 | |
| Inhibin B | Inhibin B | −443 | 15725 | ||
| Growth and differentiation factor-associated serum protein 1 | GASP-1 / WFIKKNRP | −12014 | 1903 |
Shaded values represent significant changes in protein secretion by NGF or proNGF relative to matched control medium. Values are expressed as relative fluorescence units. Nine proteins showed strong differentials for NGF versus proNGF although no individual changes were seen relative to control (unshaded).
Acknowledgements
This research was supported by NIH grants: F31 MH101019, R01 MH085606 and R01 NS083164.
Footnotes
Publisher's Disclaimer: This is a PDF file of an unedited manuscript that has been accepted for publication. As a service to our customers we are providing this early version of the manuscript. The manuscript will undergo copyediting, typesetting, and review of the resulting proof before it is published in its final citable form. Please note that during the production process errors may be discovered which could affect the content, and all legal disclaimers that apply to the journal pertain.
References
- AL-SHAWI R, HAFNER A, CHUN S, RAZA S, CRUTCHER K, THRASIVOULOU C, SIMONS P, COWEN T. ProNGF, sortilin, and age-related neurodegeneration. Annals of the New York Academy of Sciences. 2007;1119:208–15. doi: 10.1196/annals.1404.024. [DOI] [PubMed] [Google Scholar]
- ARONICA E, OZBAS-GERCEKER F, REDEKER S, RAMKEMA M, SPLIET WG, VAN RIJEN PC, LEENSTRA S, GORTER JA, TROOST D. Expression and cellular distribution of high- and low-affinity neurotrophin receptors in malformations of cortical development. Acta Neuropathol. 2004;108:422–34. doi: 10.1007/s00401-004-0906-3. [DOI] [PubMed] [Google Scholar]
- ARTICO M, BRONZETTI E, FELICI LM, ALICINO V, IONTA B, BRONZETTI B, MAGLIULO G, GRANDE C, ZAMAI L, PASQUANTONIO G, DE VINCENTIIS M. Neurotrophins and their receptors in human lingual tonsil: an immunohistochemical analysis. Oncol Rep. 2008;20:1201–6. [PubMed] [Google Scholar]
- BAROUCH R, APPEL E, KAZIMIRSKY G, BRODIE C. Macrophages express neurotrophins and neurotrophin receptors. Regulation of nitric oxide production by NT-3. J Neuroimmunol. 2001;112:72–7. doi: 10.1016/s0165-5728(00)00408-2. [DOI] [PubMed] [Google Scholar]
- BLOCK ML, ZECCA L, HONG JS. Microglia-mediated neurotoxicity: uncovering the molecular mechanisms. Nature reviews. Neuroscience. 2007;8:57–69. doi: 10.1038/nrn2038. [DOI] [PubMed] [Google Scholar]
- BRAGG DC, HUDSON LC, LIANG YH, TOMPKINS MB, FERNANDES A, MEEKER RB. Choroid plexus macrophages proliferate and release toxic factors in response to feline immunodeficiency virus. Journal of NeuroVirology. 2002;8:225–39. doi: 10.1080/13550280290049679. [DOI] [PubMed] [Google Scholar]
- BUCCIONE R, ORTH JD, MCNIVEN MA. Foot and mouth: podosomes, invadopodia and circular dorsal ruffles. Nature reviews. Molecular cell biology. 2004;5:647–57. doi: 10.1038/nrm1436. [DOI] [PubMed] [Google Scholar]
- CAPSONI S, BRANDI R, ARISI I, D'ONOFRIO M, CATTANEO A. A dual mechanism linking NGF/proNGF imbalance and early inflammation to Alzheimer's disease neurodegeneration in the AD11 anti-NGF mouse model. CNS & neurological disorders drug targets. 2011;10:635–47. doi: 10.2174/187152711796235032. [DOI] [PubMed] [Google Scholar]
- CARVALHO B, CLARK DJ, ANGST MS. Local and systemic release of cytokines, nerve growth factor, prostaglandin E2, and substance P in incisional wounds and serum following cesarean delivery. The journal of pain : official journal of the American Pain Society. 2008;9:650–7. doi: 10.1016/j.jpain.2008.02.004. [DOI] [PubMed] [Google Scholar]
- CURTIS MM, WAY SS. Interleukin-17 in host defence against bacterial, mycobacterial and fungal pathogens. Immunology. 2009;126:177–85. doi: 10.1111/j.1365-2567.2008.03017.x. [DOI] [PMC free article] [PubMed] [Google Scholar]
- DOWLING P, MING X, RAVAL S, HUSAR W, CASACCIA-BONNEFIL P, CHAO M, COOK S, BLUMBERG B. Up-regulated p75NTR neurotrophin receptor on glial cells in MS plaques. Neurology. 1999;53:1676–82. doi: 10.1212/wnl.53.8.1676. [DOI] [PubMed] [Google Scholar]
- ELKABES S, PENG L, BLACK IB. Lipopolysaccharide differentially regulates microglial trk receptor and neurotrophin expression. J Neurosci Res. 1998;54:117–22. doi: 10.1002/(SICI)1097-4547(19981001)54:1<117::AID-JNR12>3.0.CO;2-4. [DOI] [PubMed] [Google Scholar]
- GARACI E, CAROLEO MC, ALOE L, AQUARO S, PIACENTINI M, COSTA N, AMENDOLA A, MICERA A, CALIO R, PERNO CF, LEVI-MONTALCINI R. Nerve growth factor is an autocrine factor essential for the survival of macrophages infected with HIV. Proc.Natl.Acad.Sci.U.S.A. 1999a;96:14013–14018. doi: 10.1073/pnas.96.24.14013. [DOI] [PMC free article] [PubMed] [Google Scholar]
- GARACI E, CAROLEO MC, ALOE L, AQUARO S, PIACENTINI M, COSTA N, AMENDOLA A, MICERA A, CALIO R, PERNO CF, LEVI-MONTALCINI R. Nerve growth factor is an autocrine factor essential for the survival of macrophages infected with HIV. Proc Natl Acad Sci U S A. 1999b;96:14013–8. doi: 10.1073/pnas.96.24.14013. [DOI] [PMC free article] [PubMed] [Google Scholar]
- GIULIAN D, VACA K, NOONAN CA. Secretion of neurotoxins by mononuclear phagocytes infected with HIV-1. Science. 1990;250:1593–1596. doi: 10.1126/science.2148832. [DOI] [PubMed] [Google Scholar]
- GIULIAN D, YU J, LI X, TOM D, LI J, WENDT E, LIN SN, SCHWARCZ R, NOONAN C. Study of receptor-mediated neurotoxins released by HIV-1-infected mononuclear phagocytes found in human brain. J.Neuroscience. 1996;16:3139–3153. doi: 10.1523/JNEUROSCI.16-10-03139.1996. [DOI] [PMC free article] [PubMed] [Google Scholar]
- HARRINGTON AW, LEINER B, BLECHSCHMITT C, AREVALO JC, LEE R, MORL K, MEYER M, HEMPSTEAD BL, YOON SO, GIEHL KM. Secreted proNGF is a pathophysiological death-inducing ligand after adult CNS injury. Proceedings of the National Academy of Sciences of the United States of America. 2004;101:6226–30. doi: 10.1073/pnas.0305755101. [DOI] [PMC free article] [PubMed] [Google Scholar]
- HEMPSTEAD BL. Commentary: Regulating proNGF action: multiple targets for therapeutic intervention. Neurotoxicity research. 2009;16:255–60. doi: 10.1007/s12640-009-9054-9. [DOI] [PMC free article] [PubMed] [Google Scholar]
- HIKAWA S, KOBAYASHI H, HIKAWA N, KUSAKABE T, HIRUMA H, TAKENAKA T, TOMITA T, KAWAKAMI T. Expression of neurotrophins and their receptors in peripheral lung cells of mice. Histochem Cell Biol. 2002;118:51–8. doi: 10.1007/s00418-002-0426-y. [DOI] [PubMed] [Google Scholar]
- HOFFMANN A, KANN O, OHLEMEYER C, HANISCH UK, KETTENMANN H. Elevation of basal intracellular calcium as a central element in the activation of brain macrophages (microglia): suppression of receptor-evoked calcium signaling and control of release function. The Journal of neuroscience : the official journal of the Society for Neuroscience. 2003;23:4410–9. doi: 10.1523/JNEUROSCI.23-11-04410.2003. [DOI] [PMC free article] [PubMed] [Google Scholar]
- HUANG DA W, SHERMAN BT, LEMPICKI RA. Bioinformatics enrichment tools: paths toward the comprehensive functional analysis of large gene lists. Nucleic acids research. 2009a;37:1–13. doi: 10.1093/nar/gkn923. [DOI] [PMC free article] [PubMed] [Google Scholar]
- HUANG DA W, SHERMAN BT, LEMPICKI RA. Systematic and integrative analysis of large gene lists using DAVID bioinformatics resources. Nat Protoc. 2009b;4:44–57. doi: 10.1038/nprot.2008.211. [DOI] [PubMed] [Google Scholar]
- IBANEZ CF. Jekyll-Hyde neurotrophins: the story of proNGF. Trends in neurosciences. 2002;25:284–6. doi: 10.1016/s0166-2236(02)02169-0. [DOI] [PubMed] [Google Scholar]
- KRUSKAL BA, MAXFIELD FR. Cytosolic free calcium increases before and oscillates during frustrated phagocytosis in macrophages. The Journal of cell biology. 1987;105:2685–93. doi: 10.1083/jcb.105.6.2685. [DOI] [PMC free article] [PubMed] [Google Scholar]
- KRYGIER S, DJAKIEW D. Neurotrophin receptor p75(NTR) suppresses growth and nerve growth factor-mediated metastasis of human prostate cancer cells. International journal of cancer. Journal international du cancer. 2002;98:1–7. doi: 10.1002/ijc.10160. [DOI] [PubMed] [Google Scholar]
- LASKIN DL, SUNIL VR, GARDNER CR, LASKIN JD. Macrophages and tissue injury: agents of defense or destruction? Annual review of pharmacology and toxicology. 2011;51:267–88. doi: 10.1146/annurev.pharmtox.010909.105812. [DOI] [PMC free article] [PubMed] [Google Scholar]
- LE AP, FRIEDMAN WJ. Matrix metalloproteinase-7 regulates cleavage of pro-nerve growth factor and is neuroprotective following kainic acid-induced seizures. The Journal of neuroscience : the official journal of the Society for Neuroscience. 2012;32:703–12. doi: 10.1523/JNEUROSCI.4128-11.2012. [DOI] [PMC free article] [PubMed] [Google Scholar]
- LEVANTI MB, GERMANA A, CATANIA S, GERMANA GP, GAUNA-ANASCO L, VEGA JA, CIRIACO E. Neurotrophin receptor-like proteins in the bovine (Bos taurus) lymphoid organs, with special reference to thymus and spleen. Anatomia, histologia, embryologia. 2001;30:193–8. doi: 10.1046/j.1439-0264.2001.00329.x. [DOI] [PubMed] [Google Scholar]
- LEVI-MONTALCINI R, SKAPER SD, DAL TOSO R, PETRELLI L, LEON A. Nerve growth factor: from neurotrophin to neurokine. Trends in neurosciences. 1996;19:514–20. doi: 10.1016/S0166-2236(96)10058-8. [DOI] [PubMed] [Google Scholar]
- MALEMUD CJ. Matrix metalloproteinases (MMPs) in health and disease: an overview. Frontiers in bioscience : a journal and virtual library. 2006;11:1696–701. doi: 10.2741/1915. [DOI] [PubMed] [Google Scholar]
- MARTIN S, DICOU E, VINCENT JP, MAZELLA J. Neurotensin and the neurotensin receptor-3 in microglial cells. J Neurosci Res. 2005;81:322–6. doi: 10.1002/jnr.20477. [DOI] [PubMed] [Google Scholar]
- MARTIN S, VINCENT JP, MAZELLA J. Involvement of the neurotensin receptor-3 in the neurotensin-induced migration of human microglia. J Neurosci. 2003;23:1198–205. doi: 10.1523/JNEUROSCI.23-04-01198.2003. [DOI] [PMC free article] [PubMed] [Google Scholar]
- MEEKER RB, POULTON W, FENG WH, HUDSON L, LONGO FM. Suppression of Immunodeficiency Virus-Associated Neural Damage by the p75 Neurotrophin Receptor Ligand, LM11A-31, in an In Vitro Feline Model. Journal of neuroimmune pharmacology : the official journal of the Society on NeuroImmune Pharmacology. 2012;7:388–400. doi: 10.1007/s11481-011-9325-0. [DOI] [PMC free article] [PubMed] [Google Scholar]
- MURRAY PJ, WYNN TA. Protective and pathogenic functions of macrophage subsets. Nature reviews. Immunology. 2011;11:723–37. doi: 10.1038/nri3073. [DOI] [PMC free article] [PubMed] [Google Scholar]
- MYERS JT, SWANSON JA. Calcium spikes in activated macrophages during Fcgamma receptor-mediated phagocytosis. J Leukoc Biol. 2002;72:677–84. [PubMed] [Google Scholar]
- NAKAJIMA K, KIKUCHI Y, IKOMA E, HONDA S, ISHIKAWA M, LIU Y, KOHSAKA S. Neurotrophins regulate the function of cultured microglia. GLIA. 1998;24:272–289. doi: 10.1002/(sici)1098-1136(199811)24:3<272::aid-glia2>3.0.co;2-4. [DOI] [PubMed] [Google Scholar]
- NICO B, MANGIERI D, BENAGIANO V, CRIVELLATO E, RIBATTI D. Nerve growth factor as an angiogenic factor. Microvasc Res. 2008;75:135–41. doi: 10.1016/j.mvr.2007.07.004. [DOI] [PubMed] [Google Scholar]
- NYKJAER A, LEE R, TENG KK, JANSEN P, MADSEN P, NIELSEN MS, JACOBSEN C, KLIEMANNEL M, SCHWARZ E, WILLNOW TE, HEMPSTEAD BL, PETERSEN CM. Sortilin is essential for proNGF-induced neuronal cell death. Nature. 2004;427:843–8. doi: 10.1038/nature02319. [DOI] [PubMed] [Google Scholar]
- O'DONNELL LA, AGRAWAL A, JORDAN-SCIUTTO KL, DICHTER MA, LYNCH DR, KOLSON DL. Human immunodeficiency virus (HIV)-induced neurotoxicity: roles for the NMDA receptor subtypes. The Journal of neuroscience : the official journal of the Society for Neuroscience. 2006;26:981–90. doi: 10.1523/JNEUROSCI.4617-05.2006. [DOI] [PMC free article] [PubMed] [Google Scholar]
- OHSAWA K, IMAI Y, KANAZAWA H, SASAKI Y, KOHSAKA S. Involvement of Iba1 in membrane ruffling and phagocytosis of macrophages/microglia. Journal of cell science. 2000;113(Pt 17):3073–84. doi: 10.1242/jcs.113.17.3073. [DOI] [PubMed] [Google Scholar]
- PATEL PC, HARRISON RE. Membrane ruffles capture C3bi-opsonized particles in activated macrophages. Molecular biology of the cell. 2008;19:4628–39. doi: 10.1091/mbc.E08-02-0223. [DOI] [PMC free article] [PubMed] [Google Scholar]
- PULLIAM L, CLARKE JA, MCGRATH MS, MOORE D, MCGUIRE D. Monokine products as predictors of AIDS dementia. AIDS. 1996;10:1495–1500. doi: 10.1097/00002030-199611000-00006. [DOI] [PubMed] [Google Scholar]
- PULLIAM L, HERNDIER B, TANG N, MCGRATH M. Human Immunodeficiency Virus-infected Macrophages Produce Soluable Factors that cause Histological and Neurochemical Alterations in Cultured Human Brains. Journal of Clinical Investigations Inc. 1991;87:506–512. doi: 10.1172/JCI115024. [DOI] [PMC free article] [PubMed] [Google Scholar]
- RANSOHOFF RM, PERRY VH. Microglial physiology: unique stimuli, specialized responses. Annual review of immunology. 2009;27:119–45. doi: 10.1146/annurev.immunol.021908.132528. [DOI] [PubMed] [Google Scholar]
- REICHARDT LF. Neurotrophin-regulated signalling pathways. Philos.Trans.R.Soc.Lond B Biol.Sci. 2006;361:1545–1564. doi: 10.1098/rstb.2006.1894. [DOI] [PMC free article] [PubMed] [Google Scholar]
- SAMAH B, PORCHERAY F, DEREUDDRE-BOSQUET N, GRAS G. Nerve growth factor stimulation promotes CXCL-12 attraction of monocytes but decreases human immunodeficiency virus replication in attracted population. Journal of NeuroVirology. 2009;15:71–80. doi: 10.1080/13550280802482575. [DOI] [PubMed] [Google Scholar]
- SAMAH B, PORCHERAY F, GRAS G. Neurotrophins modulate monocyte chemotaxis without affecting macrophage function. Clinical and experimental immunology. 2008a;151:476–86. doi: 10.1111/j.1365-2249.2007.03578.x. [DOI] [PMC free article] [PubMed] [Google Scholar]
- SAMAH B, PORCHERAY F, GRAS G. Neurotrophins modulate monocyte chemotaxis without affecting macrophage function. Clin.Exp.Immunol. 2008b;151:476–486. doi: 10.1111/j.1365-2249.2007.03578.x. [DOI] [PMC free article] [PubMed] [Google Scholar]
- SZKLARCZYK A, CONANT K, OWENS DF, RAVIN R, MCKAY RD, GERFEN C. Matrix metalloproteinase-7 modulates synaptic vesicle recycling and induces atrophy of neuronal synapses. Neuroscience. 2007;149:87–98. doi: 10.1016/j.neuroscience.2007.07.032. [DOI] [PubMed] [Google Scholar]
- TIVERON C, FASULO L, CAPSONI S, MALERBA F, MARINELLI S, PAOLETTI F, PICCININ S, SCARDIGLI R, AMATO G, BRANDI R, CAPELLI P, D'AGUANNO S, FLORENZANO F, LA REGINA F, LECCI A, MANCA A, MELI G, PISTILLO L, BERRETTA N, NISTICO R, PAVONE F, CATTANEO A. ProNGF\NGF imbalance triggers learning and memory deficits, neurodegeneration and spontaneous epileptic-like discharges in transgenic mice. Cell death and differentiation. 2013;20:1017–30. doi: 10.1038/cdd.2013.22. [DOI] [PMC free article] [PubMed] [Google Scholar]
- TONCHEV AB, BONEVA NB, KAPLAMADZHIEV DB, KIKUCHI M, MORI Y, SAHARA S, YAMASHIMA T. Expression of neurotrophin receptors by proliferating glia in postischemic hippocampal CA1 sector of adult monkeys. J Neuroimmunol. 2008;205:20–4. doi: 10.1016/j.jneuroim.2008.07.016. [DOI] [PubMed] [Google Scholar]
- TOVAR YRLB, KOLSON DL, BANDARU VV, DREWES JL, GRAHAM DR, HAUGHEY NJ. Adenosine Triphosphate Released from HIV-Infected Macrophages Regulates Glutamatergic Tone and Dendritic Spine Density on Neurons. Journal of neuroimmune pharmacology : the official journal of the Society on NeuroImmune Pharmacology. 2013 doi: 10.1007/s11481-013-9471-7. [DOI] [PMC free article] [PubMed] [Google Scholar]
- URSHANSKY N, MAUSNER-FAINBERG K, AURIEL E, REGEV K, FARHUM F, KARNI A. Dysregulated neurotrophin mRNA production by immune cells of patients with relapsing remitting multiple sclerosis. J Neurol Sci. 2010;295:31–7. doi: 10.1016/j.jns.2010.05.019. [DOI] [PubMed] [Google Scholar]
- VAEGTER CB, JANSEN P, FJORBACK AW, GLERUP S, SKELDAL S, KJOLBY M, RICHNER M, ERDMANN B, NYENGAARD JR, TESSAROLLO L, LEWIN GR, WILLNOW TE, CHAO MV, NYKJAER A. Sortilin associates with Trk receptors to enhance anterograde transport and neurotrophin signaling. Nature neuroscience. 2011;14:54–61. doi: 10.1038/nn.2689. [DOI] [PMC free article] [PubMed] [Google Scholar]
- WHITE MG, WANG Y, AKAY C, LINDL KA, KOLSON DL, JORDAN-SCIUTTO KL. Parallel high throughput neuronal toxicity assays demonstrate uncoupling between loss of mitochondrial membrane potential and neuronal damage in a model of HIV-induced neurodegeneration. Neuroscience Research. 2011;70:220–9. doi: 10.1016/j.neures.2011.01.013. [DOI] [PMC free article] [PubMed] [Google Scholar]
- WONG I, LIAO H, BAI X, ZAKNIC A, ZHONG J, GUAN Y, LI HY, WANG YJ, ZHOU XF. ProBDNF inhibits infiltration of ED1+ macrophages after spinal cord injury. Brain, behavior, and immunity. 2010;24:585–97. doi: 10.1016/j.bbi.2010.01.001. [DOI] [PubMed] [Google Scholar]
- XIA J, WANG F, WANG L, FAN Q. Elevated serine protease HtrA1 inhibits cell proliferation, reduces invasion, and induces apoptosis in esophageal squamous cell carcinoma by blocking the nuclear factor-kappaB signaling pathway. Tumour biology : the journal of the International Society for Oncodevelopmental Biology and Medicine. 2013;34:317–28. doi: 10.1007/s13277-012-0553-6. [DOI] [PubMed] [Google Scholar]
- XIONG H, ZENG YC, LEWIS T, ZHENG J, PERSIDSKY Y, GENDELMAN HE. HIV-1 infected mononuclear phagocyte secretory products affect neuronal physiology leading to cellular demise: relevance for HIV-1-associated dementia. Journal of NeuroVirology. 2000;6(Suppl 1):S14–23. [PubMed] [Google Scholar]
- ZHANG X, ANGKASEKWINAI P, DONG C, TANG H. Structure and function of interleukin-17 family cytokines. Protein & cell. 2011;2:26–40. doi: 10.1007/s13238-011-1006-5. [DOI] [PMC free article] [PubMed] [Google Scholar]
- ZHU S, QIAN Y. IL-17/IL-17 receptor system in autoimmune disease: mechanisms and therapeutic potential. Clinical science. 2012;122:487–511. doi: 10.1042/CS20110496. [DOI] [PubMed] [Google Scholar]