

Abstract
Study Objectives:
The CACNA1C gene encodes the alpha 1C (α1C) subunit of the Cav1.2 voltage-dependent L-type calcium channel (LTCC). Some of the other voltage-dependent calcium channels, e.g., P-/Q-type, Cav2.1; N-type, Cav2.2; E-/R-type, Cav2.3; and T-type, Cav3.3 have been implicated in sleep modulation. However, the contribution of LTCCs to sleep remains largely unknown. Based on recent genome-wide association studies, CACNA1C emerged as one of potential candidate genes associated with both sleep and psychiatric disorders. Indeed, most patients with mental illnesses have sleep problems and vice versa.
Design:
To investigate an impact of Cav1.2 on sleep-wake behavior and electroencephalogram (EEG) activity, polysomnography was performed in heterozygous Cacna1c (HET) knockout mice and their wild-type (WT) littermates under baseline and challenging conditions (acute sleep deprivation and restraint stress).
Measurements and Results:
HET mice displayed significantly lower EEG spectral power than WT mice across high frequency ranges (beta to gamma) during wake and rapid eye movement (REM) sleep. Although HET mice spent slightly more time asleep in the dark period, daily amounts of sleep did not differ between the two genotypes. However, recovery sleep after exposure to both types of challenging stress conditions differed markedly; HET mice exhibited reduced REM sleep recovery responses compared to WT mice.
Conclusions:
These results suggest the involvement of Cacna1c (Cav1.2) in fast electroencephalogram oscillations and REM sleep regulatory processes. Lower spectral gamma activity, slightly increased sleep demands, and altered REM sleep responses found in heterozygous Cacna1c knockout mice may rather resemble a sleep phenotype observed in schizophrenia patients.
Citation:
Kumar D, Dedic N, FLachskamm C, Voulé S, Deussing JM, Kimura M. Cacna1c (Cav1.2) modulates electroencephalographic rhythm and rapid eye movement sleep recovery. SLEEP 2015;38(9):1371–1380.
Keywords: Cav1.2, Cacna1c, EEG spectral power, L-type voltage-dependent calcium channel, schizophrenia, sleep
INTRODUCTION
Many epidemiologic studies have shown a significance of sleep disturbances in psychiatric disorders. In one study, 40% of individuals in whom insomnia was diagnosed had a psychiatric disorder, whereas 46.4% of individuals with hyper-somnia were also comorbid with mental disease.1 Evidence of a genetic overlap between sleep quality and psychiatric disorders attested that to some extent the same genes would contribute to both phenotypes.2,3 Recently, several genome-wide association studies (GWAS) have revealed that the CACNA1C gene, which encodes the alpha 1C (α1C) subunit of the Cav1.2 voltage-dependent L-type calcium channel (LTCC), was significantly associated with mental illnesses such as bipolar disorders,4 major depression,5 schizophrenia6 and sleep disorders including narcolepsy7 and insomnia.8,9 In general, psychiatric or sleep phenotypes are largely assessed through questionnaires or diagnoses by physicians' consultations; thus, they depend to a large extent on subjective judgments and might thus bias the phenotype. In order to verify the statistically most significant findings from GWAS, there is a need for experimental settings to study the role of Cacna1c using genetic animal models, and to characterize it by an objective analysis.
Several earlier studies suggested that voltage-dependent calcium channels such as Cav3.3 (T-type),10,11 Cav2.1 (P-/Q-type),12 Cav2.2 (N-type),13 and Cav2.3 (E-/R-type)14 are considerably important modulators of sleep. Furthermore, the voltage-dependent calcium channel Cav3.3 was found to be crucial for electroencephalogram (EEG) rhythms where it regulates EEG spindle generation during sleeping.10,11 However, the role of LTCCs (Cav1.2) in sleep and EEG rhythm has yet to be elucidated. In the brain, the CACNA1C gene or Cav1.2 is densely expressed in the hippocampus and thalamus,15,16 which are important structures for rhythmic activity in EEGs.17,18 In the mouse brain, Cav1.2 accounts for approximately 85% of the LTCCs.19 A relatively high level of Cacna1c expression was also shown in the suprachiasmatic nucleus (SCN) of the mouse brain.20 The SCN plays an important role in the regulation of sleep amount and timing.21 Lesioning this structure abolishes the circadian sleep-wake rhythm, particularly the consolidation of sleep.21,22 Given the Cacna1c expression in the SCN, together with the association of this gene with sleep disorders, we hypothesized that Cacna1c deficiency might affect daily sleep-wake distribution. Because homozygous deletion of Cacna1c is lethal, we examined our hypothesis in heterozygous Cacna1c knockout (HET) mice, which have previously been used in a study for mood-related behaviors.23 Further, the dynamics of sleep-wake behavior is largely altered following biological or environmental challenges, whereas sleep patterns under baseline conditions appear normal. In this study, we therefore chose to conduct acute sleep deprivation to challenge homeostatic control of sleep-wake activity24 and restraint stress, a more severe challenge to impact sleep recovery, particularly the rebound of rapid eye movement (REM) sleep.25
METHODS AND MATERIALS
Animals
Heterozygous Cacna1c knockout mice (Cacna1c+/-, HET; n = 11) and their wild-type littermates (Cacna1c+/+, WT; n = 12) were obtained by interbreeding Cacna1c+/- mice.26 The mouse line was originally generated using R1 embryonic stem cells and subsequently kept on a mixed 129S1/Sv × 129X1/SvJ × C57BL/6 background. Only male mice were used in the current study. All animals were group-housed in the breeding facility of the Max Planck Institute of Psychiatry, Munich, Germany. Prior to surgery, the animals were moved to a sound-attenuated recording chamber and housed individually in Plexiglass cages (length 35 cm, width 25 cm, and height 25 cm). During recovery from surgery and throughout the experiments, the housing environment was kept at a constant temperature of 24 ± 1°C on a 12 h light-dark cycle (lights on at 08:00). The animals had access to water and food ad libitum. All animal experiments performed in the present study were conducted according to the guidance of the European Community Council Directive, and the protocol was approved by the local commission for the Care and Use of Laboratory Animals of the Government of Upper Bavaria, Germany.
Surgical Procedure
Under inhalation anesthesia with an isoflurane/oxygen mixture (Isofluran, DeltaSelect, Dreieich, Germany), the mice were fixed with a stereotaxic apparatus and chronically implanted with EEG and electromyogram (EMG) electrodes for polysomnographic recordings. The implant consisted of four gold wires (0.25–0.30 mm diameter) for EEG recordings, which were placed through the skull epidurally over the frontal and parietal cortices (coordinates, A +1.5 mm and −3 mm, L ± 1.7 mm each), and two additional gold wires were inserted into the cervical portion of the trapezoid muscles for EMG recordings. A thermistor (TT5-10KC3-5, Tewa temperature sensors, Lublin, Poland) was implanted in the subdural space (coordinates: A −2 mm and L 0.5 mm) for monitoring brain temperature. All electrodes and the thermistor were soldered to a micro-socket affixed to the skull with dental acrylic resin. Before the surgical operation, the animals received atropine sulfate (0.05 mg/ kg, Atropine, Braun Melsungen, Melsungen, Germany) subcutaneously to stabilize circulation, and meloxicam (0.5 mg/ kg, Metacam, Braun Melsungen) as a postoperative analgesic. After surgery, the mice were rested in their home cage for 2 w under the same environmental condition mentioned previously.
Data Acquisition
Four to eight mice were recorded simultaneously in each recording session. Animals from both genotypes were always included per session. The lead wires of the EEG, EMG electrodes, and thermistor were connected to an electric swivel through a flexible tether. The weights of the swivel and the tether were counterbalanced via a mechanical device close to zero; thus, the mice could move almost without restriction, and acclimation to the setting was confirmed prior to the initiation of recordings by comparison of food/water consumption with presurgery values. EEG and EMG signals were amplified (10,000×), and both filtered EEGs (0.25–64 Hz) and EMGs (175–1,000 Hz) that had undergone root mean square rectification were digitized by a high-speed analog-to-digital converter (NI-USB-6343-X-series, National Instruments, Austin, TX, USA) at a sampling rate of 128 Hz. The signals were then processed by a personal computer equipped with a LabVIEW-based acquisition system (National Instruments), especially designed for mouse sleep EEG/EMG and temperature data acquisition (EEGraVigilanz, SEA, Cologne, Germany). Poly-graphic data were stored on a computer and later processed offline.
After 24-h baseline recording of EEG/EMG and brain temperature, all WT (n = 12) and HET mice (n = 11) were subjected to sleep deprivation, and during the following week half of them (n = 6 each per genotype) received restraint stress. There was at least a 7-day interval between sleep deprivation and restraint stress exposure to ensure recovery. An additional baseline recording was performed before the restraint stress experiment.
Sleep deprivation was conducted for 6 h beginning at the onset of the light period (08:00–14:00) by gentle handling. During this sleep deprivation period, examiners paid careful attention to the mice by playing with cotton swabs or tissue papers, etc., avoiding a direct body touch. In the meantime, poly-graphical recordings were continuously made. In this way, we were able to cut off 97.0% of nonrapid eye movement (NREM) sleep and 100% of REM sleep on average. Over the sleep deprivation experiment, differences in recovery sleep were evaluated between the genotypes. Restraint stress was conducted for 1 h beginning at the onset of the light period (08:00–09:00). Restraint stress was achieved by enclosing each animal in a 50 mL falcon tube (diameter = 2.8 cm) with a slight opening at both ends for tail and nose. During restraint stress, their behavior was observed by examiners. Although recording cables were not connected for data acquisition during this 1-h period, the mice stayed awake constantly.
Sleep-Wake Data Analysis
All EEG and EMG wave forms were processed offline with the LabVIEW-based acquisition program, in which a fast Fourier Transform (FFT) algorithm served for power spectrum analysis of particular EEG frequency contents, i.e., EEG power density within the delta (0.5–5 Hz), theta (6–9 Hz), sigma (10–15 Hz), beta-1/-2 (16–23 and 23–32 Hz, respectively), and gamma (32–64 Hz) bands. Epochs containing artifacts and values between 50–50.25 Hz containing electrical noise from power supply were eliminated from power spectral analysis. With the aid of the adapted FFT algorithm, spectral analysis was also performed to provide semiautomatic classification of particular vigilance states as wakefulness and REM and NREM sleep, which were defined in each 4-sec epoch. The defined vigilance states were further confirmed visually and corrected, if necessary. To conduct EEG frequency analysis, mean values of the EEG spectrum per 0.25 Hz bin were calculated for each vigilance state and normalized with the individual average of total EEG power from all vigilance states across all frequency bins and epochs. Regarding slow wave activity (SWA), the absolute power of the frequency range between 0.5–4 Hz during NREM sleep was normalized by the averaged total EEG power from all vigilance states as previously mentioned. To analyze sleep architecture in detail, the number of rather short or relatively long REM and NREM sleep episodes were counted. Such a ”brief” or ”sustained” REM/NREM sleep episode was defined in terms of numbers of consecutive 4-sec epochs as requiring 15 (≤ 1 min) or more (> 1 min) epochs for REM sleep and 30 (≤ 2 min) or more (> 2 min) epochs for NREM sleep, respectively. Temperature data in each 4-sec epoch were normalized with the individual total mean value.
Statistics
For the effects of genotype (Cacna1c heterozygous, HET) on sleep and temperature, 24-h time-course changes in NREM sleep, REM sleep, SWA, and brain temperature were evaluated primarily by nonparametric two-way analysis of variance (ANOVA). On occasion, an unpaired t test was also applied to compare these changes between particular time windows if necessary. Differences in EEG spectral power between WT and HET mice were analyzed by one-way ANOVA with a Bonferroni post hoc test. Regarding responses to sleep deprivation and restraint stress, recovery sleep was first compared with own baseline per genotype using two-way ANOVA for repeated measures, then followed by a Bonferroni post hoc test whenever appropriate. The mean amount of REM sleep, REM sleep episode duration, and number were analyzed by Bonferroni multiple comparison test. In all cases, statistical significance was set at P < 0.05.
RESULTS
Cacna1c is Involved in Fast Oscillations of EEG Activity
Figure 1 illustrates a comparative difference in EEG power spectra across three different vigilance states of heterozygous Cacna1c knockout (HET) mice and their WT littermates. During wake, EEG power was significantly lower in HET mice than in WT mice over the high frequency ranges (Figure 1A, beta-2 to gamma, 20–64 Hz, P < 0.0001). Such a trend of reduced power spectra in HET mice along the fast-oscillating EEG activity also appeared in the sleep EEG. During REM sleep, both HET and WT mice displayed the same spectrum peak in the theta band, a typical EEG profile of REM sleep. However, the EEG power decreased from the sigma range and became significantly lower across the higher frequencies in HET mice than in WT mice (Figure 1B, beta-2 to gamma, 20–64 Hz, P < 0.001), which was similarly seen in the wake EEG. During NREM sleep, a typical NREM-related increase in delta power was indistinguishably observed in both geno-types (Figure 1C), and hardly any difference in the EEG power was detected in further frequency ranges.
Figure 1.
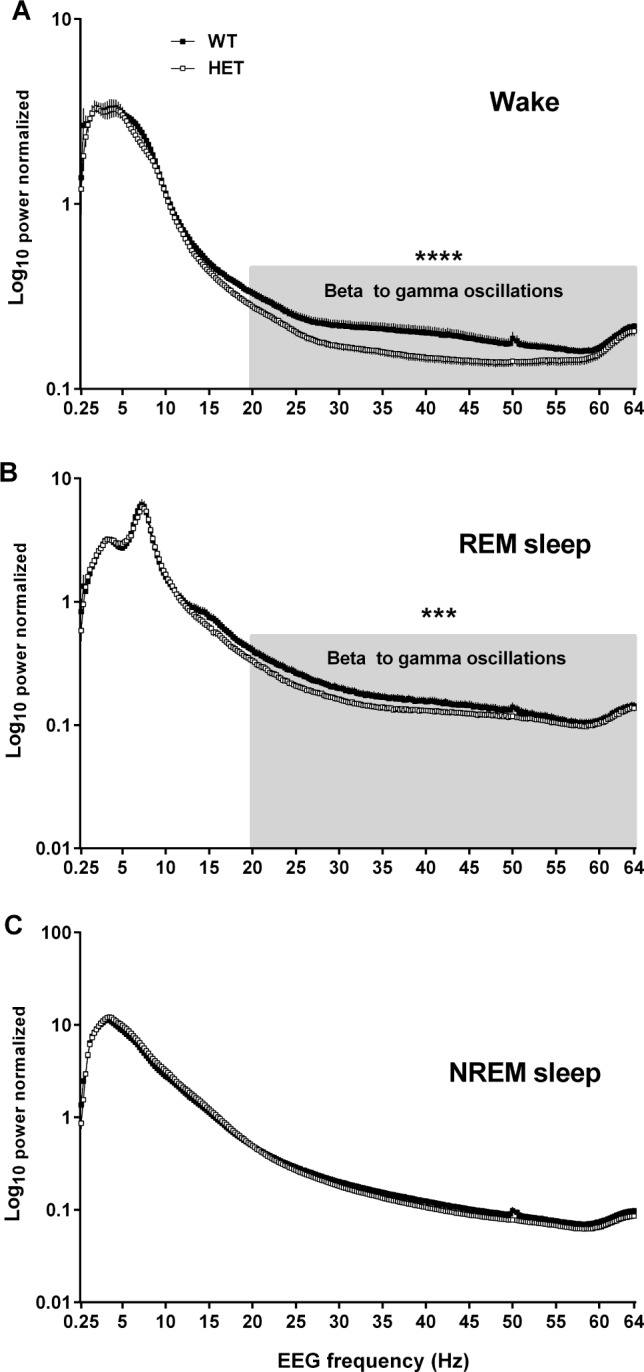
Changes in electroencephalogram (EEG) spectral power in different EEG frequencies (delta, 0.5–5 Hz; theta, 6–9 Hz; sigma, 10–15 Hz; beta-1, 16–23 Hz; beta-2, 23–32 Hz; gamma, 32–64 Hz) across all three vigilance states in heterozygous Cacna1c knockout (HET; n = 11) mice and wild-type littermates (WT; n = 12). (A) Wakefulness (Wake), (B) rapid eye movement (REM) sleep, and (C) nonrapid eye movement (NREM) sleep. All values are mean ± standard error of the mean. Horizontal gray areas indicate frequency ranges that show statistical differences between WT and HET: ***P < 0.001, ****P < 0.0001 (oneway analysis of variance with Bonferroni post hoc test).
Cacna1c Haploinsufficiency Moderately Promotes Nocturnal Sleep
In order to assess the effects of the Cacna1c haploinsufficiency on spontaneous sleep, vigilance states were classified from a 24-h baseline recording in HET and WT mice under the same 12:12 h light-dark cycle to which they had been exposed since birth. The daily amount of neither REM nor NREM sleep significantly differed between two genotypes in the baseline condition (Figure 2A and 2B). However, HET mice spent slightly more time in REM (Zeitgeber time [ZT] 15 h, P < 0.05, unpaired t test) and NREM sleep (ZT 15 h, P = 0.052, unpaired t test) limited only during the initial dark period. A lower cortical brain temperature during the first few hours in the dark period was associated with increased sleeping time in HET mice (Figure 2C). To characterize sleep architecture in HET mice, the average numbers of NREM and REM sleep episodes were compared in 6-h intervals over the light and dark period (Figure S1, supplemental material). HET mice spent more time than WT mice in shorter NREM sleep (P = 0.054) over the light and dark period, indicating their fragmented sleep architecture. However, SWA during NREM sleep tended to be higher in HET mice across 24 h, although the difference did not reach statistical significance (Figure 2D). Altogether, analysis on baseline vigilance states of HET mice suggests that a Cacna1c haploinsufficiency affects sleep quality. Due to fragmented sleep architecture in HET mice, compared to WT mice, sleep demands remained at the end of the light period, resulting in more entries into sleep episodes at the beginning of the active phase.
Figure 2.

Comparison of spontaneous sleep (baseline) and recovery sleep after challenging conditions between heterozygous Cacna1c knockout mice (HET, closed symbols; n = 11) and wild-type littermates (WT, open symbols; n = 12). (A) Rapid eye movement (REM) sleep (%), (B) nonrapid eye movement (NREM) sleep (%), (C) normalized cortical brain temperature, and (D) normalized slow wave activity (SWA) during NREM sleep under baseline condition. (E,G) Recovery responses of REM sleep and (F,H) NREM sleep after 6 h of sleep deprivation (SDep) or after 1 h of restraint stress (RS) initiated from the beginning of the light period, respectively. Significant effects of Cacna1c haploinsufficiency on sleep were found in REM sleep during recovery after restraint stress (G); HET mice showed lower REM sleep responses, compared to those in WT mice. All values are mean ± standard error of the mean. Significant differences between genotypes: *P < 0.05 (two-way analysis of variance).
Reduced REM Sleep Recovery After Sleep Deprivation in Heterozygous Cacna1c Knockout Mice
To address the question whether the Cacna1c haploinsufficiency affects the homeostatic regulation of sleep, usually indicated by accumulation of SWA, sleep responses to 6-h sleep deprivation were examined. Time-course changes in recovery sleep were very similar in both genotypes after sleep deprivation (Figures 2E and 2F). However, the comparison of recovery sleep with their own baseline revealed that responses of REM sleep, but not NREM sleep, appeared differently between the two genotypes (Figure 3). The magnitude of REM sleep responses in WT mice was higher (Figure 3C, F1,11 = 34.79, P < 0.0001) than in HET mice (Figure 3D, F1,11 = 12.67, P < 0.01), particularly during the first half of the dark period. Further quantitative analysis focusing on the first 6 h of the dark period (ZT 13–18 h, Figures 3E–3J) confirmed that WT mice spent more time in REM sleep than HET mice (mean difference = 3.4%, P < 0.0001) during this period (Figure 3E). Increased REM sleep in WT mice was a consequence of both longer REM sleep episode duration (Figure 3G, mean difference = 0.3 min; t = 3.48, P < 0.05) and high occurrences of REM sleep episodes (Figure 3H, mean difference = 8.3 episodes, P < 0.05). Although HET mice also showed REM sleep rebound after sleep deprivation (Figure 3D), REM sleep architecture was not significantly altered by sleep deprivation in HET mice (Figures 3I and 3J) during the first half of the dark period (P > 0.05, Figure 3F). Regarding NREM sleep changes after sleep deprivation, the difference in time spent in NREM sleep was not explicitly exhibited when compared with their own baseline (Figures 3A and 3B). However, both genotypes showed increased NREM episode length (WT, mean difference = 1.2 min, P < 0.001; HET, mean difference = 1.18 min, P < 0.001) but reduced episode number (WT, mean difference = 20.83 episodes, P < 0.0001; HET, mean difference = 23.27 episodes, P < 0.001) for the following 6 h immediately after sleep deprivation (Table S1, supplemental material). In addition, an increased level of NREM sleep SWA was detected immediately after sleep deprivation and maintained the higher level almost similarly throughout the second half of the light period in both WT (F1,5 = 18.96, P < 0.001) and HET (F1,5 = 10.78, P < 0.01) mice (Figure S2, supplemental material). Thus, homeostatic control on NREM sleep was preserved in Cacna1c haploinsufficiency. Brain temperature in both genotypes decreased immediately after sleep deprivation and stayed at a lower level throughout the recoding period (Figure S2). The decrease in brain temperature was more robust in the dark period (WT; F1,11 = 67.10, P < 0.0001; HET, F1,11 = 77.0, P < 0.0001) than in the light period, whereas the effects of sleep deprivation on brain temperature were similarly detected in both genotypes (Figure S2).
Figure 3.

Effects of the Cacna1c haploinsufficiency on recovery sleep responses to sleep deprivation (SDep). (A–D) Changes in nonrapid eye movement (NREM) sleep (%) and rapid eye movement (REM) sleep (%) in wild-type littermates (WT; n = 12, left panels) and heterozygous Cacna1c knockout mice (HET; n = 11, right panels) subjected to 6 h of sleep deprivation during the first 6 h of the light period. (E,F) Averaged REM sleep amount, (G,I) episode duration, and (H,J) occurrences of REM sleep during the first 6 h of the dark period (Zeitgeber time 13–18 h). All values are mean ± standard error of the mean. Significant differences between baseline and recovery: *P < 0.05, **P < 0.01, ***P < 0.001 (A–D; two-way analysis of variance [ANOVA], E–J; oneway ANOVA, Bonferroni multiple comparison post hoc test).
Reduced REM Sleep Response to Restraint Stress in Heterozygous Cacna1c Knockout Mice
To further address whether the Cacna1c haploinsufficiency influences stress-induced sleep responses, 1-h restraint stress was applied in both genotypes. In HET mice, REM sleep responses appeared to a significantly lower extent than in WT mice (Figure 2G, F1,21 = 5.03, P < 0.05). This was due to an unchanged episode number, especially a lack of sustained REM episodes in HET mice compared with WT mice, during the second half of the light period (ZT 6–12 h, P < 0.05, Figure S1). When compared to their own baseline, a significant rebound of REM sleep occurred after restraint stress in WT mice (F1,21 = 6.62, P < 0.05), but not in HET mice (Figures 4C and 4D). WT mice showed significantly more REM sleep (mean difference = 2.9%, P < 0.01) during the first half of the dark period (ZT 13–18 h, Figure 4E), which was due to a significantly increased number of REM episodes (Figure 4H, mean difference = 11.1 episodes, P < 0.05). HET mice showed no significant changes in the amount of REM sleep and REM episode architecture during that period (Figures 4F, 4I, and 4J). No significant differences in the amount of NREM sleep after restraint stress were observed in HET and WT mice (Figures 4A and 4B). However, both genotypes had increased NREM episode numbers (P < 0.05) with a trend toward reduced episode duration during the dark period after restraint stress (Table S1). Restraint stress increased brain temperature, whereas the changes returned to basal levels within 3 h and stayed in comparable ranges afterward. SWA in both geno-types were also comparable after restraint stress (Figure S3, supplemental material).
Figure 4.

Effects of the Cacna1c haploinsufficiency on recovery sleep responses to restraint stress (RS). (A–D) Changes in nonrapid eye movement (NREM) sleep (%) and rapid eye movement (REM) sleep (%) in wild-type littermates (WT; n = 6, left panels) and heterozygous Cacna1c knockout mice (HET; n = 6, right panels) mice subjected to 1 h of restraint stress during the first hour of the light period. (E,F) Averaged REM sleep amount, (G,I) episode duration, and (H,J) occurrences of REM sleep during the first 6 h of the dark period (Zeitgeber time, 13–18 h). All values are mean ± standard error of the mean. Significant differences between baseline and recovery: *P < 0.05, **P < 0.01 (A–D; two-way analysis of variance [ANOVA], E–J; one-way ANOVA, Bonferroni multiple comparison post hoc test).
DISCUSSION
Our results from the current study demonstrate a significant involvement of Cacna1c in sleep-wake regulation. For example, Cacna1c haploinsufficiency produced large-scale effects on the fast EEG (beta to gamma) rhythm during wake and REM sleep. Further, heterozygous Cacna1c mice failed to show their homeostatic REM sleep recovery process after acute stress conditions. This also suggests that reduced Cav1.2 function impairs stress-induced sleep responses as well as homeostatic control of sleep.
Observed in HET mice, such as lower EEG spectral power in the beta-gamma frequency range, a trend of higher SWA during NREM sleep and increased sleeping time in the active period of mice could be interrelated phenomena. Fast-oscillating EEG gamma activity is usually high during active waking in animals, reflecting the degree of behavioral arousal.27,28 It also reflects cortical arousal, independent of motor activity, because it attains high levels in association with attentive immobility but reaches its maximum during particular active behaviors (eating and moving) and also during REM sleep.27–29 Lower gamma activity in HET mice may indicate a lower level of arousal or alertness during wakefulness. It has previously been reported that beta activity reflects the degree of alertness.30,31 In addition, HET mice showed low REM sleep associated beta-gamma activity, suggesting again decreased cortical activation. Such low cortical arousal in HET mice might have also influenced SWA during NREM sleep, which remained higher than in WT mice, because it could lead to fragmented sleep cycles. Then, reduced Cacna1c function would indirectly increase somnolence or sleep debt, although sleep deprivation similarly elevated SWA in both genotypes. Based on our results from the variations in power spectra, one could suggest that Cacna1c haploinsufficiency decreases alertness during wakefulness and induces drowsiness. A slightly increased sleeping time at the beginning of the dark period displayed in HET mice might have occurred due to a remaining sleep demand.
The brain can switch vigilance states rapidly by excitation of the ascending arousal system along the reticular activating system (RAS).32,33 The RAS is composed of several neural circuits connecting the brainstem to the cortex via the thalamus. Fluctuations in RAS activity by a tonic excitatory drive control the rhythm in EEG.34,35 There are distinct differences in the EEG rhythm during periods of wakefulness and sleep: low-voltage, fast-oscillating EEG is associated with wakefulness and REM sleep, whereas high-voltage, slow-oscillating EEG is found during NREM sleep. Stimulation of the RAS produces low-voltage, fast-oscillating EEG by suppressing slow wave (delta band; 1–4 Hz) and by promoting gamma band (20–40 Hz) oscillations.36 Because Cacna1c is widely expressed in the brain including brainstem nuclei such as the laterodorsal tegmentum (LDT)37 and the dorsal raphe nucleus (DRN),38 and Cav1.2-mediated Ca2+ signaling is implicated in shaping neuronal discharge patterns,39,40 the decreased level of cortical arousal or beta-gamma activity detected in HET mice could be related to a diminished excitatory drive in the RAS due to low Cav1.2 expression.
Another possible pathway that could explain lower cortical activation in HET mice may underlie orexinergic circuits. Orexin/hypocretin produce a long-lasting excitation of arousal-related neurons including those in the LDT and DRN.37,38 Further, action of orexin/hypocretin on LDT and DRN neurons is likely to be mediated by Cav1.2.37,38 Therefore, decreased arousal in HET mice might have occurred due to decreased influences of hypocretin on arousal-related neurons. In fact, HEK 293 cells expressing the hypocretin 1 receptor display an increase in CACNA1C expression, triggered by hypocretin binding, suggesting that Cav1.2 is important in cellular action of hypocretinergic neural transmission.41
In addition, pharmacological studies have shown a possible connection of suppressed Cav1.2 action with cortical deactivation, i.e., NREM sleep. It has been found that pentobarbital-induced sleep can be augmented by LTCC blockers, verapamil, nifedipine, and diltiazem, respectively.42–45 For example, even direct application of diltiazem into the DRN extended total sleep time including slow wave sleep in rats treated with pentobarbital.46 This result was consistent with a previous report using oral gavage application of diltiazem.47 Thus, L-type Ca2+ channel blockers promote the hypnotic effects of anesthetics,42,43 plausibly due to suppression of Ca2+ influx through the LTCC.44 Reduced function of LTCCs has an impact on vigilance control, which reflects the sleep phenotype of heterozygous Cacna1c knockout mice.
Another interesting finding from this study is the reduced amount of REM sleep recovery in HET mice when exposed to challenging conditions. HET mice exhibited lower REM sleep rebound after sleep deprivation, indicating a modification in the homeostatic regulation of REM sleep. The brainstem area plays a pivotal role in REM sleep regulation.48,49 Because Cacna1c is widely expressed also in this region, low REM sleep responses to sleep deprivation and restraint might be attributed to decreased Ca2+ influx via Cav1.2.50 If this was the case, it might imply a role of LTCCs such as Cav1.2 in REM sleep homeostasis.
Recently, it has become more evident that stress-induced REM sleep rebound or compensation is an adaptive strategy to cope with aversive and stressful situations.51 A lower REM sleep rebound after restraint stress in HET mice suggests an impairment in an adaptive response to stress condition. The reduced rebound of REM sleep could also be associated with a decrease of Ca2+ mobilization within the brain. Restraint stress increases calcium mobilization in brain synaptosomes.52 In particular, calcium mobilization/influx through LTCCs is important for restraint stress-induced responses. It has been confirmed that pretreatment with cilnidipine (L- and N-type calcium channel blocker) and nimodipine (L-type calcium channel blocker) significantly attenuates restraint stress-induced behavioral alterations,53 neuroadaptive responses54 and serum corticosterone levels.55
In addition to the brain, Cav1.2 channels are expressed throughout the heart, especially in cardiac muscles and cerebral arteries, and have been shown to be important for cardiac physiology.26 It has been reported that Cacna1c haploinsufficiency produces only a modest decrease in cardiac function during adulthood, whereas severe physical stress conditions are able to generate detrimental effects in cardiomyocytes of HET mice.56 The exposure to restraint stress may evoke an increase in cardiac parameters such as heart rate or blood pressure, which may eventually lead to neuroendocrine stress. In this case, increased adrenergic tones in the sympathetic nerves may stimulate the central nervous system, which may indirectly contribute to the reduced rebound of REM sleep during recovery from restraint. Further, Cav1.2 is also found in pituitary cells,57 where Cav1.2-mediated LTCC current seems to be implicated in prolactin release.58 Because prolactin is considered as a promoter of rebound sleep after stress,25 the reduced stress-induced REM sleep in HET mice could to some extent be related to the reduced release of prolactin or other stress-related pituitary hormones. In accordance with previous studies, HET mice were largely indistinguishable from WT littermates; both exhibited normal body weight, life expectancy, and reproduction.26 Although one has to consider that changes that occurred during development due to reduced expression of peripheral Cav1.2 may indirectly affect the establishment of sleep phenotype observed in HET mice, it seems very unlikely that those peripheral changes account for altered central activities such as beta/gamma oscillations displayed in EEG spectra.
The relationships between sleep and mood disorders are complex. Although further tests are necessary, current results from heterozygous Cacna1c knockout mice may add further relevance to genes associated with psychiatric diseases and mental distress-impaired sleep architecture. Alteration in the amplitude of the gamma rhythm has been found in schizophrenia.59,60 Negative symptoms of schizophrenia, e.g., poor attention, decline in social interactions, and lack of motivation, may be linked to a subtle change in gamma EEG activity, which is primarily driven by the tonic excitatory drive and responsible for behavioral processes such as perception, consciousness and memory. As mentioned earlier, Cacna1c haploinsufficiency could interfere with the normal tonic excitation in the RAS resulting in changes in gamma rhythms, which is a feature of schizophrenia. Decreased alertness and accumulated drowsiness during wakefulness in HET mice may be a replication of the negative symptoms of schizophrenia.
The literature emphasizes a link between schizophrenia and REM sleep.61,62 Positive symptoms of schizophrenia (hallucinations and paranoia) may be related to malfunctioning REM sleep processes. Data from experimental conditions revealed that abnormal mentation of patients with schizophrenia during waking has a similar degree of formal cognitive bizarreness as dream narratives obtained from both nonclinical and clinical populations.63 In this study, we found the reduced REM sleep recovery response in heterozygous Cacna1c knockout mice under challenging conditions, showing a malfunctioning of the REM sleep process in Cav1.2 deficiency after exposure to acute stress conditions. A failure of REM sleep recovery may increase the risk in the case of repeated or chronic exposure to any challenging conditions. Based on the data obtained in the current study, we conclude that Cav1.2-mediated Ca2+ signaling participates in the control of EEG gamma oscillation and of the REM sleep regulatory process. Heterozygous Cacna1c knockout mice are at least partially predisposed to manifestations of impaired sleep regulation rather resembling those of schizophrenia than depression or other psychiatric diseases.
DISCLOSURE STATEMENT
This was not an industry supported study. This work was partially supported by the German Federal Ministry of Education and Research (BMBF) within the framework of the e:Med research and funding concept (IntegraMent: Integrated Understanding of Causes and Mechanisms in Mental Disorders) and by the program for medical genome research within the framework of the NGFN-Plus (FKZ: 01GS08155). The authors have indicated no financial conflicts of interest. This work was conducted at the Max Planck Institute of Psychiatry, Munich, Germany.
ACKNOWLEDGMENTS
The authors thank Sven Moosmang and Franz Hofmann for providing heterozygous Cacna1c knockout mice.
SUPPLEMENTAL MATERIAL
Mean episode length (min) and number of rapid eye movement and nonrapid eye movement sleep at various conditions.
The count of brief and sustained nonrapid eye movement (NREM) sleep episodes (left diagrams) and rapid eye movement (REM) sleep episodes (right diagrams) per 6-h bin in baseline, sleep deprivation, and restraint stress conditions. A brief or sustained REM/NREM sleep episode was defined in terms of numbers of consecutive 4-sec epochs as requiring 15 (≤ 1 min) or more (> 1 min) epochs for REM sleep and 30 (≤ 2 min) or more (> 2 min) epochs for NREM sleep, respectively. All values are mean ± standard error of the mean. A significant difference between genotypes: *P < 0.05.
Effects of the Cacna1c haploinsufficiency on changes in slow wave activity (SWA) and brain temperature (Tcort) in response to sleep deprivation (SDep). Wild-type littermates (WT; n = 12) and heterozygous Cacna1c knockout mice (HET; n = 11) were subjected to 6 h of sleep deprivation during the first 6 h of the light period. (A–D) Comparisons of SWA (A,B) and Tcort (C,D) within the same genotype (left; WT, right; HET). (E,F) Comparisons of SWA (E) and Tcort (F) between WT and HET mice. The Cacna1c haploinsufficiency did not cause differences in SWA or Tcort responses to sleep deprivation. All values are mean ± standard error of the mean. **P < 0.01, ***P < 0.001 (two-way analysis of variance).
Effects of the Cacna1c haploinsufficiency on changes in slow wave activity (SWA) and brain temperature (Tcort) in response to restraint stress (RS). Wild-type littermates (WT; n = 6) and heterozygous Cacna1c knockout mice (HET; n = 6) were subjected to 1 h of restraint stress during the first hour of the light period. (A–D) Comparisons of SWA (A,B) and Tcort (C,D) within the same genotype (left; WT, right; HET). (E,F) Comparisons of SWA (E) and Tcort (F) between WT and HET mice. The Cacna1c haploinsufficiency did not cause differences in SWA or Tcort responses to restraint stress. All values are mean ± standard error of the mean. ***P < 0.001 (two-way analysis of variance).
REFERENCES
- 1.Ford DE, Kamerow DB. Epidemiologic study of sleep disturbances and psychiatric disorders. An opportunity for prevention? JAMA. 1989;262:1479–84. doi: 10.1001/jama.262.11.1479. [DOI] [PubMed] [Google Scholar]
- 2.Utge S, Kronholm E, Partonen T, et al. Shared genetic background for regulation of mood and sleep: association of GRIA3 with sleep duration in healthy Finnish women. Sleep. 2011;34:1309–16. doi: 10.5665/SLEEP.1268. [DOI] [PMC free article] [PubMed] [Google Scholar]
- 3.Utge SJ, Soronen P, Loukola A, et al. Systematic analysis of circadian genes in a population-based sample reveals association of TIMELESS with depression and sleep disturbance. PLoS One. 2010;5:e9259. doi: 10.1371/journal.pone.0009259. [DOI] [PMC free article] [PubMed] [Google Scholar]
- 4.Ferreira MA, O'Donovan MC, Meng YA, et al. Collaborative genome-wide association analysis supports a role for ANK3 and CACNA1C in bipolar disorder. Nat Genet. 2008;40:1056–8. doi: 10.1038/ng.209. [DOI] [PMC free article] [PubMed] [Google Scholar]
- 5.Green EK, Grozeva D, Jones I, et al. The bipolar disorder risk allele at CACNA1C also confers risk of recurrent major depression and of schizophrenia. Mol Psychiatry. 2010;15:1016–22. doi: 10.1038/mp.2009.49. [DOI] [PMC free article] [PubMed] [Google Scholar]
- 6.Nyegaard M, Demontis D, Foldager L, et al. CACNA1C (rs1006737) is associated with schizophrenia. Mol Psychiatry. 2010;15:119–21. doi: 10.1038/mp.2009.69. [DOI] [PubMed] [Google Scholar]
- 7.Shimada M, Miyagawa T, Kawashima M, et al. An approach based on a genome-wide association study reveals candidate loci for narcolepsy. Hum Genet. 2010;128:433–41. doi: 10.1007/s00439-010-0862-z. [DOI] [PubMed] [Google Scholar]
- 8.Byrne EM, Gehrman PR, Medland SE, et al. A genome-wide association study of sleep habits and insomnia. Am J Med Genet B Neuropsychiatr Genet. 2013;162:439–51. doi: 10.1002/ajmg.b.32168. [DOI] [PMC free article] [PubMed] [Google Scholar]
- 9.Parsons MJ, Lester KJ, Barclay NL, Nolan PM, Eley TC, Gregory AM. Replication of Genome-Wide Association Studies (GWAS) loci for sleep in the British G1219 cohort. Am J Med Genet B Neuropsychiatr Genet. 2013;162:431–8. doi: 10.1002/ajmg.b.32106. [DOI] [PubMed] [Google Scholar]
- 10.Astori S, Wimmer RD, Prosser HM, et al. The Cav3.3 calcium channel is the major sleep spindle pacemaker in thalamus. Proc Natl Acad Sci U S A. 2011;108:13823–8. doi: 10.1073/pnas.1105115108. [DOI] [PMC free article] [PubMed] [Google Scholar]
- 11.Lee J, Shin HS. T-type calcium channels and thalamocortical rhythms in sleep: a perspective from studies of T-type calcium channel knockout mice. CNS Neurol Disord Drug Targets. 2007;6:63–9. doi: 10.2174/187152707779940817. [DOI] [PubMed] [Google Scholar]
- 12.Deboer T, van Diepen HC, Ferrari MD, Van den Maagdenberg AM, Meijer JH. Reduced sleep and low adenosinergic sensitivity in Cacna1a R192Q mutant mice. Sleep. 2013;36:127–36. doi: 10.5665/sleep.2316. [DOI] [PMC free article] [PubMed] [Google Scholar]
- 13.Beuckmann CT, Sinton CM, Miyamoto N, Ino M, Yanagisawa M. N-type calcium channel a1B subunit (Cav2.2) knock-out mice display hyperactivity and vigilance state differences. J Neurosci. 2003;23:6793–7. doi: 10.1523/JNEUROSCI.23-17-06793.2003. [DOI] [PMC free article] [PubMed] [Google Scholar]
- 14.Münch A, Dibue M, Hescheler J, Schneider T. Cav2.3 E-/R-type voltage gated channels modulate sleep in mice. Somnologie. 2013;17:185–92. [Google Scholar]
- 15.Obermair GJ, Szabo Z, Bourinet E, Flucher BE. Differential targeting of the L-type Ca2+ channel a1C (Cav1.2) to synaptic and extrasynaptic compartments in hippocampal neurons. Eur J Neurosci. 2004;19:2109–22. doi: 10.1111/j.0953-816X.2004.03272.x. [DOI] [PubMed] [Google Scholar]
- 16.Splawski I, Timothy KW, Sharpe LM, et al. Cav1.2 calcium channel dysfunction causes a multisystem disorder including arrhythmia and autism. Cell. 2004;119:19–31. doi: 10.1016/j.cell.2004.09.011. [DOI] [PubMed] [Google Scholar]
- 17.Cantero JL, Atienza M, Stickgold R, Kahana MJ, Madsen JR, Kocsis B. Sleep-dependent theta oscillations in the human hippocampus and neocortex. J Neurosci. 2003;23:10897–903. doi: 10.1523/JNEUROSCI.23-34-10897.2003. [DOI] [PMC free article] [PubMed] [Google Scholar]
- 18.Steriade M, McCormick DA, Sejnowski TJ. Thalamocortical oscillations in the sleeping and aroused brain. Science. 1993;262:679–85. doi: 10.1126/science.8235588. [DOI] [PubMed] [Google Scholar]
- 19.Sinnegger-Brauns MJ, Huber IG, Koschak A, et al. Expression and 1,4-dihydropyridine-binding properties of brain L-type calcium channel isoforms. Mol Pharmacol. 2009;75:407–14. doi: 10.1124/mol.108.049981. [DOI] [PubMed] [Google Scholar]
- 20.Nahm SS, Farnell YZ, Griffith W, Earnest DJ. Circadian regulation and function of voltage-dependent calcium channels in the suprachiasmatic nucleus. J Neurosci. 2005;25:9304–8. doi: 10.1523/JNEUROSCI.2733-05.2005. [DOI] [PMC free article] [PubMed] [Google Scholar]
- 21.Easton A, Meerlo P, Bergmann B, Turek FW. The suprachiasmatic nucleus regulates sleep timing and amount in mice. Sleep. 2004;27:1307–18. doi: 10.1093/sleep/27.7.1307. [DOI] [PubMed] [Google Scholar]
- 22.Edgar DM, Dement WC, Fuller CA. Effect of SCN lesions on sleep in squirrel monkeys: evidence for opponent processes in sleep-wake regulation. J Neurosci. 1993;13:1065–79. doi: 10.1523/JNEUROSCI.13-03-01065.1993. [DOI] [PMC free article] [PubMed] [Google Scholar]
- 23.Dao DT, Mahon PB, Cai X, et al. Mood disorder susceptibility gene CACNA1C modifies mood-related behaviors in mice and interacts with sex to influence behavior in mice and diagnosis in humans. Biol Psychiatry. 2010;68:801–10. doi: 10.1016/j.biopsych.2010.06.019. [DOI] [PMC free article] [PubMed] [Google Scholar]
- 24.Huber R, Deboer T, Tobler I. Effects of sleep deprivation on sleep and sleep EEG in three mouse strains: empirical data and simulations. Brain Res. 2000;857:8–19. doi: 10.1016/s0006-8993(99)02248-9. [DOI] [PubMed] [Google Scholar]
- 25.Meerlo P, Easton A, Bergmann BM, Turek FW. Restraint increases prolactin and REM sleep in C57BL/6J mice but not in BALB/cJ mice. Am J Physiol Regul Integr Comp Physiol. 2001;28:R846–54. doi: 10.1152/ajpregu.2001.281.3.R846. [DOI] [PubMed] [Google Scholar]
- 26.Seisenberger C, Specht V, Welling A, et al. Functional embryonic cardiomyocytes after disruption of the L-type a1C (Cav1.2) calcium channel gene in the mouse. J Biol Chem. 2000;275:39193–9. doi: 10.1074/jbc.M006467200. [DOI] [PubMed] [Google Scholar]
- 27.Franken P, Dijk DJ, Tobler I, Borbély AA. High-frequency components of the rat electrocorticogram are modulated by the vigilance states. Neurosci Lett. 1994;167:89–92. doi: 10.1016/0304-3940(94)91034-0. [DOI] [PubMed] [Google Scholar]
- 28.Maloney KJ, Cape EG, Gotman J, Jones BE. High-frequency gamma electroencephalogram activity in association with sleep-wake states and spontaneous behaviors in the rat. Neuroscience. 1997;76:541–55. doi: 10.1016/s0306-4522(96)00298-9. [DOI] [PubMed] [Google Scholar]
- 29.Bressler SL. The gamma wave: a cortical information carrier? Trends Neurosci. 1990;13:161–2. doi: 10.1016/0166-2236(90)90039-d. [DOI] [PubMed] [Google Scholar]
- 30.Gola M, Kamiński J, Brzezicka A, Wróbel A. Beta band oscillations as a correlate of alertness - Changes in aging. Int J Psychophysiol. 2012;85:62–7. doi: 10.1016/j.ijpsycho.2011.09.001. [DOI] [PubMed] [Google Scholar]
- 31.Wróbel A. Beta activity: a carrier for visual attention. Acta Neurobiol Exp (Wars) 2000;60:247–60. doi: 10.55782/ane-2000-1344. [DOI] [PubMed] [Google Scholar]
- 32.Svorad D. Reticular activating system of brain stem and animal hypnosis. Science. 1957;125:156. doi: 10.1126/science.125.3239.156. [DOI] [PubMed] [Google Scholar]
- 33.Steriade M. Arousal: revisiting the reticular activating system. Science. 1996;272:225–6. doi: 10.1126/science.272.5259.225. [DOI] [PubMed] [Google Scholar]
- 34.Moruzzi G, Magoun HW. Brain stem reticular formation and activation of the EEG. Electroencephalogr Clin Neurophysiol. 1949;4:455–73. [PubMed] [Google Scholar]
- 35.Kayama Y, Ito S, Koyama Y, Jodo E. Tonic and phasic components of the ascending reticular activating system. Fukushima J Med Sci. 1991;37:59–74. [PubMed] [Google Scholar]
- 36.Mohan Kumar V, Mallick BN, Chhina GS, Singh B. Influence of ascending reticular activating system on preoptic neuronal activity. Exp Neurol. 1984;86:40–52. doi: 10.1016/0014-4886(84)90065-7. [DOI] [PubMed] [Google Scholar]
- 37.Kohlmeier KA, Watanabe S, Tyler CJ, Burlet S, Leonard CS. Dual orexin actions on dorsal raphe and laterodorsal tegmentum neurons: noisy cation current activation and selective enhancement of Ca2+ transients mediated by L-type calcium channels. J Neurophysiol. 2008;100:2265–81. doi: 10.1152/jn.01388.2007. [DOI] [PMC free article] [PubMed] [Google Scholar]
- 38.Penington NJ, Kelly JS, Fox AP. A study of the mechanism of Ca2+ current inhibition produced by serotonin in rat dorsal raphe neurons. J Neurosci. 1991;11:3594–609. doi: 10.1523/JNEUROSCI.11-11-03594.1991. [DOI] [PMC free article] [PubMed] [Google Scholar]
- 39.Moyer JR, Jr, Thompson LT, Black JP, Disterhoft JF. Nimodipine increases excitability of rabbit CA1 pyramidal neurons in an age- and concentration-dependent manner. J Neurophysiol. 1992;68:2100–9. doi: 10.1152/jn.1992.68.6.2100. [DOI] [PubMed] [Google Scholar]
- 40.Morisset V, Nagy F. Ionic basis for plateau potentials in deep dorsal horn neurons of the rat spinal cord. J Neurosci. 1999;19:7309–16. doi: 10.1523/JNEUROSCI.19-17-07309.1999. [DOI] [PMC free article] [PubMed] [Google Scholar]
- 41.Sikder D, Kodadek T. The neurohormone orexin stimulates hypoxiainducible factor-1 activity. Genes Dev. 2007;21:2995–3005. doi: 10.1101/gad.1584307. [DOI] [PMC free article] [PubMed] [Google Scholar]
- 42.Czuczwar SJ, Małek U, Kleinrok Z. Influence of calcium channel inhibitors upon the anticonvulsant efficacy of common antiepileptics against pentylenetetrazol-induced convulsions in mice. Neuropharmacology. 1990;29:943–8. doi: 10.1016/0028-3908(90)90145-h. [DOI] [PubMed] [Google Scholar]
- 43.Dolin SJ, Patch TL, Rabbani M, Taberner PV, Little HJ. Differential interactions between benzodiazepines and the dihydropyridines, nitrendipine and Bay K 8644. Neuropharmacology. 1991;30:217–24. doi: 10.1016/0028-3908(91)90148-5. [DOI] [PubMed] [Google Scholar]
- 44.Takahashi H, Yoshimoto M, Higuchi H, Shimizu T, Hishikawa Y. Different effects of L-type and T-type calcium channel blockers on the hypnotic potency of triazolam and zolpidem in rats. Eur Neuropsychopharmacol. 1999;9:317–21. doi: 10.1016/s0924-977x(98)00051-0. [DOI] [PubMed] [Google Scholar]
- 45.Zhao X, Cui XY, Chu QP, et al. Potentiating effects of L-type Ca2+ channel blockers on pentobarbital-induced hypnosis are influenced by serotonergic system. J Neural Transm. 2006;113:1395–402. doi: 10.1007/s00702-005-0422-1. [DOI] [PubMed] [Google Scholar]
- 46.Cui SY, Cui XY, Zhang J, et al. Ca2+ modulation in dorsal raphe plays an important role in NREM and REM sleep regulation during pentobarbital hypnosis. Brain Res. 2011;1403:12–18. doi: 10.1016/j.brainres.2011.05.064. [DOI] [PubMed] [Google Scholar]
- 47.Zhao X, Cui XY, Wang LE, Zhang YH. Potentiating effect of diltiazem on pentobarbital-induced hypnosis is augmented by serotonergic system: the TMN and VLPO as key elements in the pathway. Neuropharmacology. 2009;56:937–43. doi: 10.1016/j.neuropharm.2009.01.017. [DOI] [PubMed] [Google Scholar]
- 48.Luppi PH, Clement O, Sapin E, et al. Brainstem mechanisms of paradoxical (REM) sleep generation. Pflugers Arch. 2012;463:43–52. doi: 10.1007/s00424-011-1054-y. [DOI] [PubMed] [Google Scholar]
- 49.Lu J, Sherman D, Devor M, Saper CB. A putative flip-flop switch for control of REM sleep. Nature. 2006;441:589–94. doi: 10.1038/nature04767. [DOI] [PubMed] [Google Scholar]
- 50.Mallick BN, Gulyani S. Alterations in synaptosomal calcium concentrations after rapid eye movement sleep deprivation in rats. Neuroscience. 1996;75:729–36. doi: 10.1016/0306-4522(96)00177-7. [DOI] [PubMed] [Google Scholar]
- 51.Suchecki D, Tiba PA, Machado RB. REM sleep rebound as an adaptive response to stressful situations. Front Neurol. 2012;3:41. doi: 10.3389/fneur.2012.00041. [DOI] [PMC free article] [PubMed] [Google Scholar]
- 52.Satoh E, Shimeki S. Acute restraint stress enhances calcium mobilization and glutamate exocytosis in cerebrocortical synaptosomes from mice. Neurochem Res. 2010;35:693–701. doi: 10.1007/s11064-009-0120-8. [DOI] [PubMed] [Google Scholar]
- 53.Kumar N, Singh N, Jaggi AS. Anti-stress effects of cilnidipine and nimodipine in immobilization subjected mice. Physiol Behav. 2012;105:1148–55. doi: 10.1016/j.physbeh.2011.12.011. [DOI] [PubMed] [Google Scholar]
- 54.Mamczarz J, Budziszewska B, Antkiewicz-Michaluk L, Vetulani J. The Ca2+ channel blockade changes the behavioral and biochemical effects of immobilization stress. Neuropsychopharmacology. 1999;20:248–54. doi: 10.1016/S0893-133X(98)00071-2. [DOI] [PubMed] [Google Scholar]
- 55.Esmaeili-Mahani S, Fathi Y, Motamedi F, Hosseinpanah F, Ahmadiani A. L-type calcium channel blockade attenuates morphine withdrawal: in vivo interaction between L-type calcium channels and corticosterone. Horm Behav. 2008;53:351–7. doi: 10.1016/j.yhbeh.2007.10.012. [DOI] [PubMed] [Google Scholar]
- 56.Goonasekera SA, Hammer K, Auger-Messier M, et al. Decreased cardiac L-type Ca2+ channel activity induces hypertrophy and heart failure in mice. J Clin Invest. 2012;122:280–90. doi: 10.1172/JCI58227. [DOI] [PMC free article] [PubMed] [Google Scholar]
- 57.Wang D, Yan B, Rajapaksha WR, Fisher TE. The expression of voltage-gated Ca2+ channels in pituicytes and the up-regulation of L-type Ca2+ channels during water deprivation. J Neuroendocrinol. 2009;21:858–66. doi: 10.1111/j.1365-2826.2009.01906.x. [DOI] [PubMed] [Google Scholar]
- 58.Charles AC, Piros ET, Evans CJ, Hales TG. L-type Ca2+ channels and K+ channels specifically modulate the frequency and amplitude of spontaneous Ca2+ oscillations and have distinct roles in prolactin release in GH3 cells. J Biol Chem. 1999;274:7508–15. doi: 10.1074/jbc.274.11.7508. [DOI] [PubMed] [Google Scholar]
- 59.Uhlhaas PJ, Singer W. Abnormal neural oscillations and synchrony in schizophrenia. Nat Rev Neurosci. 2010;11:100–13. doi: 10.1038/nrn2774. [DOI] [PubMed] [Google Scholar]
- 60.Shin YW, O'Donnell BF, Youn S, Kwon JS. Gamma oscillation in schizophrenia. Psychiatry Investig. 2011;84:288–96. doi: 10.4306/pi.2011.8.4.288. [DOI] [PMC free article] [PubMed] [Google Scholar]
- 61.Skrzypińska D, Szmigielska B. What links schizophrenia and dreaming? Common phenomenological and neurobiological features of schizophrenia and REM sleep. Arch Psychiatry Psychother. 2013;2:29–35. [Google Scholar]
- 62.Gottesmann C. Dreaming and schizophrenia: a common neurobiological background? Med Sci (Paris) 2006;22:201–5. doi: 10.1051/medsci/2006222201. [DOI] [PubMed] [Google Scholar]
- 63.Noreika V, Valli K, Markkula J, Seppälä K, Revonsuo A. Dream bizarreness and waking thought in schizophrenia. Psychiatry Res. 2010;178:562–4. doi: 10.1016/j.psychres.2010.04.034. [DOI] [PubMed] [Google Scholar]
Associated Data
This section collects any data citations, data availability statements, or supplementary materials included in this article.
Supplementary Materials
Mean episode length (min) and number of rapid eye movement and nonrapid eye movement sleep at various conditions.
The count of brief and sustained nonrapid eye movement (NREM) sleep episodes (left diagrams) and rapid eye movement (REM) sleep episodes (right diagrams) per 6-h bin in baseline, sleep deprivation, and restraint stress conditions. A brief or sustained REM/NREM sleep episode was defined in terms of numbers of consecutive 4-sec epochs as requiring 15 (≤ 1 min) or more (> 1 min) epochs for REM sleep and 30 (≤ 2 min) or more (> 2 min) epochs for NREM sleep, respectively. All values are mean ± standard error of the mean. A significant difference between genotypes: *P < 0.05.
Effects of the Cacna1c haploinsufficiency on changes in slow wave activity (SWA) and brain temperature (Tcort) in response to sleep deprivation (SDep). Wild-type littermates (WT; n = 12) and heterozygous Cacna1c knockout mice (HET; n = 11) were subjected to 6 h of sleep deprivation during the first 6 h of the light period. (A–D) Comparisons of SWA (A,B) and Tcort (C,D) within the same genotype (left; WT, right; HET). (E,F) Comparisons of SWA (E) and Tcort (F) between WT and HET mice. The Cacna1c haploinsufficiency did not cause differences in SWA or Tcort responses to sleep deprivation. All values are mean ± standard error of the mean. **P < 0.01, ***P < 0.001 (two-way analysis of variance).
Effects of the Cacna1c haploinsufficiency on changes in slow wave activity (SWA) and brain temperature (Tcort) in response to restraint stress (RS). Wild-type littermates (WT; n = 6) and heterozygous Cacna1c knockout mice (HET; n = 6) were subjected to 1 h of restraint stress during the first hour of the light period. (A–D) Comparisons of SWA (A,B) and Tcort (C,D) within the same genotype (left; WT, right; HET). (E,F) Comparisons of SWA (E) and Tcort (F) between WT and HET mice. The Cacna1c haploinsufficiency did not cause differences in SWA or Tcort responses to restraint stress. All values are mean ± standard error of the mean. ***P < 0.001 (two-way analysis of variance).