Significance
ATP synthase produces most of the ATP in respiratory and photosynthetic cells. It is a rotary motor enzyme and its catalytic portion F1-ATPase hydrolyzes ATP to drive rotation of the central γ subunit. Efficiency of chemomechanical energy conversion by this motor is always near-perfect under different ATP hydrolysis energy (ΔGATP) conditions. However, the mechanism for the efficient conversion remains unknown. We measured the torque as a function of rotation angle under different ΔGATP conditions and estimated mechanical work. The torque profiles show three sawtooth-like repeats during a single ATP hydrolysis. When concentrations of ATP/ADP and Pi in the environment are changed, the height, and hence the area, of the sawtooth changes accordingly so that mechanical work can always match ΔGATP.
Keywords: F1-ATPase, rotary motor, single molecule, torque, ATP synthase
Abstract
F1-ATPase is a motor enzyme in which a central shaft γ subunit rotates 120° per ATP in the cylinder made of α3β3 subunits. During rotation, the chemical energy of ATP hydrolysis (ΔGATP) is converted almost entirely into mechanical work by an elusive mechanism. We measured the force for rotation (torque) under various ΔGATP conditions as a function of rotation angles of the γ subunit with quasi-static, single-molecule manipulation and estimated mechanical work (torque × traveled angle) from the area of the function. The torque functions show three sawtooth-like repeats of a steep jump and linear descent in one catalytic turnover, indicating a simple physical model in which the motor is driven by three springs aligned along a 120° rotation angle. Although the second spring is unaffected by ΔGATP, activation of the first spring (timing of the torque jump) delays at low [ATP] (or high [ADP]) and activation of the third spring delays at high [Pi]. These shifts decrease the size and area of the sawtooth (magnitude of the work). Thus, F1-ATPase responds to the change of ΔGATP by shifting the torque jump timing and uses ΔGATP for the mechanical work with near-perfect efficiency.
The FoF1-ATP synthase (FoF1) is a ubiquitous enzyme located in bacterial plasma membranes, mitochondrial inner membranes, and chloroplast thylakoid membranes. It plays a critical role in energy metabolism by synthesizing ATP from ADP and inorganic phosphate (Pi). This enzyme consists of and is separable into two major portions: membrane-embedded Fo and water-soluble F1. In the simplest version of bacterial FoF1 such as FoF1s from thermophilic Bacillus PS3 and Escherichia coli, subunit compositions of F1 and Fo are, respectively, α3β3γδε and ab2c10. Both portions are rotary motors that share a common rotor shaft γεc10. Downward proton flow through Fo along the gradient of the electrochemical potential of the proton across the membrane drives the rotation of the c10 rotor ring in Fo that drags rotation of the γε rotor shaft of F1 in the surrounding α3β3 cylinder. This rotation causes cyclic conformational changes in each of the three catalytic β subunits that result in ATP synthesis (1–3).
The isolated F1, often called F1-ATPase, catalyzes the ATP hydrolysis reaction that drives the rotation of γε to the direction opposite to that in the ATP synthesis. The minimum subunit composition as an ATPase rotary motor is α3β3γ, and we refer to this complex hereinafter as F1. The γ rotates 120° per net hydrolysis of one ATP. Extensive studies, mainly on F1 from thermophilic Bacillus PS3, have established the nearly complete catalytic scheme of the ATP-driven rotation: Starting from the ATP-waiting state where the orientation angle of the γ is set as 0°, ATP binding to the first β induces the 80°-step rotation of the γ, ADP-release from the second β occurs at some point during this step rotation, and the previously bound ATP in the third β is hydrolyzed at 80°. Then Pi release from either the second or third (not settled) β induces the 40°-step rotation (4–6) to accomplish a single 120° rotation. A recent report indicates that rotation of E. coli F1 is also governed by a scheme similar to that of Bacillus F1 (7).
The torque of this motor has been estimated with various methods (8–13). Among them, an early study that used counter torque reported the torque was ∼50 pN nm/rad (10), indicating that efficiency in chemomechanical energy conversion by F1 from chemical energy of ATP hydrolysis (ΔGATP) to mechanical work of rotation reaches almost 100%. A recent study, also using counter torque, revealed that this remarkable efficiency holds in a broad range of ΔGATP (12). However, the underlying mechanism for this highly efficient energy conversion remains unknown because of an elusive relationship between the catalytic scheme and the energetics. The key question is how the torque varies depending on the γ angle and on ΔGATP. F1 is a “stepping motor” driven by discrete chemical events and one might naturally expect that the torque varies depending on the rotary angle by reflecting the catalytic events in the reaction process. Actually, it has been noticed that the torque is not merely constant during rotation. The torque profile along the γ angle in ATP-driven rotation of E. coli FoF1 showed fluctuation with weak threefold and sixfold symmetries during 360° rotation (10). Also, regular variation of the torque during rotation has been proposed based on the observation that the rotation speed of E. coli F1 is accelerated at three angular regions during 120° rotation (14).
Here we report the torque profiles of Baccilus F1 along the γ angle measured under a quasi-static condition with a conservative force using a single-molecule manipulation system with magnetic tweezers. The obtained torque profiles show a repeat of the steep jump and linear descent approximated by a simple model in which three springs are aligned along a rotary angle of 120°. When ΔGATP changes, the timing of the transition from one spring to the next makes a shift and the area of torque function (mechanical work) changes. The model explains how F1 always achieves near-perfect chemomechanical energy conversion under various ΔGATP conditions.
Results
Torque Measured by Single-Molecule Manipulation.
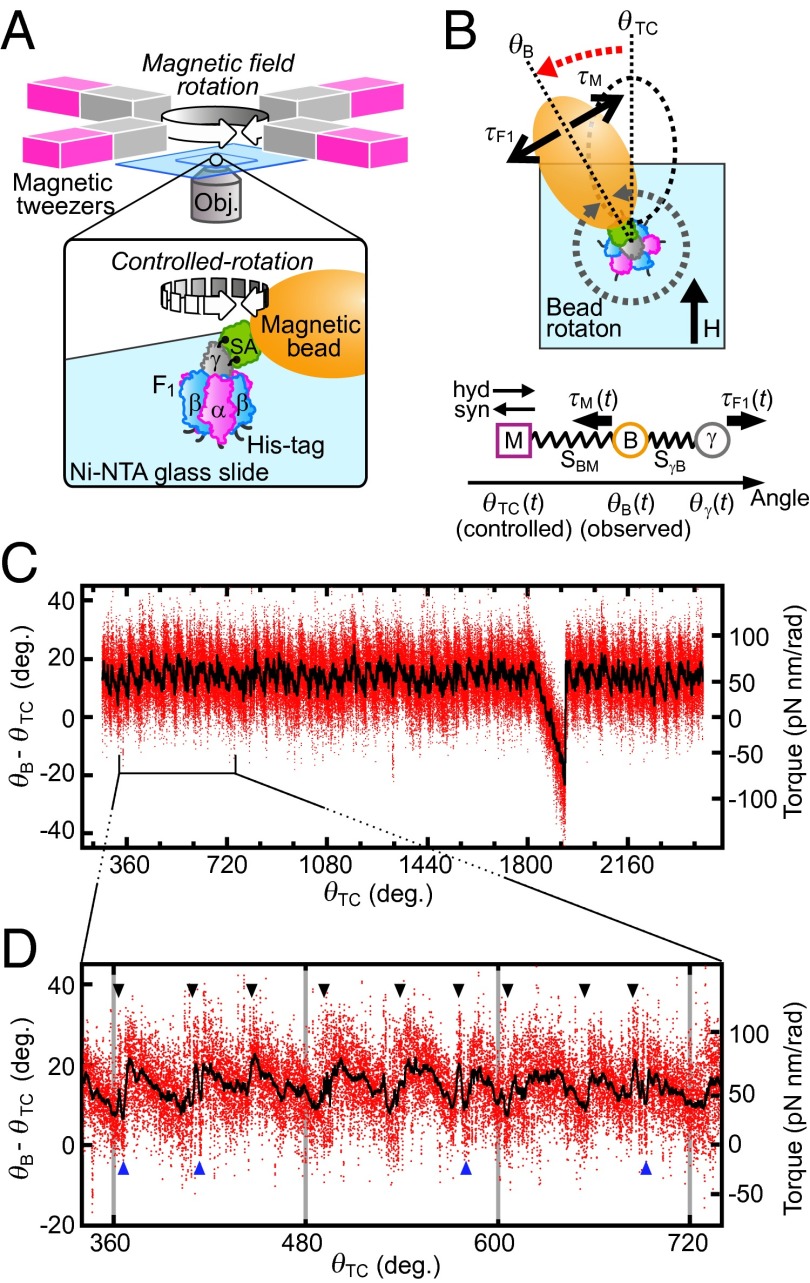
F1 torque was measured using a single-molecule manipulation system composed of magnetic tweezers and magnetic beads (Fig. 1A). Magnetic beads under a certain magnetic field behave similarly to springs in their rotational motion on a plane parallel to the magnetic field. The torque on a magnetic bead generated by a magnetic trap (τM) can be estimated as shown below (15):
| [1] |
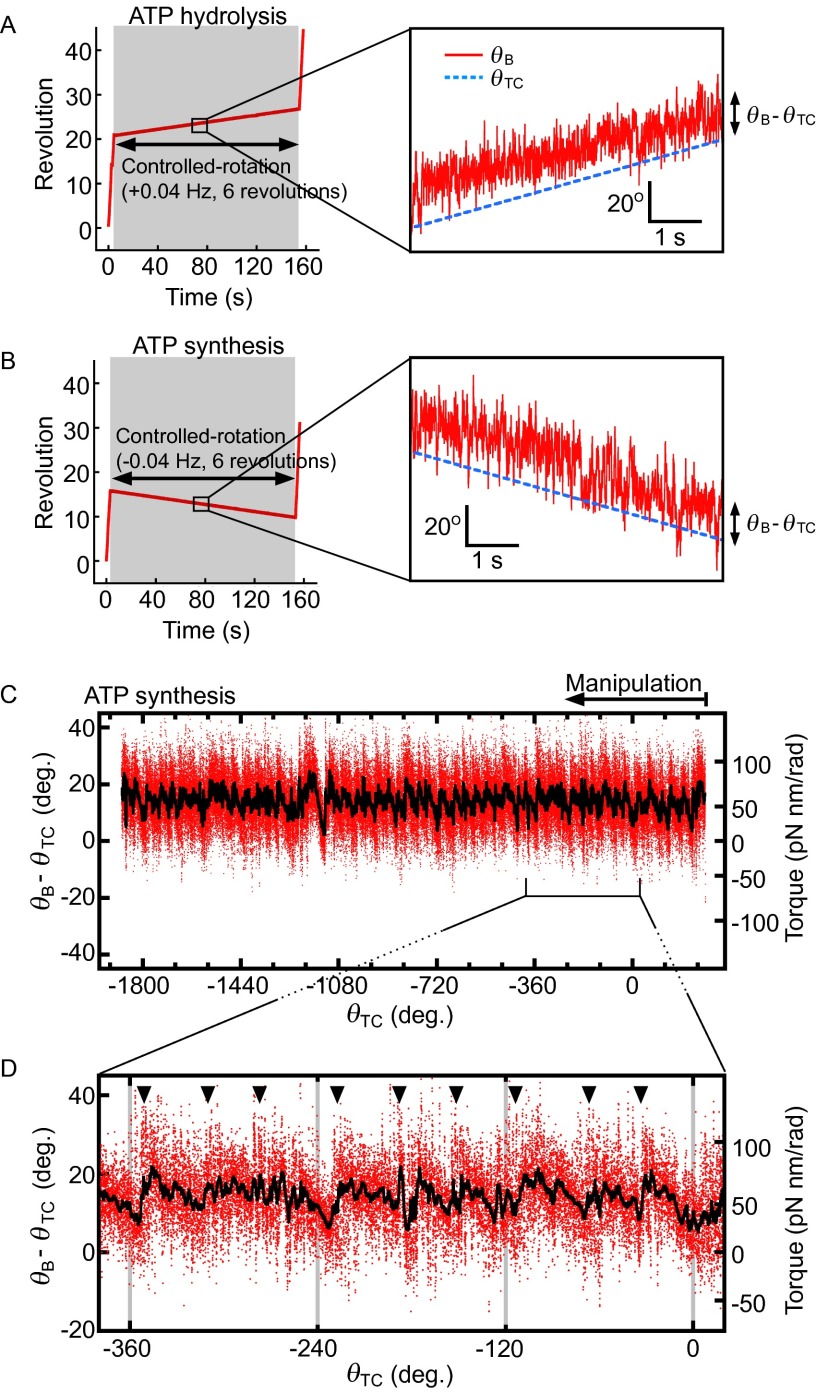
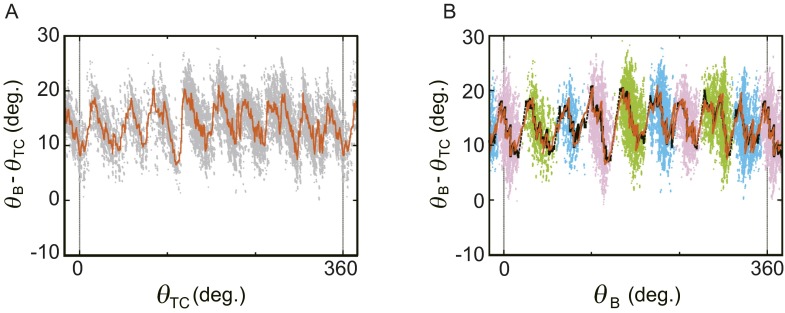
In this equation, θB, θTC, and k, respectively, denote rotation angle of the bead, the trap center angle of the magnetic field, and the trap stiffness (for estimates of θTC and k see Methods). To measure the F1 torque [or (θB − θTC)] at all rotation angles, a magnetic bead attached to F1 was forcibly rotated at 0.04 Hz in ATP hydrolysis (counterclockwise, defined as a positive angle in this paper) or ATP synthesis (clockwise) direction for six revolutions in the presence of various concentrations of ATP, ADP, and Pi with small k (Fig. S1 A and B). The relative angular positions of θTC, θB, and γ during magnetic manipulation are schematically illustrated in Fig. 1B. During the manipulation in the ATP hydrolysis direction, for example, γ rotates ahead of the controlled magnetic trap (θTC). The manipulation was sufficiently slow to be assumed as a quasi-static process. Therefore, as far as one θTC defines one θB, the F1 torque (τF1) is balanced with τM and the magnitudes of the two torques are the same. Fig. 1C presents the observed (θB − θTC) values shown against θTC when F1 was forced to rotate to the ATP hydrolysis direction in 10 μM ATP, 10 μM ADP, and 100 μM Pi. At around 1,800–1,900°, the magnetic bead resisted forced rotation; (θB − θTC) dropped sharply. This occurred because of ADP inhibition, an inhibitory state common to F1s of many species (16–19). As the forced rotation continued further, F1 escaped from the inhibited state by the mechanical reactivation as reported (20). The region of ADP inhibition is omitted from analyses hereafter. Two features in Fig. 1C are noticeable. First, the magnitude of torque calculated from (θB − θTC) is ∼50 pN nm, on average, throughout six revolutions, consistent with the reported F1 torque obtained using a conservative force, the same as in this study (10, 12). Second, torque oscillates three times during 120° rotation and each oscillation seems to be composed of a jump, followed by a gradual descent (Fig. 1D, black arrowheads). Closer examination reveals that just after the jump, torque often dropped sharply down to the level before the jump and it jumped again (Fig. 1D, blue arrowheads). This rapid jump-and-drop behavior suggests that the jump is a transition from one state with a low torque to another state with a high torque, without an intermediate state of significant lifetime, and that these two states are in equilibrium at angles near the transition point. Thus, the F1 motor is activated three times during hydrolysis of one ATP. As expected from a quasi-static manipulation, similar oscillation was observed when F1 was forced to rotate to the ATP synthesis direction (Fig. S1 C and D).
Fig. 1.
Oscillation of F1 torque probed using magnetic tweezers. (A) Experimental design (not to scale). Rotation of magnetic beads attached to F1 is manipulated with magnetic tweezers. (B) (Upper) Angular displacement of trapped beads in the presence of F1 torque. θTC indicates an angular position at which magnetic beads are trapped under a certain magnetic field in the absence of F1 torque (τF1). In the presence of τF1, the bead angle shifts to θB so that τF1 and magnetic torque (τM) are balanced. (Lower) Positional relationship between γ, bead, and magnetic trap center at time t during manipulation. SγB represents external elastic component that cause the shift of θB from θγ (for the definition and estimation see Methods, Torque Profile As a Function of θγ). SBM is the putative spring by magnetic trap. Its magnitude of torque is defined with Eq. 1. (C) Example trace of F1 torque as a function of θTC. Raw data points during controlled rotation (0.04 Hz, ATP hydrolysis direction) are shown in red. Black shows a result of 200-point median filtering. The substrate concentrations are 10 μM (ATP), 10 μM (ADP), and 100 μM (Pi) (condition i in Fig. 2C). (D) Magnified plot. Torque jumps are indicated by arrowheads.
Fig. S1.
Torque measurement. (A and B) Revolution of a bead during torque measurement. In condition i, a controlled rotation (0.04 Hz, six revolutions in ATP hydrolysis in A, or ATP synthesis direction in B) was applied to a free rotating bead (Left, shaded regions). (Right) Magnified traces of bead revolution at the controlled rotation. The blue broken line and the red line are the trap center angle (θTC) and the bead angle (θB), respectively. (C) Angular displacement as a function of θTC from the bead trace in B. Raw data points during controlled rotation (0.04 Hz, ATP synthesis direction) are shown in red, and black indicates a result of 200-point median filtering. The second y axis on right side represents estimated torque, τM = k/2·sin2(θB − θTC). The trap stiffness (k) in this case was 241 pN nm/rad2. (D) Three torque jumps per 120° rotation. Jumps in torque are indicated by arrowheads.
Efficiency of Chemomechanical Energy Conversion.
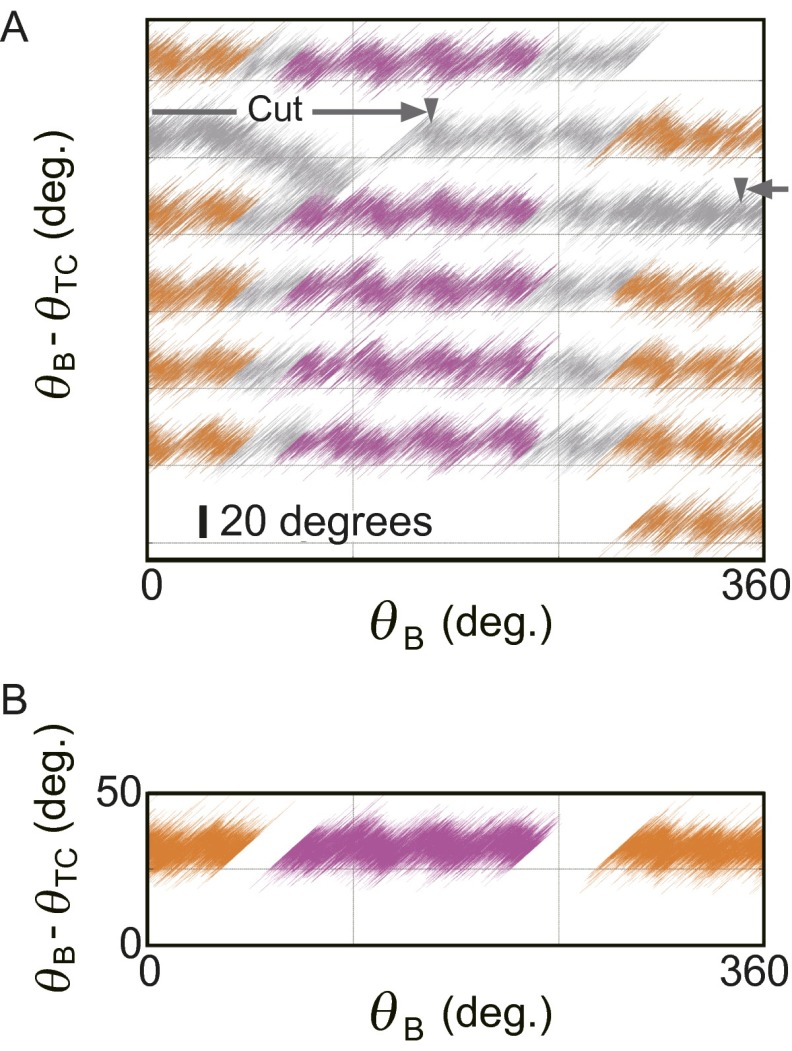
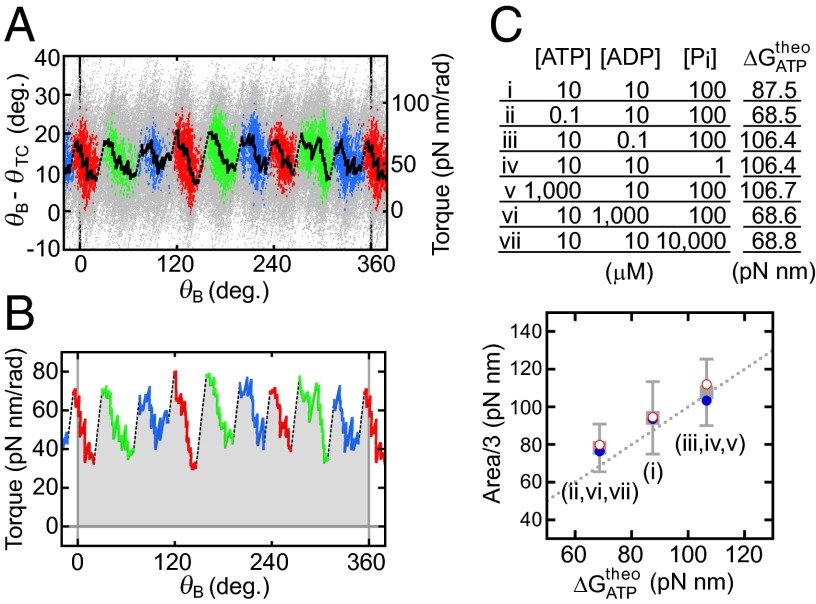
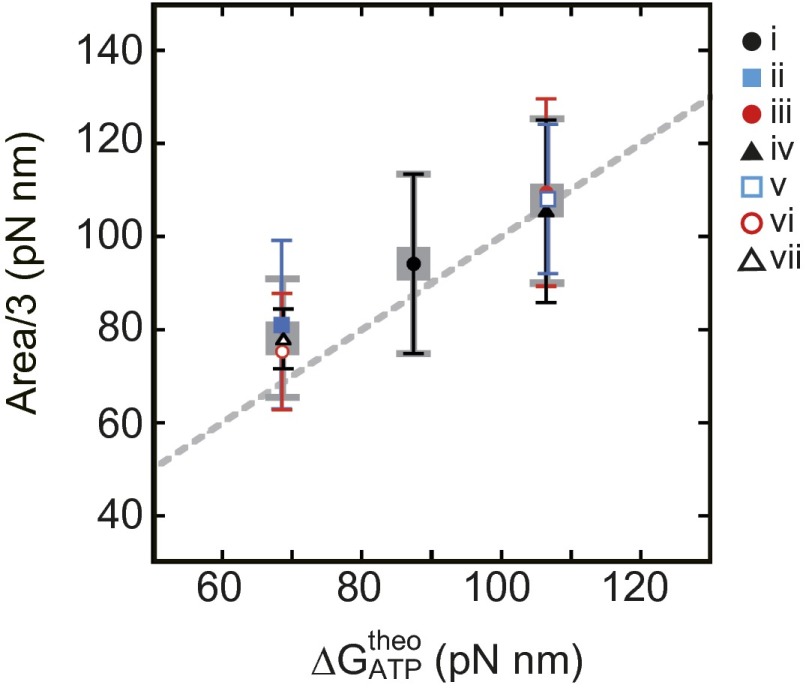
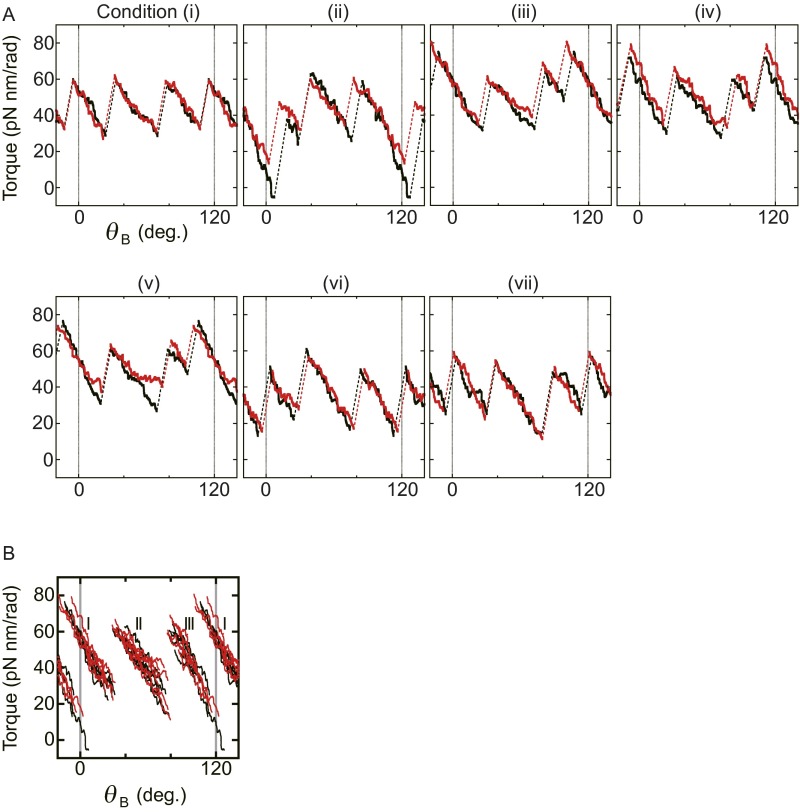
To analyze the jump-and-descent pattern, data were replotted against θB because the torque measured at the angle of θTC represents the torque produced by F1 at the angle of θB. Then, whole torque plots except the region of ADP inhibition were superimposed into a 360° unit and filtered by density of data points (for analysis details, see SI Text and Fig. S2; excluding ADP inhibition, see Fig. S3). Because the timing of jumps statistically fluctuated, simple averaging of superimposed data of the jump areas would produce a torque profile with continuous increase of torque and make the jump ambiguous. Density filtering, on the contrary, differentiates the regions of clusters of data points, where the torque changed gradually (Fig. 2A, colored regions), and the regions of relatively scarce data points between clusters, where the torque changed steeply. Each cluster was running-averaged (Fig. 2A, bold black lines) and the adjacent average lines were connected at the angular position where the point density of the preceding cluster became equal to that of the next cluster (Fig. 2A, broken black lines). The shape of the connecting line was not obtained from experiments and we simply assumed a straight line. The resultant sawtooth-like torque profile well reproduces the regular jump-and-descent pattern of the torque (Fig. S4). The mechanical work (torque × traveled angle) is defined by the area of the torque-angle plot and the area from 0° to 360° (shaded area) in Fig. 2B represents the mechanical work done by F1 against the magnetic trap during 360° revolution. We measured torque profiles under seven conditions (denoted as i to vii hereafter), in which concentrations of ATP, ADP, and Pi differed 100 times (Fig. 2C, Upper), and estimated the amounts of mechanical work of F1 during 360° revolution. One-third of the estimated work, which corresponds to the work during hydrolysis of a single ATP molecule, is shown against the calculated free energy change accompanied with hydrolysis of a single ATP molecule (21) (ΔGATP). Results show that ii, vi, and vii gave almost equal work, as expected from their same magnitude of ΔGATP; such was also the case for iii, iv, and v (Fig. S5). The average work for ii, vi, and vii and that for iii, iv, and v, as well as the work for i, is close to the values of ΔGATP under the corresponding substrate concentrations (Fig. 2C, Lower). The works during ATP synthesis were also estimated from the forced rotation of the same F1 molecules to the ATP synthesis direction. As seen, in the same substrate concentrations, the work during ATP synthesis was very similar to the work during ATP hydrolysis. These results are expected from the quasi-static manipulation during rotations, either to the ATP hydrolysis or to the synthesis direction, and confirm the high efficiency close to 100% in chemomechanical energy conversion by F1 not only for ATP hydrolysis but also for ATP synthesis in a broad range of ΔGATP. This result also implies that the ATP synthesis reaction is coupled tightly to the mechanical rotation forced by magnetic tweezers at low speed, which is consistent with previously reported results (22).
Fig. S2.
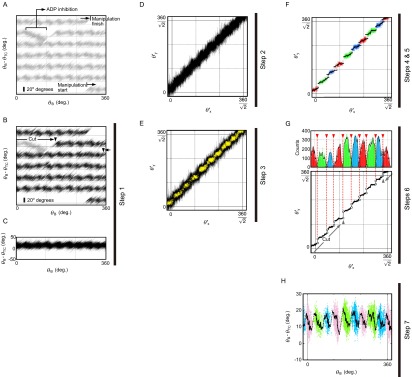
Extraction of average lines of torque. (A) An example trace of angular displacement. Raw data of angular displacement of a bead for six rotations is shown. During the controlled rotation, F1 lapsed into ADP inhibition. (B) Exclusion of the ADP-inhibited region. The ADP-inhibited region of the plot is removed and the black region is used for the following analysis. (C) Accumulation of angular displacement data. Angular displacement data that do not contain the ADP-inhibited region are accumulated into the 360° unit. (D) Forty-five-degree rotation of the angular displacement data. The angular displacement (θB − θTC) data shown in C are rotated 45° about the origin: After this operation, thermal fluctuation or angular jump of the bead occurs along the y axis. (E) Extracting high-density points. For each data point in D, the number of other neighboring data points located within 0.5° of the point was calculated, and if this number exceeded a certain threshold number, the point was selected as high-density point and shown in yellow. In this case, the threshold number is 17. (F) Clustering and averaging. Extracted points in E are classified into three states based on their positions (red, green, and blue points). Each state is running-averaged (black lines). (G) Determination of transition points. (Upper) The histograms of the number of points along θx′ of each cluster. Bin size is 1°. Black lines represent the smooth fits (KaleidaGraph; Synergy Software). We assume that state transitions occur along θy′ at the intersection θx′ of the adjacent smoothed curves of each cluster (red arrowheads and broken lines). (Lower) Averaged lines (black lines) of each cluster that are cut at the transition points (open circles). The excluded part due to ADP inhibition in B is shown by two gray arrowheads. (H) Rotation (−45°) of the averaged lines. The averaged lines obtained as in G are rotated −45° about the origin to regenerate the trace of (θB − θTC) against θB:
Fig. S3.
Reestimation of transition points potentially affected by removal of ADP inhibition parts. (A) Selection of the regions for retreat. Edges of the removed region in Fig. S2A are indicated by gray arrowheads. Orange and magenta regions are used for reestimation of average lines and transition points. (B) Accumulation of the selected regions.
Fig. 2.
Three states of F1 and the efficiency of chemomechanical energy conversion. (A) Clustering into three states. Raw data points of angular deviation during six revolutions are superimposed using a 360° unit (gray points). Data points are selected by their density with a threshold value and are clustered into states of three kinds, for a total of nine states (red, green, and blue clusters; SI Text). Bold black lines show running averages of respective clusters. (B) Torque profile and mechanical work. The lines in A are reported in torque versus θB. Shaded areas give mechanical work done by F1. (C) Efficiency of chemomechanical energy conversion. (Upper) A list of substrate conditions and calculated free energy change of ATP hydrolysis (ΔGATP) (21). (Lower) Comparison of observed mechanical works per 120° rotation obtained from B with ΔGATP (gray squares). Error bars represent SDs. Average mechanical work in ATP hydrolysis and ATP synthesis are shown respectively in blue filled circles and red open circles. The dotted line represents 100% chemomechanical energy conversion.
Fig. S4.
Comparison with median-filtered line. (A) Median-filter line of density-extracted points. Density-extracted points (gray points) are median-filtered with 200 points (orange line) in the plot (θB − θTC) against θTC. (B) Comparison of averaged lines and median-filtered line. Black lines indicate the average lines obtained as in Fig. S2H. The median line obtained in A is superimposed on the average lines.
Fig. S5.
Areas for all conditions (i–vii). One-third of the mechanical work at all seven substrate conditions was plotted against each . i, solid black circle; ii, solid blue square; iii, solid red circle; iv, solid black triangle; v, open blue square; vi, open red circle; vii, open black triangle. Error bars indicate SDs.
Torque Profiles in Different ΔGATP Conditions.
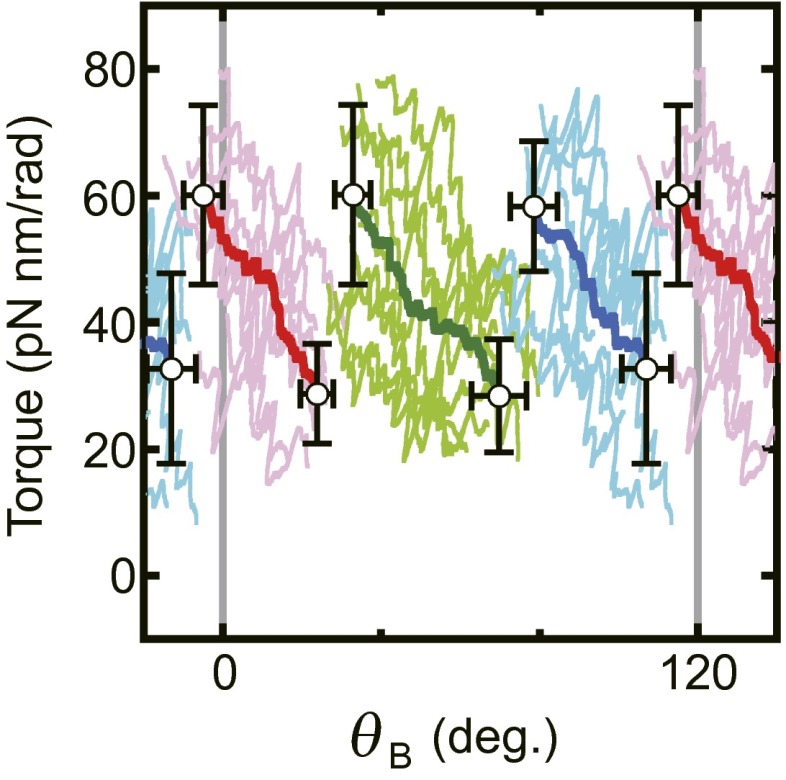
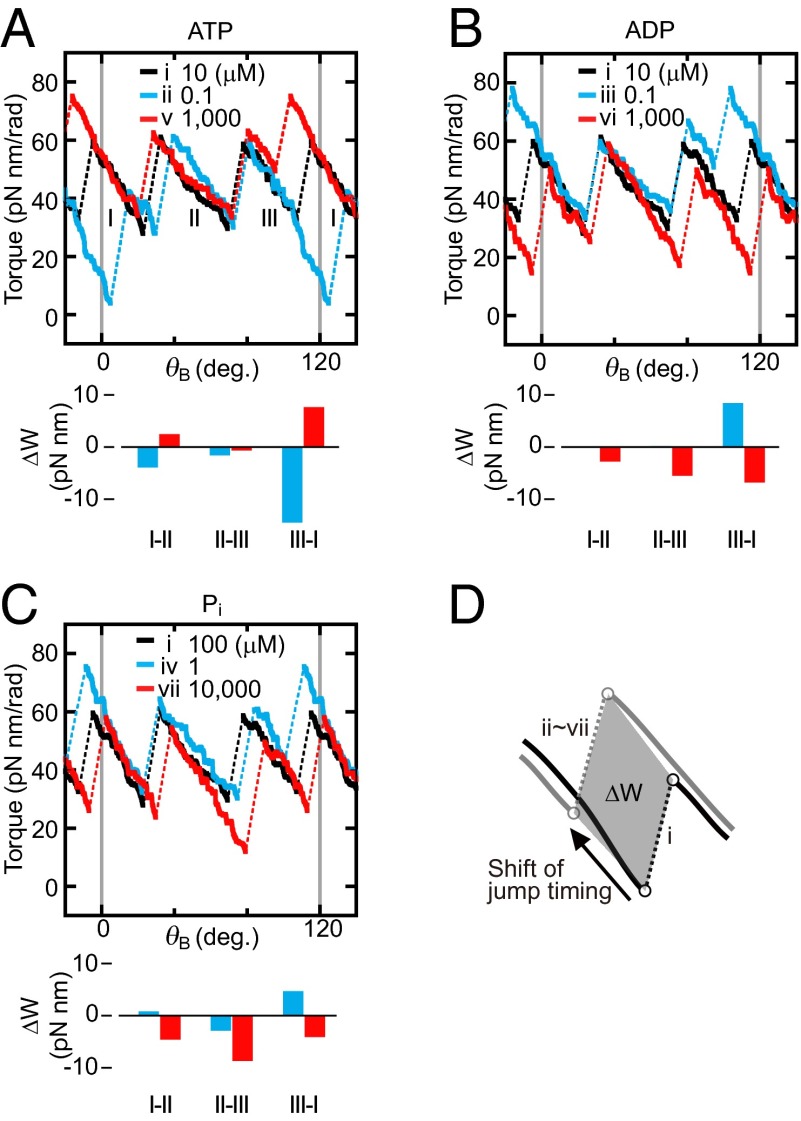
To understand how F1 achieves near-perfect chemomechanical energy conversion under various ΔGATP conditions, the torque profiles in conditions ii–vii were compared with the profile in condition i. All torque profiles of rotation to the ATP hydrolysis direction in condition i (and ii–vii) obtained from three independent experiments using different F1 molecules were sectioned into 120° rotation, superimposed, and averaged to obtain the most probable profiles of the torque (Fig. S6, for detailed procedures see SI Text, Torque Profiles of Each Condition). Fig. 3 A–C show responses of the torque profiles to 100-fold or 1/100-fold increase/decrease of [ATP], [ADP], or [Pi] from condition i. We note that each torque profile shown here is an average of both profiles of ATP hydrolysis and ATP synthesis reactions, because these two profiles of both reactions are almost identical in each condition (Fig. S7A). Fig. 3 A–C directly capture the mechanism whereby this motor adapts its work according to an environmental change of ΔGATP. First, the location and slope of the descending portions after the transitions in torque profiles were changed little or not changed at all. Indeed, when the torque profiles of all 14 conditions (7 substrate conditions × 2 directions of reaction) are superimposed, the descending portions overlap well and make three bundles of lines irrespective of direction of rotation and transition timings (Fig. S7B). Thus, properties of each of the three states, depicted as I, II and III, are unaffected by ΔGATP. Second, timings of transitions shift when ΔGATP changed. When [ATP] was changed, only the transition III–I among three transitions made a significant shift to early (100-fold ATP) or late (1/100-fold ATP) timing (Fig. 3A). This shift causes the change of the mechanical work (ΔW) defined by the change of the area as illustrated (Fig. 3D). Even though resolution of the measurements limits the fine quantitative analysis, the ΔW produced by the timing shift of transition III–I can explain most (∼75%, 1/100-fold ATP) or a significant part (∼40%, 100-fold ATP) of the changed amount of ΔGATP (ΔΔGATP = ∼±19 pN nm). Also, when [ADP] was changed (Fig. 3B), the transition III–I occurred early (1/100-fold ADP) or late (100-fold ADP), although a small timing shift was also observed in the transition II–III. The ΔW at transition III–I is ∼45% (1/100-fold ADP) or 35% (100-fold ADP) of the ΔΔGATP. In the case of Pi (Fig. 3C), a 100-fold increase in [Pi] results in the delay of transition II–III that accompanies ΔW corresponding to ∼45% of ΔΔGATP. No major shift was observed when [Pi] was diluted to 1/100-fold, probably because the concentration of Pi (1 μM) in this experiment was too low for quantitative analysis, that is, two to three orders lower than the Michaelis–Menten constant of Pi (0.55 mM) (23), and other anion could compete for the same site with Pi. Contrary to other transitions, the transition timings between state I and state II are affected only slightly by the concentration changes of the substrates. It has been shown that the angular position of ATP binding, ADP release, and Pi release are around 0°, 0° (or somewhere between 0° and 80°), and 80°, respectively (4, 6, 24). Taking into account this rotation scheme, it seems that the transition between state III and state I is caused by binding/release of ATP/ADP and the transition between state II to state III is governed by Pi release/binding.
Fig. S6.
Torque profile under condition i in the ATP hydrolysis direction. Average lines of three F1 molecules under condition i in the ATP hydrolysis direction were superimposed (magenta, light green, and cyan). Open circles represent centroids of edges of average lines of each state. Error bars are SDs. Bold lines (red, green, and blue) are the torque profile obtained as centroid of average lines of respective states (SI Text).
Fig. 3.
Torque profiles in the presence of different concentrations of (A) ATP, (B) ADP, and (C) Pi. Black lines are the torque profile of condition i (ATP = 10 μM, ADP = 10 μM, and Pi = 100 μM). Blue and red lines represent the torque profiles in 100-fold and 1/100-fold concentration of the indicated substrate, respectively. The areas sandwiched between torque profile of condition i and those of conditions ii–vii during the transition are obtained as illustrated in D. The areas are converted to the variations of the mechanical work (ΔW) generated from the shift of the transition timing and shown below each panel.
Fig. S7.
Centroid lines in ATP hydrolysis and ATP synthesis reactions. (A) Centroid lines of torque in ATP hydrolysis (black lines) and ATP synthesis (red lines) reaction in each substrate condition are compared. (B) Superimposed centroid lines of all seven conditions (ATP hydrolysis, black; ATP synthesis, red). I, II, and III indicate three states of F1.
Torque Profile of F1 Without ATP Hydrolysis.
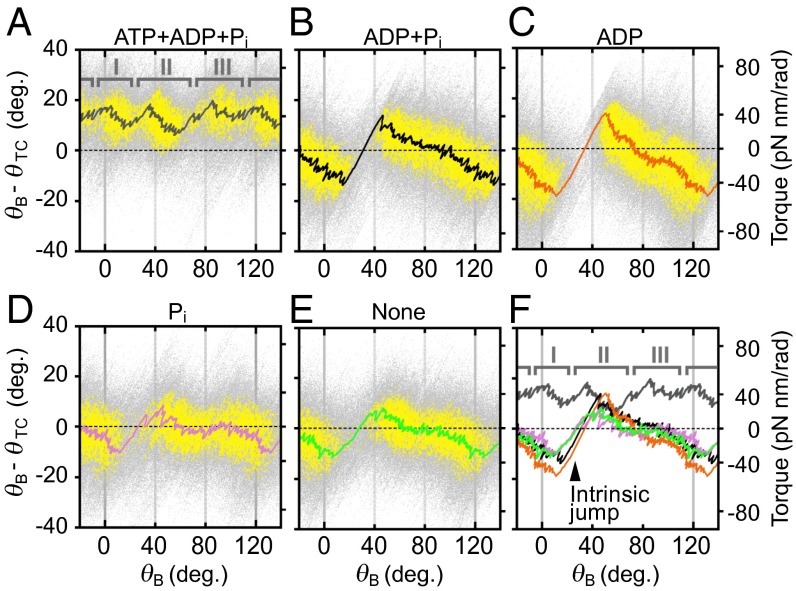
To understand the torque profile of F1 without ATP hydrolysis, the buffer in the observation chamber containing ATP, ADP, and Pi in which F1 showed a typical jump-and-descent pattern (Fig. 4A) was exchanged to the buffers lacking ATP, and the torque profile was obtained for the same F1 molecule from the forced rotation of the bead to the ATP hydrolysis direction (Fig. 4B). In ADP and Pi, the torque is negative at the γ angle 0°, but it jumps to ∼30 pN nm at about 40°, which is followed by a gradual decrease to ∼−40 pN nm in a 120° rotation. It is noteworthy that the jump occurs at the same position (about 40°) as the transition jumps from state I to state II in the presence of ATP. Without ATP hydrolysis, the net amount of the work done by F1 during 120° rotation is expected to be zero; indeed, the work calculated from the torque profiles is −2.7 pN nm, which is virtually zero. The energy supplied from the magnetic trap in the negative torque region is stored as the energy of elastic strain in the protein conformation and it is released during positive torque regions. A similar torque profile was observed in the buffer containing ADP (Fig. 4C). In the buffer containing only Pi and in the buffer containing no ATP, ADP, and Pi, a jump at about 40° was also observed, although its magnitude was small (Fig. 4 D and E). Consequently, without net catalysis, F1 has an intrinsic rotary potential such that it exerts a torque jump at around 40°. It is tempting to infer that the transition from state I to state II observed in the presence of ATP is attributable to this intrinsic property of F1 (Fig. 4F), although a possibility remains that this property changes during catalysis.
Fig. 4.
Intrinsic torque jump of F1. Data points of angular displacement (θB − θTC) obtained from controlled rotation to the ATP hydrolysis direction (0.04 Hz, six revolutions) are shown in 120° unit (gray points), and filtered by its density (yellow points) these are almost same procedures as steps 1–3 in Fig. S2. The extracted dense points are median-filtered with 500 points without clustering process (black line): (A) ATP, ADP, and Pi = 10, 10, and 100 μM (condition i); (B) 0, 10, and 100 μM; (C) 0, 10, and 0 μM; (D) 0, 0, and 100 μM; and (E) no substrate. The change of substrate was achieved by exchange of the solution in the observation chamber. These data were obtained from one of three F1 molecules used in the torque quantification of this research. (F) Intrinsic torque jump and transition between states I and II. Torque traces in A–E were overlaid.
Discussion
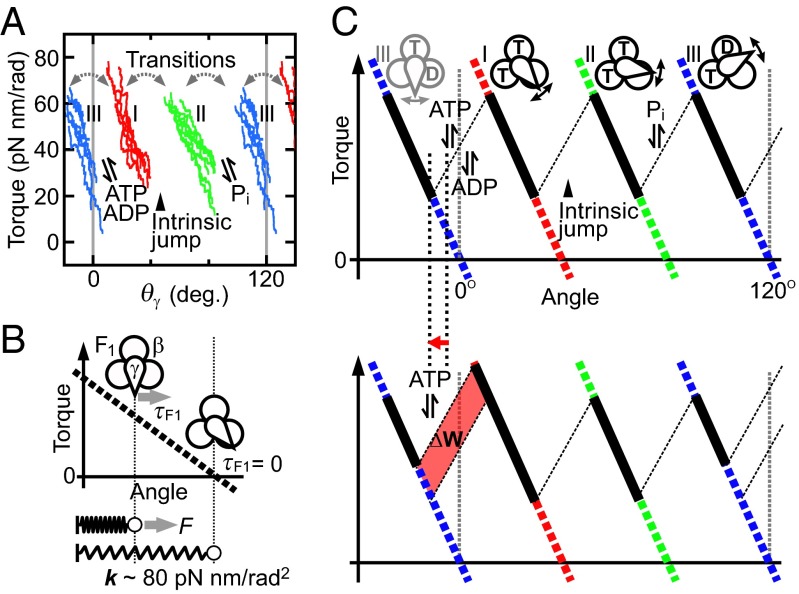
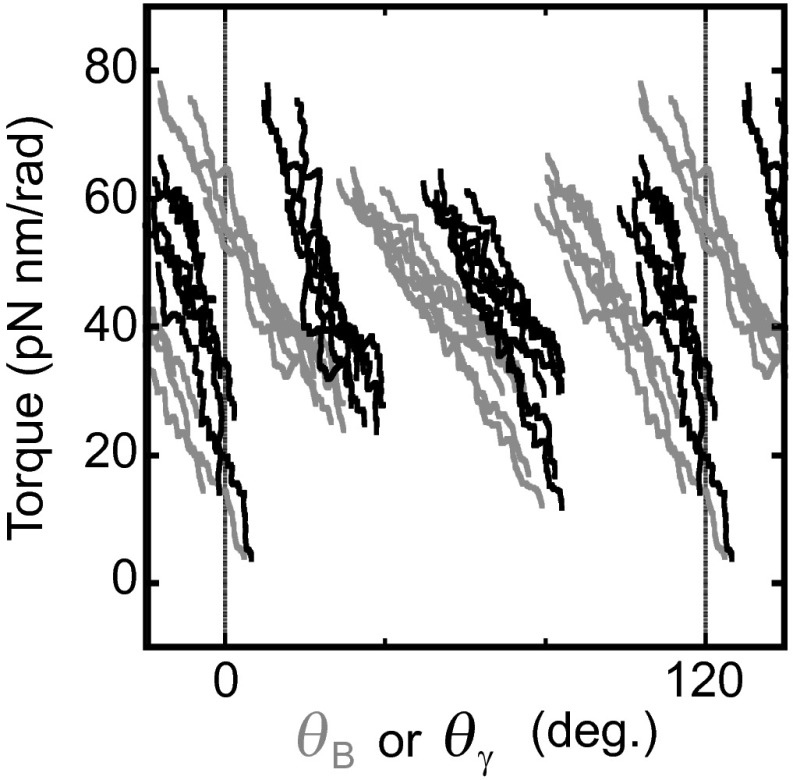
This study yielded torque profiles of F1 during rotation from displacement angles of the attached magnetic bead from the angles of external magnetic field. The observed bead angle might deviate from the true angle of the γ subunit because of external elastic components such as histidine tags, linkers between γ and streptavidin, and so on (Fig. 1B). We estimated the stiffness of external elastic components in each F1 molecule (see Methods, Torque Profile As a Function of θγ) and deduced the torque profile as a function of the γ angle (Fig. 5A and Fig. S8). However, the correction did not alter three jump-and-descent features of the profiles. Interestingly, in the corrected plot, there is no overlap along θγ between three states. This means that the γ angle is the only determinant of the states, at least under the conditions we tested in this study. This would be advantageous for avoiding uncoupled rotation because the γ angle corresponds one-to-one with the F1 state.
Fig. 5.
Tandem spring model of F1 rotation. (A) Rotation with three state transitions. Torque traces as a function of angular position of γ subunit (θγ) obtained from all conditions tested in this study are superimposed (SI Text). (B) Approximation of a certain state of F1 as a spring. (C) Tandem spring model of F1 rotation. States I, II, and III are approximated as springs. F1 generates torque continuously by the transitions of these three springs. Transition between states I and II is triggered by intrinsic property of F1. When [ATP] increases, the transition position from state III to I shifts to the left, which results in the increase of mechanical work of F1 (red area). T and D represent ATP and ADP, respectively.
Fig. S8.
Comparison of torque profiles along θγ and along θB. All torque profiles from conditions i to vii are superimposed. Torque profiles along θγ and θB are depicted with black and gray lines, respectively.
The presence of three jump-and-descent patterns of torque in a 120° rotation indicates that the F1 motor is activated three times by a net hydrolysis of one ATP. In other words, F1 undergoes transitions between three different states during catalysis. Setting the γ angular position where F1 binds ATP as 0°, the transitions occur at around 0°, 40°, and 80°. According to the established catalytic scheme of bacterial F1, binding of ATP to F1 induces the stepping rotation of the γ from 0° to 80° and release of Pi from F1 does so from 80° to 120° (4–6). Similar stepwise rotation of the γ subunit was simulated for bovine F1 (25, 26). Therefore, state III defined in this study corresponds to F1 in the state waiting for ATP binding (pre-ATP-binding state) and state II corresponds to F1 in the state waiting for Pi release (pre-Pi-release state). ATP binding to the former and Pi release from the latter induce the transition III–I and the transition II–III, respectively.
The transition between state I and state II at around 40° is affected little by concentrations of substrates and therefore does not accompany binding/release of substrates. Because a similar transition was observed even in the absence of all substrates, the transition I–II can be some conformational rearrangement induced automatically at around 40°. Then, it seems that, when the γ in F1 in state I reaches the point beyond 40° during a step rotation from 0° to 80°, a conformational rearrangement takes place in F1 generating state II that is capable of exerting a high torque. Energetically, a fraction of energy gained by ATP binding at 0° is stored in F1 as conformational strain and is used for driving a conformational rearrangement at 40°. Interestingly, molecular dynamics simulation of F1 predicts that a 80°-step rotation after ATP binding is driven by a relaying pattern of torques, that is, the torque generated primarily on the N-terminal helix region of the γ is reduced as the γ rotates and is taken over at around 40° by the torque generated primarily on C-terminal helix region of the γ (27). We have observed pauses of rotation at 0° at low [ATP] and at 80° at high [Pi] but not at 40° under any conditions tested. The 40° pause would become apparent when the transition I–II is delayed. However, the transition I–II takes place automatically when the γ reaches 40° and there is no means, so far, to make the transition slow. Recently, it was found that human F1 makes three pauses in a 120° rotation (28). However, a start of step rotation from each pause is induced by a distinct chemical event in catalysis and may not directly correspond to the transition I–II that is intrinsic.
In each of the three states, torque decreases almost linearly with the angle (Fig. 5A), enabling approximation of each state as a simple spring (Fig. 5B), even though many interactions of γ with the α3β3 cylinder might be involved in torque generation. In Fig. 5C we present a simple model of F1 rotation by treating these springs as the minimum constituents for torque generation. In this model, F1 generates torque continuously by transitions between these three springs with similar spring constants (∼80 pN nm/rad2). This value is far from the center value but within a possible range of the previously reported value (223 ± 141 pN nm/rad2) (29). The first spring (transition III–I) is energized by ATP binding, the second (transition I–II) by the intrinsic rotary property of F1, and the third (transition II–III) by Pi release. This model provides a simple physical view of how the chemical cycle is coupled with torque generation.
The chemomechanical energy conversion efficiency of F1 is close to 100% under various ΔGATP conditions (12). The torque profile found here explains how F1 achieves this remarkable task. Fig. 5C illustrates how F1 responds to the increase of [ATP] and adjusts its mechanical work accordingly. The equilibrium constants for nucleotide bindings/dissociations are functions of the γ angle (30–33). Therefore, as [ATP] is increased, the angular position of binding/dissociation of ATP shifts to the left (Fig. 5C, red arrow) at the point where the spring is shorter. The shorter the spring becomes, the greater the force to extend becomes because of the nature of a spring (Fig. 5B). This shift invariably increases the area of the sawtooth, that is, the mechanical work. This study shows that the following two properties of the torque profile of the F1 motor ensure ∼100% energy conversion under various ΔGATP conditions: (i) shift of the angular positions of binding/dissociation of substrates according to their concentrations and (ii) changing its force (torque) according to the angular position of substrate binding/dissociation, which is readily accomplished by a simple spring.
Besides the main conclusion described above, this study gives implications for two issues. This study unveils the torque function of F1 in the absence of ATP for the first time, to our knowledge (Fig. 4 B–E). Without ATP, regardless of the presence or absence of ADP and Pi, the torque is zero at γ angles of around 30° and around 80°. However, the γ cannot stay at 30° because it moves away in either direction when the torque fluctuates thermally. In contrast, the γ can stay at 80° because the fluctuating γ is always pulled back to the 80° position. Then, note that 80° is the only stable position in 120° for the γ to stay in the resting F1 molecule that is not carrying out catalysis. This explains why the majority of crystal structures reflect a state of the enzyme with the angular position of the γ ∼80°, which is around the position where hydrolysis of ATP occurs in one of the catalytic sites (34–36). This study also reveals that torque of F1 jumps at every ∼40°, but not at 80°–40° intervals as thought previously. It is supposed that when FoF1 rotates by proton flow through the c10 rotor ring in Fo, torque should be produced 10 times in one revolution, that is, at every 36°. Then, the elastic components in the rotor shaft and peripheral stalk could buffer this small angle difference more easily than thought before, and ensure smooth, tight coupling between F1 and Fo (10, 37–39). Comparable stiffness of the rotation-driving springs of F1 (∼80 pN nm/rad2) to the reported stiffness of the rotor shaft (∼68 pN nm/rad2) (38) might further contribute to the smooth, tight coupling.
Methods
Microscopy.
Rotation of magnetic beads was imaged on an inverted microscope (IX70; Olympus Corp.) with a stable mechanical stage. The bright-field image of magnetic beads, illuminated by a mercury lamp (HBO 103W/2; Osram GmbH), was captured alternately with two CCD cameras. First, for the selection of molecules to be observed, stepping rotation of F1 at 100 nM ATP was captured with a CCD camera (CCD-300-RC; Dage-MTI) at the video rate of 30 frames per second. The centroid motion of beads was analyzed using software (Celery; library) on a computer in real time, enabling us to check the degree of centrosymmetry, stability of the orbit, and the three ATP waiting positions of beads before, during, and after the several forcible rotations applied by magnetic tweezers. Next, for torque measurements, the bead image was captured with another CCD camera (ICL-B0620M-KC; Imperx) at the video rate of 1,000 frames per second and recorded on another computer using acquisition software (XCAP; Epix).
Magnetic tweezers consisted of two opposing pairs of electromagnets. They were positioned ∼10 mm above the microscope stage (15) (Fig. 1A). The magnetic field direction and strength were controlled by changing the electric voltage applied to the pairs of electromagnets, which was done with software (Celery; library). Magnetic beads were rotated in both directions at 0.04 Hz with the 45–57 Gauss magnetic field at the sample position.
To ascertain the moment of the start and the finish of the magnetic manipulations, a shutter (Uniblitz VS14; Vincent Associates) was placed between the mercury lamp and condenser lens, which closed only at the moment of the start and the finish of each magnetic manipulation. The shutter operations were confirmed by the intensity changes of the bright-field image. The typical duration of the closed state of each shutter operation was ∼10 ms.
Estimation of Trap Stiffness and the Trap Center Angle.
Thermal fluctuation of beads in the absence of magnetic field was recorded for ∼30 s (∼30,000 frames) for the F1 molecule in an MgADP inhibited state (Fig. S9A, black). Next, we applied a magnetic field with the same magnitude for the torque measurement experiments at a certain angle at which the bead angle did not make a shift from the inhibited position, and fluctuation of the beads was recorded again for ∼30 s (Fig. S9A, red). The histogram of the angular distribution of beads in the presence of the magnetic trap was divided by that in the absence of the magnetic trap for each bin (Fig. S9B). Average square roots of variances of the distributions are 12.0° (in the absence of magnetic field) and 6.6° (in the presence of magnetic field). The obtained histogram was normalized by area. The resultant histogram was assumed to reflect only the potential formed by the magnetic trap. It was fitted with a Gaussian probability density function based on the linear approximation of magnetic torque (Eq. 1), τM ∼k(θ − θTC), which holds at small (θ − θTC):
| [2] |
Fig. S9.
Estimation of the magnetic trap stiffness. (A) Angular distribution of a bead of inhibited state of F1 in the absence (black line) and presence (red line) of the magnetic trap. (B) Distribution difference between the black line and red line in A. This distribution was used to estimate the trap stiffness (Methods, Estimation of Trap Stiffness and the Trap Center Angle).
Here, θ stands for the bead angle in radians, θTC denotes the trap center angle, and σ2 represents the variance. The trap stiffness (k) is given as k = kBTσ-2 ∼4.1σ−2 (pN nm/rad2), where kB is Boltzmann’s constant and T is the absolute temperature. These measurements were performed in 0.1 μM ATP + 10 μM ADP + 100 μM Pi (condition ii) or in 10 μM ATP + 1,000 μM ADP + 10 μM Pi (condition vi) to allow F1 to lapse easily into MgADP inhibition, which can occur at three angular positions in 360°. The same measurement was performed at all three positions for each molecule. Values of the trap stiffness of three F1 molecules used for experiments were 175.6 ± 9.3 pN nm/rad2, 241.0 ± 13.9 pN nm/rad2, and 245.6 ± 24.5 pN nm/rad2 (mean ± SD).
The external magnetic field was rotated at 0.04 Hz to the direction of either ATP hydrolysis or ATP synthesis and θTC at time t was given as θTC(t) = θTC(0) + 2π·0.04·t (ATP hydrolysis direction) or as θTC(t) = θTC(0) − 2π·0.04·t (ATP synthesis direction).
Torque Profile As a Function of θγ.
Bead angle is the only observable object in this system. However, the bead angle deviated from the actual angle of γ relative to α3β3 at the stator orifice owing to the external elastic components such as histidine tags, α3β3 ring, globular portion of γ, linkers between γ and streptavidin, and streptavidin itself (Fig. 1B). External stiffness (kex) defined by these components, that is, spring constant of SγB, was assumed as below for each molecule. Okuno et al. (29) have reported that the spring constant of γ motion at the stator orifice in the ATP waiting state (internal stiffness, kin) was 223 pN nm/rad2. Observable angular fluctuation of bead in ATP waiting state is determined by total stiffness composed of internal and external stiffness. To determine ktotal, we observed bead motion in the ATP waiting state under 100 nM ATP for each molecule. According to the variance (σ2) of Gaussian probability density functions (Eq. 2) fitted to the obtained angular distributions of bead, we determined ktotal for each molecule as 56.4, 111.8, and 165.2 pN nm/rad2 (ktotal = kBTσ-2 ∼4.1σ−2). Finally, based on these values, we could assume for each molecule as 75.4, 224.0, and 637.8 pN nm/rad2. Then, we estimate average lines of torque as a function of θγ from that of θB by a correction equation for each molecules: θγ = θB + τ(θB)/kex. The torque profiles as the function of θγ were derived from the obtained average lines as a function of θγ with same procedures described in SI Text, Torque Profiles of Each Condition. In Fig. S8 we overlay the corrected torque profiles of all seven conditions (black lines).
SI Text
Protein.
The α3β3γ complex of thermophilic Bacillus PS3 was expressed in Escherichia coli and purified. The complex included mutations as α(His6 at N terminus/C193S), β(His10 at N terminus), and γ(S107C/I210C). After biotinylation of two cysteine residues on the γ subunit (15), the complex was flash-frozen in liquid nitrogen and stored at −80 °C until use.
Flow Chamber.
Coverslips (32 × 24 mm, thickness 1; Matsunami) were functionalized with Ni-NTA, as described previously (30). The flow chamber was constructed from a Ni-NTA modified coverslip and an unmodified one (18 × 18 mm), separated by two greased spacers (Parafilm cover sheet) of ∼100-μm thickness. We infused one chamber volume (∼5 μL) of carboxylate beads (Polybead carboxylate microspheres, diameter 0.2 μm; Polyscience) in buffer A (50 mM Tris⋅Cl and 50 mM KCl, pH 7.5). After 5 min, the flow chamber was washed with 30 μL of buffer A. The beads bound nonspecifically to the glass surface. The x–y movement of these beads in the observation field facilitated our correction of the drift of the sample slide that occurred during observations. Next, we infused 500 pM biotinylated F1 in buffer A and waited for 30 s, then we infused 30 μL of buffer A and 15 μL of 20 mg⋅mL−1 BSA in buffer A. After 1 h, we infused 10 μL of streptavidin-conjugated magnetic beads (Sera-Mag Magnetic Streptavidin; Seradyn). To remove magnetic beads larger than 0.5 μm, the magnetic beads were pretreated with centrifugation at 800 × g for 2 min in buffer A and at 2,000 × g for 20 s in buffer A containing 20 mg⋅mL−1 BSA. After 30 min of incubation with magnetic beads, the flow chamber was used for torque measurements.
Determination and Correction of the Rotation Phase for All Conditions.
During torque measurement, the F1-bead system was exposed to the repeated external perturbation by magnetic manipulations and solution exchanges inside of the chamber. These procedures possibly impose impacts on the fixation between the glass slide and F1 and between F1 and the magnetic bead, which may cause apparent angular drift of the bead. For each single F1 molecule, it took ∼6 h to test all conditions [conditions i to vii and others, e.g., in the absence of ATP (Fig. 4 B–E)]. To check and correct the angular drift, we observed the stepping rotation under 100 nM ATP before, during, and after the torque measurement (three or four times in total) for each molecule. The maximum values of angular drift for the three molecules used in this study were ∼20°, ∼12°, and ∼4°. The angular drift of the observed three or four ATP-waiting positions were fitted with a second- or third-order polynomial curve for each molecule. ATP-waiting positions for each condition were obtained and set to 0° on the assumption that the waiting position shifted following the polynomial curve during torque measurement.
Clustering and Average Line.
The following data processes were based on and started from the data of (θB – θTC) against θB, not against θTC as in Fig. 1C, because we intend to know F1’s torque as a function of rotor angle. A plot of (θB − θTC) against θB obtained from the controlled rotation over six revolutions was sectioned by 360° along the x axis (θB) (Fig. S2A) and the plots of each revolution were superimposed after removing the region(s) of ADP inhibition (Fig. S2 B and C) (step 1). We note that, in this plot, rapid bead fluctuation driven by thermal force occurs along a line whose slope is 1 because both axes are functions of θB. Therefore, all data points of the plot were rotated by 45° about the origin (step 2, Fig. S2D). This converted the apparent direction of the fluctuation of bead to that along the y axis, which validates the process of running average in the later step (step 5, Fig. S2F). Here, θx′ and θy′ are obtained by the rotation matrix
Next, for each data point in the plot, the number of other neighboring data points located within 0.5° of the point was calculated. If this number exceeded a certain threshold number, the point was selected and used for the subsequent clustering processes. This process make it easy to distinguish each cluster of points from others (step 3, Fig. S2E). The threshold numbers of three molecules used were 16, 17, and 14. Then, each cluster of the extracted points was classified into one of three states, I, II, and III, judged from their position. To determine the boundaries between clusters, we focused only on the region assumed to contains two adjacent clusters and assigned all points to either of the two groups by the k-means method, and all boundaries between adjacent clusters were determined one by one in same way (step 4; state I, red; state II, green; state III, blue). After that, each of the clusters was running-averaged (step 5, Fig. S2F). The numbers of points for averaging are determined as the peak values of Gaussian fits of the histograms of each cluster; these bin sizes along θx′ are 1°. The numbers of points for averaging ranged from 25 to 680. We assumed a transition between two adjacent clusters occurs along the y axis at the points where the densities of the cluster along the x axis become equal (step 6, Fig. S2G). Finally, all obtained clusters and average lines were rotated by −45° about the origin to return these plots to that of (θB − θTC) against θB (step 7, Fig. S2H):
The magnitude of torque can be estimated from Eq. 1 (Fig. 2A).
ADP Inhibition.
During the controlled rotation, certain short parts of a (θB − θTC) trace occasionally deviated from the rest and dropped to minus region. Each of these is thought to reflect a lapsing into ADP inhibition followed by a quick reactivation from it by mechanical manipulation (20, 40) (Fig. S2A). Fourteen traces out of 21 traces in ATP hydrolysis and 7 traces out of 21 traces in ATP synthesis contain such a part(s). We removed the regions of ADP inhibition from the analysis (Fig. S2B). However, if the removal edges were close to the obtained transition points as shown in Fig. S2G, it indicates that the removal might affect the position determinations of the transition points. Then these transition points near the removal edge were determined again by selecting parts that are not interrupted by the ADP inhibition (orange and magenta parts in Fig. S3) with same procedure shown in Fig. S2.
Torque Profiles of Each Condition.
Torque profiles in each of substrate conditions i to vii were obtained as “centroid lines” of the average lines of three F1 molecules as discussed below.
Each of nine averaged lines of each cluster in 45°-rotated trace (in θx′ − θy′ relation) as shown in Fig. S2G was interpolated with 9,000 points, because not lines but points are necessary to determine the centroid. The i-th interpolated point of each averaged line was represented as . Here, i = 1–9,000, S represents states of F1, that take I, II, or III. Because each of the three states appeared three times during 360° rotation, the order of the appearance in each state is represented by n, which takes 1, 2, and 3. Note that states of n = 2 or 3 are shifted by −120/√2 (for n = 2) or −120/√2 × 2 (for n = 3) in both the x and y axis, to superimpose to the states of n = 1. m represents molecule number, 1, 2, or 3. l indicates the directionality of the reaction; l = 1 indicates ATP hydrolysis reaction, and l = 2 indicates ATP synthesis reaction. The interpolated 9,000 points of each line are equally spaced along the x axis. Therefore, for example, is represented by the edge points of each average line, and , as below:
The interpolated points were converted to the relation between the bead angle (θiB·Snml) and the angular displacement by the rotation matrix
The i-th interpolated points that represent the relation between the bead angle and the torque can be written as .
Here, the torque of the i-th interpolated point, τiSnml, is obtained from the trap stiffness of each F1 molecule (km):
Then, the centroid of i-th points of each state (S = I, II, or III) in a substrate condition (one of conditions i–vii) in a direction of reaction (l = 1 or 2) is given by
The torque profile was obtained by connecting the i-th and (i + 1)-th centroid points from i = 1–8,999 with straight lines as shown in Fig. S6.
Torque profiles of both direction of reaction in each substrates condition are compared in Fig. S7A (black lines, ATP hydrolysis; red lines, ATP synthesis). Centroid lines of both directions are almost identical for each condition.
In Fig. 3, each i-th centroid point of both ATP hydrolysis and ATP synthesis is averaged:
Acknowledgments
We thank all members of our laboratory for technical support and discussion. We also thank Ryota Iino (University of Tokyo) for critical discussion and Rikiya Watanabe (University of Tokyo) for construction of the magnetic tweezers system. This work was partly supported by Japan Society for the Promotion of Science Grant-in-Aid for Scientific Research 90049073 (to M.Y.) and the Ministry of Education, Culture, Sports, Science, and Technology-supported Program for the Strategic Research Foundation at Private Universities, 2011–2016.
Footnotes
The authors declare no conflict of interest.
This article is a PNAS Direct Submission.
This article contains supporting information online at www.pnas.org/lookup/suppl/doi:10.1073/pnas.1422885112/-/DCSupplemental.
References
- 1.Boyer PD. The binding change mechanism for ATP synthase—some probabilities and possibilities. Biochim Biophys Acta. 1993;1140(3):215–250. doi: 10.1016/0005-2728(93)90063-l. [DOI] [PubMed] [Google Scholar]
- 2.Diez M, et al. Proton-powered subunit rotation in single membrane-bound FoF1-ATP synthase. Nat Struct Mol Biol. 2004;11(2):135–141. doi: 10.1038/nsmb718. [DOI] [PubMed] [Google Scholar]
- 3.Yoshida M, Muneyuki E, Hisabori T. ATP synthase—a marvellous rotary engine of the cell. Nat Rev Mol Cell Biol. 2001;2(9):669–677. doi: 10.1038/35089509. [DOI] [PubMed] [Google Scholar]
- 4.Adachi K, et al. Coupling of rotation and catalysis in F1-ATPase revealed by single-molecule imaging and manipulation. Cell. 2007;130(2):309–321. doi: 10.1016/j.cell.2007.05.020. [DOI] [PubMed] [Google Scholar]
- 5.Watanabe R, Iino R, Noji H. Phosphate release in F1-ATPase catalytic cycle follows ADP release. Nat Chem Biol. 2010;6(11):814–820. doi: 10.1038/nchembio.443. [DOI] [PubMed] [Google Scholar]
- 6.Yasuda R, Noji H, Yoshida M, Kinosita K, Jr, Itoh H. Resolution of distinct rotational substeps by submillisecond kinetic analysis of F1-ATPase. Nature. 2001;410(6831):898–904. doi: 10.1038/35073513. [DOI] [PubMed] [Google Scholar]
- 7.Bilyard T, et al. High-resolution single-molecule characterization of the enzymatic states in Escherichia coli F1-ATPase. Philos Trans R Soc Lond B Biol Sci. 2013;368(1611):20120023. doi: 10.1098/rstb.2012.0023. [DOI] [PMC free article] [PubMed] [Google Scholar]
- 8.Hayashi K, Ueno H, Iino R, Noji H. Fluctuation theorem applied to F1-ATPase. Phys Rev Lett. 2010;104(21):218103. doi: 10.1103/PhysRevLett.104.218103. [DOI] [PubMed] [Google Scholar]
- 9.Noji H, Yasuda R, Yoshida M, Kinosita K., Jr Direct observation of the rotation of F1-ATPase. Nature. 1997;386(6622):299–302. doi: 10.1038/386299a0. [DOI] [PubMed] [Google Scholar]
- 10.Pänke O, Cherepanov DA, Gumbiowski K, Engelbrecht S, Junge W. Viscoelastic dynamics of actin filaments coupled to rotary F-ATPase: Angular torque profile of the enzyme. Biophys J. 2001;81(3):1220–1233. doi: 10.1016/S0006-3495(01)75780-3. [DOI] [PMC free article] [PubMed] [Google Scholar]
- 11.Spetzler D, et al. Microsecond time scale rotation measurements of single F1-ATPase molecules. Biochemistry. 2006;45(10):3117–3124. doi: 10.1021/bi052363n. [DOI] [PMC free article] [PubMed] [Google Scholar]
- 12.Toyabe S, Watanabe-Nakayama T, Okamoto T, Kudo S, Muneyuki E. Thermodynamic efficiency and mechanochemical coupling of F1-ATPase. Proc Natl Acad Sci USA. 2011;108(44):17951–17956. doi: 10.1073/pnas.1106787108. [DOI] [PMC free article] [PubMed] [Google Scholar]
- 13.Yasuda R, Noji H, Kinosita K, Jr, Yoshida M. F1-ATPase is a highly efficient molecular motor that rotates with discrete 120 degree steps. Cell. 1998;93(7):1117–1124. doi: 10.1016/s0092-8674(00)81456-7. [DOI] [PubMed] [Google Scholar]
- 14.Martin JL, Ishmukhametov R, Hornung T, Ahmad Z, Frasch WD. Anatomy of F1-ATPase powered rotation. Proc Natl Acad Sci USA. 2014;111(10):3715–3720. doi: 10.1073/pnas.1317784111. [DOI] [PMC free article] [PubMed] [Google Scholar]
- 15.Saita E, et al. Activation and stiffness of the inhibited states of F1-ATPase probed by single-molecule manipulation. J Biol Chem. 2010;285(15):11411–11417. doi: 10.1074/jbc.M109.099143. [DOI] [PMC free article] [PubMed] [Google Scholar]
- 16.Carmeli C, Lifshitz Y. Effects of Pi and ADP on ATPase activity in chloroplasts. Biochim Biophys Acta. 1972;267(1):86–95. doi: 10.1016/0005-2728(72)90140-5. [DOI] [PubMed] [Google Scholar]
- 17.Drobinskaya IY, Kozlov IA, Murataliev MB, Vulfson EN. Tightly bound adenosine diphosphate, which inhibits the activity of mitochondrial F1-ATPase, is located at the catalytic site of the enzyme. FEBS Lett. 1985;182(2):419–424. doi: 10.1016/0014-5793(85)80346-x. [DOI] [PubMed] [Google Scholar]
- 18.Dunham KR, Selman BR. Interactions of inorganic phosphate with spinach coupling factor 1. Effects on ATPase and ADP binding activities. J Biol Chem. 1981;256(19):10044–10049. [PubMed] [Google Scholar]
- 19.Feniouk BA, Suzuki T, Yoshida M. Regulatory interplay between proton motive force, ADP, phosphate, and subunit epsilon in bacterial ATP synthase. J Biol Chem. 2007;282(1):764–772. doi: 10.1074/jbc.M606321200. [DOI] [PubMed] [Google Scholar]
- 20.Hirono-Hara Y, Ishizuka K, Kinosita K, Jr, Yoshida M, Noji H. Activation of pausing F1 motor by external force. Proc Natl Acad Sci USA. 2005;102(12):4288–4293. doi: 10.1073/pnas.0406486102. [DOI] [PMC free article] [PubMed] [Google Scholar]
- 21.Krab K, van Wezel J. Improved derivation of phosphate potentials at different temperatures. Biochim Biophys Acta. 1992;1098(2):172–176. [Google Scholar]
- 22.Itoh H, et al. Mechanically driven ATP synthesis by F1-ATPase. Nature. 2004;427(6973):465–468. doi: 10.1038/nature02212. [DOI] [PubMed] [Google Scholar]
- 23.Soga N, Kinosita K, Jr, Yoshida M, Suzuki T. Efficient ATP synthesis by thermophilic Bacillus FoF1-ATP synthase. FEBS J. 2011;278(15):2647–2654. doi: 10.1111/j.1742-4658.2011.08191.x. [DOI] [PMC free article] [PubMed] [Google Scholar]
- 24.Watanabe R, Iino R, Shimabukuro K, Yoshida M, Noji H. Temperature-sensitive reaction intermediate of F1-ATPase. EMBO Rep. 2008;9(1):84–90. doi: 10.1038/sj.embor.7401135. [DOI] [PMC free article] [PubMed] [Google Scholar]
- 25.Nam K, Pu J, Karplus M. Trapping the ATP binding state leads to a detailed understanding of the F1-ATPase mechanism. Proc Natl Acad Sci USA. 2014;111(50):17851–17856. doi: 10.1073/pnas.1419486111. [DOI] [PMC free article] [PubMed] [Google Scholar]
- 26.Okazaki K, Hummer G. Phosphate release coupled to rotary motion of F1-ATPase. Proc Natl Acad Sci USA. 2013;110(41):16468–16473. doi: 10.1073/pnas.1305497110. [DOI] [PMC free article] [PubMed] [Google Scholar]
- 27.Pu J, Karplus M. How subunit coupling produces the gamma-subunit rotary motion in F1-ATPase. Proc Natl Acad Sci USA. 2008;105(4):1192–1197. doi: 10.1073/pnas.0708746105. [DOI] [PMC free article] [PubMed] [Google Scholar]
- 28.Suzuki T, Tanaka K, Wakabayashi C, Saita E, Yoshida M. Chemomechanical coupling of human mitochondrial F1-ATPase motor. Nat Chem Biol. 2014;10(11):930–936. doi: 10.1038/nchembio.1635. [DOI] [PubMed] [Google Scholar]
- 29.Okuno D, Iino R, Noji H. Stiffness of gamma subunit of F1-ATPase. Eur Biophys J. 2010;39(12):1589–1596. doi: 10.1007/s00249-010-0616-9. [DOI] [PubMed] [Google Scholar]
- 30.Adachi K, Oiwa K, Yoshida M, Nishizaka T, Kinosita K., Jr Controlled rotation of the F₁-ATPase reveals differential and continuous binding changes for ATP synthesis. Nat Commun. 2012;3:1022. doi: 10.1038/ncomms2026. [DOI] [PMC free article] [PubMed] [Google Scholar]
- 31.Kinosita K, Jr, Adachi K, Itoh H. Rotation of F1-ATPase: How an ATP-driven molecular machine may work. Annu Rev Biophys Biomol Struct. 2004;33:245–268. doi: 10.1146/annurev.biophys.33.110502.132716. [DOI] [PubMed] [Google Scholar]
- 32.Watanabe R, et al. Mechanical modulation of catalytic power on F1-ATPase. Nat Chem Biol. 2012;8(1):86–92. doi: 10.1038/nchembio.715. [DOI] [PubMed] [Google Scholar]
- 33.Iko Y, Tabata KV, Sakakihara S, Nakashima T, Noji H. Acceleration of the ATP-binding rate of F1-ATPase by forcible forward rotation. FEBS Lett. 2009;583(19):3187–3191. doi: 10.1016/j.febslet.2009.08.042. [DOI] [PubMed] [Google Scholar]
- 34.Masaike T, Koyama-Horibe F, Oiwa K, Yoshida M, Nishizaka T. Cooperative three-step motions in catalytic subunits of F1-ATPase correlate with 80 degrees and 40 degrees substep rotations. Nat Struct Mol Biol. 2008;15(12):1326–1333. doi: 10.1038/nsmb.1510. [DOI] [PubMed] [Google Scholar]
- 35.Okuno D, et al. Correlation between the conformational states of F1-ATPase as determined from its crystal structure and single-molecule rotation. Proc Natl Acad Sci USA. 2008;105(52):20722–20727. doi: 10.1073/pnas.0805828106. [DOI] [PMC free article] [PubMed] [Google Scholar]
- 36.Sielaff H, Rennekamp H, Engelbrecht S, Junge W. Functional halt positions of rotary FOF1-ATPase correlated with crystal structures. Biophys J. 2008;95(10):4979–4987. doi: 10.1529/biophysj.108.139782. [DOI] [PMC free article] [PubMed] [Google Scholar]
- 37.Junge W, Sielaff H, Engelbrecht S. Torque generation and elastic power transmission in the rotary FoF1-ATPase. Nature. 2009;459(7245):364–370. doi: 10.1038/nature08145. [DOI] [PubMed] [Google Scholar]
- 38.Sielaff H, et al. Domain compliance and elastic power transmission in rotary FoF1-ATPase. Proc Natl Acad Sci USA. 2008;105(46):17760–17765. doi: 10.1073/pnas.0807683105. [DOI] [PMC free article] [PubMed] [Google Scholar]
- 39.Czub J, Grubmüller H. Torsional elasticity and energetics of F1-ATPase. Proc Natl Acad Sci USA. 2011;108(18):7408–7413. doi: 10.1073/pnas.1018686108. [DOI] [PMC free article] [PubMed] [Google Scholar]
- 40.Hirono-Hara Y, et al. Pause and rotation of F(1)-ATPase during catalysis. Proc Natl Acad Sci USA. 2001;98(24):13649–13654. doi: 10.1073/pnas.241365698. [DOI] [PMC free article] [PubMed] [Google Scholar]


