

Abstract
Background
Retinoblastoma is a pediatric eye cancer associated with RB1 loss or MYCN amplification (RB1+/+MYCNA). There are controversies concerning the existence of molecular subtypes within RB1−/− retinoblastoma. To test whether these molecular subtypes exist, we performed molecular profiling.
Methods
Genome-wide mRNA expression profiling was performed on 76 primary human retinoblastomas. Expression profiling was complemented by genome-wide DNA profiling and clinical, histopathological, and ex vivo drug sensitivity data.
Findings
RNA and DNA profiling identified major variability between retinoblastomas. While gene expression differences between RB1+/+MYCNA and RB1−/− tumors seemed more dichotomous, differences within the RB1−/− tumors were gradual. Tumors with high expression of a photoreceptor gene signature were highly differentiated, smaller in volume and diagnosed at younger age compared with tumors with low photoreceptor signature expression. Tumors with lower photoreceptor expression showed increased expression of genes involved in M-phase and mRNA and ribosome synthesis and increased frequencies of somatic copy number alterations.
Interpretation
Molecular, clinical and histopathological differences between RB1−/− tumors are best explained by tumor progression, reflected by a gradual loss of differentiation and photoreceptor expression signature. Since copy number alterations were more frequent in tumors with less photoreceptorness, genomic alterations might be drivers of tumor progression.
Research in context
Retinoblastoma is an ocular childhood cancer commonly caused by mutations in the RB1 gene. In order to determine optimal treatment, tumor subtyping is considered critically important. However, except for very rare retinoblastomas without an RB1 mutation, there are controversies as to whether subtypes of retinoblastoma do exist. Our study shows that retinoblastomas are highly diverse but rather than reflecting distinct tumor types with a different etiology, our data suggests that this diversity is a result of tumor progression driven by cumulative genetic alterations. Therefore, retinoblastomas should not be categorized in distinct subtypes, but be described according to their stage of progression.
Keywords: Retinoblastoma, Retina, Pediatric oncology, Cancer, Expression profiling, Progression
Highlights
-
•
RB1−/− retinoblastomas display highly differential gene expression signatures.
-
•
Copy number alterations are strongly associated with gene expression differences.
-
•
Gene expression and copy number differences reflect gradual tumor progression.
1. Introduction
Retinoblastoma is a childhood cancer of the retina, usually caused by bi-allelic inactivation of the RB1 tumor suppressor gene. In 40% of the cases, patients have a hereditary predisposition due to the presence of a germ line mutation in RB1. Only one somatic inactivation of RB1 is required in hereditary patients to develop retinoblastoma and therefore they are often affected bilateral. While the non-hereditary form of retinoblastoma is usually caused by somatic inactivation of both RB1 alleles, a subtype of retinoblastoma was recently described which lacks mutations in RB1 but displays high level amplification of the oncogene MYCN (Rushlow et al., 2013). Besides the initiating hit (RB1 mutation or MYCN amplification), additional DNA mutations are likely required for retinoblastoma to develop (Dimaras et al., 2008). Common chromosomal alterations observed in retinoblastomas are gains of chromosomal regions 1q, 2p and 6p, and losses at chromosome 16q (Thériault et al., 2014). We and others have previously described differences in the level of chromosomal instability between retinoblastomas, depending on age of the patient, heritability and laterality (Herzog et al., 2001, Lillington et al., 2003, Reese and Ellsworth, 1963, Schouten-van Meeteren et al., 2001, Van de Wiel et al., 2007, Zielinski et al., 2005).
In addition to copy number analyses, several gene expression studies on retinoblastoma have been published (Chakraborty et al., 2007, Ganguly and Shields, 2010, Kapatai et al., 2013, McEvoy et al., 2011). It has been suggested that retinoblastomas have similar expression profiles and express genes involved in multiple differentiation programs (McEvoy et al., 2011). However, in another recent study (Kapatai et al., 2013), two different subtypes of retinoblastoma were identified based on gene expression profiling. One group expressed genes associated with a range of different retinal cell types, suggesting a progenitor cell of origin, while the second group showed high expression of cone photoreceptor associated genes, suggesting derivation from a cone photoreceptor cell precursor. So, while it is well-established that there are 2 genomic subtypes (RB1−/− and RB1+/+MYCNA) there is controversy surrounding gene expression subtypes, in particular within the RB1−/− tumor subtype.
To address this issue, we have performed transcriptome-wide expression profiling of a large, diverse and randomly selected set of retinoblastomas. Subsequently, expression profiles were associated with copy number profiles, clinical characteristics and ex vivo drug sensitivity data.
2. Material and Methods
2.1. Patient Samples
Retinoblastoma samples from a consecutive patient series were collected after primary enucleation (without receiving previous treatment) at the VU University Medical Center (Amsterdam, The Netherlands), which is the national retinoblastoma referral center in the Netherlands. Incisions were made in the enucleated eyes and tumor samples were taken and immediately snap frozen in liquid nitrogen and stored at − 80 °C. In some cases, an additional tumor sample was used for culturing, as described previously (Schouten-van Meeteren et al., 2001). Histopathology was determined at initial pathological diagnosis by a retinoblastoma-experienced pathologist and independently by an ophthalmologist and pediatric oncologist. Tumor location was determined on funduscopy results and/or fundus photos by an ophthalmologist. The disease was staged according to the two most common classification systems for retinoblastoma, the Reese–Ellsworth Classification (Reese and Ellsworth, 1963) and the International Intra-ocular Retinoblastoma Classification (ABC-classification) (Linn Murphree, 2005). This prospective study was conducted in accordance with recommendations of the local ethics committee, with waiver of informed consent (IRB00002991 reference 2014.360).
2.2. DNA Extraction and Copy Number Profiling
Genomic DNA from frozen tumor retinoblastoma specimens was isolated with the NucleoSpin Tissue kit (Macherey-Nagel, Düren, Germany). DNA quality was analyzed for high molecular bands > 20 kb by agarose gel electrophoresis. DNA concentration and OD 260/280 ratio were determined with the Nanodrop ND-1000 spectrophotometer (NanoDrop Technologies, Wilmington, USA). DNA yields and quality were within the same range for all samples. Microarray-based DNA genotyping experiments were performed at ServiceXS (ServiceXS B.V., Leiden, The Netherlands) using the HumanOmni1-Quad BeadChip (Illumina Inc., San Diego, U.S.A.), as described previously (Mol et al., 2014).
2.3. RNA Extraction and Expression Profiling
Frozen tumor samples were homogenized in a TRIzol reagent (Invitrogen, Carlsbad, California, U.S.A.) with a rotor–stator homogenizer, and RNA was extracted following the manufacturer's instructions. TRIzol extracted RNA was treated with rDNase (Macherey-Nagel, Düren, Germany) to digest any contaminating DNA and subsequently purified with the NucleoSpin RNA Clean-up XS kit (Macherey-Nagel). Three samples (VUMC-Rb-76, VUMC-Rb-81, and VUMC-Rb-82) were extracted with the AllPrep RNA/DNA/Protein Mini Kit (Qiagen, Venlo, The Netherlands), following the manufacturer's instructions. Quality control, RNA labeling, hybridization and data extraction were performed at ServiceXS B.V. RNA concentration was measured using the Nanodrop ND-1000 spectrophotometer (Nanodrop Technologies). The RNA quality and integrity were determined using Lab-on-chip analysis on the Agilent 2100 Bioanalyzer (Agilent Technologies, Inc., Santa Clara, CA, U.S.A.) and on the Shimadzu MultiNA RNA analysis chips (Shimadzu Corporation, Kyoto, Japan). Only RNA samples that passed the quality criteria of an OD 260/280 ratio of ≥ 1.8 and an RNA Integrity number (RIN) of ≥ 7 were processed for expression profiling. Biotinylated cRNA was prepared using the Affymetrix 3′ IVT Express Kit (Affymetrix, Santa Clara, CA, USA) according to the manufacturer's specifications with an input of 100 ng of total RNA. The quality of the cRNA was assessed using the Shimadzu MultiNA in order to confirm if the average fragment size was according to requirements of Affymetrix. Per sample, 7.5 μg cRNA of the obtained biotinylated cRNA samples was fragmented and hybridized in a final concentration of 0.0375 μg/μL on the Affymetrix [HT HG U133 + PM96] (Affymetrix, Santa Clara, California, U.S.A.). After an automated process of washing and staining by the GeneTitan machine (Affymetrix) using the Affymetrix HWS Kit for GeneTitan (part nr. 901530), absolute values of expression were calculated from the scanned array using the Affymetrix Command Console v3.2 software. Micro-array data is available at Gene expression omnibus (GSE59983).
2.4. Micro-array Data Analysis
Absolute expression values were normalized with robust multichip array (RMA) normalization implemented by affy Bioconductor (Gautier et al., 2004) package and log2-transformed. For each official HGNC symbol targeted by multiple probes, only the probe closest to the 3′-prime end was used for further analysis. Agglomerative hierarchical (Ward, complete-linkage, average-linkage and McQuitty) clustering was performed on pairwise inverse absolute Pearson correlations. Differential expression testing was performed by generalized linear modeling of indicated (co-)variates on normalized log2-transformed expression values implemented by limma Bioconductor package (Smith, 2005). Obtained p-values were corrected for multiple hypothesis testing by Benjamini & Hochberg false discovery rate (FDR) adjustments (Benjamini et al., 1995). Obtained FDR-adjusted two-sided p-values < 0.05 were considered significant.
Copy number estimates and allelic intensity ratios exported by Illumina Beadstudio were normalized with tQN-procedure (Staaf et al., 2008). Subsequently, log2-R-ratios (LRR) were calculated from normalized copy number estimates of the tumors and matched blood samples. For tumors with no matching blood sample, sex-matched pooled baselines from all blood samples were used to calculate log2-R ratios. CGHcall (van de Wiel et al., 2007) and CGHregions (Van de Wiel and Van Wieringen, 2007) implementing the DNAcopy segmentation algorithm were used to create a reduced segment matrix containing five copy number levels. All parameters used for copy number segmentations (performed by “segmentData” function) used were defaults except the definition of small segments (clen = 25) and the amount of standard deviations required to undo long segments (relSDLong = 5/3). For association of total copy number changes with photoreceptorness, the number of affected base pairs (in Mbps) between the groups was analyzed with the Wilcoxon rank sum test. The association between copy number levels and expression estimates was quantified by fitting a linear model between continuous copy number estimates (segment means) and log2-transformed normalized expression estimates and testing the slopes for significance. Resulting p-values were corrected for multiple hypothesis testing by Benjamini & Hochberg false discovery rate (FDR) adjustments where two-sided p-values < 0.05 were considered significant.
2.5. Drug Sensitivity Assays
Ex vivo drug sensitivity assays were performed on primary retinoblastoma samples using the colorimetric 3-(4,5-dimethylthiazol-2-yl)-2,5-diphenyltetrazolium bromide (MTT) cell viability assay (van Meerloo et al., 2011). Some of the drug sensitivity data were described previously (Schouten-van Meeteren et al., 2001). Cells were exposed to the drugs in duplicate in six serial dilution steps for 96 h at 37 °C. The following drugs and concentration ranges were used: actinomycin D (0.000015–1.5 μg/mL), cytarabin (0.007812–256 μg/mL), carboplatin (0.49–500 μg/mL), cisplatin (0.0488–50 μg/mL), doxorubicin (0.03125–32 μg/mL), idarubicin (0.00781–8 μg/mL), 4-hydroperoxy-ifosfamide (0.098–100 μg/mL), thiotepa (0.032–100 μg/mL), vincristine (0.064–400 mg/mL), etoposide (0.08–200 μg/mL), 6-thioguanine (0.098–100 μg/mL), and cladribine (0.002–200 μg/mL) as described previously (Schouten-van Meeteren et al., 2001). A minimum of 1 drug was tested for 1 tumor sample and a maximum of 12 drugs tested for 10 tumor samples (median = 11 drugs tested per tumor sample). Resulting IC50 values were calculated based on triplicates and were calculated relative to untreated controls with drug-free medium.
2.6. Internal Validation of Microarray Gene Expression by qPCR
For a selected set of genes, qPCR validation of microarray gene expression results was done by “best-coverage” Taqman gene expression assays (Life Technologies Europe BV, Bleiswijk, The Netherlands). By means of duplex PCR reactions using GAPDH as internal control, relative gene expression of selected genes was determined. Normalized ratios between genes of interest and GAPDH were calculated by the Lightcycler 480 relative gene expression quantification module. Log2-transformed normalized ratios were compared with log2-transformed micro-array expression estimates.
2.7. Statistics
Base functionality of R (version 3.1.2 “Pumpkin Helmet”) was used for hypothesis testing. The Wilcoxon rank sum test was used for comparing means of continuous variables between two independent groups and Wilcoxon signed rank sum test for two dependent groups. Kruskal–Wallis rank sum test was used for variables with 3 or more independent groups. For comparing means between ordinal variables, linear-by-linear association testing was performed implemented by the “coin” R-library. The exact binomial test was used as a sign test on a set of linear regression slopes. Two-sided p-values < 0.05 were considered significant.
3. Results
3.1. Unsupervised Analysis of Retinoblastoma mRNA Expression Profiles
In order to identify possible differences in gene expression profiles of retinoblastomas, standardized log2-transformed expression estimates were used as input for unsupervised hierarchical clustering (UHC) of 76 retinoblastoma samples. Ward's and average-linkage agglomerative clustering of inverse absolute Pearson correlations between samples is summarized in a dendrogram (Fig. 1A). The Ward's dendrogram was pruned at an arbitrary k = 3, forcing the cohort to be categorized in three clusters: Ward's retinoblastoma cluster 1 (N = 26, red color), Ward's retinoblastoma cluster 2 (N = 46, green color), and Ward's retinoblastoma cluster 3 (N = 4, blue color) with dissimilarity heights of 0.18, 0.17, and 0.12, respectively. To test the robustness of the three Ward's clusters, clustering with McQuitty and complete-linkage was also performed, (Fig. S1). Leafs (representing samples) of resulting dendrograms were colored based on the initial three Ward's retinoblastoma clusters. The hierarchical agglomeration of the retinoblastoma samples into clusters differed between clustering algorithms. Whereas Ward's retinoblastoma cluster 3 (blue labels) was consistently clustered as a separate branch, Ward's retinoblastoma clusters 1 (red) and 2 (green) were agglomerated together in average-linkage, complete-linkage and McQuitty. Remarkably, average-linkage clustering placed Ward's retinoblastoma clusters 1 and 2 in a single branch where the similarities of samples in clusters 1 and 2 gradually decreased. All these observations were in agreement with principal component analysis (PCA, Fig. 1B), which shows that the three-dimensional distance between Ward's retinoblastoma cluster 3 and Ward's retinoblastoma clusters 1 and 2 combined was larger than the distance between Ward's retinoblastoma clusters 1 and 2. Taken together Ward's retinoblastoma cluster 3 appeared distinct from retinoblastoma groups 1 and 2, while the differences between Ward's clusters 1 and 2 could be more continuous rather than dichotomous.
Fig. 1.

Transcriptome-wide unsupervised hierarchical clustering stratifies the cohort in 3 Ward's retinoblastoma clusters. (A) Dendrogram of transcriptome-wide unsupervised hierarchical clustering of all primary retinoblastoma samples (N = 76) by Ward and average-linkage algorithms. The Ward's dendrogram is pruned at an arbitrary k = 3 yielding three retinoblastoma clusters: cluster 1 in red, cluster 2 in green and cluster 3 in blue. (B) Principal component analysis visualized in a 3-dimensional scatter plot, in which the axes represent the first 3 principal components. Colors refer to the identified retinoblastoma clusters and the data demonstrate concordance between UHC and PCA clusters. (C) Expression box plots of 5 cell cycle markers (E2F1, E2F2, E2F3, CCNE1, PCNA; top panel), 5 rod photoreceptor markers (RHO, CNGB1, ROM1, PDE6G, CNGA1; middle panel), and 5 cone photoreceptor markers (PDE6C, PDE6H, GNAT2, OPN1SW, ARR3; bottom panel). Cluster 1 is indicated in red, cluster 2 in green, and cluster 3 in blue. The RB1+/+MYCNA tumors are indicated by arrows or asterisks. (D) Validation of gene expression differences by Taqman relative quantification (qPCR) of gene expression (GAPDH as internal control). X-axis shows log2-transformed Taqman relative gene expression of CCNE1, CNGB1 and ARR3 and Y-axis log2-transformed micro-array gene expression estimates.
In a recent gene expression profiling study (N = 21), three retinoblastoma groups were identified (Kapatai et al., 2013). Based on a detailed inspection of retina marker expression, one of the three groups was considered to largely represent normal retinal tissue. To assess the similarity of our Ward's clusters with Kapatai's subgroups, expression box plots of 5 cell cycle markers (E2F1, E2F2, E2F3, PCNA, CCNE1), 5 rod photoreceptor markers (RHO, CNGB1, ROM1, PDE6G, CNGA1) and 5 cone photoreceptor markers (PDE6C, PDE6H, GNAT2, OPN1SW, ARR3) were made (Fig. 1C) (Sharon et al., 2002). For CCNE1 (cell cycle marker), CNGB1 (rod photoreceptor marker) and ARR3 (cone photoreceptor marker) validation of the micro-array gene data was performed by qPCR-assays (Fig. 1D). Gene expression values measured by qPCR were highly similar to the micro-array data and resulted in similar differences between Ward's retinoblastoma clusters (Fig. S2). The level of expression of the selected markers differed significantly between the Ward's expression groups (see Table S1 for a detailed list of fold changes and p-values). Ward's retinoblastoma clusters 1 and 2 were characterized by relatively high expressions of cell cycle markers and low expressions of rod photoreceptor markers relative to Ward's retinoblastoma cluster 3. High expressions of both cone and rod photoreceptor markers and low expressions of cell cycle markers were specific for Ward's retinoblastoma cluster 3 suggesting contamination with normal retinal tissue. Therefore this small group was omitted in subsequent analyses analogous to the study from Kapatai et al. (2013).
Expressions of cone photoreceptor markers were higher in Ward's retinoblastoma cluster 2 compared with cluster 1. However, the difference was gradual and not dichotomous, exemplified by expression of ARR3 in micro-array and qPCR validation (Fig. 1D). Gradual expression differences also hold for the two other tested markers, CCNE1 (cell cycle) and CNGB1 (rod). This supports again that Ward's retinoblastoma clusters 1 and 2 do not appear to be distinct entities. Although the RB1+/+MYCNA tumors were not clustered as separate branches in the unsupervised (all genes) Ward's clustering (Fig. 1A), for selected markers they presented as outliers (Fig. 1, Supplementary Fig. 2). To test whether there were more genes that had a similar more dichotomous difference in gene expression such as CCNE1, differential gene expression analysis was performed between RB1+/+MYCNA (N = 2) and all other tumors in Ward's retinoblastoma clusters 1 and 2 (N = 70). In total, 1800 genes were significantly differentially expressed (see Table S2). Some of the most significantly differential genes (top 50 of Table S2) included important cell cycle related genes such as CDKN2C, E2F7, CDKN2A, MCM6, WEE1 and RBL1. For these genes, the dichotomous differences in gene expression are visualized (Fig. S3).
3.2. Retinoblastomas have Gradually Differing Gene Expression Signatures
To further test the graduality of expression differences between Ward's retinoblastoma clusters 1 and 2, we performed a genome-wide differential gene expression analysis. In total, 6324 out of 19,488 (32.5%) genes were found to be differentially expressed (FDR-adjusted p-values < 0.05) between the two Ward's clusters (Table S3). All differentially expressed genes were used for the hierarchical clustering (Fig. 2). Ward's retinoblastoma cluster 1 was characterized by high expressions of genes present in gene cluster 1 (N = 2999, purple branches) whereas Ward's retinoblastoma cluster 2 showed high expressions of genes in gene cluster 3 (N = 2753, orange branches). Expressions of genes in a gene cluster 2 (N = 572, black branches) were on average higher in Ward's retinoblastoma cluster 2 relative to cluster 1, although they are not consistent for all samples. Gene ontology analysis of the three gene clusters was performed using DAVID functional annotation clustering. Functional annotation classes with enrichment scores above 5 are summarized in Table 1 (full DAVID reports in Table S4). High expressions of genes involved in M-phase and in mRNA and ribosome synthesis characterized Ward's retinoblastoma cluster 1, while genes highly expressed in Ward's retinoblastoma cluster 2 were involved in photoreceptor functions, including visual perception of light and photo-transduction. Additionally, genes involved in inflammation, wound healing and antigen presentation (gene cluster 2, black branches Fig. 2 and Table 1) were on average higher in Ward's retinoblastoma cluster 2.
Fig. 2.

Hierarchical clustering of differentially expressed genes between Ward's retinoblastoma clusters 1 and 2 reveals distinct gene clusters. Hierarchical clustering of significantly differentially expressed genes (N = 6324) between retinoblastoma clusters 1 and 2. Sample properties are indicated at the top with colored bars; retinoblastoma clusters: cluster 1 in red, cluster 2 in green; tumor location: peripheral in red, central in green, full-blown in gray with a cross; heredity: non-hereditary retinoblastoma in red, hereditary in green; laterality: unilateral in red, bilateral in green; tumor volume: continuous scale from red (large) to green (small), not available in gray; age at diagnosis: continuous scale from red (older) to green (young). The heat map represents standardized expression estimates mapped to a continuous green-to-red color scale where green means low expression and red means high expression. Three gene clusters are colored in purple (cluster 1), black (cluster 2), and orange (cluster 3). The RB1+/+MYCNA tumors are indicated by red labels.
Table 1.
Gene ontology analysis of differentially expressed genes between Ward's retinoblastoma clusters 1 and 2.
| Gene cluster | DAVID annotation cluster summary | Enrichment score | High in Ward's retinoblastoma cluster |
|---|---|---|---|
| 1 (purple) | Mitotic cell cycle, M phase, mitosis, cell division, nuclear division | 11.61 | 1 |
| 1 (purple) | Transcription, regulation of transcription, regulation of RNA metabolic process | 10.05 | 1 |
| 1 (purple) | RNA processing/splicing, mRNA metabolic process, nuclear mRNA splicing | 6.32 | 1 |
| 1 (purple) | Ribonucleoprotein complex biogenesis, ribosome biogenesis, rRNA/ncRNA/ processing/metabolic process | 5.74 | 1 |
| 2 (black) | Response to wounding, defense response, inflammatory response | 19.45 | 2 |
| 2 (black) | Antigen processing and presentation | 8.07 | 2 |
| 2 (black) | Positive regulation of immune system response, acute/humoral/innate inflammatory process, complement activation | 6.98 | 2 |
| 2 (black) | Cell motion/migration/motility | 5.53 | 2 |
| 2 (black) | Vasculature development, angiogenesis | 5.28 | 2 |
| 2 (black) | Wound healing, hemostasis, blood coagulation | 5.14 | 2 |
| 3 (orange) | Visual perception, sensory perception (of light stimulus), neurological system process, cognition | 9.28 | 2 |
| 3 (orange) | Phosphate metabolism, phosphorylation, protein amino acid phosphorylation | 5.08 | 2 |
| 3 (orange) | Detection of light/external/abiotic stimulus, photo-transduction, detection of visible light | 5.05 | 2 |
Based on the heat map colors (Fig. 2) it can be hypothesized that the gene expression differences between Ward's retinoblastoma clusters 1 and 2 were continuous rather than dichotomous. To further test this, the mean expression of gene cluster 1 (“M-phase, mRNA/ribosome synthesis signature”) and gene cluster 3 (“photoreceptor signature”) was calculated for each sample. The mean expressions of both differential signatures are displayed along with color-coded sample information, with samples ordered by decreasing photoreceptor signature expressions (Fig. 3). The data confirming variability in photoreceptor signature was continuous and not dichotomous. Although this gradual change underscores that Ward's separation into clusters 1 and 2 was arbitrary, the clustering was useful to detect genes that were differentially expressed across retinoblastoma samples. The gradual decrease of the photoreceptor signature was accompanied by a gradual increase of the M-phase and mRNA/ribosome synthesis expression signature (p-value < 2.2E − 16, R2 = 0.90). The immune signature was less strongly associated with the photoreceptor (p-value = 9.28E − 7, R2 = 0.29) and M-phase (p-value = 1.77E − 7, R2 = 0.32) signatures as shown in Fig. S4. Three tumors (VUMC-Rb-02, VUMC-Rb-17 and VUMC-Rb-99) from Ward's Rb cluster 2, clustered together with Ward's Rb cluster 1 in supervised analysis (Fig. 2). In agreement, these three tumors had an intermediate photoreceptorness and M-phase and mRNA/ribosome synthesis expression, which complicated the initial dichotomous stratification. The two RB1+/+MYCNA tumors without RB1 mutation but with focal MYCN amplifications (Rushlow et al., 2013), showed low photoreceptor expressions and high M-phase and mRNA/ribosome synthesis expression compared with the median of the cohort. Furthermore, the Ward's retinoblastoma cluster 1 tumors showed a higher expression of MYCN compared with Ward's retinoblastoma cluster 2 tumors (log2(fold change) = 0.55, p-value = 4.7E − 3). For further analysis, the mean photoreceptor signature expression was taken as a measure of photoreceptorness which was used to further characterize the retinoblastoma cohort. Important to note is that photoreceptorness was quantified by the mean expression of gene cluster 3 (2753 genes, orange branches Fig. 2, Table S3). Although this gene set is highly enriched for photoreceptor ontologies (Table S4), not every single gene in this gene set is annotated with photoreceptor-related ontologies.
Fig. 3.

Quantification of differential signatures in relation to clinical and histopathological variables. Gene expression differences between Ward's retinoblastoma cluster 1 (red symbols) and Ward's retinoblastoma cluster 2 (green symbols) appears continuous, not dichotomous. Gene expression of the photoreceptor signature is given by crosses; triangles indicate the M-phase and mRNA/ribosome synthesis signature. Tumors are sorted by photoreceptor signature gene expression. Corresponding clinical and histopathological determinations are given in aligned color-coded boxes including a legend with color-value mappings. Results of statistical analyses are provided in Table 2. The RB1+/+MYCNA tumors are indicated by red labels.
3.3. Loss of Photoreceptorness is Associated with Increased Somatic Copy Number Alteration Frequencies
To investigate whether photoreceptorness was associated with somatic copy number alterations (SCNA), whole genome copy number (CN) profiling was performed when tumor DNA was available. For 43/72 (59.7%) tumors for which gene expression profiles were determined, SCNA profiles were available. To visualize the difference in SCNA between tumors with different photoreceptorness, the 43 tumors were categorized into quartiles based on photoreceptorness (Q1 = 25% of tumors with highest photoreceptorness, Q4 = 25% of tumors with lowest photoreceptorness). It is shown that the mean photoreceptorness (one-way ANOVA p-value < 2.2E − 16) and mean overall genomic instability (one-way ANOVA p-value = 4.61E − 05) differed significantly between the photoreceptorness quartile groups (Fig. 4). Karyogram overviews of SCNA frequencies stratified by photoreceptorness quartiles clearly show that tumors with lower photoreceptorness have higher frequencies of SCNA (Fig. 5A).
Fig. 4.
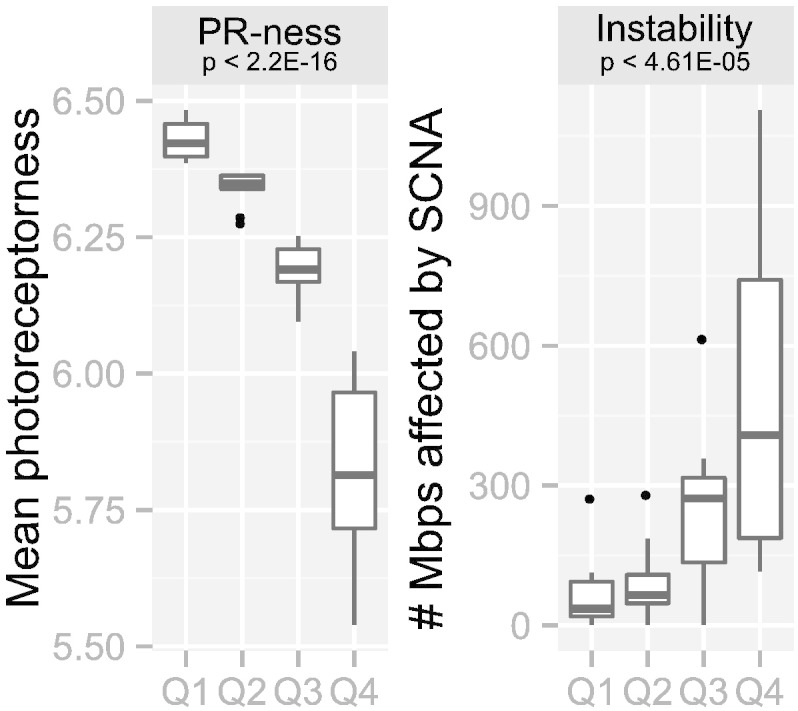
Loss of photoreceptorness is strongly associated with increased frequencies of SCNA. Photoreceptorness was used to stratify the cohort in quartiles (Q1: 25% of tumors with the highest photoreceptorness, Q4: 25% of tumors with the lowest photoreceptorness). For each quartile, boxplots are shown for photoreceptorness (left) and genomic instability (right). Photoreceptorness was statistically different between the photoreceptorness quartiles (one-way ANOVA, two-tailed p-value < 2.2E–16). Total genomic instability, in our study defined as the number of megabases of the genome altered by SCNA, was inversely correlated with the photoreceptorness quartiles (one-way ANOVA, two-tailed p-value < 4.61E–05).
Fig. 5.

Karyogram overview of SCNA and its relation to photoreceptorness and gene expression. (A) For each photoreceptorness quartile, SCNA frequencies (gains in red, losses in blue) are visualized for all chromosomes except the Y-chromosome. (B–C) For each approved HGNC symbol that was probed by both RNA and DNA microarrays, the association between (B) copy number estimates and gene expression and (C) copy numbers and photoreceptorness is visualized. Negative log10-transformed p-values of linear regression slope tests are plotted along genomic coordinates. Red dots indicate significant p-values (p-value = 0.05 gives − log10(0.05) = 1.3).
For each approved HGNC gene symbol that was probed by both RNA and DNA arrays, it was tested whether SCNA were associated with photoreceptorness by linear regression slope testing of photoreceptorness on copy number estimates (Fig. 5C). For 4146 genes, copy number estimates were significantly associated with photoreceptorness, indicated by the red dots (Fig. 5C). The relation between copy numbers and photoreceptorness was positive for 1889/4146 (45.6%) genes and negative for 2257/4146 (54.4%) genes. To test for which genes copy numbers had an effect on gene expression (gene dosage effect), linear regression slope testing of copy number estimates on expression estimates was performed (Fig. 5B). In total, 1773 genes showed a significant gene dosage effect and for 1727/1773 (97.4%, indicated by red dots in Fig. 5B) the gene dosage effect was in the expected direction (positive linear regression slope: more copies correlated with more expression and less copies correlated with less expression). The strongest gene dosage effects were observed at the 2p24.3 region harboring the MYCN gene and at 13q14 where RB1 is located. Furthermore, strong gene dosage effects were identified at 6p and 16q. In Supplementary Table S5 a complete list of the results is given.
3.4. The Degree of Photoreceptorness is Associated with Clinical and Histopathological Features
Visual inspection of photoreceptorness and several clinical and histopathological variables (Fig. 3) called for further investigation of photoreceptorness in relation to tumor characteristics. To determine the statistical significance of the relations between photoreceptorness and clinical and histopathological determinations, hypothesis testing was performed (Table 2). For numeric independent variables (age at diagnosis and tumor volume), Table 2 describes the mean and standard error of the mean for each photoreceptorness quartile. Quartile stratification was performed for illustrative purposes and was not required nor used for Wilcoxon signed rank test. Patients with tumors that showed high photoreceptorness were diagnosed at significantly younger age (p-value = 1.26E − 11) and had significantly larger tumors (p-value = 3.53E − 12) than patients with low photoreceptorness.
Table 2.
Hypothesis testing of photoreceptorness and clinical and histopathological variables.
| Independent variable | Descriptive statistics mean ± SEM | Hypothesis testing p-value (statistical test) |
|---|---|---|
| Volume measured by MRI (mm3) | 3.53E − 12* (WSRT) | |
| Q1 | 1016.6 ± 109.8 | |
| Q2 | 1147.0 ± 80.4 | |
| Q3 | 1182.2 ± 160.8 | |
| Q4 | 2056.4 ± 326.7 | |
| Age at diagnosis (months) | 1.26E − 11* (WSRT) | |
| Q1 | 10.4 ± 1.2 | |
| Q2 | 10.8 ± 1.2 | |
| Q3 | 25.2 ± 5.3 | |
| Q4 | 35.1 ± 4.2 | |
| Differentiation | Photoreceptorness | 1.96E − 03* (LBL) |
| Poor | 6.0 ± 0.06 | |
| Moderate | 6.2 ± 0.08 | |
| Well | 6.3 ± 0.03 | |
| Flexner–Wintersteiner rosettes | Photoreceptorness | 2.18E − 03* (WSRT) |
| Absent | 5.9 ± 0.07 | |
| Present | 6.2 ± 0.04 | |
| Laterality | Photoreceptorness | 4.01E − 03* (WSRT) |
| Unilateral | 6.1 ± 0.04 | |
| Bilateral | 6.3 ± 0.04 | |
| Rosettes | Photoreceptorness | 4.50E − 03* (WSRT) |
| Absent | 5.9 ± 0.08 | |
| Present | 6.1 ± 0.04 | |
| Tumor location | Photoreceptorness | 0.02* (WSRT) |
| Central | 6.2 ± 0.06 | |
| Periphery | 6.0 ± 0.09 | |
| Could not determine (full blown) | 6.1 ± 0.04 | |
| Heredity | Photoreceptorness | 0.06 (WSRT) |
| Non-hereditary | 6.1 ± 0.05 | |
| Hereditary | 6.2 ± 0.04 | |
| Uni/multifocal | Photoreceptorness | 0.10 (WSRT) |
| Unifocal | 6.2 ± 0.06 | |
| Multifocal | 6.0 ± 0.05 | |
| RE-classification | Photoreceptorness | 0.21 (LBL) |
| III | 6.3 ± 0.06 | |
| IV | 6.4 (only 1 tumor) | |
| V | 6.1 ± 0.04 | |
| Optic nerve invasion | Photoreceptorness | 0.48 (LBL) |
| None | 6.2 ± 0.05 | |
| Pre-laminar | 6.2 ± 0.07 | |
| Intra-laminar | 6.1 ± 0.09 | |
| Post-lamina | 6.1 ± 0.12 | |
| ABC-classification | Photoreceptorness | 0.57 (LBL) |
| B | 6.0 ± 0.15 | |
| C | 6.3 ± 0.07 | |
| D | 6.1 ± 0.06 | |
| E | 6.2 ± 0.05 | |
| Choroid invasion | Photoreceptorness | 0.70 (LBL) |
| None | 6.1 ± 0.04 | |
| Focal | 6.1 ± 0.11 | |
| Extensive | 6.3 (only 1 tumor) | |
| Gender | Photoreceptorness | 0.71 (WSRT) |
| Female | 6.1 ± 0.05 | |
| Male | 6.1 ± 0.05 |
For other characteristics, the level of photoreceptorness was calculated (Table 2). In agreement with young age, tumors from bilateral patients showed higher photoreceptorness than tumors from unilateral patients (p-value = 4.01E − 03). There was no significant difference in photoreceptorness between hereditary and non-hereditary patients (p-value = 0.06). Photoreceptorness was positively associated with the degree of differentiation, as to be expected. Consistently, rosettes (in particular Flexner–Wintersteiner rosettes) which are a characteristic of photoreceptor differentiation (Dickson et al., 1976, Gonzalez-Fernandez et al., 1992), were more often seen in tumors with high photoreceptorness than in tumors with low photoreceptorness (rosettes p = 4.50E − 03, Flexner–Wintersteiner rosettes p = 2.18E − 03). Tumors located in the central part of the retina (close to the macula) had higher photoreceptorness than tumors located in the periphery (p = 0.02).
We could not detect a significant association between the histopathological risk factor optic nerve/choroid invasion and photoreceptorness, possibly due to low numbers of invasion in our cohort, with only 9/76 (12%) of tumors showing post-laminar optic nerve invasion and 1/76 (2%) showing extensive choroid invasion. Also, different stages of disease, as defined by the International intra-ocular retinoblastoma ABC-classification and the Reese Ellsworth classification did not correspond to a specific gene expression profile.
Tested variables are sorted by statistical significance. FW = Flexner − Wintersteinter, RE = Reese − Elsworth, WSRT = Wilcoxon signed rank test, WRST—Wilcoxon rank sum test, LBL = linear-by-linear, KWRST = Kruskal–Wallis rank sum test, SEM = standard error of the mean. * indicates significant (p-value < 0.05).
3.5. Loss of Photoreceptorness is Related to Drug Sensitivity ex vivo, in Particular Actinomycin D
To determine whether photoreceptorness was associated with drug sensitivity, we used data from a study in which the ex vivo drug sensitivities of retinoblastoma specimens from our cohort were determined (Schouten-van Meeteren et al., 2001). These data were complemented by drug sensitivity data that were not reported before. Data were available for 30/72 (41.7%) retinoblastoma samples. MTT assays were performed using fresh tumor material from enucleated eyes and median lethal concentrations (LC50 values) were determined from dose–response curves of twelve chemotherapeutic drugs based on triplicates relative to untreated controls. The number of retinoblastoma samples for which an LC50 value could be determined differed between the 12 tested drugs due to sample availability and ranged from N = 12 for 6-thioguanine to N = 29 for carboplatin, cisplatin, cytarabine, doxorubicin, ifosfamide and vincristine. Linear regression of photoreceptorness was performed on log10-transformed LC50-values (Fig. 6). To test whether tumors with low photoreceptorness in general were more chemosensitive, the slopes of the association between photoreceptorness and log-transformed LC50 values were calculated. For 10/12 (83.3%) drugs, the slope was positive. In case photoreceptorness would have been unrelated to chemosensitivity in general, one would expect that the slopes have had a similar chance to be positive as well as negative. To test this, the exact binomial test (also known as sign-test) was used. This test indicated that it is unlikely (p-value = 0.02) that the degree of photoreceptorness is not related to chemosensitivity. The log-transformed LC50s of thiotepa (slope = 0.63, p-value = 7.92E − 04), actinomycin D (slope = 2.23, p-value = 8.28E − 03), doxorubicin (slope = 0.64, p-value = 0.026) and carboplatin (slope = 0.41, p = 0.034) showed a significant linear association with photoreceptorness. In the case of actinomycin D the slope of the linear association was steepest and therefore indicative of the most pronounced effect: a reduction of the mean photoreceptor expression signature by one unit increased the potency of actinomycin D more than 100-fold (10 ^ 2.23 = 169).
Fig. 6.

Photoreceptorness in relation to drug sensitivities. Relation between photoreceptorness and drug sensitivity determined by ex vivo MTT-assays. For each of twelve tested drugs, the photoreceptorness is given on the x-axis and log10-transformed LC50 values on the y-axis. Drugs are sorted by the significance of slope tests for regression between photoreceptorness and LC50-values.
3.6. Validation of Differential Expression Signatures by an Independent Expression Profiling Dataset
To validate the expression differences between retinoblastoma samples in our cohort, we compared our results with an independent publicly available primary retinoblastoma gene expression dataset (Gene expression omnibus, GSE29686, N = 55) (McEvoy et al., 2011). Unsupervised hierarchical clustering subdivided the McEvoy cohort into 4 separate Ward's retinoblastoma clusters (Fig. S5A). Detailed inspection of cell cycle markers, rod and cone photoreceptor markers and immune cell markers suggested that Ward's retinoblastoma cluster 3 could reflect samples that contained a large proportion of normal-retina cells (Fig. S5D). Ward's retinoblastoma cluster 4 displayed high expressions of immune cell markers, indicative of contamination with blood cells or tumor infiltrating lymphocytes. Ward's retinoblastoma clusters 1 and 2 both displayed high expressions of cell cycle makers, but only Ward's retinoblastoma cluster 2 showed high gene expression of cone photoreceptor markers (Fig. S5D). Therefore, Ward's retinoblastoma cluster 3 (alleged normal-retina samples) and Ward's retinoblastoma cluster 4 (immune/blood cell infiltrates) were excluded from further analysis and differential expression analysis was restricted to the remaining Ward's retinoblastoma clusters 1 and 2. Strikingly, 2887 genes were differentially expressed between groups 1 and 2 (Supplementary Fig. 6, Differential gene expression testing between Ward's cluster 1 and 2 in McEvoy data set). Gene ontology enrichment analysis of the identified differentially expressed genes yielded results (Table S7) very comparable with our Ward's retinoblastoma cluster 1 versus cluster 2 comparison (Table S4). Similar to our data, a gradual loss of a gene expression signature highly enriched for photoreceptor ontologies (Fig. S5, top branch of the gene dendrogram) correlated with gradual increases of genes related to M-phase, mRNA and ribosome synthesis (Fig. S5, bottom branch of the gene dendrograms). Furthermore, genome-wide fold-changes of the McEvoy cohort were compared with fold-changes of our cohort (Fig. S7). In total, 18,465/19,488 (94.8%) genes could be matched and showed a strong positive correlation (Pearson correlation = 0.77, linear regression slope = 0.69, p-value < 2.2E − 16) demonstrating the high concordance between both datasets. These results show that in both datasets the retinoblastoma tumor cohort was not homogeneous with respect to gene expression and that similar expression differences were identified in independent datasets.
4. Discussion
Our study showed that expression of a photoreceptor gene signature was associated with differentiation and inversely correlated with an M-phase and mRNA/ribosome synthesis gene signature, tumor volume and age at diagnosis. The continuous rather than dichotomous loss of photoreceptorness in our retinoblastoma cohort may have been caused by a gradual dedifferentiation of all tumor cells simultaneously or by the emergence of dedifferentiated subclones that could gradually overgrow the original differentiated tumor.
In a retrospective histopathological review on 297 primary enucleated eyes, the inverse relation between photoreceptor-related differentiation and age at enucleation was also described (Eagle, 2009). In this review examples of eosinophilic areas of photoreceptor differentiation and basophilic undifferentiated cells within the same tumor are shown. Apparently, differentiated and undifferentiated cells can co-exist within the same tumor. Furthermore, SCNA amplitudes of chromosomes/chromosomal arms were always below 1 copy (data not shown), indicative of intra-tumoral heterogeneity. We therefore could envisage that the mean expression of the photoreceptor gene signature in a given tumor was determined by the ratio of differentiated cells and undifferentiated cells. High expression of genes involved in mitosis observed in undifferentiated tumors is in agreement with previous observations of many mitotically active cells in undifferentiated tumor areas (Eagle, 2009). This suggests that higher expression of the M-phase and mRNA/ribosome synthesis signature could have been a result of lower proportions of more differentiated and higher proportions of less differentiated cells.
It has been suggested that differentiated areas in retinoblastomas are benign precursor lesions of the undifferentiated areas (Dimaras et al., 2008). This was based on the observation that differentiated eosinophilic areas only had bi-allelic inactivation of RB1, while adjacent basophilic undifferentiated areas had additional genetic lesions that probably caused tumor progression. A progression model where benign differentiated precursor cells can progress and expand to malignant retinoblastoma cells might explain the strong correlation of photoreceptorness with tumor volumes. It is uncertain why larger and less differentiated tumors with more SCNA were diagnosed at later age. Possibly, in case RB1 inactivation occurred later in life, the affected cone precursors were in a more mature, less proliferative state. Therefore, neoplastic lesions that arose from semi-matured cone precursors might be less proliferative than those arising from more immature cone precursors. When additional genetic lesions (e.g. SCNA) occur after late RB1 inactivation, the resulting highly proliferative cells may quickly overgrow the still small precursor lesion ultimately leading to tumors with relatively few differentiated cells and many undifferentiated cells.
In addition, it could be that there was a diagnosis delay for tumors that were initiated later due to tumor localization at the periphery (Abramson and Gombos, 1996, Brinkert et al., 1998). Possibly, both explanations are true and in combination explain the observed gene expression patterns and their relation with clinical and histopathological variables.
In concordance with a progression model where genetic alterations accumulate after loss of RB1 and cause malignant transformation, increased frequencies of common SCNA at 1q, 2p (in particular the minimal region of gain at 2p24.3 harboring MYCN), 6p, and 16q were associated with loss of photoreceptorness (Fig. 5).
RNA signatures have been determined in several distinct retinoblastoma cohorts (Chakraborty et al., 2007, Ganguly and Shields, 2010, McEvoy et al., 2011, Kapatai et al., 2013). Our results are in agreement with a recent smaller-scale study (Kapatai et al., 2013), although our interpretation of the identified differential expression signatures differs. Kapatai et al., similar to the first steps in our study, used unsupervised hierarchical clustering on genome-wide expression estimates to stratify 23 retinoblastoma samples. Similar to our Ward's retinoblastoma clusters 1, 2 and 3, Kapatai et al. found three retinoblastoma groups including a small (n = 2) retina-like group that had been discarded from further analyses. Explanation for the identified differences in expression was mainly focused on the cell of origin. Kapatai's group 1 tumors were suggested to originate from retinal progenitor cells (RPCs) and group 2 tumors from a cone photoreceptor lineage. However, in a recent paper it was shown that when RB1 was inactivated in retinal cell populations, cone precursor numbers increased, while in RPCs TP53-responsive genes were triggered causing a significant decrease in RPC population (Xu et al., 2014). This suggests that only cone photoreceptor precursors become proliferative subsequent to RB1 loss and are likely the only cells that can transform into retinoblastoma. Furthermore, the authors suggested that RB1-deficient cone precursors form differentiated retinoblastomas that subsequently dedifferentiate and acquire non-cone characteristics, in line with our observations. The study by Kapatai et al. did not discuss the possibility of a tumor progression model where group 1 tumors are advanced stages of group 2 tumors nor did they test the continuity of the differential signatures.
In contrast, McEvoy et al. claimed that all retinoblastomas displayed similar profiles, with co-expression of multiple normally incompatible developmental pathways, also suggesting a retinal progenitor cell of origin (McEvoy et al., 2011). The authors concluded that their retinoblastoma cohort was homogeneous, based on a principle component analysis where they observed that the majority of retinoblastomas clustered around a central core. However, a detailed inspection of the raw data (Gene expression omnibus series GSE29686) revealed that also in their cohort, unsupervised clustering identified retinoblastoma clusters with gene expression differences similar to Kapatai's and our study. In addition to the three clusters found by Kapatai et al. and our study, a fourth cluster consisting of 8 samples was identified with high expression of lymphocyte markers, suggesting tumor infiltration with normal lymphocytes. Expression of genes related to the immune system was also found in our dataset (Table 2, gene cluster 2), although in lower quantities and amplitude than in the McEvoy dataset. This gene signature could possibly relate to the microenvironment that might play an important role in tumorigenesis. However, we have previously detected similar lymphocyte infiltration in breast cancer expression profiles (Massink et al., 2015). When samples with unclear origin (“normal retina” and “lymphocyte”) were discarded, differential gene signatures were identified very comparable with our study. Similar to our study, tumors with high expression of a photoreceptor signature showed low expression of genes involved in M-phase, mRNA and ribosome synthesis, also signifying a progression model. In conclusion, similar differential signatures could be detected in three distinct cohorts with comparable relations to clinical characteristics.
The RNA signatures were also related to data from ex vivo drug sensitivity assays for twelve different drugs, obtained from ex vivo drug assays of fresh retinoblastoma specimens of our cohort. Melphalan had not been included, because when the experiments were performed, the emphasis in the clinic was on other drugs. However we did include other alkylating agents, such as carboplatin, cisplatin, ifosfamide and thiotepa. For 10/12 (83.3%) chemotherapeutics, tumors with low photoreceptorness were more sensitive (although the association was not statistically significant for each individual drug) than tumors with high photoreceptorness (p-value = 0.02). This suggests that in general undifferentiated retinoblastoma is more chemosensitive compared with differentiated retinoblastoma, at least ex vivo. Assuming that low photoreceptorness is a surrogate marker for a high proportion of undifferentiated mitotically active and highly proliferative cells, this hypothesis seems plausible since chemotherapeutics act on proliferating cells. Furthermore, it has long been recognized that photoreceptor differentiation is more common in eyes enucleated after radiotherapy or chemotherapy because the well-differentiated part of the tumor is relatively radio- or chemoresistant (Ts'o et al., 1970). More recently, it was observed that retinoblastomas containing cavitary spaces, indicative of well-differentiated retinoma areas, did not show a substantial decrease in size after chemotherapy (Mashayekhi et al., 2005).
The association between photoreceptorness and drug sensitivity is particularly clear in the case of actinomycin D, a drug that binds to DNA and inhibits transcription by interfering with RNA elongation (Sobell, 1985). The actinomycin D sensitivity of tumors with low photoreceptorness, and thus high expression of M-phase and mRNA/ribosome synthesis genes, could possibly be explained by the particular sensitivity of ribosomal RNA synthesis to actinomycin D treatment.
Yet, the drug sensitivity data have to be interpreted with great caution, since it remains to be determined to which extent the ex vivo MTT-assays can predict therapy response. Furthermore, a significant association between photoreceptorness and drug sensitivity only means that there is statistical evidence for a variance in drug response. This does not necessarily mean that this drug is the best alternative for those patients. In case a drug would be effective for all retinoblastoma patients, no significant relation between drug sensitivity and photoreceptorness would be detected.
Based on our comprehensive study of a relatively large cohort of retinoblastoma cases, we provide evidence for a tumor progression model in which early well-differentiated lesions advance to undifferentiated lesions with higher proliferative capacity. In this model, variability in gene expression of RB1−/− retinoblastomas can be best explained by variability in photoreceptor differentiation and tumor progression. Tumor progression could be driven by SCNA, since tumors with low photoreceptorness and poor differentiation grades showed high frequencies of SCNA.
The following are the supplementary data related to this article.
Dendrogram of transcriptome-wide unsupervised hierarchical clustering of all primary retinoblastoma samples (N = 76) by Ward's, average-linkage, McQuitty and complete-linkage clustering of inverse Pearson correlations. Leafs represent individual tumors, colored by the Ward's clusters; cluster 1 in red, cluster 2 in red, cluster 3 in blue. The RB1+/+MYCNA tumors are indicated by asterisks.
Validation of gene expression differences by Taqman relative quantification of gene expression (GAPDH as internal control). Top: log2-transformed relative gene expression of CCNE1, CNGB1 and ARR3 compared with log2-transformed micro-array gene expression estimates. Bottom: boxplots of Taqman relative gene expression stratified by the Ward's clusters; cluster 1 in red, cluster 2 in red, cluster 3 in blue. The RB1+/+MYCNA tumors are indicated by arrows.
Examples of differentially expressed genes between RB1+/+MYCNA and RB1−/− tumors. Differential expression analyses were performed between RB1+/+MYCNA and RB1−/− tumors and for several highly significant (in top 50 of Table S2) cell cycle related genes the gene expression estimates are plotted for each tumor. Samples in red and green were initially classified as Ward's retinoblastoma clusters 1 and 2 respectively.
Examples of differentially expressed genes between RB1+/+MYCNA and RB1−/− tumors. Differential expression analyses were performed between RB1+/+MYCNA and RB1−/− tumors and for several highly significant (in top 50 of Table S2) cell cycle related genes the gene expression estimates are plotted for each tumor. Samples in red and green were initially classified as Ward's retinoblastoma clusters 1 and 2 respectively.
For each tumor, the mean gene expression was calculated for all three gene signatures identified in Fig. 2. Photoreceptorness and M-phase and mRNA and ribosome synthesis signatures are highly correlated (R2 = 0.90). The immune signature is less strongly correlated with photoreceptorness (R2 = 0.29) or M-phase and mRNA and ribosome synthesis (R2 = 0.32) signatures.
(A) Dendrogram of transcriptome-wide unsupervised hierarchical clustering of all McEvoy primary retinoblastoma samples (N = 55). The dendrogram is pruned at k = 4 yielding four McEvoy groups: group 1 in red, group 2 in green, group 3 in blue and group 4 in purple. (B) Three-dimensional scatterplot of the first three principal components of all McEvoy groups colored by UHC sample classification. (C) Three-dimensional scatterplot of the first three principal components of only McEvoy groups 1 and 2 colored by UHC sample classification. (D) Expression box plots for McEvoy groups 1–4 of 5 cell cycle markers (E2F1, E2F2, E2F3, CCNE1, PCNA, top row), 5 rod photoreceptor markers (RHO, SAG, CNGB1, PDE6G, CNGA1, 2nd row), 5 cone photoreceptor markers (PDE6C, PDE6H, GNAT2, OPN1SW, ARR3, 3rd row), and 5 immune cell markers (CD2, CD4, CD33, CD34, CD14, bottom row). Group 1 is indicated in red, group 2 in green, group 3 in blue, and group 4 in purple.
Hierarchical clustering of differentially expressed genes (N = 2887) between McEvoy Ward's clusters 1 and 2. Sample properties are indicated at the top with colored bars; top bar: McEvoy Ward's cluster 1 in red, cluster 2 in green, bottom bar: age at diagnosis mapped to a continuous green-to-red color scale where green means young and red means old (gray is missing data). The heat map represents standardized expression estimates mapped to a continuous green-to-red color scale where green means low expression and red means high expression.
Differential gene expression results (log2-fold change) between Ward's retinoblastoma clusters 1 and 2 for our study (x-axis) and McEvoy-study (y-axis). Pearson correlation in log2-fold changes between the independent datasets is 0.77, linear regression slope = 0.69, p-value < 2.2E–16.
Funding
The research was supported by grants from Stichting VUmc CCA (VU University Medical Center Cancer Center Amsterdam Foundation) grant number CCA20083-05 and Stichting KIKA (Dutch Children Cancer-Free Foundation) grant number 98. The involvement of the funding bodies was solely financial. All authors declared that they have no conflicts of interest.
Acknowledgments
We thank all members of the VU University Medical Center Retinoblastoma team for feedback and discussions and Dr. Annemarie H. van der Hout from the University Medical Center Groningen for providing RB1 mutation status.
Contributor Information
Irsan E. Kooi, Email: ei.kooi@vumc.nl.
Berber M. Mol, Email: b.mol@vumc.nl.
Annette C. Moll, Email: a.moll@vumc.nl.
Paul van der Valk, Email: p.vandervalk@vumc.nl.
Marcus C. de Jong, Email: mc.dejong@vumc.nl.
Pim de Graaf, Email: p.degraaf@vumc.nl.
Antoinette Y.N. Schouten-van Meeteren, Email: a.y.n.schouten@amc.uva.nl.
Hanne Meijers-Heijboer, Email: h.meijers-heijboer@vumc.nl.
Gertjan L. Kaspers, Email: gjl.kaspers@vumc.nl.
Hein te Riele, Email: h.t.riele@nki.nl.
Jacqueline Cloos, Email: j.cloos@vumc.nl.
Josephine C. Dorsman, Email: jc.dorsman@vumc.nl.
References
- Abramson D.H., Gombos D.S. The topography of bilateral retinoblastoma lesions. Retina (Philadelphia, Pa.) 1996;16(3):232–239. doi: 10.1097/00006982-199616030-00009. [DOI] [PubMed] [Google Scholar]
- Benjamini Yoav, Hochberg Y. Controlling the False Discovery rate: A Practical and Powerful Approach to Multiple Testing. J. R. Stat. Soc. Ser. B Methodol. (Methodological) 1995;57(1):289–300. [Google Scholar]
- Brinkert A.W. Distribution of tumors in the retina in hereditary retinoblastoma patients. Ophthalmic Genet. 1998;19(2):63–67. doi: 10.1076/opge.19.2.63.2320. [DOI] [PubMed] [Google Scholar]
- Chakraborty S. Identification of genes associated with tumorigenesis of retinoblastoma by microarray analysis. Genomics. 2007;90:344–353. doi: 10.1016/j.ygeno.2007.05.002. [DOI] [PubMed] [Google Scholar]
- Dickson D.H., Ramsey M.S., Tonus J.G. Synapse formation in retinoblastoma tumours. Br. J. Ophthalmol. 1976;60:371–375. doi: 10.1136/bjo.60.5.371. [DOI] [PMC free article] [PubMed] [Google Scholar]
- Dimaras H. Loss of RB1 induces non-proliferative retinoma: increasing genomic instability correlates with progression to retinoblastoma. Hum. Mol. Genet. 2008;17(10):1363–1372. doi: 10.1093/hmg/ddn024. [DOI] [PubMed] [Google Scholar]
- Eagle R.C. High-Risk Features and Tumor Differentiation in Retinoblastoma. Arch. Patol. Clin. Med. 2009;133:1203–1209. doi: 10.5858/133.8.1203. [DOI] [PubMed] [Google Scholar]
- Ganguly A., Shields C.L. Differential gene expression profile of retinoblastoma compared to normal retina. Mol. Vis. 2010;16(1090-0535 (Electronic)):1292–1303. [PMC free article] [PubMed] [Google Scholar]
- Gautier L. affy--analysis of Affymetrix GeneChip data at the probe level. Bioinformatics (Oxford, England) 2004;20(3):307–315. doi: 10.1093/bioinformatics/btg405. [DOI] [PubMed] [Google Scholar]
- Gonzalez-Fernandez F. Expression of developmentally defined retinal phenotypes in the histogenesis of retinoblastoma. Am. J. Pathol. 1992;141(2):363–375. [PMC free article] [PubMed] [Google Scholar]
- Herzog S. Marked differences in unilateral isolated retinoblastomas from young and older children studied by comparative genomic hybridization. Hum. Genet. 2001;108(2):98–104. doi: 10.1007/s004390000450. [DOI] [PubMed] [Google Scholar]
- Kapatai G. Gene expression profiling identifies different sub-types of retinoblastoma. Br. J. Cancer. 2013;109(2):512–525. doi: 10.1038/bjc.2013.283. [DOI] [PMC free article] [PubMed] [Google Scholar]
- Lillington D.M. Comparative genomic hybridization of 49 primary retinoblastoma tumors identifies chromosomal regions associated with histopathology, progression, and patient outcome. Genes Chromosomes Cancer. 2003;36(2):121–128. doi: 10.1002/gcc.10149. [DOI] [PubMed] [Google Scholar]
- Linn Murphree A. Intraocular retinoblastoma: the case for a new group classification. Ophthalmol. Clin. N. Am. 2005;18(1):41–53. doi: 10.1016/j.ohc.2004.11.003. (viii) [DOI] [PubMed] [Google Scholar]
- Mashayekhi A. Cavitary changes in retinoblastoma: relationship to chemoresistance. Ophthalmology. 2005;112(6):1145–1150. doi: 10.1016/j.ophtha.2005.01.041. [DOI] [PubMed] [Google Scholar]
- Massink M.P.G. Proper genomic profiling of (BRCA1-mutated) basal-like breast carcinomas requires prior removal of tumor infiltrating lymphocytes. Mol. Oncol. 2015;9(4):877–888. doi: 10.1016/j.molonc.2014.12.012. [DOI] [PMC free article] [PubMed] [Google Scholar]
- McEvoy J. Coexpression of normally incompatible developmental pathways in retinoblastoma genesis. Cancer Cell. 2011;20(2):260–275. doi: 10.1016/j.ccr.2011.07.005. [DOI] [PMC free article] [PubMed] [Google Scholar]
- Mol B.M. High resolution SNP array profiling identifies variability in retinoblastoma genome stability. Genes Chromosomes Cancer. 2014;53(1):1–14. doi: 10.1002/gcc.22111. [DOI] [PubMed] [Google Scholar]
- Reese A.B., Ellsworth R.M. The evaluation and current concept of retinoblastoma therapy. Trans. Am. Acad. Ophthalmol. Otolaryngol. 1963;67:164–172. [PubMed] [Google Scholar]
- Rushlow D.E. Characterisation of retinoblastomas without RB1 mutations: genomic, gene expression, and clinical studies. Lancet Oncol. 2013;14(4):327–334. doi: 10.1016/S1470-2045(13)70045-7. [DOI] [PubMed] [Google Scholar]
- Sampieri K. Array comparative genomic hybridization in retinoma and retinoblastoma tissues. Cancer Sci. 2009;100(3):465–471. doi: 10.1111/j.1349-7006.2008.01070.x. [DOI] [PMC free article] [PubMed] [Google Scholar]
- Schouten-van Meeteren A.Y. Histopathologic features of retinoblastoma and its relation with in vitro drug resistance measured by means of the MTT assay. Cancer. 2001;92(11):2933–2940. [PubMed] [Google Scholar]
- Sharon D. Profile of the genes expressed in the human peripheral retina, macula, and retinal pigment epithelium determined through serial analysis of gene expression (SAGE) Proc. Natl. Acad. Sci. U. S. A. 2002;99(1):315–320. doi: 10.1073/pnas.012582799. [DOI] [PMC free article] [PubMed] [Google Scholar]
- Smith G.K. limma: Linear Models for Microarray Data. In: Gentleman S., Carey R., Huber V., Irizarry W., Dudoit R., editors. Bioinformatics and Computational Biology Solutions Using R and Bioconductor. Springer; 2005. pp. 397–420. [Google Scholar]
- Sobell H.M. Actinomycin and DNA transcription. Proc. Natl. Acad. Sci. 1985;82(16):5328–5331. doi: 10.1073/pnas.82.16.5328. [DOI] [PMC free article] [PubMed] [Google Scholar]
- Staaf J. Normalization of Illumina Infinium whole-genome SNP data improves copy number estimates and allelic intensity ratios. BMC Bioinformatics. 2008;9:409. doi: 10.1186/1471-2105-9-409. [DOI] [PMC free article] [PubMed] [Google Scholar]
- Thériault B.L. The genomic landscape of retinoblastoma: a review. Clin. Experiment Ophthalmol. 2014;42:33–52. doi: 10.1111/ceo.12132. [DOI] [PMC free article] [PubMed] [Google Scholar]
- Ts’o M.O. A cause of radioresistance in retinoblastoma: photoreceptor differentiation. Trans. Am. Acad. Opthalmol. Otolaryngol. 1970;74(5):959–969. [PubMed] [Google Scholar]
- Van de Wiel M., Wieringen W.N. Van. CGHregions: dimension reduction for array CGH data with minimal information loss. Cancer Informat. 2007;3:55–63. [PMC free article] [PubMed] [Google Scholar]
- Van de Wiel M. CGHcall: calling aberrations for array CGH tumor profiles. Bioinformatics (Oxford, England) 2007;23(7):892–894. doi: 10.1093/bioinformatics/btm030. [DOI] [PubMed] [Google Scholar]
- Van der Wal J.E. Comparative genomic hybridisation divides retinoblastomas into a high and a low level chromosomal instability group. J. Clin. Pathol. 2003;56(1):26–30. doi: 10.1136/jcp.56.1.26. [DOI] [PMC free article] [PubMed] [Google Scholar]
- Van Meerloo J., Kaspers G.J.L., Cloos J. Cell sensitivity assays: the MTT assay. Methods Mol. Biol. (Clifton, N.J.) 2011;731:237–245. doi: 10.1007/978-1-61779-080-5_20. [DOI] [PubMed] [Google Scholar]
- Xu X.L. Rb suppresses human cone-precursor-derived retinoblastoma tumours. Nature. 2014;514:385–388. doi: 10.1038/nature13813. [DOI] [PMC free article] [PubMed] [Google Scholar]
- Zielinski B. Detection of chromosomal imbalances in retinoblastoma by matrix-based comparative genomic hybridization. Genes Chromosomes Cancer. 2005;43(3):294–301. doi: 10.1002/gcc.20186. [DOI] [PubMed] [Google Scholar]
Associated Data
This section collects any data citations, data availability statements, or supplementary materials included in this article.
Supplementary Materials
Dendrogram of transcriptome-wide unsupervised hierarchical clustering of all primary retinoblastoma samples (N = 76) by Ward's, average-linkage, McQuitty and complete-linkage clustering of inverse Pearson correlations. Leafs represent individual tumors, colored by the Ward's clusters; cluster 1 in red, cluster 2 in red, cluster 3 in blue. The RB1+/+MYCNA tumors are indicated by asterisks.
Validation of gene expression differences by Taqman relative quantification of gene expression (GAPDH as internal control). Top: log2-transformed relative gene expression of CCNE1, CNGB1 and ARR3 compared with log2-transformed micro-array gene expression estimates. Bottom: boxplots of Taqman relative gene expression stratified by the Ward's clusters; cluster 1 in red, cluster 2 in red, cluster 3 in blue. The RB1+/+MYCNA tumors are indicated by arrows.
Examples of differentially expressed genes between RB1+/+MYCNA and RB1−/− tumors. Differential expression analyses were performed between RB1+/+MYCNA and RB1−/− tumors and for several highly significant (in top 50 of Table S2) cell cycle related genes the gene expression estimates are plotted for each tumor. Samples in red and green were initially classified as Ward's retinoblastoma clusters 1 and 2 respectively.
Examples of differentially expressed genes between RB1+/+MYCNA and RB1−/− tumors. Differential expression analyses were performed between RB1+/+MYCNA and RB1−/− tumors and for several highly significant (in top 50 of Table S2) cell cycle related genes the gene expression estimates are plotted for each tumor. Samples in red and green were initially classified as Ward's retinoblastoma clusters 1 and 2 respectively.
For each tumor, the mean gene expression was calculated for all three gene signatures identified in Fig. 2. Photoreceptorness and M-phase and mRNA and ribosome synthesis signatures are highly correlated (R2 = 0.90). The immune signature is less strongly correlated with photoreceptorness (R2 = 0.29) or M-phase and mRNA and ribosome synthesis (R2 = 0.32) signatures.
(A) Dendrogram of transcriptome-wide unsupervised hierarchical clustering of all McEvoy primary retinoblastoma samples (N = 55). The dendrogram is pruned at k = 4 yielding four McEvoy groups: group 1 in red, group 2 in green, group 3 in blue and group 4 in purple. (B) Three-dimensional scatterplot of the first three principal components of all McEvoy groups colored by UHC sample classification. (C) Three-dimensional scatterplot of the first three principal components of only McEvoy groups 1 and 2 colored by UHC sample classification. (D) Expression box plots for McEvoy groups 1–4 of 5 cell cycle markers (E2F1, E2F2, E2F3, CCNE1, PCNA, top row), 5 rod photoreceptor markers (RHO, SAG, CNGB1, PDE6G, CNGA1, 2nd row), 5 cone photoreceptor markers (PDE6C, PDE6H, GNAT2, OPN1SW, ARR3, 3rd row), and 5 immune cell markers (CD2, CD4, CD33, CD34, CD14, bottom row). Group 1 is indicated in red, group 2 in green, group 3 in blue, and group 4 in purple.
Hierarchical clustering of differentially expressed genes (N = 2887) between McEvoy Ward's clusters 1 and 2. Sample properties are indicated at the top with colored bars; top bar: McEvoy Ward's cluster 1 in red, cluster 2 in green, bottom bar: age at diagnosis mapped to a continuous green-to-red color scale where green means young and red means old (gray is missing data). The heat map represents standardized expression estimates mapped to a continuous green-to-red color scale where green means low expression and red means high expression.
Differential gene expression results (log2-fold change) between Ward's retinoblastoma clusters 1 and 2 for our study (x-axis) and McEvoy-study (y-axis). Pearson correlation in log2-fold changes between the independent datasets is 0.77, linear regression slope = 0.69, p-value < 2.2E–16.