

Abstract
The nucleus accumbens is highly heterogeneous, integrating regionally distinct afferent projections and accumbal interneurons, resulting in diverse local microenvironments. Dopamine (DA) neuron terminals similarly express a heterogeneous collection of terminal receptors that modulate DA signaling. Cyclic voltammetry is often used to probe DA terminal dynamics in brain slice preparations; however, this method traditionally requires electrical stimulation to induce DA release. Electrical stimulation excites all of the neuronal processes in the stimulation field, potentially introducing simultaneous, multi-synaptic modulation of DA terminal release. We used optogenetics to selectively stimulate DA terminals and used voltammetry to compare DA responses from electrical and optical stimulation of the same area of tissue around a recording electrode. We found that with multiple pulse stimulation trains, optically stimulated DA release increasingly exceeded that of electrical stimulation. Furthermore, electrical stimulation produced inhibition of DA release across longer duration stimulations. The GABAB antagonist, CGP 55845, increased electrically stimulated DA release significantly more than light stimulated release. The nicotinic acetylcholine receptor antagonist, dihydro-β-erythroidine hydrobromide, inhibited single pulse electrically stimulated DA release while having no effect on optically stimulated DA release. Our results demonstrate that electrical stimulation introduces local multi-synaptic modulation of DA release that is absent with optogenetically targeted stimulation.
Keywords: acetylcholine, dopamine, GABA, nucleus accumbens, optogenetics, voltammetry
Mesolimbic dopamine (DA) signaling has been suggested to underlie numerous processes including reward learning, motivated behavior and addiction, prompting extensive investigation into the mechanisms that regulate DA signaling. Within the nucleus accumbens (NAc), DA axons branch to provide extensive innervation with signaling occurring primarily via volume transmission (fluxes in extracellular DA tone); therefore, much attention has focused on the local regulation of DA terminal release and uptake. Fast scan cyclic voltammetry allows detection of extracellular DA levels with rapid temporal sensitivity, providing insights into DA signaling dynamics. Voltammetry can be combined with local stimulation of the NAc in brain slices to specifically measure DA terminal properties and how they are altered following various manipulations (Mateo et al. 2005; Calipari et al. 2014; Rose et al. 2013; Ferris et al. 2014; Siciliano et al. 2014; Yorgason et al. 2014). However, even in a reduced preparation such as accumbal slices ex vivo, DA signaling is not examined in isolation. For example, ex vivo voltammetry studies typically use electrical stimulation of the tissue to induce action potential dependent DA release. This method lacks specificity in heterogenous tissue, resulting in excitation of all cell types in the stimulation field. Optogenetics allows direct, selective activation of the terminal fields which belong to the ventral tegmental area (VTA)-to-NAc projections, making it possible to ask the question of how traditional electrically stimulated DA release in accumbal slices is different from selective stimulation of the DA terminals that emerge from the VTA.
The NAc is highly heterogeneous, containing afferent terminals from glutamatergic, serotonergic, dopaminergic, and GABAergic projections as well as innervation from local GABAergic and cholinergic interneurons (Zhou et al. 2001; Tepper and Bolam 2004). Adding to this complexity in neurotransmitter release is the fact that DA terminals express a diversity of heteroreceptors, including metabotropic glutamate receptors, GABAB receptors, nicotinic acetylcholine receptors (nAChR), kappa opioid receptors, and others. Each of these receptor types modulates DA terminal release (Schlöosser et al. 1995; Zhou et al. 2001; Schmitz et al. 2002; Zhang and Sulzer 2003). For example, accumulating evidence suggests a particularly prominent regulation of presynaptic DA terminals by acetylcholine (Rice and Cragg 2004; Zhang and Sulzer 2004), including a mechanism by which synchronous excitation of cholinergic interneurons was sufficient to evoke DA release from unstimulated DA terminals (Cachope et al. 2012; Threlfell et al. 2012), further demonstrating the impact of the local environment on DA terminal release.
Electrical stimulation results in the depolarization of all axonal processes, dendrites and cell bodies in the stimulation field. This results in a cumulative regulation of DA release by introducing the release of diverse neurotransmitters and numerous mechanisms for modulation of presynaptic DA terminals. Concurrent modulation in this manner represents a divergence from normal physiology because in the intact brain release of transmitters from the different regional projections to the NAc are likely to be temporally distinct, thus, total synchronous excitation is unlikely to occur. Often, rapid multi-pulse stimulations (stimulation trains) are applied to slices to induce DA release representative of burst activity in the VTA. Controlling the activity of non-dopaminergic neurons is especially crucial when conducting experiments utilizing stimulation trains because the duration of stimulation is sufficient to activate metabotropic heteroreceptors on dopaminergic terminals (Phillips et al. 2002) and inhibit DA release.
Our goal in this study was to examine DA release using optogenetic stimulation of DA terminals and compare optical- to electrically stimulated DA release. We hypothesized that electrical stimulation recruits non-dopaminergic processes in the local environment, resulting in a net inhibition of DA release via heteroreceptors on the DA terminals. To stimulate DA release from only the midbrain projection neurons, we injected an adeno-associated virus (AAV) virus expressing channel rhodopsin-2 (ChR2) directed either to the general population of projection neurons or specifically to DA neurons in the VTA of C57Bl/6 mice (Wild type or TH : Cre). Voltammetry was performed on slices containing NAc to assess DA release following local stimulation of terminal fields using optical and electrical stimulation. Here, we characterize the relationship in the profile of DA release resulting from either optical or electrical stimulation, and thus provide continued qualitative analysis of the optogenetic technique. Furthermore, we characterize the differences in release elicited by multi-pulse stimulation trains applied with each stimulation method. To evaluate the potential contribution of non-dopaminergic transmitters on electrically stimulated release, we chose to target the signaling which occurs from local interneurons (GABAergic and cholinergic) which would be concurrently stimulated using electrical stimulation, while being insensitive to optical stimulation. Thus, we blocked GABAergic receptors or nAChR and measured DA release resulting from either electrical or light stimulation of the same area of tissue to gauge the differential modulation of release that occurs due to the method of stimulation.
Materials and methods
Animals
Adult (25–40 g) male C57BL/6J mice (Jackson Laboratories, Bar Harbor, ME, USA) were group housed in the mouse colony until surgery. All animals were maintained according to the National Institutes of Health guidelines and all experimental protocols were approved by the Institutional Animal Care and Use Committee at Wake Forest School of Medicine. Mice were anaesthetized with 100 mg/kg ketamine and 8 mg/kg xylazine and placed in a stereotaxic frame. A custom-made glass micropipette (80 μm outer diameter) was inserted directly above the VTA (coordinates from Bregma in mm: −3.3 AP, ±0.5 ML, −4.3 DV). Individual injections were performed on each side of the midline resulting in bilateral infusion. Microinjections were administered using a Picrospritzer® III Intracellular microinjection dispense system (Parker Hannifin Co., Cleveland, OH, USA) by applying small pulses of pressure (30–40 psi, 50–100 ms duration) to the infusion pipette. Each hemisphere of the VTA was injected with 0.4 μL of purified AAV5 (4 × 10¹² virus molecules/mL; Virus Vector Core, University of North Carolina) coding for hChR2(H134R)-eYFP under control of the Calcium/calmodulin dependent protein kinase IIα (CaMKIIα) promoter, over a period of 20 min, followed by an additional 10 min of non-activity to allow diffusion away from the pipette tip. The pipette was carefully removed, the drilled out holes in the skull were sealed with bone wax and the scalp incision was closed using tissue adhesive. Following surgery, mice were returned to the mouse colony, single housed, and maintained for an average of 67 days (range 28–117 days) to allow incubation and expression of ChR2.
Tyrosine hydroxylase (TH)–internal ribosome entry site–Cre Recombinase knock-in mice on a C57Bl/6J background (TH : Cre) were acquired from Dr Garret Stuber at the University of North Carolina, and were originally obtained from the European Mutant Mouse Archive (EM 00254). Mice were bred in-house, and litters were genotyped to identify males expressing the Cre Recombinase gene. TH : Cre mice were housed, maintained, and surgeries were performed as described above. Adult (25–40 g) male TH : Cre mice were injected with 0.4 μL of a Cre dependent virus rAAV5-DIO-Ef1α-ChR2(H134R)-eYFP (4 × 10¹² virus molecules/mL; Virus Vector Core, University of North Carolina), bilaterally, within the VTA to specifically express ChR2 in TH positive neurons and axons as described previously (Tsai et al. 2009; Adamantidis et al. 2011). Heterogeneous cellular phenotypes exist in the VTA and may express differing levels of TH depending on an individual cells' transmitter profile; however, the ventral midbrain neurons that project to the NAc core are located in the lateral regions of the VTA (Ikemoto 2007). Previous studies have demonstrated a greater than 98% overlap between TH staining and ChR2 expression in these regions, in this mouse model (Tsai et al. 2009; Chaudhury et al. 2013; Stamatakis et al. 2013; Tye et al. 2013). Mice were maintained for a minimum of 28 days following surgery to allow incubation and expression of ChR2.
Histology
Immunohistochemistry was used to verify expression of ChR2 at the site of injection and in axon terminals in the ventral striatum. Mice were anaesthetized with ketamine (100 mg/kg) and xylazine (8 mg/kg) and transcardially perfused with phosphate-buffered saline (PBS) followed by 10% buffered formalin phosphate (Fischer Scientific, Waltham, MA, USA). Brains were then removed, submerged in 10% buffered formalin phosphate for an additional 24–48 h, and subsequently transferred to 30% sucrose in PBS for 72 h. Sections (40 μm) were obtained on a microtome (American Optical Company, Buffalo, NY, USA) and stored in PBS for immunohistochemistry.
Sections were permeablized in 0.3% Triton (Sigma, St Louis, MO, USA) in PBS (PBS-Tx) for 2 h, blocked in 5% normal goat serum (Vector Laboratories, Burlingame, CA, USA) in PBS-Tx, and incubated in primary antibody in the blocking solution for 24–48 h. Primary antibodies include Chicken anti-Green Fluorescent Protein (GFP) (1 μg: 500 μL; Aves Labs, Tigard, OR, USA) and Rabbit anti-TH (1 μg: 1000 μL; Cell Signaling Technology, Danvers, MA, USA). Sections were rinsed and transferred to secondary antibody in blocking solution for 1.5 h. Secondary antibodies include Fluorescein-labeled Goat anti-Chicken IgY (1 μg: 250 μL; Aves labs) and Goat anti-Rabbit Alexa Fluor 594 IgG (1 μg: 250 μL; Molecular Probes, Eugene, OR, USA). Sections were mounted on 1 mm slides with Vectashield (Vector Laboratories) mounting medium and images were obtained with an Olympus BX 51 Microscope (Center Valley, PA, USA) and Optronics Microfire digital camera (Goleta, CA, USA). Images were processed in adobe photoshop. In some images the interpeduncular nucleus was removed for clarity.
Fast scan cyclic voltammetry
Slice preparation and ex vivo voltammetry was done as described previously (Ferris et al. 2012). Briefly, animals were anesthetized with Isoflurane, decapitated, and the brain rapidly removed and cooled in ice-cold, pre-oxygenated (95% O2/5% CO2) artificial cerebral spinal fluid (aCSF) consisting of (in mM): NaCl (126), KCl (2.5), NaH2PO4 (1.2), CaCl2 (2.4), MgCl2 (1.2), NaHCO3 (25), glucose (11), l-ascorbic acid (0.4) and pH was adjusted to 7.4. Multiple coronal slices (300 μm thick) containing the NAc were prepared from each animal with a vibrating tissue slicer (Leica VT1000S; Leica Instruments, Nussloch, Germany). Slices were maintained in oxygenated aCSF at 23°C for > 1 h before transfer to a submersion recording chamber through which 32°C oxygenated aCSF was perfused at a rate of 1 mL/min; an additional 30 min of incubation allowed slices to equilibrate. A carbon fiber microelectrode (100–150 μM length, 7 μM diameter) was placed into the NAc core, extending approximately 100 μM below the surface. Extracellular DA was monitored at the carbon fiber electrode every 100 ms (10 Hz) using fast scan cyclic voltammetry (Wightman et al. 1988) by applying a triangular waveform (−0.4 to +1.2 to −0.4 V vs. Ag/AgCl, 400 V/s).
For electrical stimulation, a stimulating electrode was placed on the surface of the slice in close proximity to the carbon fiber electrode. DA was evoked by an electrical pulse (350 μA, 4 ms duration) applied as a single pulse or as a multi-pulse train (5, 10 and 20 pulses) at a frequency of 20 Hz every 5 min. Optic stimulation was delivered from a 200 μM diameter optic fiber (Thor Labs, Newton, NJ, USA) coupled to a 100 mW, 473 nm diode-pumped, solid-state blue laser (Viasho Technology, Beijing, China) with a VD-IIIA DPSS laser driver. The optic fiber was positioned in the slice bath, above the tissue, and aimed to deliver light to the area of tissue immediately surrounding the recording electrode. DA was evoked by an optical pulse (~ 5 mW, 4 ms duration) applied as a single pulse or as a multi-pulse train (5, 10 and 20 pulses) at a frequency of 20 Hz every 5 min. The electrical stimulator and optical fiber were best positioned to stimulate the same area of tissue around the recording electrode. Switching between electrical and optical stimulation occurred at the computer such that the tissue was not disturbed. For experiments incorporating TH : Cre mice, only optical stimulation of the tissue was performed; the parameters of optical stimulation were identical, as described above.
Once the extracellular DA response to single pulse electrical stimulation was stable (less than 10% variation, not trending up or down, across three successive recordings), baseline electrical pulse train stimulations were performed in series (1, 5, 10, and 20 pulses at 20 Hz), followed by a return to 1 pulse stimulations, with 5 min intervals between stimulations. The same procedure was then repeated using optical stimulation. For pharmacological experiments, 1 and 20 pulse baseline recordings were obtained for electrical followed by optical stimulations. A `return' 1 pulse stimulation always followed a 20 pulse stimulation, and the before and after 1 pulse recordings were averaged obtain the reported 1 pulse value. Once baseline measures were obtained, tetrodotoxin (TTX) (1 μM), R 04-1541 (10 μM), CGP 55845 (10 μM), or dihydro-β-erythroidine hydrobromide (DHβE) (100 nM) was applied to the buffer. Single pulse stimulations occurred every 5 min, alternating electrical and optical stimulations. Following 40 min of incubation in drug, 1 and 20 pulse electrical stimulations, followed by 1 and 20 pulse optical stimulations, were performed. Upon completion of each experiment, recording electrodes were calibrated by recording their response (in current; nA) to DA (3 μM) in aCSF using a flow-injection system. This value was used to convert electrical current to DA concentration.
All voltammetry data were collected and modeled using Demon Voltammetry and Analysis Software (Yorgason et al. 2011). Parameters of evoked levels of DA are determined based on Michaelis–Menten kinetics (Wightman et al. 1988), following standard voltammetric modeling procedures (Ferris et al. 2012).
Data analysis
All statistical analysis was performed using GraphPad Prism statistical software (Version 5; GraphPad Software Inc., La Jolla, CA, USA). Data are presented as means ± SEM. For electrochemistry experiments, `n' refers to a single recording location within a slice (one location per slice), and is expressed as the [number of recordings (slices)/number of animals]. Baseline voltammetry data were analyzed using a two-way anova to determine main effects or interactions. Also, planned comparisons (paired two-tailed t-test) were used for direct comparisons between stimulation types at specific measures (e.g. pulse number or time) as determined a priori. Data obtained after administration of drugs were analyzed using a paired two-tailed t-test for individual comparisons of drug effect versus predrug.
Results
Viral mediated ChR2 expression in VTA and NAc
To achieve optically stimulated DA release in NAc slices we targeted expression of ChR2, under regulation of a CaMKIIα promoter, to the neurons of the VTA. Injection of the viral construct resulted in robust GFP immunolabeled ChR2 expression throughout the VTA (n = 6, Fig. 1a). Specifically, ChR2 expression was co-localized with TH immuno-reactivity within both anterior and posterior portions of VTA. High magnification analysis of individual hemispheres of VTA revealed prominent expression of ChR2 in numerous processes extending within a territory rich in DA neuron soma, indicating successful targeting of the viral injection (Fig. 1b). ChR2 expression could also be seen in a relatively few non-dopaminergic neurons within the target area, which was expected since CaMKIIα expression is not limited to DA neurons within the VTA. The striatum exhibited noticeable ChR2 expression, particularly in the ventral/accumbal target region (Fig. 1c); also extending within the dorsomedial striatum, and generally fading in expression in the dorsolateral region. High magnification (Fig. 1d) revealed ChR2 expression within the dense network of terminal fibers in the striatum, with comparatively little fluorescence in the neighboring cortex.
Fig. 1.

Expression of channelrhodopsin-2 (ChR2)-eYFP in the ventral tegmental area (VTA) and NAc. (a) Coronal midbrain section containing VTA from a virally transfected mouse following an incubation period of 76 days. ChR2-eYFP expression immunolabeled with anti-GFP (green), midbrain dopamine (DA) neurons immunolabelled for tyrosine hydroxylase (TH) (red), and merged overlay showing ChR2-eYFP expression at the site of injection in the VTA. (b) Higher magnification of one hemisphere of VTA showing prominent co-localization of ChR2-eYFP and TH expression. (c) Coronal section of striatum showing expression of ChR2-eYFP in the terminal fields of midbrain projection neurons, including NAc. (d) Higher magnification of the bracketed area in (c) reveals the density of ChR2-eYFP positive terminals in the striatum relative to the neighboring cortex.
Light stimulated DA signals in NAc
Coronal slices containing NAc were examined using voltammetry to measure light stimulated DA release (n = 28 animals). In these experiments we targeted ChR2 expression using the CaMKIIα promotor. To compare light and electrically stimulated release, we positioned the electrical stimulating electrode on the tissue approximately 150 μM from the recording electrode, and the optic fiber in the slice bath approximately 200 μM above the tissue; aiming the light on the area of tissue between the electrical stimulator and the recording electrode. This approach allowed us to alternate between stimulation types without moving the recording electrode or disturbing the tissue. Single pulse light stimulation produced DA signals with a nearly identical shape and duration, and displaying common oxidation/reduction peaks, compared to electrical stimulation of the same tissue (Fig. 2). Light stimulation with 20 pulses (20 Hz) also produced robust DA release with similar profiles to 20 pulse electrical stimulation; however, generally resulting in larger amplitude signals. To further characterize the light stimulated signal, we added Ro 4-1248 (10 μM), a specific and potent inhibiter of vesicular monoamine transporters which, similar to reserpine, depletes vesicular release of DA. Consistent with results from electrical stimulation (Jones et al. 1998), Ro 4-1284 decreased the light-evoked signal with each successive stimulation until the stimulated release was completely abolished within 1 h; including eliminating release from 20 pulse stimulations (Fig. 3, inset). ChR2 are cation channels which have calcium permeability (Nagel et al. 2003). Therefore, optical activation of ChR2 expressed in DA terminal membranes has the potential to trigger transmitter release via aberrant calcium entry into the terminal. To determine if, and to the extent that, light stimulated release was action potential dependent, we applied the sodium channel blocker, TTX (1 μM). TTX eliminated light stimulated DA release within minutes of reaching the tissue (n = 3), using either 1 or 20 pulse stimulations (Fig. 3). Figure 3 shows an example trace in which a 20 pulse light stimulation was completely abolished in the presence of TTX.
Fig. 2.
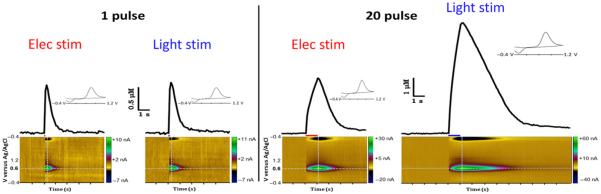
Light stimulated dopamine (DA) release in NAc, ex vivo. Representative voltammetric traces of DA release following electrical or light stimulation of the same location within a slice. Left: Single pulse light stimulation produced DA signals with similar profiles of shape and duration, displaying common oxidation/reduction peaks (inset), and similar representative color plots (below) compared to electrical stimulation of the same tissue. Right: Light stimulation with 20 pulses also produced robust DA release with similar profiles to 20 pulse electrical stimulation; however, generally resulting in larger amplitude signals. Intersecting dotted lines indicate signal location for current versus time plots and current versus voltage (inset) data.
Fig. 3.
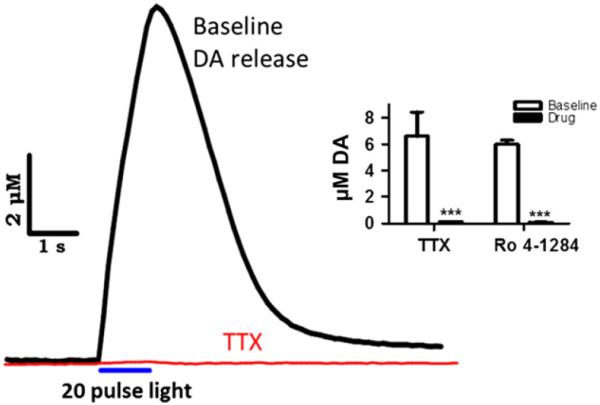
Light stimulation results in action potential dependent, vesicular release. A 20 pulse light stimulation produced ~ 10 μM dopamine (DA) release in baseline conditions. Following application of tetrodotoxin (TTX, 1 μM, red) the signal was completely eliminated. Inset: 20 pulse light stimulated signals were abolished in the presence of TTX (n = 3 slices from 2 animals, 3/2), as well as Ro 4-1284 (n = 3/2); suggesting that release is dependent on both endogenous Na+ channels and vesicular transport. ***p < 0.001 versus predrug.
Electrical versus optical stimulation
A direct comparison of baseline single pulse DA release between stimulation types is difficult because of multiple different contributing factors including the amount of ChR2 expression in the local field, the amplitude differences between electronic and photonic activation, as well as the heterogeneity of fibers being targeted with each method. Therefore, no attempt was made to match single pulse baseline signals. Instead, we aimed to investigate the relative responsiveness of each stimulation type to multiple pulse stimulations within the same area of tissue. Thus, DA release was evoked with single pulse and pulse trains (5, 10 and 20 pulses at 20 Hz) for each stimulation type. Light stimulations utilized CaMKIIα promotor-dependent ChR2 expression. On average, single pulse optical excitation (mean ± SEM release, 0.62 ± 0.10 μM, n = 12) resulted in less DA release compared to electrical stimulation (mean ± SEM, 0.88 ± 0.14 μM, n = 12) of the same area (t(11) = 2.7, p < 0.05). However, optically stimulated DA release consistently surpassed that of electrically stimulated release at 5, 10, and 20 pulses. To focus on the relative differences in signal proliferation during multi-pulse stimulations we normalized the single pulse DA release between the two stimulation techniques (Fig. 4a). Thus, the relative DA release was the multi-pulse signal as a percentage of the single pulse signal. A two-way anova revealed a main effect of stimulation type on relative DA release (F(1,66) = 8.01, p < 0.01), and an interaction effect between pulse number and stimulation type (F(3,66) = 5.07, p < 0.01), with the difference in relative DA release between stimulation types increasing with the number of pulses in the pulse train. Furthermore, we ran planned comparisons analysis of electrical versus light stimulation and found the relative DA release was significantly different between stimulation types at each pulse train tested (5 pulses, p < 0.001; 10 pulses, p < 0.001; 20 pulses, p < 0.001). DA per pulse (DA/p; DA release/# of pulses) was then plotted as a percent of the one pulse baseline DA release. There was a decrease in the DA/p as pulse number increases (Fig. 4b), consistent with previous reports with similar stimulation parameters in mice (Zhang et al. 2009). However, the decrease in DA/p was significantly reduced using optical stimulation (F(1,66) = 6.31, p < 0.05).
Fig. 4.
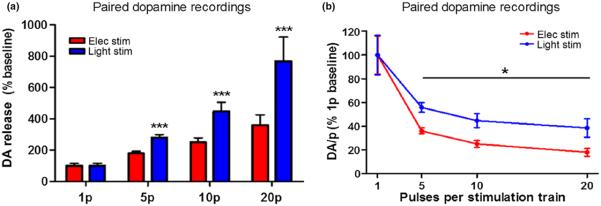
Multi-pulse light stimulation results in greater dopamine (DA) release than electrical stimulation. DA release with 1, 5, 10, and 20 pulse stimulations with either electrical (red) or light (blue) stimulation of the same location (n = 12/8). (a) Average multi-pulse (5, 10 and 20 pulses) DA release, presented as a percentage of the single pulse (1 pulse) baseline release, is greater using light stimulation versus electrical stimulation). (b) Average DA release per stimulus pulse (DA/p; total DA/# pulses), normalized to 1 pulse baseline release, decreases across multi-pulse trains (5, 10, and 20 pulses) for both electrical and light stimulation; however, light stimulation results in less inhibition of DA/p than electrical stimulation (n = 12/8). *p < 0.05 versus elec stim; ***p < 0.001 versus elec stim.
To further demonstrate the increased sensitivity of fields to optical stimulation, we overlaid example traces from a 1, 5, 10 and 20 pulse stimulation series for each stimulation type (Fig. 5), in which we normalized the 1 pulse release, to view the relative increases in DA release with multi-pulse stimulations. The slope of the rising phase was perfectly straight and consistent for all optical stimulations (a), while for electrical stimulations (b), there was a rightward deflection in the curves, resulting in a reduction in the steepness of the slope. To quantify this observation, we analyzed the 10 pulse stimulation group data. We divided the total DA release into 100 ms segments that cover the duration of the stimulation train (10 pulses at 20 Hz = 500 ms). Thus, we could determine the percentage of the total DA signal elicited every 100 ms, across the 500 ms stimulation duration (Fig. 5c). A two-way ANOVA revealed an interaction effect between stimulation type and time (F(4,88) = 9.21, p < 0.001). We found that 41% of the total electrically stimulated DA release occurred in the first 100 ms of the stimulation train, while 35% of the signal was contributed during the final 300 ms combined. Conversely, 28% of the optically stimulated DA release occurred in the initial 100 ms, while 49% of the signal was contributed across the final 300 ms. Thus, overall, electrically stimulated DA release was greater early in the stimulation train (100 ms, p < 0.001) and declined more rapidly across the duration of the stimulation train relative to optical stimulation (300 ms, p < 0.001; 400 ms, p < 0.001; 500 ms, p < 0.001), which showed more consistent release throughout the stimulation.
Fig. 5.

Electrical stimulation shows inhibition of dopamine (DA) release. Representative DA release curves resulting from 1, 5, 10, and 20 pulse stimulations, within the same location of NAc and with normalized 1 pulse baselines, are overlaid for light and electrical stimulation. The slope of the rising phase is perfectly straight and consistent for all light stimulations (a), while in (b), there is a rightward deflection in the curves, resulting in a reduction in the steepness of the slope. (c) Total 10 pulse stimulation data were analyzed for contribution per 100 ms to total DA signal. Electrical stimulation shows greater contribution during the first 100 ms of stimulation with less contribution to the total signal during the final 300 ms of stimulation duration, compared to light, which was more consistent throughout the duration of stimulation (n = 12/8). (d) There was no difference in the maximal rate of uptake between stimulation types (n = 16/11). ***p < 0.001 versus elec stim.
DA uptake occurs during DA release and can offset the amplitude of extracellular DA. However, there was no difference in the maximal rate of uptake (Vmax) between stimulations methods (Fig. 5d) (t(31) = 0.8, p = 0.432), suggesting that differences in relative release amplitude between stimulation methods is not because of differences in DA uptake, and therefore exist within the release parameters. We hypothesized that electrical stimulation recruits non-dopaminergic processes in the local environment and the net effect of this recruitment is an inhibition of DA release via heteroreceptors on the DA terminals. The NAc contains GABAergic and cholinergic interneurons (Tepper et al. 2010; Tepper and Bolam 2004; (Zhou et al. 2001), and these interneurons present logical targets as sources of electrically stimulated, non-dopaminergic inhibition. Therefore, we tested our hypothesis by investigating possible GABAergic and cholinergic influences on electrically and light stimulated DA release.
GABAergic influence on stimulated DA release
To date, GABAA receptors have been tested but fail to show direct modulation of DA release at terminals (Smolders et al. 1995; Morikawa and Morrisett 2010; unpublished lab results); however, GABAB receptors have been identified on DA terminals (Charara et al. 2000) and GABAB receptor activation decreases DA release (Schmitz et al. 2002; Pitman et al. 2014). We used CGP 55845, a highly potent GABAB receptor antagonist, to block GABAB receptors during single and 20 pulse stimulated DA release using either electrical or light stimulation of the same tissue location. CGP 55845 (10 μM) significantly increased electrically stimulated DA release resulting from both single pulse (t(11) = 5.8, p < 0.001), and 20 pulse (t(11) = 6.4, p < 0.001) stimulations (Fig. 6). However, CGP 55845 showed consistent augmentations of both single pulse (20.9%) and 20 pulse (21.5%) stimulations, thereby not altering the multi-pulse responsiveness (20 : 1 ratio, data not shown), only the net release from electrical stimulation. Optical stimulations in the CaMKIIα promotor model of ChR2 expression showed increased release with GABAB antagonism (Fig. 6b) when single pulse stimulations were applied (t(11) = 3.5, p < 0.01), however, with 20 pulse stimulations there was no effect of CGP 55845 (t(11) = 1.0, p = 0.33). This suggests that local GABAB activation occurs with multi-pulse electrical stimulation and significantly inhibits DA release compared to optical stimulation of the same tissue.
Fig. 6.
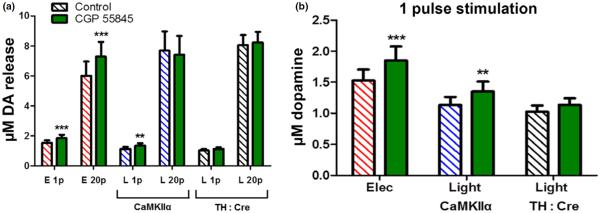
GABAergic modulation of dopamine (DA) release. (a) The GABAB receptor antagonist CGP 55845 significantly increased electrically stimulated DA release with 20 pulse stimulation trains (n = 12/7), while having no effect on 20 pulse light stimulations in either optogenetic model tested. (b) CGP 55845 increased 1 pulse electric stimulated DA release and 1 pulse light stimulated DA release in models of non-specific channelrhodopsin-2 (ChR2) expression in ventral tegmental area (VTA) projection neurons (CaMKIIα; n = 12/7); but had no effect on 1 pulse light stimulated DA release in models targeting ChR2 specifically to DA neurons projecting from the VTA (TH : Cre; n = 8/4). **p < 0.01 versus predrug; ***p < 0.001 versus predrug.
While the majority of neurons projecting from the VTA to the NAc are dopaminergic (~ 65%), reports suggest that approximately 25% of this projection population are GABAergic neurons (Margolis et al. 2006; Stuber et al. 2012). Therefore, optogenetically targeting VTA projections allows for possible GABAergic stimulation and subsequent GABA modulation of DA release. To determine if the increase in single pulse light stimulated release observed following application of CGP 55845 was because of tonic GABA activity within the slice or the co-stimulation of GABAergic terminals arising from the VTA, we used a second optogenetic model. We injected a Cre-inducible ChR2 expression viral vector into the VTA of TH-internal ribosome entry site-Cre (TH : Cre) knock-in mice (Tsai et al. 2009; Stamatakis et al. 2013). This model isolates expression of ChR2 to dopaminergic neurons within the lateral VTA regions, which are the source of projections to the NAc core (Ikemoto 2007); thus only the dopaminergic terminal fields in the NAc would be activated by light stimulation. We found that CGP 55845 had no effect on single pulse (t(7) = 2.2, p > 0.05; Fig. 7b) or 20 pulse (t(7) = 0.8, p > 0.05) light stimulations in the TH : Cre mouse model. Combined, these results suggest that recruitment of GABA signaling occurs during electrical stimulation and produces an inhibition of DA release at 1 and 20 pulses, the latter of which is not present when only VTA projection terminals are stimulated (CaMKIIα promoter model); while inhibition with either 1 pulse or 20 pulses stimulation is absent when only DA terminals from the VTA are stimulated (TH : Cre mouse model). However, because electrically stimulated release increased equally at both single pulse and 20 pulse stimulation parameters, the 20 : 1 pulse ratio (Fig. 4a) was not affected by GABAB blockade.
Fig. 7.

Cholinergic modulation of dopamine (DA) release. (a) The nAChR antagonist DHβE significantly reduced single pulse electrically stimulated DA release (n = 11/6), with no effect on light stimulated DA release, within the same location, using non-specific channelrhodopsin-2 (ChR2) expression in ventral tegmental area (VTA) projection neurons (CaMKIIα; n = 11/6). DhβE also had no effect on single pulse light stimulated DA release in models targeting ChR2 specifically to DA neurons projecting from the VTA (TH : Cre; n = 8/4). DHβE had no effect on 20 pulse stimulated DA release with either electric or light stimulation (elec/CaMKIIα, n = 11/6; TH : Cre, n = 8/4). (b) DHβE increased the 20 to 1 pulse ratio of DA release resulting from electrical stimulation, with no effects on the ratio of DA release resulting from light stimulation. ***p < 0.001 versus predrug. (c) The percentage of the total DA signal contributed during each 100 ms across the 500 ms stimulation duration. In the presence DHβE (100 nM), electrical and light stimulation show comparatively similar release responsiveness across the 10 pulse stimulation. (n = 11/6)
Acetylcholine influence on stimulated DA release
A second potential source of modulation comes from local cholinergic interneurons. Acetylcholine has demonstrated a prominent regulation of release acting through nAChR on DA terminals; particularly β2 subunit containing nAChRs in the NAc (Grady et al. 2007; Exley et al. 2008; Threlfell et al. 2010). We used DHβE, a competitive antagonist for the α4β2-containing subunits of the nAChR, to determine if acetylcholine modulates the single and multi-pulse sensitivity of electrically and light stimulated DA release.
We added DHβE (100 nM) to examine the single pulse and 20 pulse release in the same location using either electrical or light stimulation. DHβE significantly decreased single pulse DA release with electrical stimulation (t(10) = 7.6, p < 0.001), in a manner consistent with previous reports (Zhou et al. 2001); however, DHβE did not affect 20 pulse stimulated release (Fig. 7a). Also, DHβE had no effect on single pulse or 20 pulse light stimulated release using the CaMKIIα promoter model. The lack of effect on light stimulated release was further demonstrated using the TH : Cre mouse model. We calculated the ratio of 20 pulse to 1 pulse release (i.e. % baseline) and found that DHβE significantly increased the 20 : 1 pulse ratio of electrically stimulated DA release (t(10) = 12.99, p < 0.001), while there was no effect on the 20 : 1 pulse ratio for light stimulated release (Fig. 6b). Furthermore, the 20 : 1 pulse ratio was significantly greater for electrical stimulation compared to light stimulation in the presence of DHβE (t(10) = 2.7, p < 0.05), as opposed to it being significantly less in the baseline data (Figs 4b and 7b).
To examine whether nAChRs contribute to the differences we saw in the release phase responsiveness between stimulation types (Fig. 5c), we examined the effect of DHβE on the release of DA across the first 500 ms of the stimulation using either stimulation type (Fig. 7c). Light stimulated release in these experiments utilized the CaMKIIα promoter model of ChR2 expression. We found that in the presence of DHβE (100 nM) there was no longer a significant interaction effect between stimulation type and time (F(4,80) = 0.46, p > 0.05). Specifically, we found that electrically stimulated release became more consistent in the presence of DHβE, with 25% of the total signal occurring in the first 100 ms and 53% occurring across the final 300 ms. Furthermore, these numbers were very similar to light stimulation in DHβE, in which 26% of the signal occurred in the first 100 ms, and 53% occurred across the final 300 ms.
Discussion
We compared electrical and light stimulation of DA release within the NAc core using voltammetry in mouse brain slices. We found that viral mediated expression of ChR2 in VTA neurons induced robust ChR2 expression in terminal fields within the NAc. These terminal fields were responsive to light pulses, resulting in DA signals which were very similar in overall physiological profile to electrically stimulated DA release in the same slices. However, compared to electrical stimulation, DA release was much greater with optical stimulation when applied as multi-pulse stimulation trains. Our results indicate that activating DA terminal fields with light stimulation results in a less negatively modulated DA signal compared to electrical stimulation, which includes concurrent activation of local cholinergic and GABAergic interneurons.
Our results are consistent with other studies which used light stimulation in combination with voltammetry ex vivo and measured robust DA release in NAc slices in mice (Stuber et al. 2010; Tecuapetla et al. 2010; Stamatakis et al. 2013; Adrover et al. 2014) and rats (Witten et al. 2011; Bass et al. 2013). Specifically, this study aimed to compare DA release induced using light stimulation with traditional electrical stimulation of the tissue. We found similarities in DA release profiles between the stimulation methods, including a dependence on vesicular monoamine transport (Tecuapetla et al. 2010), which is necessary for endogenous, action potential dependent release. Light-evoked signals were likewise sensitive to TTX, revealing that stimulated release was dependent on voltage gated sodium channel activity (Tecuapetla et al. 2010; Witten et al. 2011; Threlfell et al. 2012; Tritsch et al. 2012; Adrover et al. 2014). A further interpretation of this TTX effect may extend to the cation permeability of ChR2, particularly to Ca2+ (Nagel et al. 2003; Berthold et al. 2008). When stimulating DA terminals, it is possible that ChR2 expression in or around the terminal membrane would permit Ca2+ entry and trigger release. However, TTX completely abolished release. Therefore, our data support the idea that Ca2+ entry via ChR2 within the terminal membranes is at levels insufficient to independently generate release or that release is below the level of detection using voltammetry. Furthermore, this supports the idea that ion flow through the ChR2 during the initial phase of excitation consists primarily of protons and sodium (Berthold et al. 2008; Schneider et al. 2013); and that the sodium flow alone is insufficient to generate an action potential when the native voltage gated sodium channels are blocked with TTX.
We extend the analysis of previous studies (Stuber et al. 2010; Tecuapetla et al. 2010; Stamatakis et al. 2013; Adrover et al. 2014) by providing an examination of multiple pulse stimulations. The NAc has been implicated in reward signaling during phasic bursting of DA neurons; therefore, in a slice it is useful to apply stimulation trains to the tissue to analyze modulations of release profiles representing bursting. We found that under these conditions, light stimulated release was significantly greater than electrically stimulated release, resulting in nearly a twofold increase in relative DA release at 20 pulses. No difference in uptake rate was noted, which is consistent with other reports comparing DA signal decay constants across stimulation methods (Tecuapetla et al. 2010; Adrover et al. 2014), and suggests that uptake rate is not influencing differences in release. Instead, our evaluation pointed to a marked inhibition of the electrically stimulated release compared to light. We propose a dual modulation of the multi-pulse electrically stimulated release in which release from the initial stimulation is augmented by acetylcholine while the total DA release is inhibited by GABA.
GABAergic modulation of dopamine release
To investigate the role of GABA transmission in modulating DA release we utilized two models of optogenetically targeted ChR2 expression. The CaMKII promotor mouse model limits light activation to terminal fields that arise from projection neurons of the VTA. This population of neurons is reported to be ~ 65% dopaminergic and ~ 25% GABAergic, with some small percentage of neurons currently unaccounted for (Margolis et al. 2006; Stuber et al. 2012). Therefore, even with light stimulation the terminals from a population of GABAergic projection neurons arising from the VTA may be stimulated. However, we found that blockade of GABAB receptors with CGP 55845 had no effect on 20 pulse light stimulated release in this model; while 20 pulse electrically stimulated release was increased. This suggests that GABA release arising from local NAc GABA interneurons generates significantly more activation of GABAB receptors on DA terminals compared to release from GABAergic projection neurons. It is unclear why 20 pulse light stimulated release showed no increase in the presence of CGP 55845, whereas single pulse release in the same model was increased. It may be that a 20 pulse stimulation increases the release probability beyond a level where the available GABA could modulate DA release (Citri and Malenka 2008; Brimblecombe et al. 2014). That is, increasing the probability of release occludes some modulatory effects on DA release which may only be present at low release probability stages (Brimblecombe et al. 2014). An increase in release probability would occur with multiple pulse stimulations as each pulse allows the accumulation of Ca2+ in the terminals (Citri and Malenka 2008). Perhaps the level of GABAB activation that occurs during light stimulation is insufficient to modulate a DA terminal that has been excited with 20 pulses. Such a scenario would further highlight the increased level of GABAB activation elicited by electrical stimulation (via GABA release from interneurons), during which there was a significant modulation of DA release following 20 pulse stimulations.
Single pulse evoked DA release using either electrical or light stimulation was increased with GABAB blockade, although to a larger extent following electrical stimulation. One explanation might be the presence of GABA via stimulation of GABA terminals originating the VTA, which inhibits DA release and would be present in both the electrical and optical induced stimulation when using the CaMKIIα promotor. Alternatively, it has been demonstrated that DA terminals take up and co-release local GABA with DA (Tritsch et al. 2012, 2014). To address this we used the TH : Cre mouse model in which ChR2 is targeted to TH expressing neurons of the VTA; thus our light stimulation was limited to only the DA projection terminals. Using this model, GABAB blockade was ineffective in increasing either single pulse or 20 pulse light stimulated release. This suggests that activation of VTA GABA projection neurons, and not GABA co-release from DA terminals, accounts for the modulation of single pulse DA release. Thus, cumulatively, these data suggest (i) that endogenous GABA tone is either absent in slices or, if present, does not modulate DA release, (ii) GABA release occurring from stimulation of VTA GABA projections is sufficient to modulate single pulse electrically stimulated DA release, and (iii) stimulation of GABA interneurons modulates multiple pulse electrically stimulated DA release.
Acetylcholine modulation of dopamine release
In comparing stimulation types we found a differential effect of the nAChR antagonist DHβE on DA release, such that single pulse electrical stimulation was significantly reduced, whereas optical stimulation of the same tissue was unaffected. These data suggest that electrical stimulation induces a cholinergic augmentation of DA release which does not occur with selective, optical stimulation of DA terminals. Our data is consistent with previously published data showing no effect of DHβE on light stimulated release in the dorsal striatum of mice under single pulse conditions (Threlfell et al. 2012). Here, we extend the findings of insensitivity of light stimulated recordings to DHβE modulation to the ventral striatum, using two different optogenetic mouse models, C57Bl/6 mice with CaMKII promoter-dependent expression of ChR2 and TH : Cre knock-in mice with Cre-dependent ChR2 expression.
It has been demonstrated that selective stimulation of a local population of cholinergic interneurons, using optogenetic methods, results in measurable DA release from unstimulated DA terminals (Cachope et al. 2012; Threlfell et al. 2012), establishing that nAChRs exert strong influence over presynaptic DA terminals. Furthermore, when electrical stimulation is applied, this nAChR-driven DA release may be in addition to release resulting from direct DA terminal stimulation (Wang et al. 2014), resulting in a cumulative DA signal. Our data support this model by showing that the electrical signal is significantly reduced by blocking nAChRs with DHβE, while in the light stimulated model, in which cholinergic interneurons are not stimulated and thus produce no synchronized cholinergic release, DHβE has no effect. We propose that the differences in release between electrical and optical stimulation across 10 pulse stimulation trains (Fig. 5c) result from electrically induced cholinergic augmentation of DA release during the initial stimulation, a phenomenon which is not present during light stimulation or in the presence of DHβE, where electrical and light stimulated release profiles look very similar (Fig. 7c). Similarly, the difference in release sensitivity (20 : 1 pulse ratios, Fig. 7b) between light and electrically stimulated DA release results from cholinergic augmentation of the single pulse electrically stimulated signal as there were no effects of DHβE on 20 pulse stimulated release using either stimulation method. Thus, cholinergic modulation via nAChRs accounts for the differences in observed multi-pulse to single pulse ratio of stimulated release. Our demonstration of increased sensitivity to multi-pulse light stimulations in the core is consistent with what has been reported in the NAc core of mice (Stamatakis et al. 2013) and rats (Bass et al. 2013).
In conclusion, we have reinforced the validity of using optogenetically targeted light stimulation of DA terminals in NAc slices to allow for acute investigations of DA terminal dynamics ex vivo. Furthermore, we have shown that light stimulation may be more beneficial for examining DA release, especially when multiple pulse stimulations are applied, because electrical stimulation induces local interneuron activity which corrupts the DA signal. The optogenetic model provides greater resolution in the interpretation of pharmacological effects on DA terminal dynamics by allowing measures of specific receptor types present on and directly modulating DA terminals, while reducing indirect modulation that may occur via the presence of the same receptor type on non-dopaminergic processes (e.g. interneurons or other afferent inputs) contributing to the DA signal. This is especially important when measuring features of terminal plasticity following a chronic treatment, where receptor expression or functional efficacy may be altered, because different cellular phenotypes may differentially alter the same receptors.
Acknowledgments
We thank Jordan T. Yorgason for his technical assistance. We thank Dr Karl Deisseroth for supplying the viral vectors and the UNC Vector Core for viral packaging and supply. This work was supported by National Institutes of Health grants U01 AA014091, P01 AA021099 (SRJ), F31 AA023144, T32 AA007565-20 (JRM), K99 DA031791 (MJF).
Abbreviations used
- AAV
adeno-associated virus
- CaMKIIα
calcium/calmodulin dependent protein kinase II alpha
- ChR2
channelrhodopsin-2
- DA
dopamine
- DHβE
dihydro-β-erythroidine hydrobromide
- GFP
green fluorescent protein
- IRES
internal ribosome entry site
- NAc
nucleus accumbens
- PBS
phosphate-buffered saline
- TH
tyrosine hydroxylase
- TTX
tetrodotoxin
- VTA
ventral tegmental area
Footnotes
The authors have no conflicts of interest to report.
All experiments were conducted in compliance with the ARRIVE guidelines.
References
- Adamantidis AR, Tsai H-C, Boutrel B, Zhang F, Stuber GD, Budygin EA, Touriño C, Bonci A, Deisseroth K, de Lecea L. Optogenetic interrogation of dopaminergic modulation of the multiple phases of reward-seeking behavior. J. Neurosci. 2011;31:10829–10835. doi: 10.1523/JNEUROSCI.2246-11.2011. [DOI] [PMC free article] [PubMed] [Google Scholar]
- Adrover MF, Shin JH, Alvarez VA. Glutamate and dopamine transmission from midbrain dopamine neurons share similar release properties but are differentially affected by cocaine. J. Neurosci. 2014;34:3183–3192. doi: 10.1523/JNEUROSCI.4958-13.2014. [DOI] [PMC free article] [PubMed] [Google Scholar]
- Bass CE, Grinevich VP, Kulikova AD, Bonin KD, Budygin EA. Terminal effects of optogenetic stimulation on dopamine dynamics in rat striatum. J. Neurosci. Methods. 2013;214:149–155. doi: 10.1016/j.jneumeth.2013.01.024. [DOI] [PMC free article] [PubMed] [Google Scholar]
- Berthold P, Tsunoda SP, Ernst OP, Mages W, Gradmann D, Hegemann P. Channelrhodopsin-1 initiates phototaxis and photophobic responses in chlamydomonas by immediate light-induced depolarization. Plant Cell. 2008;20:1665–1677. doi: 10.1105/tpc.108.057919. [DOI] [PMC free article] [PubMed] [Google Scholar]
- Brimblecombe KR, Gracie CJ, Platt NJ, Cragg SJ. Gating of dopamine transmission by calcium and axonal N-, Q-, T-and L-type voltage-gated calcium channels differs between striatal domains. J. Physiol. 2014;593:929–946. doi: 10.1113/jphysiol.2014.285890. [DOI] [PMC free article] [PubMed] [Google Scholar]
- Cachope R, Mateo Y, Mathur BN, Irving J, Wang H-L, Morales M, Lovinger DM, Cheer JF. Selective activation of cholinergic interneurons enhances accumbal phasic dopamine release: setting the tone for reward processing. Cell Rep. 2012;2:33–41. doi: 10.1016/j.celrep.2012.05.011. [DOI] [PMC free article] [PubMed] [Google Scholar]
- Calipari ES, Ferris MJ, Melchior JR, Bermejo K, Salahpour A, Roberts DCS, Jones SR. Methylphenidate and cocaine self-administration produce distinct dopamine terminal alterations. Addict. Biol. 2014;19:145–155. doi: 10.1111/j.1369-1600.2012.00456.x. [DOI] [PMC free article] [PubMed] [Google Scholar]
- Charara A, Heilman TC, Levey AI, Smith Y. Pre- and postsynaptic localization of GABA(B) receptors in the basal ganglia in monkeys. Neuroscience. 2000;95:127–140. doi: 10.1016/s0306-4522(99)00409-1. [DOI] [PubMed] [Google Scholar]
- Chaudhury D, Walsh JJ, Friedman AK, et al. Rapid regulation of depression-related behaviours by control of midbrain dopamine neurons. Nature. 2013;493:532–536. doi: 10.1038/nature11713. [DOI] [PMC free article] [PubMed] [Google Scholar]
- Citri A, Malenka RC. Synaptic plasticity: multiple forms, functions, and mechanisms. Neuropsychopharmacology. 2008;33:18–41. doi: 10.1038/sj.npp.1301559. [DOI] [PubMed] [Google Scholar]
- Exley R, Clements MA, Hartung H, McIntosh JM, Cragg SJ. Alpha6-containing nicotinic acetylcholine receptors dominate the nicotine control of dopamine neurotransmission in nucleus accumbens. Neuropsychopharmacology. 2008;33:2158–2166. doi: 10.1038/sj.npp.1301617. [DOI] [PubMed] [Google Scholar]
- Ferris MJ, Calipari ES, Mateo Y, Melchior JR, Roberts DC, Jones SR. Cocaine self-administration produces pharmacodynamic tolerance: differential effects on the potency of dopamine transporter blockers, releasers, and methylphenidate. Neuropsychopharmacology. 2012;37:1708–1716. doi: 10.1038/npp.2012.17. [DOI] [PMC free article] [PubMed] [Google Scholar]
- Ferris MJ, España RA, Locke JL, Konstantopoulos JK, Rose JH, Chen R, Jones SR. Dopamine transporters govern diurnal variation in extracellular dopamine tone. Proc. Natl Acad. Sci. USA. 2014;111:E2751–E2759. doi: 10.1073/pnas.1407935111. [DOI] [PMC free article] [PubMed] [Google Scholar]
- Grady SR, Salminen O, Laverty DC, Whiteaker P, McIntosh JM, Collins AC, Marks MJ. The subtypes of nicotinic acetylcholine receptors on dopaminergic terminals of mouse striatum. Biochem. Pharmacol. 2007;74:1235–1246. doi: 10.1016/j.bcp.2007.07.032. [DOI] [PMC free article] [PubMed] [Google Scholar]
- Ikemoto S. Dopamine reward circuitry: two projection systems from the ventral midbrain to the nucleus accumbens-olfactory tubercle complex. Brain Res. Rev. 2007;56:27–78. doi: 10.1016/j.brainresrev.2007.05.004. [DOI] [PMC free article] [PubMed] [Google Scholar]
- Jones SR, Gainetdinov RR, Wightman RM, Caron MG. Mechanisms of amphetamine action revealed in mice lacking the dopamine transporter. J. Neurosci. 1998;18:1979–1986. doi: 10.1523/JNEUROSCI.18-06-01979.1998. [DOI] [PMC free article] [PubMed] [Google Scholar]
- Margolis EB, Lock H, Chefer VI, Shippenberg TS, Hjelmstad GO, Fields HL. Kappa opioids selectively control dopaminergic neurons projecting to the prefrontal cortex. Proc. Natl Acad. Sci. USA. 2006;103:2938–2942. doi: 10.1073/pnas.0511159103. [DOI] [PMC free article] [PubMed] [Google Scholar]
- Mateo Y, Lack CM, Morgan D, Roberts DCS, Jones SR. Reduced dopamine terminal function and insensitivity to cocaine following cocaine binge self-administration and deprivation. Neuropsychopharmacology. 2005;30:1455–1463. doi: 10.1038/sj.npp.1300687. [DOI] [PubMed] [Google Scholar]
- Morikawa H, Morrisett RA. Ethanol action on dopaminergic neurons in the ventral tegmental area: interaction with intrinsic ion channels and neurotransmitter inputs. Int. Rev. Neurobiol. 2010;91:235–288. doi: 10.1016/S0074-7742(10)91008-8. [DOI] [PMC free article] [PubMed] [Google Scholar]
- Nagel G, Szellas T, Huhn W, Kateriya S, Adeishvili N, Berthold P, Ollig D, Hegemann P, Bamberg E. Channelrhodopsin-2, a directly light-gated cation-selective membrane channel. Proc. Natl Acad. Sci. USA. 2003;100:13940–13945. doi: 10.1073/pnas.1936192100. [DOI] [PMC free article] [PubMed] [Google Scholar]
- Phillips PEM, Hancock PJ, Stamford JA. Time window of autoreceptor-mediated inhibition of limbic and striatal dopamine release. Synapse. 2002;44:15–22. doi: 10.1002/syn.10049. [DOI] [PubMed] [Google Scholar]
- Pitman KA, Puil E, Borgland SL. GABAB modulation of dopamine release in the nucleus accumbens core. Eur. J. Neurosci. 2014;40:3472–3480. doi: 10.1111/ejn.12733. [DOI] [PubMed] [Google Scholar]
- Rice ME, Cragg SJ. Nicotine amplifies reward-related dopamine signals in striatum. Nat. Neurosci. 2004;7:583–584. doi: 10.1038/nn1244. [DOI] [PubMed] [Google Scholar]
- Rose JH, Calipari ES, Mathews TA, Jones SR. Greater ethanol-induced locomotor activation in DBA/2J versus C57BL/6J mice is not predicted by presynaptic striatal dopamine dynamics. PLoS ONE. 2013;8:e83852. doi: 10.1371/journal.pone.0083852. [DOI] [PMC free article] [PubMed] [Google Scholar]
- Schlösser B, Kudernatsch MB, Sutor B, ten Bruggencate G. Delta, mu and kappa opioid receptor agonists inhibit dopamine overflow in rat neostriatal slices. Neurosci. Lett. 1995;191:126–130. doi: 10.1016/0304-3940(94)11552-3. [DOI] [PubMed] [Google Scholar]
- Schmitz Y, Schmauss C, Sulzer D. Altered dopamine release and uptake kinetics in mice lacking D2 receptors. J. Neurosci. 2002;22:8002–8009. doi: 10.1523/JNEUROSCI.22-18-08002.2002. [DOI] [PMC free article] [PubMed] [Google Scholar]
- Schneider F, Gradmann D, Hegemann P. Ion selectivity and competition in channelrhodopsins. Biophys. J. 2013;105:91–100. doi: 10.1016/j.bpj.2013.05.042. [DOI] [PMC free article] [PubMed] [Google Scholar]
- Siciliano CA, Calipari ES, Ferris MJ, Jones SR. Biphasic mechanisms of amphetamine action at the dopamine terminal. J. Neurosci. 2014;34:5575–5582. doi: 10.1523/JNEUROSCI.4050-13.2014. [DOI] [PMC free article] [PubMed] [Google Scholar]
- Smolders I, Klippel N, De Sarre S, Ebinger G, Michotte Y. Tonic GABA-ergic modulation of striatal dopamine release studied by in vivo microdialysis in the freely moving rat. Eur. J. Pharmacol. 1995;284:83–91. doi: 10.1016/0014-2999(95)00369-v. [DOI] [PubMed] [Google Scholar]
- Stamatakis AM, Jennings JH, Ung RL, Blair GA, Weinberg RJ, Neve RL, Boyce F, et al. A unique population of ventral tegmental area neurons inhibits the lateral habenula to promote reward. Neuron. 2013;80:1039–1053. doi: 10.1016/j.neuron.2013.08.023. [DOI] [PMC free article] [PubMed] [Google Scholar]
- Stuber GD, Hnasko TS, Britt JP, Edwards RH, Bonci A. Dopaminergic terminals in the nucleus accumbens but not the dorsal striatum corelease glutamate. J. Neurosci. 2010;30:8229–8233. doi: 10.1523/JNEUROSCI.1754-10.2010. [DOI] [PMC free article] [PubMed] [Google Scholar]
- Stuber GD, Britt JP, Bonci A. Optogenetic modulation of neural circuits that underlie reward seeking. Biol. Psychiatry. 2012;71:1061–1067. doi: 10.1016/j.biopsych.2011.11.010. [DOI] [PMC free article] [PubMed] [Google Scholar]
- Tecuapetla F, Patel JC, Xenias H, et al. Glutamatergic signaling by mesolimbic dopamine neurons in the nucleus accumbens. J. Neurosci. 2010;30:7105–7110. doi: 10.1523/JNEUROSCI.0265-10.2010. [DOI] [PMC free article] [PubMed] [Google Scholar]
- Tepper JM, Bolam JP. Functional diversity and specificity of neostriatal interneurons. Curr. Opin. Neurobiol. 2004;14:685–692. doi: 10.1016/j.conb.2004.10.003. [DOI] [PubMed] [Google Scholar]
- Tepper JM, Tecuapetla F, Koós T, Ibáñez-Sandoval O. Heterogeneity and diversity of striatal GABAergic interneurons. Front. Neuroanat. 2010;4:150. doi: 10.3389/fnana.2010.00150. [DOI] [PMC free article] [PubMed] [Google Scholar]
- Threlfell S, Clements MA, Khodai T, Pienaar IS, Exley R, Wess J, Cragg SJ. Striatal muscarinic receptors promote activity dependence of dopamine transmission via distinct receptor subtypes on cholinergic interneurons in ventral versus dorsal striatum. J. Neurosci. 2010;30:3398–3408. doi: 10.1523/JNEUROSCI.5620-09.2010. [DOI] [PMC free article] [PubMed] [Google Scholar]
- Threlfell S, Lalic T, Platt NJ, Jennings KA, Deisseroth K, Cragg SJ. Striatal dopamine release is triggered by synchronized activity in cholinergic interneurons. Neuron. 2012;75:58–64. doi: 10.1016/j.neuron.2012.04.038. [DOI] [PubMed] [Google Scholar]
- Tritsch NX, Ding JB, Sabatini BL. Dopaminergic neurons inhibit striatal output through non-canonical release of GABA. Nature. 2012;490:262–266. doi: 10.1038/nature11466. [DOI] [PMC free article] [PubMed] [Google Scholar]
- Tritsch NX, Oh W-J, Gu C, Sabatini BL. Midbrain dopamine neurons sustain inhibitory transmission using plasma membrane uptake of GABA, not synthesis. ELife. 2014;3:e01936. doi: 10.7554/eLife.01936. [DOI] [PMC free article] [PubMed] [Google Scholar]
- Tsai H-C, Zhang F, Adamantidis A, Stuber GD, Bonci A, deLecea L, Deisseroth K. Phasic firing in dopaminergic neurons is sufficient for behavioral conditioning. Science. 2009;324:1080–1084. doi: 10.1126/science.1168878. [DOI] [PMC free article] [PubMed] [Google Scholar]
- Tye KM, Mirzabekov JJ, Warden MR, et al. Dopamine neurons modulate neural encoding and expression of depression-related behaviour. Nature. 2013;493:537–541. doi: 10.1038/nature11740. [DOI] [PMC free article] [PubMed] [Google Scholar]
- Wang L, Zhang X, Xu H, et al. Temporal components of cholinergic terminal to dopaminergic terminal transmission in dorsal striatum slices of mice. J. Physiol. 2014;592:3559–3576. doi: 10.1113/jphysiol.2014.271825. [DOI] [PMC free article] [PubMed] [Google Scholar]
- Wightman RM, Amatore C, Engstrom RC, Hale PD, Kristensen EW, Kuhr WG, May LJ. Real-time characterization of dopamine overflow and uptake in the rat striatum. Neuroscience. 1988;25:513–523. doi: 10.1016/0306-4522(88)90255-2. [DOI] [PubMed] [Google Scholar]
- Witten IB, Steinberg EE, Lee SY, et al. Recombinase-driver rat lines: tools, techniques, and optogenetic application to dopamine-mediated reinforcement. Neuron. 2011;72:721–733. doi: 10.1016/j.neuron.2011.10.028. [DOI] [PMC free article] [PubMed] [Google Scholar]
- Yorgason JT, Espãna RA, Jones SR. Demon voltammetry and analysis software: analysis of cocaine-induced alterations in dopamine signaling using multiple kinetic measures. J. Neurosci. Methods. 2011;202:158–164. doi: 10.1016/j.jneumeth.2011.03.001. [DOI] [PMC free article] [PubMed] [Google Scholar]
- Yorgason JT, Ferris MJ, Steffensen SC, Jones SR. Frequency-dependent effects of ethanol on dopamine release in the nucleus accumbens. Alcohol. Clin. Exp. Res. 2014;38:438–447. doi: 10.1111/acer.12287. [DOI] [PMC free article] [PubMed] [Google Scholar]
- Zhang H, Sulzer D. Glutamate spillover in the striatum depresses dopaminergic transmission by activating group I metabotropic glutamate receptors. J. Neurosci. 2003;23:10585–10592. doi: 10.1523/JNEUROSCI.23-33-10585.2003. [DOI] [PMC free article] [PubMed] [Google Scholar]
- Zhang H, Sulzer D. Frequency-dependent modulation of dopamine release by nicotine. Nat. Neurosci. 2004;7:581–582. doi: 10.1038/nn1243. [DOI] [PubMed] [Google Scholar]
- Zhang L, Doyon WM, Clark JJ, Phillips PEM, Dani JA. Controls of tonic and phasic dopamine transmission in the dorsal and ventral striatum. Mol. Pharmacol. 2009;76:396–404. doi: 10.1124/mol.109.056317. [DOI] [PMC free article] [PubMed] [Google Scholar]
- Zhou FM, Liang Y, Dani JA. Endogenous nicotinic cholinergic activity regulates dopamine release in the striatum. Nat. Neurosci. 2001;4:1224–1229. doi: 10.1038/nn769. [DOI] [PubMed] [Google Scholar]