

Abstract
Background
HIV infection and antiretroviral therapy (ART) may create unique risk factors for vitamin D insufficiency, including alterations of vitamin D metabolism by ART. We prospectively compared demographic and clinical parameters between vitamin D sufficient and insufficient HIV-infected (HIV+) adults, and assessed changes in these parameters among insufficient participants following standardized vitamin D supplementation.
Methods
HIV+ adults (≥18 years old) with HIV-1 RNA <50 copies/mL on ART were enrolled. Vitamin D sufficiency and insufficiency were defined as 25-hydroxyvitamin D (25(OH)D) ≥30 or <30 ng/mL, respectively. Insufficient participants received open-label vitamin D3 50,000 IU twice weekly for 5 weeks, then 8000 IU twice weekly to complete 24 weeks. The primary endpoint was success or failure to achieve 25(OH)D ≥30 ng/mL at week 24.
Results
Ninety-seven participants enrolled (34 vitamin D sufficient, 63 insufficient); 32 % female, 47 % non-White, median age 46 years, ART duration 5 years, CD4+ T lymphocyte count (CD4) 673 cells/mm3. 25(OH)D repletion was 83 % (95 % CI 71 %–90 %) successful. 25(OH)D levels correlated with both CD4 (r = 0.44, p = 0.01) and time on protease inhibitor (r = −0.35, p = 0.01). After adjusting for age, sex, race, nadir CD4 and baseline 25(OH)D: 1) current use of efavirenz exposure was associated with a 21.1 ng/mL higher week 24 25(OH)D level (p = 0.007), 2) per year use of zidovudine was associated with 7.1 ng/mL reduction in week 24 serum 25(OH)D (p = 0.05) and 3) every 1 ng/mL 25(OH)D increase was associated with a 3.3 cell/mm3 CD4 increase (p = 0.06).
Conclusion
Vitamin D3 supplementation was effective in repleting 25(OH)D levels after 24 weeks. Current efavirenz use was positively associated with post-repletion 25(OH)D levels, while greater time on zidovudine was associated with lower post-repletion 25(OH)D levels. The association between improved CD4 recovery and vitamin D repletion suggests a potential benefit of vitamin D supplementation on immunologic recovery during HIV treatment.
Trial registration
This trial is registered at The Brazilian Clinical Trials Registry (U1111‐1165‐2537).
Electronic supplementary material
The online version of this article (doi:10.1186/s12937-015-0072-6) contains supplementary material, which is available to authorized users.
Introduction
Low serum 25-hydroxyvitamin D levels (25(OH)D <30 ng/mL) are widely documented in both HIV-infected persons and the general population [1–5]. While serum 25(OH)D levels have been associated with seasonal variations in exposure to sunlight, high rates of vitamin D insufficiency have also been documented in regions with low latitude and year-round sun exposure, including South America [6–10].
HIV infection may create unique risk factors for vitamin D insufficiency such as chronic inflammation [11], and both the protease inhibitor (PI) and non-nucleoside reverse transcriptase inhibitor (NNRTI) classes of antiretroviral agents may enhance vitamin D metabolism via modulation of the cytochrome P450 system and vitamin D hydroxylation [1, 11–14]. Additionally, in HIV-infected persons, vitamin D insufficiency has been associated with lower CD4+ T lymphocyte counts [15, 16].
In the general population, the safety and efficacy of vitamin D supplementation has been demonstrated at a wide range of doses [17, 18]. In HIV-infected persons, the safety of vitamin D supplementation has also been described, but repletion success rates have been less consistent [3, 19]. Given the associations of vitamin D insufficiency with cardiovascular disease, insulin resistance, progression to AIDS and increased mortality [2, 15, 20–24], we designed an open-label trial of standardized vitamin D3 supplementation among HIV-infected men and women on suppressive combination antiretroviral therapy (ART) in Rio de Janeiro, Brazil.
Methods
Study design and study population
Participants were recruited from the adult HIV clinic at the Evandro Chagas Clinical Research Institute (IPEC), Oswaldo Cruz Foundation, which was established as a referral center for HIV research and care in Rio de Janeiro, Brazil in 1986. Eligible participants underwent screening for vitamin D insufficiency as part of routine clinical care between January 2011 and December 2013.
Inclusion criteria for this analysis included receipt of ART (defined as two nucleoside reverse transcriptase inhibitors (NRTI) in combination with at least one PI or one NNRTI) for at least six months prior to entry and HIV-1 RNA <50 copies/mL at study entry. ART switches in the six months prior to study enrollment were allowed for tolerability but not virologic failure. Persons receiving vitamin D supplementation >400 International Units (IU, the amount in a standard multivitamin) at screening were excluded from participation.
At screening, participants underwent serum 25(OH)D measurement via chemiluminescence assay according to the manufacturer instructions (Abbott, Chicago, IL). Vitamin D sufficiency and insufficiency were defined as 25(OH)D levels ≥30 ng/mL and <30 ng/mL, respectively. Insufficient participants were eligible to receive vitamin D3 (cholecalciferol) supplementation and follow-up every twelve weeks for at least 24 weeks, while those with 25(OH)D ≥30 ng/mL served as a baseline control group and did not require additional follow-up. For insufficient subjects, vitamin D3 supplementation adherence and tolerability were addressed at each follow-up visit. Dual-energy X-ray absorptiometry (DXA) was offered to all patients at baseline and was performed following manufacturer-recommended calibration and maintenance procedures (Lunar Prodigy densitometer, General Electric, Madison, WI). Lumbar spine and femoral neck Z scores from DXA results were used to evaluate the presence of osteopenia (Z-score between −1.0 and −2.5) or osteoporosis (Z-score ≤ −2.5).
The study protocol was approved by the Evandro Chagas Clinical Research Institute institutional review board, and all participants provided written informed consent prior to the initiation of study procedures. This trial is registered at The Brazilian Clinical Trials Registry (UTN: U1111‐1165‐2537).
Vitamin D supplementation
Participants with insufficient serum 25(OH)D levels were prescribed a vitamin D3 supplementation regimen of 50,000 IU orally twice weekly for five weeks (repletion phase) followed by 8000 IU twice a week for an additional 19 weeks (maintenance phase), a regimen similar to that associated with high safety and repletion success [5, 25, 26] (see Statistical Analysis, below) and within the guidelines suggested by The Endocrine Society [27]. Vitamin D3 supplements were provided to participants by the IPEC research pharmacy in an emulsified 4000 IU D3 per drop formulation (manufacturer Roche, Basel, Switzerland). All participants received dosing and storage instructions. Adherence was measured by self-report, as pill counts could not be obtained using the emulsified D3 formulation.
Data collection
Socio-demographic and clinical information were obtained from the clinical records of patients receiving HIV care at IPEC, which is updated regularly using outpatient and inpatient clinical documentation and laboratory testing results. ART use (drug, dates of use, and dose) and other data were extracted from the clinical record by trained abstractors, who recorded the information onto standardized case report forms prior to database entry.
Fasting glucose, lipid profile and glycosylated hemoglobin, and CD4+ T lymphocyte counts and HIV-1 RNA were assessed at baseline and week 24, according to local standards.
Statistical analysis
The sample size calculation was based on the 85 % repletion success rate of a similar cholecalciferol supplementation regimen after twelve weeks in HIV-uninfected adults with low bone mineral density [5]. For this study, we predicted that HIV-infected persons might experience a less effective response to the intervention of 60 %. Based on this assumption, a minimum inclusion of 24 vitamin D insufficient participants provided 80 % power (two-tailed, α=0.05) to reject the null hypothesis that 60 % effectiveness is not statistically different from the 85 % expected repletion success rate.
The primary endpoint was dichotomized success or failure to achieve 25(OH)D ≥30 ng/mL after 24 weeks of vitamin D3 supplementation. Secondary endpoints included determination of associations between socio-demographic and clinical features and both baseline and week 24 25(OH)D levels, as well as an evaluation of the effects of vitamin D3 supplementation on metabolic and immunological parameters.
Between-group comparisons for 1) baseline vitamin D sufficiency vs. insufficiency and 2) failure vs. success of repletion after 24 weeks were performed using the Wilcoxon rank-sum test for continuous variables and the chi-square or Fisher’s exact test for categorical variables. Linear regression models were used to quantify the association of 25(OH)D levels with current ART exposure and CD4+ T lymphocyte counts. The initial multivariate models included all variables explored in the bivariate analysis. Sex, age, race and nadir CD4+ T lymphocyte count were maintained in the final multivariate models irrespective of p-values due to prior reports of associations with 25(OH)D levels. In addition, current antiretroviral drugs/classes were initially included and removed by backwards elimination until a p-value of < 0.05 was present for all ART variables.
Results
Study population
One hundred participants were screened and 99 enrolled. Of those 99, one participant withdrew consent and one was lost to follow-up, leaving 97 evaluable participants. Sixty-three participants had vitamin D insufficiency and initiated supplementation, whereas 34 participants were classified as vitamin D sufficient at baseline and were included as controls (Fig. 1).
Fig. 1.
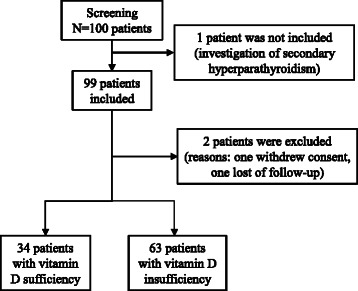
Study flow-chart: screening and enrollment of study participants
Overall, the median age of the study population was 45 years, 68 % were men, median baseline CD4+ T lymphocyte count was 673 cells/mm3, median time on ART was 5 years and the most common ART agents in current use were tenofovir (71 %) and efavirenz (70 %) (Table 1).
Table 1.
Baseline demographic and clinical characteristics
| Sufficient group | Insufficient group | Total | P-value | |
|---|---|---|---|---|
| n = 34 | n = 63 | n = 97 | ||
| 25(OH)D (ng/mL) | 38 (34, 43) | 21 (16, 24) | 24 (18, 35) | <0.001 |
| Male sex | 74 % (25) | 65 % (41) | 68 % (66) | 0.53 |
| Age (years) | 45 (38, 50) | 47 (38, 53) | 45 (38, 52) | 0.87 |
| White race/ethnicity | 50 % (17) | 54 % (34) | 53 % (51) | 0.87 |
| Nadir CD4+ T lymphocyte (cells/mm3) | 185 (97, 230) | 143 (49, 242) | 170 (71, 236) | 0.39 |
| ≥ 350 | 3 % (1) | 3 % (2) | 3 % (3) | |
| 200–349 | 38 % (12) | 34 % (21) | 36 % (33) | |
| 50–199 | 53 % (17) | 36 % (22) | 42 % (39) | |
| < 50 | 6 % (2) | 26 % (16) | 19 % (18) | |
| Baseline CD4+ T lymphocyte (cells/mm3) | 650 (437, 754) | 688 (499, 792) | 673 (465, 775) | 0.39 |
| ≥ 500 | 66 % (19) | 74 % (43) | 72 % (62) | |
| 350–499 | 24 % (7) | 16 % (9) | 18 % (16) | |
| < 350 | 10 % (3) | 10 % (6) | 10 % (9) | |
| Time on ART (years) | 5 (4, 5) | 5 (5, 6) | 5 (4, 6) | 0.40 |
| Time on TDF (years) | 3 (1, 4) | 3 (0, 5) | 3 (1, 5) | 0.42 |
| Time on AZT (years) | 0 (0, 4) | 0 (0, 5) | 0 (0, 5) 4(1.3,4.9) | 0.06 |
| Time on EFV (years) | 3 (0, 5) | 4 (2, 5) | 4 (1, 5) | 0.10 |
| Time on PI (years) | 2 (0, 5) | 0 (0, 2) | 0 (0, 5) | 0.10 |
| Current TDF use | 77 % (26) | 68 % (43) | 71 % (69) | 0.54 |
| Current AZT use | 24 % (8) | 35 % (22) | 31 % (30) | 0.35 |
| Current EFV use | 65 % (22) | 73 % (46) | 70 % (68) | 0.54 |
| Current PI use | 35 % (12) | 24 % (15) | 28 % (27) | 0.33 |
| DXA classificationa | 0.17 | |||
| Normal | 32 % (6) | 29 % (10) | 30 % (16) | |
| Osteopenia | 63 % (12) | 46 % (16) | 52 % (28) | |
| Osteoporosis | 5 % (1) | 26 % (9) | 18 % (10) | |
| Any bone diseaseb | 68 % (13) | 71 % (25) | 70 % (38) | 0.10 |
| BMIa (kg/m2) | 25 (23, 27) | 25 (24, 28) | 25 (23, 27) | 0.46 |
| < 18.5 | 5 % (1) | 0 (0) | 2 % (1) | |
| 18.5–24.9 | 47 % (9) | 51 % (18) | 50 % (27) | |
| 25.0–29.9 | 47 % (9) | 31 % (11) | 11 % (6) | |
| ≥ 30.0 | 0 (0) | 17 % (6) | 37 % (20) | |
| C-reactive protein (mg/dL) | 0.2 (0.3, 0.9) | 0.3 (0.2, 0.6) | 0.3 (0.2, 0.6) | 0.56 |
| Glucose (mg/dL) | 89 (81, 95) | 88 (81, 93) | 88 (81, 93) | 0.73 |
| HbA1c (%) | 5.5 (5.3, 5.7) | 5.5 (5.3, 5.7) | 5.5 (5.3, 5.7) | 0.84 |
| Triglycerides (mg/dL) | 108 (76, 181) | 121 (86, 185) | 120 (80, 184) | 0.55 |
| Total cholesterol (mg/dL) | 195 (171, 223) | 196 (173, 217) | 196 (172, 221) | 0.82 |
| HDL (mg/dL) | 45 (37, 51) | 47 (39, 58) | 47 (39, 58) | 0.60 |
| LDL (mg/dL) | 117 (93, 140) | 120 (92, 145) | 118 (92, 143) | 0.89 |
Median (interquartile range) or percent (n) presented
25(OH)D 25-hydroxyvitamin D, TDF tenofovir, AZT zidovudine, EFV efavirenz, PI protease inhibitor, DXA dual-energy X-ray absorptiometry, BMI body mass index, HbA1c glycated hemoglobin
aData available for 54 patients (19 in sufficiency group, 35 in insufficiency group)
bAny bone disease aggregates osteoporosis and osteopenia
Baseline differences by serum 25(OH)D level
At baseline, vitamin D sufficient and insufficient participants differed mainly by serum 25(OH)D level (Table 1). Although absolute current and nadir CD4+ T lymphocyte counts did not differ significantly between groups, the proportion of participants with a CD4+ T lymphocyte nadir <50 cells/mm3 was 26 % among insufficient participants vs. 6 % among sufficient participants (p = 0.04).
Regarding ART use, efavirenz use was more frequent among insufficient participants (73 % vs. 65 %, p = 0.54), who also had a longer exposure to this drug (p = 0.10). The proportion of patients on zidovudine was also higher in the insufficient group (35 % vs. 24 %, p = 0.35), while tenofovir and PI use were more common in the sufficient group (tenofovir: 77 % vs. 68 %, p = 0.54; PI: 35 % vs. 24 %, p = 0.33). Regarding body mass index, overall there was no significant difference between the groups, although obesity was more prevalent in the insufficient group (17 % vs. 0 %, p = 0.08) (Table 1).
Baseline associations between 25(OH)D level and clinical parameters
Associations between current antiretroviral drug use and baseline 25(OH)D levels were evaluated using linear regression. In unadjusted models, per year PI exposure was associated with 1.69 ng/mL lower baseline 25(OH)D level (p = 0.03). Negative but non-significant associations were also observed for per year use of zidovudine, efavirenz and tenofovir. After controlling for sex, age, race and nadir CD4+ T lymphocyte count, per year exposure to any of the included ART drugs/classes was associated with lower baseline 25(OH)D levels, but those associations were non significant. Current PI use was associated with a 6.9 ng/mL higher baseline 25(OH)D level (p = 0.02) (Table 2A).
Table 2.
Linear models for 25(OH)D levels (ng/mL) at baseline and at week 24 for responders (n = 52)
| Part A. | ||
| Baseline (n = 97) | ||
| Unadjusted model | Adjusted model | |
| Beta (95 % CI) | Beta (95 % CI) | |
| Female sex | −1.08 (−7.27, 5.12) | −5.57 (−11.40, 0.26) |
| Age (years) | −0.16 (−0.44, 0.11) | −0.20 (−0.46, 0.05) |
| Non-white race/ethnicity | 2.48 (−3.29, 8.25) | 2.64 (−2.78, 8.06) |
| Nadir CD4+ T lymphocyte (per 100 cells/mm3) | 0.57 (−2.04, 3.18) | 1.17 (−1.42, 3.75) |
| Current use of TDF | 5.84 (−0.43, 12.12) | |
| Current use of AZT | −5.27 (−11.44, 0.89) | |
| Current use of EFV | −1.65 (−7.96, 4.66) | |
| Current use of PI | −2.85 (−3.55, 9.30) | 6.93 (0.96, 12.90) |
| Part B. | ||
| Week 24a (n = 52) | ||
| Unadjusted model | Adjusted model | |
| Beta (95 % CI) | Beta (95 % CI) | |
| Female sex | −4.08 (−16.61, 8.46) | −0.96 (−14.20, 12.27) |
| Age (years) | −0.22 (−0.78, 0.33) | 0.21 (−0.38, 0.79) |
| Non-white race/ethnicity | −5.02 (−16.95, 6.91) | −5.53 (−17.82, 6.77) |
| Nadir CD4+ T lymphocyte (per 100 cells/mm3) | 1.94 (−3.44, 7.31) | 3.29 (−1.96, 8.54) |
| Baseline 25(OH)D | 1.17 (0.25, 2.09) | 1.27 (0.24, 2.30) |
| Current use of TDF | −10.24 (−22.50, 2.02) | |
| Current use of AZT | 7.44 (−4.70, 19.57) | |
| Current use of EFV | 17.88 (4.08, 31.68) | 21.09 (6.41, 35.78) |
| Current use of PI | −16.15 (−31.10, −2.13) | |
25(OH)D 25-hydroxyvitamin D, TDF tenofovir, AZT zidovudine, EFV efavirenz, PI protease inhibitor
aFor those who underwent vitamin D supplementation and achieved 25(OH)D levels > 30 ng/mL at week 24
Bold font implies statistically significant results assuming a 5% significance threshold
Baseline associations between DXA results and demographic and clinical parameters
In the subset of participants with DXA results (n = 54), the prevalence of bone disease was high, with 68 % of vitamin D sufficient and 71 % of vitamin D insufficient participants having osteopenia or osteoporosis. While not statistically significant, the prevalence of osteoporosis was numerically greater in the vitamin D insufficient group (26 % vs. 5 %, p = 0.08) (Table 1).
25(OH)D levels did not differ between participants with any bone disease (osteoporosis or osteopenia) and those with normal Z score range (24 vs. 27 ng/mL respectively, p = 0.90, Additional file 1: Table S1). Participants with bone disease were more likely to be female (34 % vs. 19 %, p = 0.34), non-White (58 % vs. 38 %, p = 0.28), have a nadir CD4+ T lymphocyte count <50 cells/mm3 (25 % vs. 0 %, p = 0.04) and use efavirenz (79 % vs. 63 %, p = 0.31). Neither bivariate nor multivariate modeling revealed significant associations between demographic and clinical features and the presence of bone disease (data not shown).
Vitamin D repletion effectiveness
Twenty-four weeks of vitamin D3 supplementation was successful in achieving serum 25(OH)D levels ≥30 ng/mL in 83 % (n = 52/63, 95 % CI 71–90 %) of participants. Participants were classified at week 24 as either repletion responders (25(OH)D ≥30 ng/mL) or non-responders (25(OH)D persistently <30 ng/mL), with a median post-repletion serum 25(OH)D level of 47 ng/mL among responders vs. 26 ng/mL among non-responders (Table 3).
Table 3.
Demographic and clinical characteristics at week 24 among participants who underwent vitamin D3 supplementation
| WNon-responders | Responders | P-value | |
|---|---|---|---|
| (25(OH)D < 30 ng/mL) | (25(OH)D ≥30 ng/mL) | ||
| (n = 8) | (n = 52) | ||
| 25(OH)D (ng/mL)a | 26 (25, 27) | 47 (40, 65) | <0.001 |
| Male sex | 63 % (5) | 65 % (34) | 1.00 |
| Age (years) | 42 (36, 48) | 48 (39, 54) | 0.27 |
| White race/ethnicity | 63 % (5) | 54 % (28) | 0.72 |
| Baseline CD4+ T lymphocyte (cells/mm3) | 540 (509, 758) | 689 (527, 833) | 0.69 |
| ≥500 | 71 % (5) | 77 % (37) | |
| 350–499 | 14 % (1) | 17 % (8) | |
| <350 | 14 % (1) | 6 % (3) | |
| Week 24 CD4+ T lymphocyte (cells/mm3) | 656 (600, 891) | 712 (460, 853) | 0.50 |
| ≥500 | 100 % (5) | 67 % (22) | |
| 350–499 | 0 (0) | 21 % (7) | |
| <350 | 0 (0) | 12 % (4) | |
| Time on cART (years) | 5 (4, 8) | 5 (5, 6) | 0.96 |
| Time on TDF (years) | 4 (3, 5) | 3 (0, 5) | 0.30 |
| Time on AZT (years) | 0 (0, 2) | 1 (0, 5) | 0.50 |
| Time on EFV (years) | 2 (2, 4) | 4 (3, 5) | 0.31 |
| Time on PI (years) | 1 (0, 6) | 0 (0, 2) | 0.36 |
| Current TDF use | 100 % (8) | 65 % (34) | 0.09 |
| Current AZT use | 0 % (0) | 39 % (20) | 0.04 |
| Current EFV use | 50 % (4) | 79 % (41) | 0.10 |
| Current PI use | 38 % (3) | 19 % (10) | 0.35 |
| Baseline BMIb (kg/m2) | 23 (23, 24) | 25 (24, 28) | 0.23 |
| <18.5 | 0 % (0) | 0 % (0) | |
| 18.5–24.9 | 100 % (3) | 48 % (15) | |
| 25.0–29.9 | 0 % (0) | 32 % (10) | |
| ≥30.0 | 0 % (0) | 19 % (6) | |
| C-reactive protein (mg/dL) | 0.3 (0.2, 0.4) | 0.3 (0.2, 0.9) | 0.36 |
| Glucose (mg/dL) | 82 (80, 89) | 91 (87, 103) | 0.02 |
| HbA1c (%) | 5.5 (5.5, 5.8) | 5.5 (5.2, 5.8) | 0.62 |
| Triglycerides (mg/dL) | 111 (105, 128) | 150 (107, 201) | 0.12 |
| Total cholesterol (mg/dL) | 187 (166, 200) | 198 (173, 225) | 0.41 |
| HDL (mg/dL) | 51 (48, 53) | 47 (40, 60) | 0.52 |
| LDL (mg/dL) | 111 (94, 124) | 110 (93, 133) | 0.87 |
Median (interquartile range) or percent (n) presented
25(OH)D 25-hydroxyvitamin D, TDF tenofovir, AZT zidovudine, EFV efavirenz, PI protease inhibitors, BMI body mass index, HbA1c glycated hemoglobin
aNo available 25(OH)D at week 24 for 3 participants
bData available for 54 patients (19 in sufficiency group, 35 in deficiency group)
Overall, non-responders were somewhat younger (median 42 vs. 48 years, p = 0.27), had lower nadir and baseline CD4+ T lymphocyte counts (baseline median 540 vs. 689 cells/mm3, p = 0.69), and were more likely to use tenofovir (100 % vs. 65 %, p = 0.09) and PIs than responders (38 % vs. 19 %, p = 0.35). Non-responders also had a significantly lower proportion of current zidovudine use (0 % vs. 39 %, p = 0.04) and higher post-repletion fasting glucose levels (91 vs. 82 mg/dL, p = 0.02) (Table 3).
Associations between successful vitamin D repletion and clinical parameters
Among responders, bivariate analysis demonstrated a 17.9 ng/mL higher week 24 serum 25(OH)D level among current efavirenz users (p = 0.01), whereas current PI use was associated with a 16.2 ng/mL lower week 24 serum 25(OH) D level (p = 0.03). After adjusting for age, sex, race, nadir CD4+ T lymphocyte count and baseline 25(OH)D, current efavirenz use was associated with a 21.1 ng/mL increase in week 24 serum 25(OH)D level (p = 0.007, Table 2B).
For the effect of duration of ART exposure, after adjusting for sex, age, nadir CD4+ T lymphocyte count and baseline 25(OH)D, per year use of zidovudine was associated with a 7.1 ng/mL lower week 24 serum 25(OH)D (p = 0.05). For the other ART drugs/classes, per year exposure was associated with lower week 24 serum 25(OH)D levels (tenofovir = −1.55, p = 0.33; efavirenz = −1.36, p = 0.60; PI = −0.17, p = 0.96), although these did not achieve statistical significance.
Among participants who received vitamin D supplementation, there was no significant difference between median baseline CD4+ T lymphocyte count for responders and non-responders (689 vs. 540 cells/mm3, p = 0.69). Compared to baseline, week 24 CD4+ T lymphocyte counts increased in both groups (median at week 24 712 cells/mm3 for responders vs. 656 cells/mm3 for non-responders) (Table 3). Additionally, a significant positive correlation was observed between 24-week changes in CD4+ T lymphocyte counts and 25(OH)D levels among responders (r = 0.44, p = 0.01). After adjusting for age, sex, race and nadir CD4+ T lymphocyte count, each 1.0 ng/mL increase in 25(OH)D during repletion therapy was associated with a 3.3 cell/mm3 increase in CD4+ T lymphocyte count (p = 0.06, Table 4).
Table 4.
Linear models for 24-week CD4+ T lymphocyte count change among participants that achieved vitamin D sufficiency (n = 31)
| Unadjusted model (CI) | Adjusted model (CI) | |
|---|---|---|
| Female sex | −13.02 (−152.29, 126.25) | −57.81 (−186.60, 70.99) |
| Age (years) | 8.82 (3.04, 14.60) | 9.42 (3.67, 15.48) |
| Non-white race/ethnicity | −38.46 (−175.34, 98.42) | −46.00 (−177.50, 85.50) |
| Nadir CD4+ T lymphocyte (per 100 cells/mm3) | 0.32 (−71.24, 71.88) | −8.04 (−73.65, 57.56) |
| Change in 25(OH)D levels (ng/ml) | 4.39 (1.01, 7.76) | 3.25 (−0.05, 6.55) |
25(OH)D 25-hydroxyvitamin D
Bold font implies statistically significant results assuming a 5% significance threshold
Discussion
Despite high rates of reported vitamin D insufficiency in treated HIV infection, little has been published on the relationships between ART use and success or failure of vitamin D supplementation. In this cohort of HIV-infected adults on suppressive ART, we demonstrated high rates of vitamin D insufficiency but success of vitamin D repletion with a standardized regimen similar to repletion success rates reported among HIV-uninfected persons [5].
25(OH)D levels have recently been shown to decline in the 24 weeks following initiation of efavirenz with either lamivudine/zidovudine or emtricitabine/tenofovir, but to stabilize thereafter [28]. With an average time on ART of five years, we were not able to assess changes in 25(OH)D levels related to ART initiation; however, vitamin D insufficiency has also been associated with current efavirenz and nevirapine use irrespective of length of treatment [29–33]. While efavirenz use was more common among participants with baseline vitamin D insufficiency in our cohort, we observed a positive association between duration of efavirenz use and success of vitamin D repletion that is consistent with other studies that did not show an inhibitory effect of efavirenz on success of vitamin D repletion [34]. While elucidating a mechanism for this finding is beyond the scope of this study, it is possible that complex interactions between vitamin D, efavirenz and the cytochrome P450 system [14, 35] allow for enhanced efficacy of supplementation.
Despite potentially enhancing vitamin D metabolism, PI therapy has not consistently been associated with vitamin D insufficiency, and PI monotherapy has been associated with decreased risk of vitamin D insufficiency [36]. At baseline, we observed similar rates of PI use among participants with sufficient and insufficient 25(OH)D levels. Additionally, while we observed a strong correlation between PI use and success of vitamin D repletion, PI use was not associated with success or failure of vitamin D repletion in this analysis after adjusting for confounding factors.
In our analysis, baseline rates of bone disease (osteopenia or osteoporosis) did not vary by 25(OH)D level. In an indigenous, adult Brazilian population, lower 25(OH)D levels also did not predict decreased bone mineral density [37], but lower high-density lipoprotein cholesterol were associated with lower 25(OH)D levels. Given the known interactions of high-density lipoprotein with osteoclasts and osteoblasts [38], we assessed this relationship in our cohort, but did not find an association between high-density lipoprotein cholesterol and bone mineral density in the subset of participants who underwent DXA scanning (data not shown).
Lastly, we observed a positive association between changes in 25(OH)D levels and CD4+ T lymphocyte counts, a finding that has been previously reported [16, 39–41], although not with consistent results [42–44]. Vitamin D supplementation has also been associated with a decreased Th17-to-Tregulatory lymphocyte ratio [43], decreased expression of CD38+ and Ki67+ on memory CD8+ T lymphocytes [45], increased regulatory T lymphocyte numbers [43, 46], enhanced Th2-dependent cytokine expression and decreased Th1-dependent cytokine levels [47], which may help to limit ongoing immune activation in settings such as treated HIV infection. As such, larger studies designed to look at the effects of vitamin D supplementation on T lymphocyte recovery and immune activation are warranted.
This study has several limitations. First, the sample size was based on the primary objective (to assess the effectiveness of a standardized vitamin D supplementation regimen), and was likely too small to fully evaluate relationships between changes in 25(OH)D levels and specific clinical and demographic factors, including specific ART agents and metabolic parameters. Second, the metabolic and immunological parameters we evaluated were restricted to those routinely performed in accordance with Brazilian guidelines. Third, DXA results were available for only a subset of consenting participants, and therefore do not represent a random sample of our larger cohort. Similarly, the findings presented here cannot be generalized to the entire IPEC cohort or Brazilian HIV-infected population for many reasons, including differences among individuals who were enrolled in the cohort over time, possible cohort effects and the non-probabilistic characteristics of the sample included in this study. Finally, we could not stringently assess adherence to vitamin D supplementation due to supplement formulation.
In conclusion, standardized vitamin D3 supplementation was effective in repleting 25(OH)D levels after 24 weeks. Time on efavirenz was positively associated with post-repletion 25(OH)D levels, whereas no significant associations were observed for other antiretroviral agents. The strong correlation and association between increases in 25(OH)D levels and CD4+ T lymphocyte counts supports a benefit of vitamin D supplementation on immunologic recovery, which is particularly relevant to the HIV-infected population.
Acknowledgments
We are indebted to Lucimar Salgado and Debora Barreto for excellent technical support.
The present study is funded by Instituto Nacional de Infectologia Evandro Chagas.
Additional file
Comparison between DXA categories at baseline (defined based on Z-score values). (DOCX 15 kb)
Footnotes
Competing interest
JEL has served as a consultant to GlaxoSmithKline and Gilead Sciences.
Authors’ contributions
LC attended the patients, performed the statistical analysis and drafted the manuscript. PML performed the statistical analysis and drafted the manuscript. SWC, VGV, BG conceived of the study and participated in its design and coordination, and drafted the manuscript. RMH, JSC, JEL conceived of the study and participated in its design, helped with literature review, drafting of the manuscript. LM helped with DXA evaluations. All authors read and approved the the final version of the manuscript.
Contributor Information
Lara Coelho, Email: lara.coelho@ini.fiocruz.br.
Sandra W. Cardoso, Email: sandra.wagner@ini.fiocruz.br
Paula M. Luz, Email: paula.luz@ini.fiocruz.br
Risa M. Hoffman, Email: rhoffman@mednet.ucla.edu
Laura Mendonça, Email: laura.mendonca@uol.com.br.
Valdilea G. Veloso, Email: valdilea.veloso@ini.fiocruz.br
Judith S. Currier, Email: jscurrier@mednet.ucla.edu
Beatriz Grinsztejn, Email: gbeatriz@ini.fiocruz.br.
Jordan E. Lake, Email: JLake@mednet.ucla.edu
References
- 1.Villamor E. A potential role for vitamin D on HIV infection? Nutr Rev. 2006;64:226–33. doi: 10.1111/j.1753-4887.2006.tb00205.x. [DOI] [PubMed] [Google Scholar]
- 2.Haug C, Muller F, Aukrust P, Froland SS. Subnormal serum concentration of 1,25-vitamin D in human immunodeficiency virus infection: correlation with degree of immune deficiency and survival. J Infect Dis. 1994;169:889–93. doi: 10.1093/infdis/169.4.889. [DOI] [PubMed] [Google Scholar]
- 3.Lake JE, Adams JS. Vitamin D in HIV-Infected Patients. Curr HIV/AIDS Rep. 2011;8:133–41. doi: 10.1007/s11904-011-0082-8. [DOI] [PMC free article] [PubMed] [Google Scholar]
- 4.Stein EM, Yin MT, McMahon DJ, Shu A, Zhang CA, Ferris DC, et al. Vitamin D deficiency in HIV-infected postmenopausal Hispanic and African-American women. Osteoporos Int. 2011;22:477–87. doi: 10.1007/s00198-010-1299-x. [DOI] [PMC free article] [PubMed] [Google Scholar]
- 5.Adams JS, Hewison M. Update in vitamin D. J Clin Endocrinol Metab. 2010;95:471–8. doi: 10.1210/jc.2009-1773. [DOI] [PMC free article] [PubMed] [Google Scholar]
- 6.Gonzalez G. Vitamin D, status among healthy postmenopausal women in South America. Dermatoendocrinol. 2013;5:117–20. doi: 10.4161/derm.24807. [DOI] [PMC free article] [PubMed] [Google Scholar]
- 7.Cabral MA, Borges CN, Maia JM, Aires CA, Bandeira F. Prevalence of vitamin D deficiency during the summer and its relationship with sun exposure and skin phototype in elderly men living in the tropics. Clin Interv Aging. 2013;8:1347–51. doi: 10.2147/CIA.S47058. [DOI] [PMC free article] [PubMed] [Google Scholar]
- 8.Brito A, Cori H, Olivares M, Fernanda Mujica M, Cediel G, Lopez de Romana D. Less than adequate vitamin D status and intake in Latin America and the Caribbean:a problem of unknown magnitude. Food Nutr Bull. 2013;34:52–64. doi: 10.1177/156482651303400107. [DOI] [PubMed] [Google Scholar]
- 9.Arantes HP, Kulak CA, Fernandes CE, Zerbini C, Bandeira F, Barbosa IC, et al. Correlation between 25-hydroxyvitamin D levels and latitude in Brazilian postmenopausal women: from the Arzoxifene Generations Trial. Osteoporos Int. 2013;24:2707–12. doi: 10.1007/s00198-013-2366-x. [DOI] [PubMed] [Google Scholar]
- 10.Martini LA, Verly E, Jr, Marchioni DM, Fisberg RM. Prevalence and correlates of calcium and vitamin D status adequacy in adolescents, adults, and elderly from the Health Survey-Sao Paulo. Nutrition. 2013;29:845–50. doi: 10.1016/j.nut.2012.12.009. [DOI] [PubMed] [Google Scholar]
- 11.Haug CJ, Aukrust P, Haug E, Morkrid L, Muller F, Froland SS. Severe deficiency of 1,25-dihydroxyvitamin D3 in human immunodeficiency virus infection: association with immunological hyperactivity and only minor changes in calcium homeostasis. J Clin Endocrinol Metab. 1998;83:3832–8. doi: 10.1210/jcem.83.11.5270. [DOI] [PubMed] [Google Scholar]
- 12.Cozzolino M, Vidal M, Arcidiacono MV, Tebas P, Yarasheski KE, Dusso AS. HIV-protease inhibitors impair vitamin D bioactivation to 1,25-dihydroxyvitamin D. AIDS. 2003;17:513–20. doi: 10.1097/00002030-200303070-00006. [DOI] [PubMed] [Google Scholar]
- 13.Gyllensten K, Josephson F, Lidman K, Saaf M. Severe vitamin D deficiency diagnosed after introduction of antiretroviral therapy including efavirenz in a patient living at latitude 59 degrees N. AIDS. 2006;20:1906–7. doi: 10.1097/01.aids.0000244216.08327.39. [DOI] [PubMed] [Google Scholar]
- 14.Hariparsad N, Nallani SC, Sane RS, Buckley DJ, Buckley AR, Desai PB. Induction of CYP3A4 by efavirenz in primary human hepatocytes: comparison with rifampin and phenobarbital. J Clin Pharmacol. 2004;44:1273–81. doi: 10.1177/0091270004269142. [DOI] [PubMed] [Google Scholar]
- 15.de Luis DA, Bachiller P, Aller R, de Luis J, Izaola O, Terroba MC, et al. Relation among micronutrient intakes with CD4 count in HIV infected patients. Nutr Hosp. 2002;17:285–9. [PubMed] [Google Scholar]
- 16.Aziz M, Livak B, Burke-Miller J, French AL, Glesby MJ, Sharma A, et al. Vitamin D insufficiency may impair CD4 recovery among Women’s Interagency HIV Study participants with advanced disease on HAART. AIDS. 2013;27:573–8. doi: 10.1097/QAD.0b013e32835b9ba1. [DOI] [PMC free article] [PubMed] [Google Scholar]
- 17.Bischoff-Ferrari HA, Giovannucci E, Willett WC, Dietrich T, Dawson-Hughes B. Estimation of optimal serum concentrations of 25-hydroxyvitamin D for multiple health outcomes. Am J Clin Nutr. 2006;84:18–28. doi: 10.1093/ajcn/84.1.18. [DOI] [PubMed] [Google Scholar]
- 18.Hiremath GS, Cettomai D, Baynes M, Ratchford JN, Newsome S, Harrison D, et al. Vitamin D status and effect of low-dose cholecalciferol and high-dose ergocalciferol supplementation in multiple sclerosis. Mult Scler. 2009;15:735–40. doi: 10.1177/1352458509102844. [DOI] [PubMed] [Google Scholar]
- 19.Longenecker CT, Hileman CO, Carman TL, Ross AC, Seydafkan S, Brown TT, et al. Vitamin D supplementation and endothelial function in vitamin D deficient HIV-infected patients: a randomized placebo-controlled trial. Antivir Ther. 2012;17:613–21. doi: 10.3851/IMP1983. [DOI] [PMC free article] [PubMed] [Google Scholar]
- 20.Ginde AA, Scragg R, Schwartz RS, Camargo CA., Jr Prospective study of serum 25-hydroxyvitamin D level, cardiovascular disease mortality, and all-cause mortality in older U.S. adults. J Am Geriatr Soc. 2009;57(9):1595–603. doi: 10.1111/j.1532-5415.2009.02359.x. [DOI] [PubMed] [Google Scholar]
- 21.Melamed ML, Michos ED, Post W, Astor B. 25-hydroxyvitamin D levels and the risk of mortality in the general population. Arch Intern Med. 2008;168:1629–37. doi: 10.1001/archinte.168.15.1629. [DOI] [PMC free article] [PubMed] [Google Scholar]
- 22.Forouhi NG, Luan J, Cooper A, Boucher BJ, Wareham NJ. Baseline serum 25-hydroxy vitamin d is predictive of future glycemic status and insulin resistance: the Medical Research Council Ely Prospective Study 1990–2000. Diabetes. 2008;57:2619–25. doi: 10.2337/db08-0593. [DOI] [PMC free article] [PubMed] [Google Scholar]
- 23.Scragg R, Sowers M, Bell C, Third National H, Nutrition ES. Serum 25-hydroxyvitamin D, diabetes, and ethnicity in the Third National Health and Nutrition Examination Survey. Diabetes Care. 2004;27:2813–8. doi: 10.2337/diacare.27.12.2813. [DOI] [PubMed] [Google Scholar]
- 24.Lai H, Fishman EK, Gerstenblith G, Moore R, Brinker JA, Keruly JC, et al. Vitamin D deficiency is associated with development of subclinical coronary artery disease in HIV-infected African American cocaine users with low Framingham-defined cardiovascular risk. Vasc Health Risk Manag. 2013;9:729–37. doi: 10.2147/VHRM.S50537. [DOI] [PMC free article] [PubMed] [Google Scholar]
- 25.Adams JS, Kantorovich V, Wu C, Javanbakht M, Hollis BW. Resolution of vitamin D insufficiency in osteopenic patients results in rapid recovery of bone mineral density. J Clin Endocrinol Metab. 1999;84:2729–30. doi: 10.1210/jcem.84.8.5899. [DOI] [PubMed] [Google Scholar]
- 26.Kantorovich V, Gacad MA, Seeger LL, Adams JS. Bone mineral density increases with vitamin D repletion in patients with coexistent vitamin D insufficiency and primary hyperparathyroidism. J Clin Endocrinol Metab. 2000;85:3541–3. doi: 10.1210/jcem.85.10.6909. [DOI] [PubMed] [Google Scholar]
- 27.Holick MF, Binkley NC, Bischoff-Ferrari HA, Gordon CM, Hanley DA, Heaney RP, et al. Evaluation, treatment, and prevention of vitamin D deficiency: an Endocrine Society clinical practice guideline. J Clin Endocrinol Metab. 2011;96:1911–30. doi: 10.1210/jc.2011-0385. [DOI] [PubMed] [Google Scholar]
- 28.Havers FP, Detrick B, Cardoso SW, Berendes S, Lama JR, Sugandhavesa P, et al. Change in vitamin d levels occurs early after antiretroviral therapy initiation and depends on treatment regimen in resource-limited settings. PLoS One. 2014;9:e95164. doi: 10.1371/journal.pone.0095164. [DOI] [PMC free article] [PubMed] [Google Scholar]
- 29.Theodorou M, Serste T, Van Gossum M, Dewit S. Factors associated with vitamin D deficiency in a population of 2044 HIV-infected patients. Clin Nutr. 2014;33:274–9. doi: 10.1016/j.clnu.2013.04.018. [DOI] [PubMed] [Google Scholar]
- 30.Allavena C, Delpierre C, Cuzin L, Rey D, Viget N, Bernard J, et al. High frequency of vitamin D deficiency in HIV-infected patients: effects of HIV-related factors and antiretroviral drugs. J Antimicrob Chemother. 2012;67:2222–30. doi: 10.1093/jac/dks176. [DOI] [PubMed] [Google Scholar]
- 31.Conesa-Botella A, Florence E, Lynen L, Colebunders R, Menten J, Moreno-Reyes R. Decrease of vitamin D concentration in patients with HIV infection on a non nucleoside reverse transcriptase inhibitor-containing regimen. AIDS Res Ther. 2010;7:40. doi: 10.1186/1742-6405-7-40. [DOI] [PMC free article] [PubMed] [Google Scholar]
- 32.Welz T, Childs K, Ibrahim F, Poulton M, Taylor CB, Moniz CF, et al. Efavirenz is associated with severe vitamin D deficiency and increased alkaline phosphatase. AIDS. 2010;24:1923–8. doi: 10.1097/QAD.0b013e32833c3281. [DOI] [PubMed] [Google Scholar]
- 33.Mueller NJ, Fux CA, Ledergerber B, Elzi L, Schmid P, Dang T, et al. High prevalence of severe vitamin D deficiency in combined antiretroviral therapy-naive and successfully treated Swiss HIV patients. AIDS. 2010;24:1127–34. doi: 10.1097/QAD.0b013e328337b161. [DOI] [PubMed] [Google Scholar]
- 34.Havens PL, Mulligan K, Hazra R, Flynn P, Rutledge B, Van Loan MD, et al. Serum 25-hydroxyvitamin D response to vitamin D3 supplementation 50,000 IU monthly in youth with HIV-1 infection. J Clin Endocrinol Metab. 2012;97:4004–13. doi: 10.1210/jc.2012-2600. [DOI] [PMC free article] [PubMed] [Google Scholar]
- 35.Wang Z, Schuetz EG, Xu Y, Thummel KE. Interplay between vitamin D and the drug metabolizing enzyme CYP3A4. J Steroid Biochem Mol Biol. 2013;136:54–8. doi: 10.1016/j.jsbmb.2012.09.012. [DOI] [PMC free article] [PubMed] [Google Scholar]
- 36.Cervero M, Agud JL, Torres R, Garcia-Lacalle C, Alcazar V, Jusdado JJ, et al. Higher vitamin D levels in HIV-infected out-patients on treatment with boosted protease inhibitor monotherapy. HIV Med. 2013;14:556–62. doi: 10.1111/hiv.12049. [DOI] [PubMed] [Google Scholar]
- 37.da Rocha AK, Bos AJ, Carnenaz G, Machado DC. Bone mineral density, metabolic syndrome, and vitamin D in indigenous from south of Brazil. Arch Osteoporos. 2013;8:134. doi: 10.1007/s11657-013-0134-3. [DOI] [PubMed] [Google Scholar]
- 38.Ackert-Bicknell CL. HDL cholesterol and bone mineral density: is there a genetic link? Bone. 2012;50:525–33. doi: 10.1016/j.bone.2011.07.002. [DOI] [PMC free article] [PubMed] [Google Scholar]
- 39.Bajaj S, Misra V, Bharghav A, Gupta SK, Sonkar KK, Ibandalin Association of vitamin D levels, lipid profile and intima media thickness in HIV positive patients. Indian J Endocrinol Metab. 2012;16:S411–2. doi: 10.4103/2230-8210.104111. [DOI] [PMC free article] [PubMed] [Google Scholar]
- 40.Ross AC, Judd S, Kumari M, Hileman C, Storer N, Labbato D, et al. Vitamin D is linked to carotid intima-media thickness and immune reconstitution in HIV-positive individuals. Antivir Ther. 2011;16:555–63. doi: 10.3851/IMP1784. [DOI] [PMC free article] [PubMed] [Google Scholar]
- 41.Van Den Bout-Van Den Beukel CJFL, Michels M, Sweep FC, Hermus AR, Bosch ME, Burger DM, et al. Vitamin D deficiency among HIV type 1-infected individuals in the Netherlands: effects of antiretroviral therapy. AIDS Res Hum Retroviruses. 2008;24:1375–82. doi: 10.1089/aid.2008.0058. [DOI] [PubMed] [Google Scholar]
- 42.Bearden A, Abad C, Gangnon R, Sosman JM, Binkley N, Safdar N. Cross-sectional study of vitamin D levels, immunologic and virologic outcomes in HIV-infected adults. J Clin Endocrinol Metab. 2013;98:1726–33. doi: 10.1210/jc.2012-4031. [DOI] [PMC free article] [PubMed] [Google Scholar]
- 43.Giacomet V, Vigano A, Manfredini V, Cerini C, Bedogni G, Mora S, et al. Cholecalciferol supplementation in HIV-infected youth with vitamin D insufficiency: effects on vitamin D status and T-cell phenotype: a randomized controlled trial. HIV Clin Trials. 2013;14:51–60. doi: 10.1310/hct1402-51. [DOI] [PubMed] [Google Scholar]
- 44.Eckard AR, Judd SE, Ziegler TR, Camacho-Gonzalez AF, Fitzpatrick AM, Hadley GR, et al. Risk factors for vitamin D deficiency and relationship with cardiac biomarkers, inflammation and immune restoration in HIV-infected youth. Antivir Ther. 2012;17:1069–78. doi: 10.3851/IMP2318. [DOI] [PMC free article] [PubMed] [Google Scholar]
- 45.Fabre-Mersseman V, Tubiana R, Papagno L, Bayard C, Briceno O, Fastenackels S, et al. Vitamin D supplementation is associated with reduced immune activation levels in HIV-1-infected patients on suppressive antiretroviral therapy. AIDS. 2014;28:2677–82. doi: 10.1097/QAD.0000000000000472. [DOI] [PubMed] [Google Scholar]
- 46.Bang U, Kolte L, Hitz M, Dam Nielsen S, Schierbeck LL, Andersen O, et al. Correlation of increases in 1,25-dihydroxyvitamin D during vitamin D therapy with activation of CD4+ T lymphocytes in HIV-1-infected males. HIV Clin Trials. 2012;13:162–70. [DOI] [PubMed]
- 47.Boonstra A, Barrat FJ, Crain C, Heath VL, Savelkoul HF, O’Garra A. 1alpha,25-Dihydroxyvitamin d3 has a direct effect on naive CD4(+) T cells to enhance the development of Th2 cells. J Immunol. 2001;167:4974–80. doi: 10.4049/jimmunol.167.9.4974. [DOI] [PubMed] [Google Scholar]