Abstract
Influenza virus, the causative agent of flu, enters the host cell by endocytosis. The low pH encountered inside endosomes triggers conformational changes in the viral glycoprotein hemagglutinin (HA), that mediate fusion of the viral and cellular membranes. This releases the viral genome into the cytoplasm of the infected cell, establishing the onset of the replication cycle. To investigate the structural basis of HA-mediated membrane fusion, a number of techniques have been employed. These include X-ray crystallography, which has provided atomic models of the HA ectodomain in its initial (pre-fusion) state and of part of HA in its final (post-fusion) state. However, this left an information deficit concerning many other aspects of the fusion process. Electron microscopy (EM) approaches are helping to fill this void. For example, influenza virions at neutral pH have been imaged by cryo-EM and cryo-electron tomography (cryo-ET); thin section EM has shown that influenza viruses enter the cell by endocytosis; the large-scale structural changes in HA when virions are exposed to low pH (pre-fusion to post-fusion states) have been visualized by negative staining and cryo-EM; acidification also induces structural changes in the M1 matrix layer and its separation from the viral envelope; intermediate HA conformations between its pre- and post-fusion states have been detected by cryo-ET supplemented with subtomogram averaging; and fusion of influenza virions with liposomes has been visualized by cryo-ET. In this review, we survey EM-based contributions towards the characterization of influenza virus-mediated membrane fusion and anticipate the potential for future developments.
Keywords: Influenza virus, viral fusion, hemagglutinin, cryo-electron microscopy, cryo-electron tomography, subtomogram averaging
Introduction
Influenza virus is the causative agent of influenza (commonly known as “the flu”), an illness characterized by a sudden onset of high fever, cough, headache, muscle and joint pain, unwell feeling, sore throat and runny nose. It is estimated that influenza virus infects every year 5%–10% of the adult population world-wide and 20%–30% of the children. Even though most patients recover from flu symptoms within a week without receiving medical attention, the World Health Organization estimates that these infections result in 3 to 5 million cases of serious illness and 250,000 to 500,000 deaths [1]. Moreover, different strains of the virus vary in their pathogenicity and ‘pandemic’ strains such as the lethal ‘Spanish flu’ of 1918 can take a toll of many millions [2].
Due to its medical importance, influenza virus has been the focus of extensive research aimed at understanding the molecular mechanisms that govern infection. Fusion of the viral and cellular membranes – a critical step in the cell entry pathway, whereby the viral genome is delivered into the host cell cytoplasm - has been among the mechanisms studied. It is now known that the fusion process is mediated by the viral hemagglutinin (HA) glycoprotein, and antibodies directed against HA can inhibit fusion [3]. However, since there are a variety of immunologically distinct HA subtypes, there is a need to develop new vaccines annually, directed against what are predicted to be the most abundant strains in the coming year. It follows that vaccine effectiveness is highly dependent on the accuracy of these predictions. In addition to aiding in vaccine design, an improved understanding of the mechanism of HA-mediated fusion should contribute to the design of drugs to suppress influenza infection in a longer-lasting way. Furthermore, there is mounting evidence that the structural changes occurring in HA during membrane fusion have close parallels in the fusogens of other enveloped viruses, including HIV and Ebola virus [4]. Accordingly, an improved understanding of influenza fusion should have broader implications for the field of viral infections.
In this review, we summarize the contributions of electron microscopy (EM) towards understanding influenza virus fusion. Briefly, cryo-electron microscopy (cryo-EM) and cryo-electron-tomography (cryo-ET) have shown the structure of influenza virions at neutral pH in close-to-native conditions; thin section EM has shown that influenza viruses enter the cell by endocytosis; negative staining and cryo-EM have shown the changes in the HA glycoproteins when virions are exposed to low pH; cryo-ET combined with subtomogram averaging has unraveled intermediate conformations of HA in its transition towards the post-fusion conformation; and cryo-ET of influenza virions fusing with liposomes has provided a system to image the fusion process.
Structure of the virion
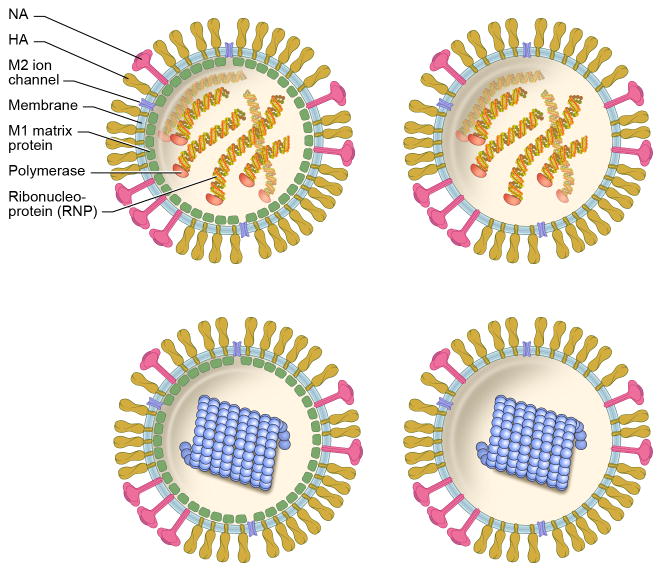
Influenza virus, with its segmented, single-stranded, negative sense RNA genome, is a member of the Orthomyxoviridae family [5]. The viral genome consists of 8 segments of RNA, each of which is coated with nucleoprotein (NP) and binds a copy of the heterotrimeric viral polymerase, forming a ribonucleoprotein (RNP). Influenza A and B virions, the two types or genera for which seasonal vaccines are offered every year, have two types of glycoproteins on their surface (Figure 1): HA, which is primarily responsible for cell entry, and neuraminidase (NA), which is involved in virus release from the host cell. Influenza A has 18 known serological subtypes of HA (H1 to H18) and 11 subtypes of NA (NA1 to NA 11) [6]. Influenza virus nomenclature may specify virus type (A, B or C), species from which it was isolated (if non-human), location where it was isolated, isolate number, isolate year, and HA and NA subtype (only for influenza A viruses). For example, the strain A/NewCaledonia/20/99 (H1N1), corresponds to a type A virus, isolated in New Caledonia, isolate number 20, in 1999, and contains subtype 1 HA and subtype 1 NA.
Figure 1. Model of Influenza A virionsirions.
Models of different classes of influenza virions: with M1 matrix (left panels); or without it (right panels); and RNP-containing (top) or solenoid-containing (bottom; blue). Virions with an M1 layer and RNPs (top left; these particles can be spherical or filamentous) account for ~93% of virions in the X-31 preparations studied by Harris et al., 2006 [27]; virions without M1 but with RNPs, for ~5% (top right); virions with M1 and solenoid, for ~1% (bottom left); and virions without M1 but with solenoid, for ~1% (bottom right). Note that ~50% of the particles contain a full set of 8 RNPs [32], and that, in addition to the polymerase, the RNPs are composed by RNA and NP. The composition of the solenoids is unclear, and is discussed in the text.
A and B virions both possess a third integral membrane protein, named M2 in type A and BM2 in type B, which is an ion channel that plays an essential role during infection (see below). Influenza B virions also have another protein, NB, putatively also an ion channel. Underlying the envelope in most virions (~90% in type A) is a layer of the M1 matrix protein.
Cryo-EM provides a uniquely powerful way to image biological samples in their native states [7]. Soon after this technique was introduced [8, 9] it was used to image influenza A and B virions at neutral pH [10], showing their pleomorphism. While the latter are mainly spherical and ~130 nm in diameter, X-31 influenza A virions are less uniform in size and shape and filamentous particles can be found in addition to spherical ones (other influenza A virions, like the Udorn strain are only filamentous). The variability of influenza virions also applies to their internal contents, which cryo-EM images suggest to contain varying numbers of RNPs.
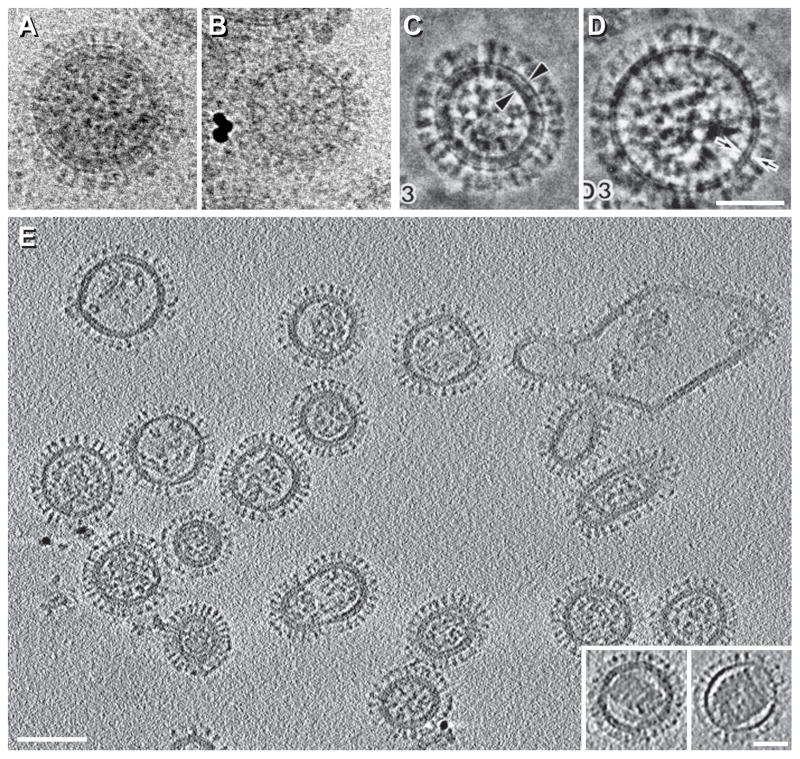
Using a higher resolution instrument, it was found that virions have two types of envelope arrangement, corresponding to the presence or absence of an M1 layer underlying the membrane (e.g. Figures 2A & B [11]). A similar conclusion was reached when influenza virions were imaged by phase plate-assisted cryo-EM (Figures 2C & D, [12]), which allows in-focus high-contrast imaging [7].
Figure 2. Structure of influenza virions by cryo-EM and cryo-ET.
A–D, Influenza virions imaged in conventional cryo-EM projections (A & B) or in phase-plate-enhanced cryo-EM projections (C & D). These virions either contain an M1 matrix layer underneath the viral envelope (A & C) or lack it (B & D). The X-31 (H3N2) strain was used for A & B and the A/NewCaledonia/20/99 (H1N1) strain was used for C & D. E, cryo-ET section of virions at neutral pH (X-31 strain). The insets at bottom right show virions containing solenoids. A & B are reprinted from Fontana and Steven, 2013, At Low pH, Influenza Virus Matrix Protein M1 Undergoes a Conformational Change Prior to Dissociating from the Membrane, Journal of Virology 87(10):5621-8, with permission from the American Society for Microbiology [13]; C & D are reprinted from Yamaguchi et al., 1998, Zernike phase contrast electron microscopy of ice-embedded influenza A virus, Journal of Structural Biology 162(2):271-6, with permission from Elsevier [12]; E is reprinted from Harris et al., 2006, Influenza virus pleiomorphy characterized by cryoelectron tomography, PNAS 103(50):19123-7, with permission from the National Academy of Sciences of the USA [27]. Bars, 50 nm in A–D and inset of E; 100 nm in E.
Despite the superior preservation of native structure in cryo-EM, differing interpretations were given with respect to images of the M1-layer/membrane complex. Seeking to clarify the conflicting accounts and in particular to understand the effects on the images of differing focal settings, we mixed influenza virions with liposomes (used as a lipid bilayer control) and imaged them first by cryo-EM at two different defoci and subsequently by cryo-ET. These experiments established that the two kinds of envelopes observed in influenza virions at neutral pH correspond to a full lipid bilayer with embedded glycoproteins, with and without a closely associated, 4-nm-thick sheet of M1 protein [13].
A regular packing of M1 molecules has not been directly demonstrated in spherical influenza virions, although a model has been proposed based on the crystal structure [14]. However, in Udorn virions, which are filamentous, the M1 layer forms a cylindrical sheet that exhibits a helical arrangement, as shown by cryo-EM of virions that had been treated with bromelain to remove the glycoprotein ectodomains, to increase thereby the contrast of the M1 layer [15].
The overall picture then is that: (i) M1 is non-essential for morphogenesis, as evidenced by the subpopulation of otherwise seemingly normal virions that lack such a layer. This is further supported by the fact that only HA and NA (and not M1) are required for the assembly and budding of plasmid-derived virus-like particles [16]. (ii) The M1 layer has nevertheless been implicated in recruiting the RNPs to the assembly site [17], and has been suggested to act as an endoskeleton during fusion [18] (discussed further below), and to be involved in unpacking of the viral genome after fusion has taken place [19, 20].
The pleomorphic nature of influenza virions has prevented 3D reconstruction by the traditional approach of combining differing projections of many identical particles [21]. Cryo-ET overcomes this limitation by collecting a series of projection images of the selfsame specimen at increasing tilt angles, and combining them computationally to obtain a 3D reconstruction of an individual virion [22]. However, the resolution of the tomograms is anisotropic and the high noise level of the primary tomogram limits the resolution to ~ 4 – 5 nm. This limitation is partially solved by employing “sub-tomogram averaging”, whereby multiple identical copies of the structure of interest are extracted from the tomograms, aligned, and finally averaged [23].
Imaged by cryo-ET (Figures 2E), influenza A virions (X-31 strain) can be classified according to shape (filamentous or spherical), the presence or absence of an M1 matrix layer, and whether the interior houses rod-like particles (RNPs) or a single helical solenoid. Solenoids are plentiful in some influenza strains (in ~15–25% of the virions from the A/WSN/33, H1N1 strain, and in ~50% of the virions from the A/USSR/90/77, H1N1 strain [24]). In X-31, the strain used in most studies by cryo-ET, they occur in ~ 2% of virions. The molecular nature of these solenoids (insets in Figure 2E), is uncertain and two interpretations have been given. In one, they are thought to consist of M1 protein [25]; in the other, they have been proposed to be an alternative assembly form of RNP components. The former idea is supported by positive labeling with anti-M1 antibodies, but solenoids were also labeled with antibodies against NP and the polymerase complex [26]. Against the former idea is the observation of virions containing a full layer of M1 protein but with a solenoid inside it (Figure 2E, left inset [27]). To explain these particles in the M1-as-solenoid scenario, it is necessary to invoke additional packaging of M1 in substantial amounts beyond the sub-membrane sheet.
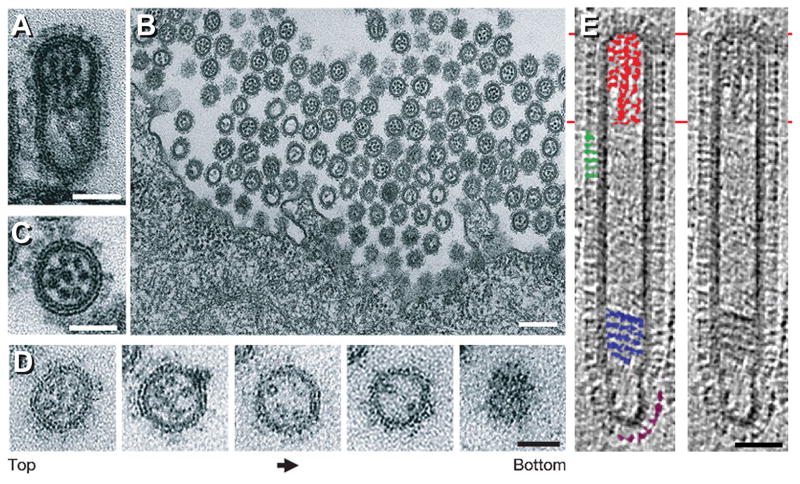
Returning to the (non-controversial) rod-like RNPs, (compare Figure 2E vs. 3A–D) their cross-sections in cryo-tomograms generally show a C-shaped motif ~14 nm in diameter that is consistent with the 2-stranded twisting arrangement envisaged in earlier models [28], which has been recently confirmed by cryo-EM reconstruction of purified [29] and recombinant RNPs [30]. Sectioned longitudinally the rods are seen to vary in length, again consistent with their containing RNAs of different sizes [28].
Figure 3. Budding of influenza virions.
A–D, thin section EM of budding influenza virions showing RNPs organized in a 7+1 arrangement at the viral leading edge (A/WSN/33, H1N1 virions budding from Madin–Darby canine kidney (MDCK) cells after 10 hrs. of infection). A, longitudinal section. B & C, cross-sections. D, serial cross-sections, each ~60 nm thick. Left, leading end (top) of the budding virion; right, bottom of the virion. E, longitudinal tomographic section of a filamentous influenza virion (Udorn strain). In the left panel, some HA spikes are marked green; some NAs purple; RNPs at the leading end, red; and a multi-layered coil, blue. A–D are reprinted from Noda et al., 2006, Architecture of ribonucleoprotein complexes in influenza A virus particles, Nature 439(7075):490-2, with permission from Macmillan Publishers Ltd. [31]; E is reprinted from Calder et al., 2010, Structural organization of a filamentous influenza A virus, PNAS 107(23):10685-90, with permission from the National Academy of Sciences of the USA [15]. Bars, 50 nm in A & C–E; 200 nm in B.
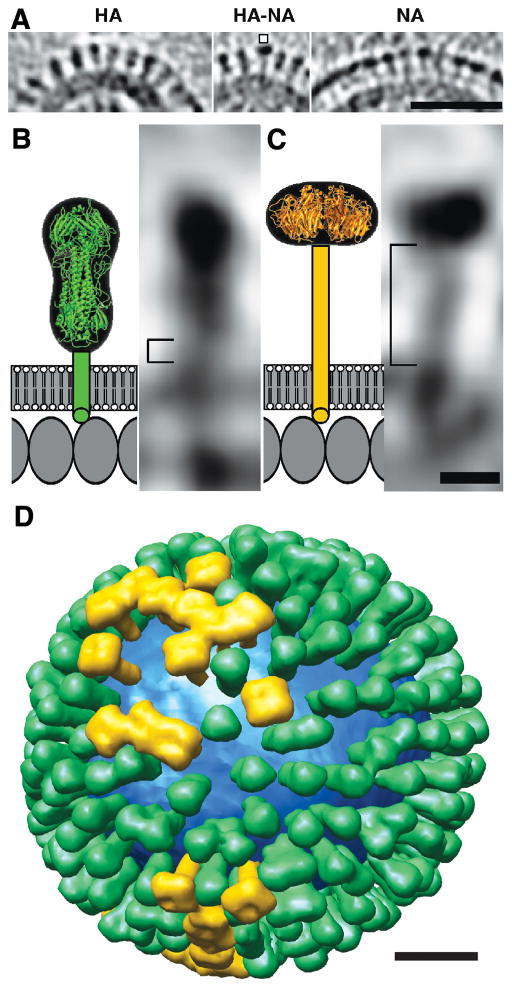
The RNPs from most budding virions are seen in a 7+1 arrangement found at the leading end of the nascent particles (Figures 3A–D [31]). This observation is in agreement with the fact that over 50% of influenza virions incorporate a full set of 8 RNA molecules, as shown by multicolor single-molecule fluorescent in situ hybridization [32]. Cryo-ET of filamentous virions (Udorn strain) further showed that at the opposite end to the RNPs, NA glycoproteins cluster, likely facilitating the cleavage of sialic acid from the cells by NA during virion release (Figure 3E [15]). The clustering of NAs was also reported in X-31 virions by immunoelectron microscopy, using antibodies against HA and NA [33], and by cryo-ET (Figure 4A [27]). In contrast to the RNPs from filamentous virions, the RNPs of spherical virions are seen in tomographic sections as irregular ensembles of rod-like densities in which it is difficult to distinguish the boundaries between the RNPs. This suggests that in these particles, the 7+1 RNP arrangement – putatively, initially present - may have been lost at some point after viral budding [27].
Figure 4. Distributions and shape-based differentiation of HA and NA spikes.
A, HA cluster (left); single NA (marked) in a cluster of HAs (center); and cluster of mainly NA spikes (right). B & C, schematic models (left) and tomographic sections of a single HA (B) and NA (C). (D) Model of the distribution of HA (green) and NA (gold) on a single influenza virion. The lipid bilayer is blue. Figure is reprinted from Harris et al., Influenza virus pleiomorphy characterized by cryoelectron tomography, 2006, PNAS 103(50):19123-7, with permission from the National Academy of Sciences of the USA [27]. Bars, 50 nm in A; 5 nm in B & C; 20 nm in D.
Of special interest for influenza fusion, individual glycoproteins are recognized in the tomograms, and HA molecules, which have a characteristic “peanut” shape, are distinguished from NAs, with a “mushroom” shape (Figures 4A–C), allowing the generation of models of the distribution of the surface proteins (Figure 4D [27, 34]).
Cryo-ET has also been used to visualize elongated Udorn viral particles budding from infected cells [35]. These particles were seen as long filaments (often > 10 μm), mostly lacking RNPs at their leading ends. Since filamentous virions (post-budding) purified in the same experiment did contain RNPs, these observations suggested the existence of an alternative morphogenetic pathway for budding particles [35]. Cryo-ET combined with subtomogram averaging has also allowed characterizing of the labeling of broadly neutralizing antibodies on intact virions [36]. This study found that most HA trimers are able to bind antibodies that target conserved epitopes on the stem, an observation that is encouraging with respect to the potential for such antibodies in broad-spectrum vaccines [36].
HA mediates influenza virus fusion
Viral fusion proteins fall into three structural classes [4]. The differences between them are already apparent at the level of secondary structure of the fusion subunit. Class I glycoproteins have a central 3-stranded á-helical coiled-coil; class II glycoproteins are mostly composed of â-strands; and class III glycoproteins have a combination of helices and strands. In their pre-fusion conformations, class I and III glycoproteins are trimeric whereas class II glycoproteins are dimeric, but all three classes are trimeric after the fusion-associated changes take place.
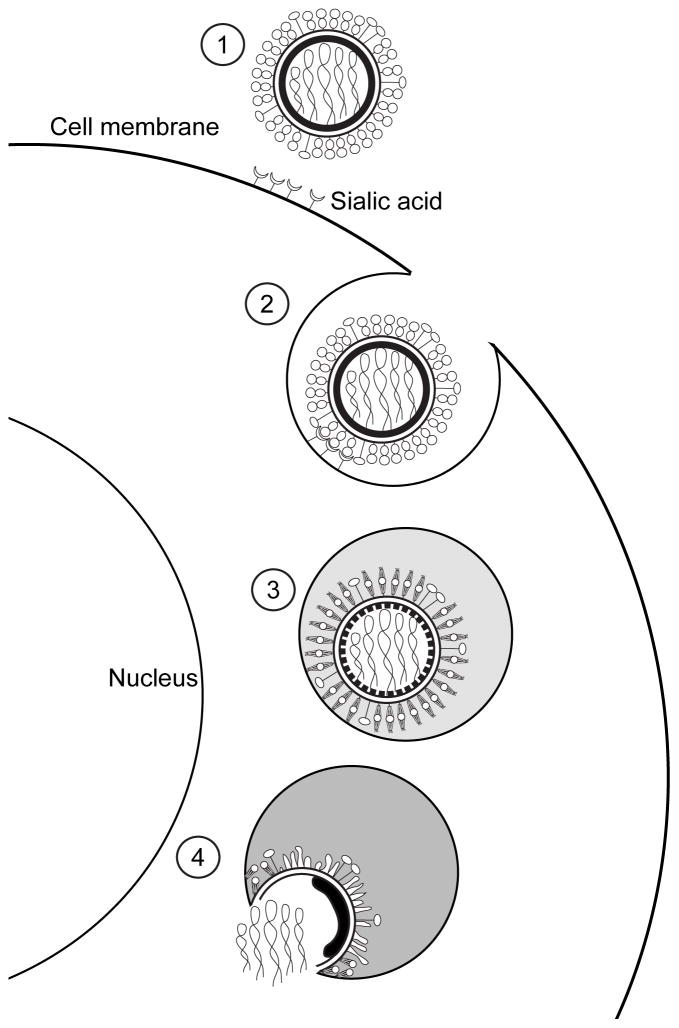
HA, a prototype for class I glycoproteins in general, is initially synthesized as a trimeric precursor (HA0) that is activated by a cellular protease, yielding HA1 (the receptor-binding subunit) and HA2 (the fusion subunit), which remain disulfide-linked. After binding to sialic acid (the receptor) on the surface of the host cell, influenza virions are internalized by endocytosis (Figure 5). A protein pump in the endosomal membrane then lowers the pH inside the compartment containing the virion. This has two effects. First, the pH also falls inside the virion, as protons can enter via the M2 ion channel; this causes the M1 layer to detach, rendering the membrane more malleable and conducive to fusion [13, 19, 37]. Second, the low pH triggers conformational changes in HA that cause the viral and cellular membranes to fuse [38, 39]. Of note, HA interaction with sialic acid is not required for HA-mediated fusion, which simplifies the study of influenza fusion in vitro.
Figure 5. Influenzanza virus entry.
After recognizing the sialic acid at the surface of the target cell (1), influenza virions enter the cell by endocytosis (2). At the endosomes, the low pH triggers conformational changes on the HA molecules and the M1 layer (3), that will allow the merging of the viral and cellular membranes and the release of the viral genome inside of the cell (4).
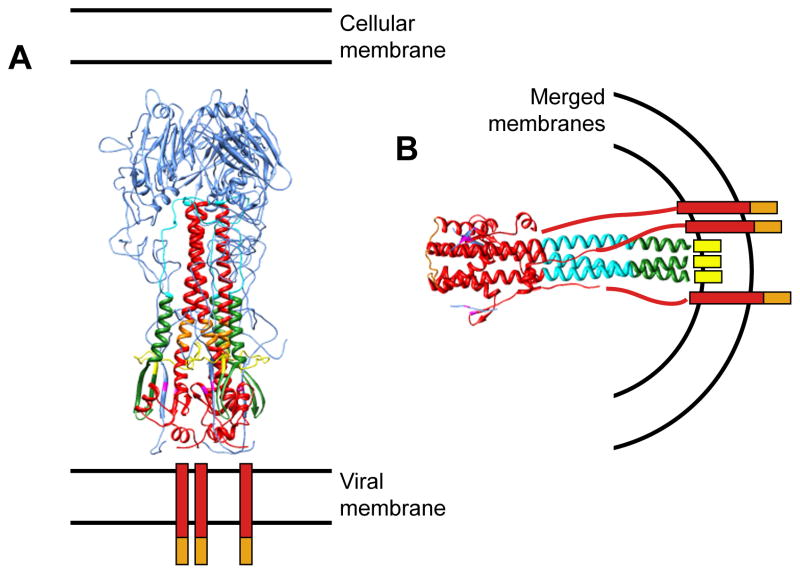
X-ray crystallography studies have provided atomic models of the HA ectodomain at neutral pH [40] and separate low pH structures for HA1 [41] and for part of HA2 [42]. At neutral pH, most of the HA1 moiety locates to the membrane-distal domain of the peanut where the three copies form a globular region of antiparallel â-sheets that contains the receptor-binding sites; and the á-helices of the HA2 subunits form a triple-stranded coiled-coil in the center of the molecule, accounting for most of the membrane-proximal domain (Figure 6A [40]). In this structure, the fusion peptides (an apolar region of the fusion subunit that embeds in the target membrane during the fusion process) are hidden inside the HA2 subunits. While the HA1 subunits retain their structure at low pH [41], the HA2 subunits undergo a major refolding that reorganizes the HA2 trimer into a six-helix bundle composed of three hairpins, placing the fusion peptides on the same side as the transmembrane domains (Figure 6B [42]). The conformational change of HA2 has been suggested to provide the energy needed for membrane fusion, whereby the molecule transitions from one local free-energy minimum to another, deeper, one [43]. The exact number of HA trimers required for fusion is currently under debate, although it is widely accepted that several are required [44], and it has been suggested that trimers binding near, but not actually at, the fusion site also contribute to the process [45, 46].
Figure 6. Conformational states of HA.
Atomic model of HA ectodomain at neutral pH after cleavage into HA1 and HA2 (A; PDB 3hmg), and of HA2 at low pH (B, PDB 1htm). HA1 is shown in blue; HA2 in red, with amino acids 1 to 23 (fusion peptide) in yellow; amino acids 24 to 54, green; amino acids 55 to 76 (B loop/helix), cyan; and amino acids 106 to 112 (kinked loop/helix), orange. The transmembrane regions are represented as red bars, the cytoplasmic tails as orange bars, and the fusion peptides in the post-fusion conformation as yellow bars.
HA activation by acidic pH: evidence from thin sections and negative staining
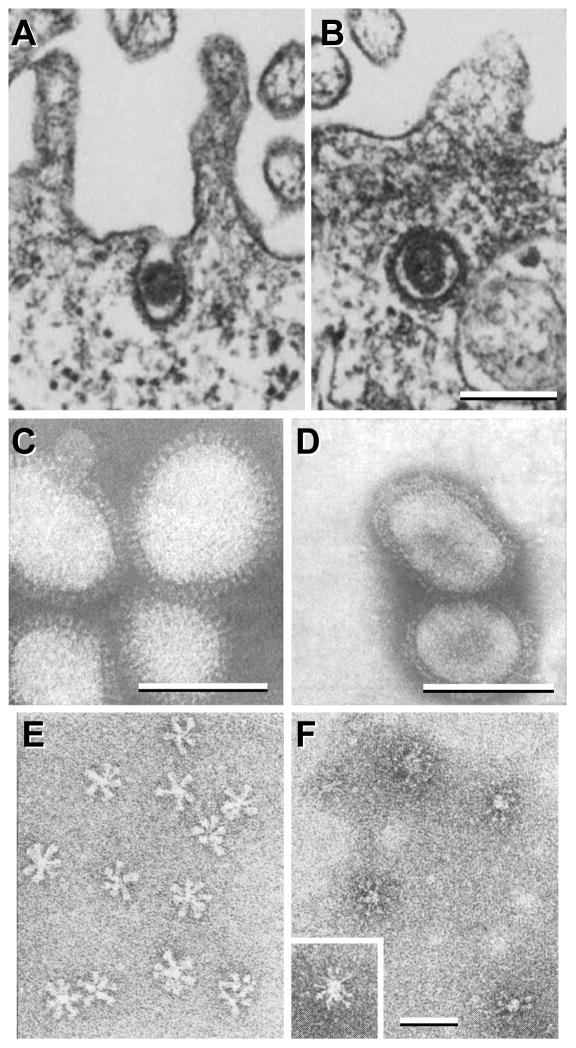
Soon after it was found that Semliki Forest Virus is endocytosed into clathrin-coated vesicles and thus sequestered into intracellular vacuoles and lysosomes where fusion of the viral and cellular membranes takes place [47], it was shown by EM of thin plastic sections that influenza virus follows a similar pathway (Figures 7A & B [48]). This process could be blocked by ammonium chloride (which prevents the acidification of the endosomes), proving that low pH is key for the fusion process. Furthermore, enveloped virions were shown to fuse (non-physiologically) with the plasma membrane if the pH of the medium was lowered [48]. Understanding of this entry process has grown significantly since these first findings, and recent developments of real-time single-virion imaging techniques and of dominant-negative mutants that selectively inhibit specific endocytic pathways have shown that influenza virions can use, in addition to clathrin-mediated entry, several clathrin-independent pathways [49]. For example, thin section EM combined with fluorescence microscopy and the use of drugs to inhibit specific entry processes, has been used to show that filamentous influenza viruses (Udorn strain) mainly enter the cells by macropinocytosis, one of the multiple endocytic pathways that exist in cells [17]. Since clinical isolates typically have a filamentous morphology while many laboratory-passaged influenza strains are approximately spherical, it may be that macropinocytosis is the predominant entry pathway for most strains of human influenza virus [17].
Figure 7. Thin section and negative stain EM of influenza virions and HA rosettes.
A–B, influenza virions entering mammalian cells using clathrin-coated vesicles (fowl plague virus strain). C–F, negative stain EM of influenza virions (C & D) and of HA rosettes (E & F) at neutral (C & E) and low pH (D & F). The X-49 strain (H3N2) was used for C & D, and the X-31 strain (H3N2) was used for E & F. A & B are reprinted from Matlin et al., 1981, Infectious entry pathway of influenza virus in a canine kidney cell line, Journal of Cell Biology 91(3):601–613, with permission from the Journal of Cell Biology [48]; C & D are from Ruigrok et al., 1984, Archives of Virology 82(3):181–194, reprinted with permission from Springer Science and Business Media [50]; E & F are reprinted from Ruigrok et al., 1986, Electron microscopy of the low pH structure of influenza virus haemagglutinin, EMBO Journal 5(1):41–49, with permission from EMBO [52]. Bars, 200 nm for A & B; 50 nm for C–F.
To study the fusion process in a controlled environment, negative stain EM has been used to observe influenza virions fusing with liposomes (artificial membranes). In this way, Ruigrok et al. [50] (Figures 7C & D) showed that the HA glycoproteins become disordered at low pH. Fusion was studied by observing virus-liposome complexes at low pH, i.e. 5.5 or lower, which was found to be a fast and efficient process, and showed that no other cellular proteins were required [51]. The structural changes in “rosettes” (clusters of purified HA trimers associating through their hydrophobic regions) were also observed by negative staining at low pH, which showed a thinning of the molecules (Figures 7E & F; [52]).
HA activation by acidic pH: evidence from cryo-EM
The superior preservation of native structures in vitrified specimens encouraged the use of cryo-EM to further characterize the conformational changes in HA at low pH. Combined with liposome-binding measurements, it was shown that on virions treated for 5 min at pH 5.0 and 37°C, HA adopts a highly disorganized arrangement that correlates with exposure of the hydrophobic fusion peptides. However, HA disorganization was not observed when the low pH incubation took place at 0°C [53]. Combined with protease digestion to detect the exposure of fusion peptides and fluorescence microscopy-monitored fusion assays between erythrocytes and eukaryotic cells expressing HA glycoproteins on their surface, it was found that HA molecules from different strains (the H3 HA from the X-31 strain and the H2 from A/Japan/305/57) respond differently to low pH: while H2 virion morphology is unchanged after 15 min of exposure to pH 4.9 and 37°C, that of H3 virions is greatly affected, resulting in a disorganization of the glycoprotein array and aggregation of the sample (both effects caused by the conformational changes of HA [54]). A similar EM experiment studying H1 virions (A/PR/8/34, Figure 8), showed that their H1 HAs also respond slowly to low pH changes, as their spikes exhibited no major morphological changes when exposed to pH 4.9 at 30°C until they had been incubated for 30 min [55]. These changes correlated with loss of the fusion activity of virions incubated at low pH in the absence of a target membrane, suggesting they were caused by HA transitioning from a fusion-capable pre-fusion conformation to a fusion-incapable post-fusion conformation.
Figure 8. HA activation by acidic pH imaged by cryo-EM.
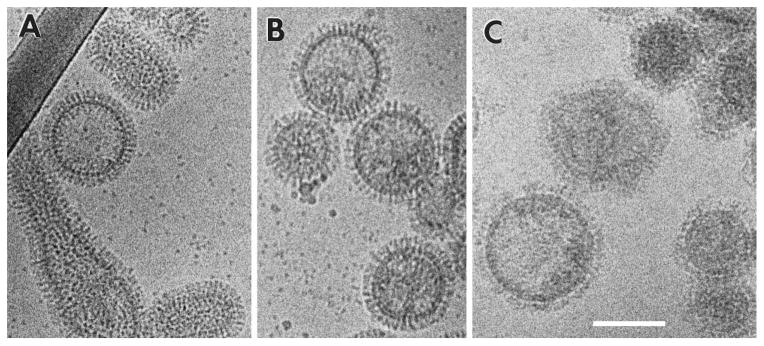
Cryo-EM of A/PR/8/34 virions (H1N1) at neutral pH (A), after 10 min of incubation at pH 4.9 (B) and after 68 min at pH 4.9 (C). Figure reprinted from Shangguan et al., 1998, Morphological Changes and Fusogenic Activity of Influenza Virus Hemagglutinin, Biophysical Journal 74(1):54–62, with permission from Elsevier [55]. Bar, 100 nm.
HA activation by acidic pH: evidence from cryo-ET
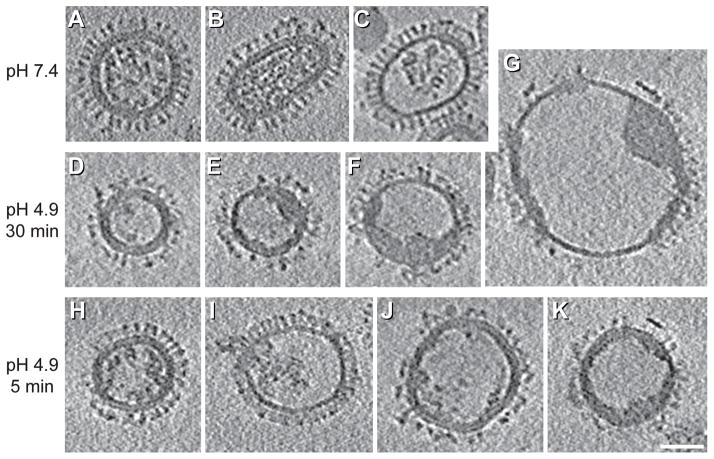
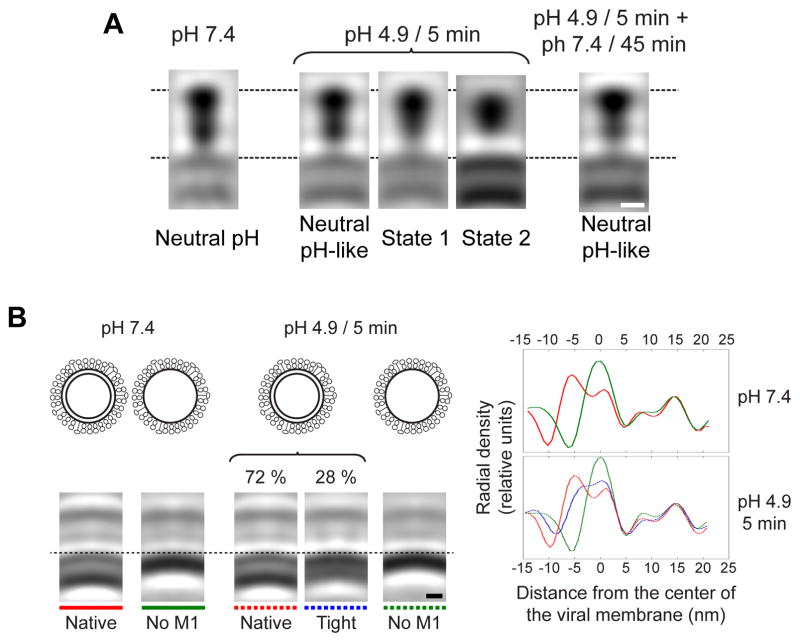
When X-31 virions are exposed to the optimal pH for fusion (4.9) for 30 min in the absence of a target membrane (conditions in which the virions are no longer fusion-capable and their HAs are in the post-fusion state [54]), dramatic changes in morphology are revealed by cryo-ET (compare Figures 9A–C with D–G). The HA spikes become conspicuously disorganized, the RNPs coagulate on the interior surface of the virion, and larger particles representing fused virions appear [56]. Additionally, the low pH induces detachment of the M1 layer from the envelopes of X-31 virions (which are mostly spherical) and of Udorn virions, causing the loss of their originally filamentous shape [15, 56]. Imaged after 5 min at pH 4.9, X-31 virions showed intermediate morphologies between those assumed at neutral pH and at pH 4.9/30-min (Figures 9H–K). In this way, it was possible by subtomogram averaging to capture two intermediate conformations of HA spikes en route to their post-fusion conformation (Figure 10A [56]). In the first of these intermediates (State 1), the HA molecule has a thinner membrane-proximal domain (formed by HA2 and the N- and C-terminal segments of HA1), while it retains the overall length and the maximum width at the membrane-distal domain (comprising residues 50 to 261 of HA1) of the neutral-pH conformation. In the second intermediate (State 2), the molecule is shorter and wider than in the neutral-pH structure and the membrane-proximal domain is no longer resolved. As evidenced by restoration of the neutral pH-like conformation when pH 4.9/5-min particles were subsequently incubated at neutral pH for 45 min (Figure 10A, right panel), these conformational switches are reversible. Combined with previous indications for the existence of intermediate steps in the HA pathway to its post-fusion conformation [57] and that structural rearrangements of the H1 subunits occur early after exposure to low pH [58], these intermediate conformations appear to reflect an outwards movement of the fusion peptide and a rearrangement of the HA1 subunits, respectively [56].
Figure 9. Influenza changes at low pH by cryo-ET.
Central sections of tomograms of influenza virions (X-31, H3N2) at neutral pH (A–C), and after incubation at pH 4.9 for 30 min (D–G) or for 5 min (H–K). Images are reprinted from Fontana et al., 2012, Structural changes in Influenza virus at low pH characterized by cryo-electron tomography, Journal of Virology 86(6):2919-29, with permission from the American Society for Microbiology [56]. Bar, 50 nm.
Figure 10. Intermediate conformations of HA and M1.
A, sagittal sections through averaged density maps of the HA glycoprotein from influenza virions at pH 7.4 (left), 4.9/5-min virions (three central panels), and from 4.9/5-min particles subsequently incubated at neutral pH for 45 min (right). B, top left, schematic diagrams of the virion types analyzed, i.e., with and without M1 layers at neutral pH and pH 4.9. Bottom left, sagittal sections through the subtomogram averages obtained for the respective virion types (according to the overlying diagrams). Right, radial density profiles along the center lines of the subtomogram averages. The curves are color coded in accordance with the subtomogram averages. Positive distances from the center of the viral membrane represent regions outside the virion; negative values represent regions inside the virion. A is reprinted from Fontana et al., 2012, Structural changes in Influenza virus at low pH characterized by cryo-electron tomography, Journal of Virology 86(6):2919-29, with permission from the American Society for Microbiology [56]; B is reprinted from Fontana and Steven, 2013, At Low pH, Influenza Virus Matrix Protein M1 Undergoes a Conformational Change Prior to Dissociating from the Membrane, Journal of Virology 87(10):5621-8, with permission from the American Society fro Microbiology [13]. Bars, 5 nm.
The low pH in the endosomes also results in acidification of the virion interior, which is mediated by the passage of protons through the M2 ion channel prior to membrane fusion. This acidification has been correlated with detachment of the M1 layer from the viral envelope and release of the RNPs into the cytoplasm of the infected cell [19, 20]. In low pH-treated virions, the M1 layer detachment has been described as a process in which the M1 layer peels away from the viral envelope (in trypsin-treated Udorn virions incubated for 10 min at pH 4.9 and 20°C [15]) and as a process by which the M1 molecules dissociate from each other and from the viral membrane and coagulate together with the RNPs (in X-31 virions treated for 5 or 30 min at pH 4.9 and 20°C [13]). In the latter system, subtomogram averaging of M1/envelope structure of pH 4.9/5-min virions has provided structural insights of the intermediate conformations adopted by M1 (Figure 10B). In these experiments, the M1-envelope complex was found to transit through a state that is thinner than its native one (the “tight” conformation), prior to the dissociation of the M1 molecules. This state was suggested to be a manifestation of a conformational change in the M1 protein, making the M1 layer thinner and/or move it closer to the viral envelope [13]. It was hypothesized that the dissociation of the M1 molecules would then render the viral envelope more pliable and conducive to fusion, and this has been confirmed by nanoindentation experiments using atomic force microscopy [59].
Pseudo-infection: interactions of influenza virus with liposomes
As the maximum thickness of samples that can be imaged by cryo-EM/ET is limited to several hundreds of nanometers, imaging influenza fusion inside intact eukaryotic cells is not feasible. However, new strategies are starting to allow researchers to image intracellular events in detail. For example, the combination of fluorescent microscopy (allowing to follow a process in vivo and to stop it at a specific moment by high-pressure freezing), focused ion beam milling (to thin the sample around the process of interest), and cryo-ET can help to study the fusion process inside cells in cryogenic conditions [60]. However, this strategy is time-consuming and limited in the number of fusion events that are captured. As a stepping-stone towards observing the fusion of influenza virions with a target membrane, researchers have studied virion/liposome complexes. This approach allows the simulation of virus-cell interactions in a system that can be directly studied by EM with full control of the environmental parameters (e.g. pH, temperature and incubation times).
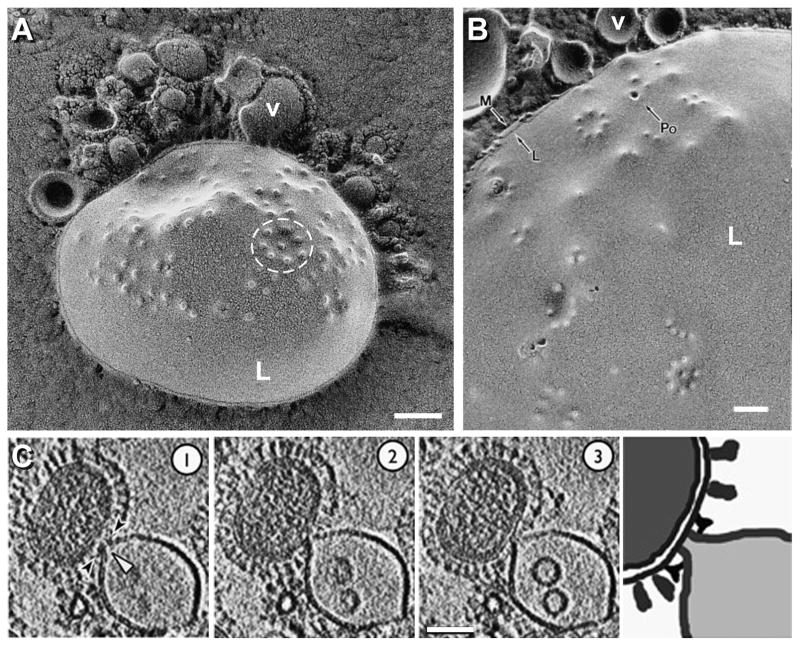
Kanaseki et al. [61] imaged metal replicas of freeze-fractured H1 virions interacting with liposomes at pH 5.0 and 23°C (Figures 11A & B). After a 19-second incubation, protrusions (outward bendings of the lipid bilayer) with a diameter of 10–20 nm were found on the liposomal membranes. At these protrusions, liposomal membranes contacted with viral membranes. In many cases the protrusions were found to be aligned in regular polygonal arrangements (e.g. circle in Figure 11A), which were suggested to reflect the array of HA spikes on the viral surface, since they appeared only when the medium was acidic and the virus was present. Occasionally, certain protrusions showed a 4-nm hole in the center (Po in Figure 11B), which was taken to be an “initial fusion pore”. Increasing the incubation time to 30 seconds, allowed the observation of fusion pores of larger sizes bridging viruses and liposomes. To explain these observations, the authors proposed that the microprotrusions are fusion intermediates, each of which progresses into an initial fusion pore, and that the growth and merging of several such pores in the process of fusion of a single viral particle eventually allows the release of the viral genome into the cell.
Figure 11. Pseudo-infection: interactions of influenza virus with liposomes.
A & B, fusion of influenza virions with liposomes as revealed by EM after quick-freezing, freeze-fracture and metal replica (strain A/PR/8/34, subtype H1N1, was used). White “L”, liposome; “v” labels a virion in each panel; “Po”, fusion pore; black “L”, delineates the hydrophobic interior of the membrane; “M”, hydrophilic surface of the outer leaflet of the unit membrane. C, X31 virions (H3N2) fusing with liposomes as imaged by cryo-ET. Three 5.3-nm thick serial sections showing a virion interacting with a liposome (left panels) and its interpretation (right panel) are shown. A & B are reprinted from Kanaseki et al., 1997, Structural features of membrane fusion between influenza virus and liposome as revealed by quick-freezing electron microscopy, Journal of Cell Biology 137(5):1041-1056, with permission from The Journal of Cell Biology [61]; C is reprinted from Lee, 2010, EMBO Journal 29(7):1299-311, with permission from EMBO [18]. Bars, 100 nm for A & B; 50 nm for C.
A different conclusion was reached from experiments imaging the fusion of an H3 influenza virus with liposomes by cryo-ET [18, 62]. Studying the fusion process at pH 5.5 (the pH of early/maturing endosomes, at which HA has been shown to become active and to begin the process of membrane merging [63], even though it is slightly higher than the optimal pH for fusion of the X-31 strain – 4.9) and 25°C for 2.5 to 15 min, Lee [18] captured early stages of membrane remodeling, progressing from punctate dimples to the formation of a liposomal funnel (Figure 11C). According to these results, the fusion of each virion is mediated by a single fusion pore. Changes in the liposome occurred without significant alteration in the envelopes of the interacting virion (M1-containing), generating an asymmetric membrane deformation affecting the liposome [18]. This observation suggests that during cell entry, the M1 matrix layer may be rigid enough to prevent gross distortion of the viral envelope. Subsequently within the endosome, the M1 matrix layer appears to detach from the viral membrane, facilitating its fusion with the endosome membrane.
A similar setup was used to analyze the effect of beta-propiolactone (BPL) in virus /liposome fusion [62]. In this study, cryo-EM and cryo-ET analysis confirmed similar membrane deformations to those described by Lee. Additionally, and combined with fluorescence spectroscopy and mass spectrometry, Bonnafous et al. [62] found that BPL-treated viruses lose their capacity to fuse with liposomes in a dose-dependent manner. Of note, in these cryo-ET studies the HA glycoproteins adopted different conformations: while individual spikes mostly with a neutral-pH like conformation are seen in Lee’s experiments, the spike array is clearly affected by the pH in the work from Bonnafous et al. This discrepancy could be due to the different pHs used (5.5 vs. 5.1).
Currentrent perspective
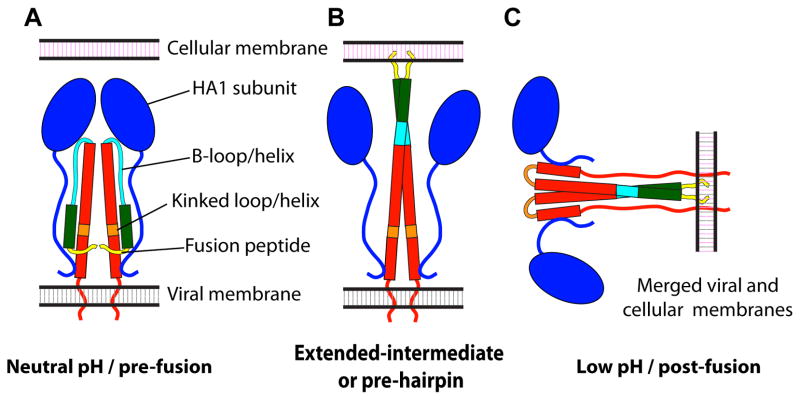
EM has played a key role in providing an experimental basis for models of membrane fusion as driven by structural changes in HA. According to a widely accepted account ([4] Figure 12) the HA1 subunits first dissociate from each other, allowing a loop-to-helix conformational change in HA2 affecting the “B-loop” (amino acids 55 to 76 of HA2), that transfers the fusion peptides to the “top” region of the molecule. In this hypothesized “extended intermediate” or “pre-hairpin”, the HA molecules in the virus-cell contact zone interact with the target membrane. A number of these pre-hairpins then cluster, and a helix-to-loop transition of the “kinked loop” (amino acids 106 to 112 of HA2) induce deformations of the viral and/or cellular membranes. Further changes of HA towards its post-fusion conformation induce first a hemifusion state, in which the outer leaflets of both membranes are continuous while the inner leaflets remain distinct, and finally a fusion pore, allowing the release of the viral genome inside the cell.
Figure 12. Model of the HA low pH changes.
Alpha-helices are represented by rectangles, loops by curved lines, and HA1 subunits by ovals. HA1 is shown in blue; HA2 in red, with amino acids 1 to 23 (fusion peptide) in yellow; amino acids 24 to 54, green; amino acids 55 to 76 (B loop/helix), cyan; and amino acids 106 to 112 (kinked loop/helix), orange. Even though HA is a trimer in its pre- and post-fusion conformations, it is shown as a dimer to better convey the changes involved during the fusion process. Adapted from Fontana et al., 2012, Structural changes in Influenza virus at low pH characterized by cryo-electron tomography, Journal of Virology 86(6):2919-29, with permission from the American Society for Microbiology [56].
However, since atomic models are known only for the initial and (part of) the final states of the HA ectodomains [40–42], many questions about the HA-mediated fusion process remain unanswered, especially those concerning the intermediate states adopted by the viral glycoprotein and how these changes correlate with the different stages of membrane merging [39, 64]. The capabilities of cryo-EM and cryo-ET, which allow imaging individual events in near-native conditions are especially well suited to help elucidate this process. They have already provided medium resolution structures of glycoprotein intermediate conformations interacting with the membranes (e.g. [56, 65]). Recent technical innovations in EM, such as the introduction of direct electron detectors, which significantly increase the signal-to-noise ratio of the micrographs [66]; improved subtomogram averaging procedures, which have been used to obtain volumes of up to 8Å resolution [67]; and phase-plate tomography, which enhances the low frequency information allowing in-focus high-contrast imaging [68], will undoubtedly help to obtain more detailed structures that will allow a deeper understanding of the transformations of HA and those of other viral fusogens and their role in the dynamic aspects of membrane fusion. Not least, new approaches that allow imaging processes inside cells [60] will allow correlating the in vitro fusion experiments with in vivo fusion.
Highlights.
- Cryo-EM and cryo-ET yield novel insights into influenza virus-mediated membrane fusion
- Membrane fusion is driven by conformational changes in the HA glycoprotein
- Low pH causes HA to switch from its pre-fusion to its post-fusion conformation
- Cryo-ET has visualized two intermediate conformations of HA
- Low pH also strips away the M1 matrix layer from the viral membrane
Acknowledgments
This research was supported by the Intramural Research Program of the National Institute of Arthritis and Musculoskeletal and Skin Diseases of the National Institutes of Health.
Abbreviations
- HA
Hemagglutinin
- NA
neuraminidase
- NP
nucleoprotein
- RNP
ribonucleoprotein
- EM
Electron microscopy
- cryo-EM
cryo-electron microscopy
- cryo-ET
cryo-electron tomography
Footnotes
Publisher's Disclaimer: This is a PDF file of an unedited manuscript that has been accepted for publication. As a service to our customers we are providing this early version of the manuscript. The manuscript will undergo copyediting, typesetting, and review of the resulting proof before it is published in its final citable form. Please note that during the production process errors may be discovered which could affect the content, and all legal disclaimers that apply to the journal pertain.
References
- 1.World Health Organization. Fact Sheet N°211, March 2014. http://www.who.int/mediacentre/factsheets/fs211/en/
- 2.Fukuyama S, Kawaoka Y. Curr Opin Immunol. 2011;23:481–486. doi: 10.1016/j.coi.2011.07.016. [DOI] [PMC free article] [PubMed] [Google Scholar]
- 3.Skehel JJ, Wiley DC. Annu Rev Biochem. 2000;69:531–569. doi: 10.1146/annurev.biochem.69.1.531. [DOI] [PubMed] [Google Scholar]
- 4.White JM, Delos SE, Brecher M, Schornberg K. Crit Rev Biochem Mol Biol. 2008;43:189–219. doi: 10.1080/10409230802058320. [DOI] [PMC free article] [PubMed] [Google Scholar]
- 5.Shaw ML, Palese P. In: Fields virology. Knipe DM, Howley PM, editors. Lippincott Williams & Wilkins; Philadelphia: 2013. [Google Scholar]
- 6.Tong S, Zhu X, Li Y, Shi M, Zhang J, Bourgeois M, Yang H, Chen X, Recuenco S, Gomez J, Chen LM, Johnson A, Tao Y, Dreyfus C, Yu W, McBride R, Carney PJ, Gilbert AT, Chang J, Guo Z, Davis CT, Paulson JC, Stevens J, Rupprecht CE, Holmes EC, Wilson IA, Donis RO. PLoS Pathog. 2013;9:e1003657. doi: 10.1371/journal.ppat.1003657. [DOI] [PMC free article] [PubMed] [Google Scholar]
- 7.Frank J. In: Three-Dimensional Electron Microscopy of Macromolecular Assemblies. Frank J, editor. Academic Press; Burlington: 1996. pp. 12–53. [Google Scholar]
- 8.Lepault J, Booy FP, Dubochet J. J Microsc. 1983;129:89–102. doi: 10.1111/j.1365-2818.1983.tb04163.x. [DOI] [PubMed] [Google Scholar]
- 9.Adrian M, Dubochet J, Lepault J, McDowall AW. Nature. 1984;308:32–36. doi: 10.1038/308032a0. [DOI] [PubMed] [Google Scholar]
- 10.Booy FP, Ruigrok RW, van Bruggen EF. J Mol Biol. 1985;184:667–676. doi: 10.1016/0022-2836(85)90312-2. [DOI] [PubMed] [Google Scholar]
- 11.Fujiyoshi Y, Kume NP, Sakata K, Sato SB. EMBO J. 1994;13:318–326. doi: 10.1002/j.1460-2075.1994.tb06264.x. [DOI] [PMC free article] [PubMed] [Google Scholar]
- 12.Yamaguchi M, Danev R, Nishiyama K, Sugawara K, Nagayama K. J Struct Biol. 2008;162:271–276. doi: 10.1016/j.jsb.2008.01.009. [DOI] [PubMed] [Google Scholar]
- 13.Fontana J, Steven AC. J Virol. 2013;87:5621–5628. doi: 10.1128/JVI.00276-13. [DOI] [PMC free article] [PubMed] [Google Scholar]
- 14.Harris A, Forouhar F, Qiu S, Sha B, Luo M. Virology. 2001;289:34–44. doi: 10.1006/viro.2001.1119. [DOI] [PubMed] [Google Scholar]
- 15.Calder LJ, Wasilewski S, Berriman JA, Rosenthal PB. Proc Natl Acad Sci U S A. 2010;107:10685–10690. doi: 10.1073/pnas.1002123107. [DOI] [PMC free article] [PubMed] [Google Scholar]
- 16.Chen BJ, Leser GP, Morita E, Lamb RA. J Virol. 2007;81:7111–7123. doi: 10.1128/JVI.00361-07. [DOI] [PMC free article] [PubMed] [Google Scholar]
- 17.Rossman JS, Leser GP, Lamb RA. J Virol. 2012;86:10950–10960. doi: 10.1128/JVI.05992-11. [DOI] [PMC free article] [PubMed] [Google Scholar]
- 18.Lee KK. EMBO J. 2010;29:1299–1311. doi: 10.1038/emboj.2010.13. [DOI] [PMC free article] [PubMed] [Google Scholar]
- 19.Helenius A. Cell. 1992;69:577–578. doi: 10.1016/0092-8674(92)90219-3. [DOI] [PubMed] [Google Scholar]
- 20.Martin K, Helenius A. Cell. 1991;67:117–130. doi: 10.1016/0092-8674(91)90576-k. [DOI] [PubMed] [Google Scholar]
- 21.De Rosier DJ, Klug A. Nature. 1968;217:130–134. doi: 10.1038/217130a0. [DOI] [PubMed] [Google Scholar]
- 22.Grunewald K, Desai P, Winkler DC, Heymann JB, Belnap DM, Baumeister W, Steven AC. Science. 2003;302:1396–1398. doi: 10.1126/science.1090284. [DOI] [PubMed] [Google Scholar]
- 23.Briggs JA. Curr Opin Struct Biol. 2013;23:261–267. doi: 10.1016/j.sbi.2013.02.003. [DOI] [PubMed] [Google Scholar]
- 24.Murti KG, Bean WJ, Jr, Webster RG. Virology. 1980;104:224–229. doi: 10.1016/0042-6822(80)90380-3. [DOI] [PubMed] [Google Scholar]
- 25.Ruigrok RW, Calder LJ, Wharton SA. Virology. 1989;173:311–316. doi: 10.1016/0042-6822(89)90248-1. [DOI] [PubMed] [Google Scholar]
- 26.Murti KG, Brown PS, Bean WJ, Jr, Webster RG. Virology. 1992;186:294–299. doi: 10.1016/0042-6822(92)90084-3. [DOI] [PubMed] [Google Scholar]
- 27.Harris A, Cardone G, Winkler DC, Heymann JB, Brecher M, White JM, Steven AC. Proc Natl Acad Sci U S A. 2006;103:19123–19127. doi: 10.1073/pnas.0607614103. [DOI] [PMC free article] [PubMed] [Google Scholar]
- 28.Compans RW, Content J, Duesberg PH. J Virol. 1972;10:795–800. doi: 10.1128/jvi.10.4.795-800.1972. [DOI] [PMC free article] [PubMed] [Google Scholar]
- 29.Arranz R, Coloma R, Chichon FJ, Conesa JJ, Carrascosa JL, Valpuesta JM, Ortin J, Martin-Benito J. Science. 2012;338:1634–1637. doi: 10.1126/science.1228172. [DOI] [PubMed] [Google Scholar]
- 30.Moeller A, Kirchdoerfer RN, Potter CS, Carragher B, Wilson IA. Science. 2012;338:1631–1634. doi: 10.1126/science.1227270. [DOI] [PMC free article] [PubMed] [Google Scholar]
- 31.Noda T, Sagara H, Yen A, Takada A, Kida H, Cheng RH, Kawaoka Y. Nature. 2006;439:490–492. doi: 10.1038/nature04378. [DOI] [PubMed] [Google Scholar]
- 32.Chou YY, Vafabakhsh R, Doganay S, Gao Q, Ha T, Palese P. Proc Natl Acad Sci U S A. 2012;109:9101–9106. doi: 10.1073/pnas.1206069109. [DOI] [PMC free article] [PubMed] [Google Scholar]
- 33.Murti KG, Webster RG. Virology. 1986;149:36–43. doi: 10.1016/0042-6822(86)90084-x. [DOI] [PubMed] [Google Scholar]
- 34.Wasilewski S, Calder LJ, Grant T, Rosenthal PB. Vaccine. 2012;30:7368–7373. doi: 10.1016/j.vaccine.2012.09.082. [DOI] [PMC free article] [PubMed] [Google Scholar]
- 35.Vijayakrishnan S, Loney C, Jackson D, Suphamungmee W, Rixon FJ, Bhella D. PLoS Pathog. 2013;9:e1003413. doi: 10.1371/journal.ppat.1003413. [DOI] [PMC free article] [PubMed] [Google Scholar]
- 36.Harris AK, Meyerson JR, Matsuoka Y, Kuybeda O, Moran A, Bliss D, Das SR, Yewdell JW, Sapiro G, Subbarao K, Subramaniam S. Proc Natl Acad Sci U S A. 2013;110:4592–4597. doi: 10.1073/pnas.1214913110. [DOI] [PMC free article] [PubMed] [Google Scholar]
- 37.Pinto LH, Holsinger LJ, Lamb RA. Cell. 1992;69:517–528. doi: 10.1016/0092-8674(92)90452-i. [DOI] [PubMed] [Google Scholar]
- 38.Hamilton BS, Whittaker GR, Daniel S. Viruses. 2012;4:1144–1168. doi: 10.3390/v4071144. [DOI] [PMC free article] [PubMed] [Google Scholar]
- 39.Harrison SC. Nat Struct Mol Biol. 2008;15:690–698. doi: 10.1038/nsmb.1456. [DOI] [PMC free article] [PubMed] [Google Scholar]
- 40.Wilson IA, Skehel JJ, Wiley DC. Nature. 1981;289:366–373. doi: 10.1038/289366a0. [DOI] [PubMed] [Google Scholar]
- 41.Bizebard T, Gigant B, Rigolet P, Rasmussen B, Diat O, Bosecke P, Wharton SA, Skehel JJ, Knossow M. Nature. 1995;376:92–94. doi: 10.1038/376092a0. [DOI] [PubMed] [Google Scholar]
- 42.Bullough PA, Hughson FM, Skehel JJ, Wiley DC. Nature. 1994;371:37–43. doi: 10.1038/371037a0. [DOI] [PubMed] [Google Scholar]
- 43.Chen J, Wharton SA, Weissenhorn W, Calder LJ, Hughson FM, Skehel JJ, Wiley DC. Proc Natl Acad Sci U S A. 1995;92:12205–12209. doi: 10.1073/pnas.92.26.12205. [DOI] [PMC free article] [PubMed] [Google Scholar]
- 44.Lee DW, Thapar V, Clancy P, Daniel S. Biophys J. 2014;106:843–854. doi: 10.1016/j.bpj.2013.12.048. [DOI] [PMC free article] [PubMed] [Google Scholar]
- 45.Kozlov MM, Chernomordik LV. Traffic. 2002;3:256–267. doi: 10.1034/j.1600-0854.2002.030403.x. [DOI] [PubMed] [Google Scholar]
- 46.Leikina E, Mittal A, Cho MS, Melikov K, Kozlov MM, Chernomordik LV. J Biol Chem. 2004;279:26526–26532. doi: 10.1074/jbc.M401883200. [DOI] [PubMed] [Google Scholar]
- 47.Helenius A, Kartenbeck J, Simons K, Fries E. J Cell Biol. 1980;84:404–420. doi: 10.1083/jcb.84.2.404. [DOI] [PMC free article] [PubMed] [Google Scholar]
- 48.Matlin KS, Reggio H, Helenius A, Simons K. J Cell Biol. 1981;91:601–613. doi: 10.1083/jcb.91.3.601. [DOI] [PMC free article] [PubMed] [Google Scholar]
- 49.Lakadamyali M, Rust MJ, Zhuang X. Microbes Infect. 2004;6:929–936. doi: 10.1016/j.micinf.2004.05.002. [DOI] [PMC free article] [PubMed] [Google Scholar]
- 50.Ruigrok RW, Cremers AF, Beyer WE, de Ronde-Verloop FM. Arch Virol. 1984;82:181–194. doi: 10.1007/BF01311162. [DOI] [PubMed] [Google Scholar]
- 51.White J, Kartenbeck J, Helenius A. EMBO J. 1982;1:217–222. doi: 10.1002/j.1460-2075.1982.tb01150.x. [DOI] [PMC free article] [PubMed] [Google Scholar]
- 52.Ruigrok RW, Wrigley NG, Calder LJ, Cusack S, Wharton SA, Brown EB, Skehel JJ. EMBO J. 1986;5:41–49. doi: 10.1002/j.1460-2075.1986.tb04175.x. [DOI] [PMC free article] [PubMed] [Google Scholar]
- 53.Stegmann T, Booy FP, Wilschut J. J Biol Chem. 1987;262:17744–17749. [PubMed] [Google Scholar]
- 54.Puri A, Booy FP, Doms RW, White JM, Blumenthal R. J Virol. 1990;64:3824–3832. doi: 10.1128/jvi.64.8.3824-3832.1990. [DOI] [PMC free article] [PubMed] [Google Scholar]
- 55.Shangguan T, Siegel DP, Lear JD, Axelsen PH, Alford D, Bentz J. Biophys J. 1998;74:54–62. doi: 10.1016/S0006-3495(98)77766-5. [DOI] [PMC free article] [PubMed] [Google Scholar]
- 56.Fontana J, Cardone G, Heymann JB, Winkler DC, Steven AC. J Virol. 2012;86:2919–2929. doi: 10.1128/JVI.06698-11. [DOI] [PMC free article] [PubMed] [Google Scholar]
- 57.Leikina E, Ramos C, Markovic I, Zimmerberg J, Chernomordik LV. EMBO J. 2002;21:5701–5710. doi: 10.1093/emboj/cdf559. [DOI] [PMC free article] [PubMed] [Google Scholar]
- 58.Godley L, Pfeifer J, Steinhauer D, Ely B, Shaw G, Kaufmann R, Suchanek E, Pabo C, Skehel JJ, Wiley DC, et al. Cell. 1992;68:635–645. doi: 10.1016/0092-8674(92)90140-8. [DOI] [PubMed] [Google Scholar]
- 59.Li S, Sieben C, Ludwig K, Hofer CT, Chiantia S, Herrmann A, Eghiaian F, Schaap IA. Biophys J. 2014;106:1447–1456. doi: 10.1016/j.bpj.2014.02.018. [DOI] [PMC free article] [PubMed] [Google Scholar]
- 60.Rigort A, Villa E, Bauerlein FJ, Engel BD, Plitzko JM. Methods Cell Biol. 2012;111:259–281. doi: 10.1016/B978-0-12-416026-2.00014-5. [DOI] [PubMed] [Google Scholar]
- 61.Kanaseki T, Kawasaki K, Murata M, Ikeuchi Y, Ohnishi S. J Cell Biol. 1997;137:1041–1056. doi: 10.1083/jcb.137.5.1041. [DOI] [PMC free article] [PubMed] [Google Scholar]
- 62.Bonnafous P, Nicolai MC, Taveau JC, Chevalier M, Barriere F, Medina J, Le Bihan O, Adam O, Ronzon F, Lambert O. Biochim Biophys Acta. 2014;1838:355–363. doi: 10.1016/j.bbamem.2013.09.021. [DOI] [PubMed] [Google Scholar]
- 63.Doms RW, Helenius A, White J. J Biol Chem. 1985;260:2973–2981. [PubMed] [Google Scholar]
- 64.Baquero E, Albertini AA, Vachette P, Lepault J, Bressanelli S, Gaudin Y. Curr Opin Virol. 2013;3:143–150. doi: 10.1016/j.coviro.2013.03.006. [DOI] [PMC free article] [PubMed] [Google Scholar]
- 65.Cardone G, Brecher M, Fontana J, Winkler DC, Butan C, White JM, Steven AC. J Virol. 2012;86:12129–12137. doi: 10.1128/JVI.01880-12. [DOI] [PMC free article] [PubMed] [Google Scholar]
- 66.Ruskin RS, Yu Z, Grigorieff N. J Struct Biol. 2013;184:385–393. doi: 10.1016/j.jsb.2013.10.016. [DOI] [PMC free article] [PubMed] [Google Scholar]
- 67.Schur FK, Hagen WJ, Rumlova M, Ruml T, Muller B, Krausslich HG, Briggs JA. Nature. 2015;517:505–508. doi: 10.1038/nature13838. [DOI] [PubMed] [Google Scholar]
- 68.Nagayama K. Methods Mol Biol. 2014;1117:385–399. doi: 10.1007/978-1-62703-776-1_18. [DOI] [PubMed] [Google Scholar]


