

Abstract
Purpose
To estimate the hazard for neurologic (central nervous system, CNS) and nonneurologic (non-CNS) death associated with patient, treatment, and systemic disease status in patients receiving stereotactic radiosurgery after whole-brain radiation therapy (WBRT) failure, using a competing risk model.
Patients and Methods
Of 757 patients, 293 experienced recurrence or new metastasis following WBRT. Univariate Cox proportional hazards regression identified covariates for consideration in the multivariate model. Competing risks multivariable regression was performed to estimate the adjusted hazard ratio (aHR) and 95% confidence interval (CI) for both CNS and non-CNS death after adjusting for patient, disease, and treatment factors. The resultant model was converted into an online calculator for ease of clinical use.
Results
The cumulative incidence of CNS and non-CNS death at 6 and 12 months was 20.6% and 21.6%, and 34.4% and 35%, respectively. Patients with melanoma histology (relative to breast) (aHR 2.7, 95% CI 1.5–5.0), brainstem location (aHR 2.1, 95% CI 1.3–3.5), and number of metastases (aHR 1.09, 95% CI 1.04–1.2) had increased aHR for CNS death. Progressive systemic disease (aHR 0.55, 95% CI 0.4–0.8) and increasing lowest margin dose (aHR 0.97, 95% CI 0.9–0.99) were protective against CNS death. Patients competing risk of death from other causes. with lung histology (aHR 1.3, 95% CI 1.1–1.9) and progressive systemic disease (aHR 2.14, 95% CI 1.5–3.0) had increased aHR for non-CNS death.
Conclusion
Our nomogram provides individual estimates of neurologic death after salvage stereotactic radiosurgery for patients who have failed prior WBRT, based on histology, neuroanatomical location, age, lowest margin dose, and number of metastases after adjusting for their competing risk of death from other causes.
Introduction
Brain metastases have traditionally been associated with a poor prognosis and increased risk for central nervous system (CNS) death (1, 2). The survival for patients with brain metastases has improved over time with innovations in brain-directed therapies (3) and improvements in the control of extracranial disease (4). Patients who have failed whole-brain radiation therapy (WBRT) represent a heterogeneous population that can have either very brief or prolonged survival times. Subsets of patients with improved systemic disease control may benefit from aggressive intracranial salvage for recurrent disease after WBRT, resulting in a decreased likelihood of neurologic death (5–8). Patient selection for treatment intensification is challenging because the prognostic factors that may assist in the decision to salvage intracranial disease are poorly described. Furthermore, patients in need of intracranial salvage are also at high risk for death due to their non-CNS disease, further complicating the decision for appropriate salvage.
Salvage interventions for intracranial and extracranial disease may not be sufficiently cost-effective when weighing the morbidity and uncertain incremental gain in survival (9). As medical interventions are growing increasingly expensive, determination of risk factors that would predict patients who would either die of early neurologic death despite aggressive therapies would be clinically useful. Furthermore, determination of patients who are at higher risk for CNS death from unrelenting CNS relapse would allow for these patients to be more appropriately selected for more- or less-aggressive interventions (early palliative care vs repeat WBRT vs stereotactic radiosurgery [SRS]) for their brain metastases. Existing validated nomograms describe outcomes in the upfront setting, and thus the extrapolation of these tools to the salvage setting may lead to tenuous conclusions (10, 11). The purpose of our study was to evaluate patient-, disease-, and treatment-related factors that impact the risk of death from CNS and non-CNS etiologies in patients who experience recurrence or distant brain progression after WBRT. A population that has previously failed WBRT was chosen for study because these patients represent a common population that is treated with radiosurgery and one that likely has a high baseline incidence of neurologic death, given that their brain disease has already failed standard therapy.
Patients and Methods
Data acquisition
After review by the Wake Forest University institutional review board, the Wake Forest Medical Center Gamma Knife Program Tumor Registry was queried for all patients who received Gamma Knife radiosurgery (GKRS) as salvage after failed WBRT from November 1999 to June 2012. During this time, 293 instances of radiosurgical salvage were identified. Clinical outcome measures were determined using the patients’ electronic medical records and paper charts.
Radiosurgical technique
Patients were evaluated and consented by a radiation oncologist and neurosurgeon before GKRS. Patients were treated with a Leksell model C unit (Elekta, Norcross, GA) before May 2009 and with a Leksell GammaKnife Perfexion unit (Elekta) thereafter. Before undergoing radiosurgery, the patient underwent a 1.5T or 3T high-resolution contrast-enhanced stereotactic MRI and/or CT study of the brain. Treatment planning was performed using the Leksell GammaPlan treatment planning system (Elekta). Dose prescription was determined according to size and volume of the metastasis, and generally following the guidelines published by Shaw et al (12) for single-fraction radiosurgical treatment of previously irradiated primary brain tumors and brain metastases.
Follow-up data
Patients were followed with brain MRI 4 to 8 weeks after the initial GKRS procedure and then approximately every 3 months thereafter. Distant brain failures were generally treated with repeat GKRS, with repeat WBRT reserved for symptomatic patients with numerous distant brain failures and/or declining performance status. Local failure was defined as recurrence of tumor within the GK treatment field, as determined by a combination of imaging and clinical characteristics of local treatment failure. Imaging characteristics of treatment failure included 2 serial increases in size with associated contrast enhancement, decreased Apparent Diffusion Coefficient signal, and/or increased perfusion on perfusion imaging. Distant failure was defined as recurrence of tumor outside of the prescription 50% isodose line. Central nervous system death was defined as previously reported by Patchell et al (2).
Statistics
Descriptive characteristics were summarized using either means and standard deviations or medians and interquartile ranges, depending on the normality of the data. Continuous variables were compared across groups using the t test, whereas frequencies were compared using either the χ2 or Fisher exact test. Time to event data was summarized using Kaplan-Meier plots, and the log-rank test was used to determine the significance between strata. All time to event outcomes are defined as the time from the date of salvage SRS to the terminal event. Hazard functions were plotted and smoothed using the SAS smooth macro from Paul Allison. Cumulative incidences were generated using the SAS comprisk macro. Competing risk models were constructed to understand the relative contribution of each covariate to CNS and non-CNS death.
Because recursive partitioning analysis (RPA) status was predictive of CNS but not non-CNS death—[(RPA 2 vs 1, hazard ratio [HR] 2.376, 95% confidence interval [CI] 0.876–6.44, P=.089) (RPA 3 vs 1, HR 4.99, 95% CI 1.33–18.75, P=.017)] versus [(RPA 2 vs 1, HR 0.68, 95% CI 0.29–1.5, P=.34) (RPA 3 vs 1, HR 1.25, 95% CI 0.83–1.88, P=.28)]— and components of the RPA classifier were predictive of both non-CNS and CNS death (Supplementary Materials, Supplementary Table 3. Univariate analysis; available online at www.redjournal.org), we separated the RPA classifier into age, systemic disease status, performance status, and the number of metastases to understand the relative contribution of each component to the hazard for CNS and non-CNS death. This allowed for the avoidance of interactions between covariates in the final multivariate model. A proportional hazards model was used to estimate the hazard associated with clinical and treatment factors associated with the time to neurologic and nonneurologic death. Unadjusted and adjusted hazard ratios for time to neurologic and nonneurologic disease and the associated 95% CIs and P values were calculated for each covariate. A stepwise selection process was used for model selection, with a covariate selection criterion of P≤.2. All covariates were assessed for proportional hazards assumptions. Cox regression for cancer-related events was adjusted for competing risk relapse/progression using the SAS macro criskcox according to the assumptions set out by Cheng et al (13). Analysis of the impact of in-field and distant brain failure on the hazard for CNS death was carried out by reformatting the database as a counting process dataset, to incorporate them as time-dependent covariates. SAS version 9.2 was used for the above analyses (SAS Institute, Cary, NC).
To create the nomogram for neurologic death in the presence of competing risks, we used the packages QHScrnomo and pred in R version 2.12.2. Predictor variables included age in years, primary tumor site, lowest margin dose (Gy), systemic disease status, brainstem metastasis, number of metastases, and prior SRS. To assess the predictive ability of the nomogram, we evaluated the concordance index (c-index) by calculating the proportion of concordant predicted and observed outcomes. We used 2000 bootstrap samples to determine a 95% percentile interval for the c-index. Calibration plots were used to assess agreement between observed and predicted probability of neurologic death.
Results
Patient population
The demographics for our cohort of 293 patients are detailed in Table 1. The majority of patients in this cohort were female (63%) versus male (37%), with a median age of 56 years (interquartile range, 48–63 years). Most (80%) patients had lung (58%), breast (23%), or melanoma (9%) primaries. The remaining 20% of patients were composed of individuals with genitourinary, colorectal, ovarian, or esophageal primaries. The majority of patients had a disease-specific graded prognostic assessment (dsGPA) score of 1.5–3.0 (72.1%), whereas the minority were dsGPA 0–1.0 (18.6%) and dsGPA 3.5–4 (9.3%). The number of metastases at presentation varied widely, with the majority having ≤3 metastases. The time between WBRT and SRS salvage for most patients was 3–12 months (64%), whereas the remaining 23% had a longer interval and 13% had a shorter interval. Although extracranial metastases were not a focus of this study, it was noted that 55% of patients had at least more than 1 site of disease. Prior treatment is detailed in Supplementary Table 1 (available online at www.redjournal.org).
Table 1.
Patient demographics and disease characteristics
| Characteristic | n | Median (IQR)/% |
|---|---|---|
| Age (y) | 293 | 56 (48–63) |
| Gender | ||
| Male | 109 | 37.2 |
| Female | 184 | 62.8 |
| dsGPA | ||
| 0–1.0 | 52 | 18.6 |
| 1.5–2.0 | 105 | 37.5 |
| 2.5–3.0 | 97 | 34.6 |
| 3.5–4 | 26 | 9.3 |
| Extracranial disease | ||
| No | 133 | 45.4 |
| Yes | 160 | 54.6 |
| Primary | ||
| Breast | 68 | 23.2 |
| Lung | 170 | 58.0 |
| Melanoma | 26 | 8.9 |
| Other | 29 | 9.9 |
| Time to WBRT from diagnosis (mo) | ||
| <3 | 109 | 37.3 |
| 3–12 | 66 | 22.6 |
| 12–24 | 49 | 16.8 |
| >24 | 68 | 23.3 |
| Intracranial disease-free interval* (mo) | ||
| <3 | 38 | 13.0 |
| 3–12 | 188 | 64.2 |
| 12–24 | 43 | 14.7 |
| >24 | 24 | 8.2 |
| Time to intracranial progression (mo) | 284 | 8 (7.4–9) |
| No. of intracranial metastases | ||
| 1–3 | 180 | 61.4 |
| 4–8 | 83 | 28.3 |
| ≥9 | 0 | 0 |
| Location of intracranial disease | ||
| Posterior fossa | 121 | 41.3 |
| Pineal | 1 | 0.3 |
| Brainstem | 24 | 8.2 |
| Systemic disease status at SRS | ||
| NED/stable | 184 | 62.8 |
| Progressive | 109 | 37.2 |
Abbreviations: dsGPA = disease-specific graded prognostic assessment score; IQR = interquartile range; NED = no evidence of disease; SRS = stereotactic radiosurgery; WBRT = whole-brain radiation therapy.
Disease-free interval between WBRT and new brain metastases.
Outcomes
The first site of treatment failure was in-field in 86 cases (29%) and distant (intracranial) in 110 (37.5%) of patients (Table 2). The median time to in-field and distant brain failure from the date of salvage SRS was 14.8 months (95% CI 11.3–19.3 months) and 11.7 months (95% CI 9.1–15.9 months), respectively. Median survival time for the entire cohort was 4 months (95% CI 2.8–4.6 months). The cause of death was non-CNS in 132 (45.0%) and CNS in 139 (47.4%), whereas 22 patients (7.5%) were alive at last follow-up. Median time to CNS death was 9.31 months (95% CI 6.3–11.3 months). Figure 1 depicts cumulative incidence curves for CNS and non-CNS death.
Table 2.
Treatment outcomes
| Outcome | n | Median (95% CI)/% |
|---|---|---|
| In-field failure* | ||
| Absent | 190 | 70.6 |
| Present | 86 | 29.4 |
| Time to in-field failure (mo)* | 276 | 14.8 (11.3–19.3) |
| Distant brain failure* | ||
| Absent | 166 | 62.5 |
| Present | 110 | 37.5 |
| Time to distant brain failure (mo)* | 276 | 11.7 (9–15.9) |
| Survival* | ||
| Alive at last follow-up | 22 | 7.5 |
| Overall survival (mo)* | 276 | 4.0 (2.8–4.6) |
| Death due to neurologic causes | 139 | 47.4 |
| Time to CNS death (mo)* | 276 | 9.3 (6.3–11.3) |
| Death from nonneurologic causes | 132 | 45.0 |
| Time to non-CNS death (mo)* | 276 | 9.1 (6.6–15.1) |
Abbreviation: CI = confidence interval. Other abbreviations as in Table 1.
% = crude percentage.
After salvage SRS.
Fig. 1.
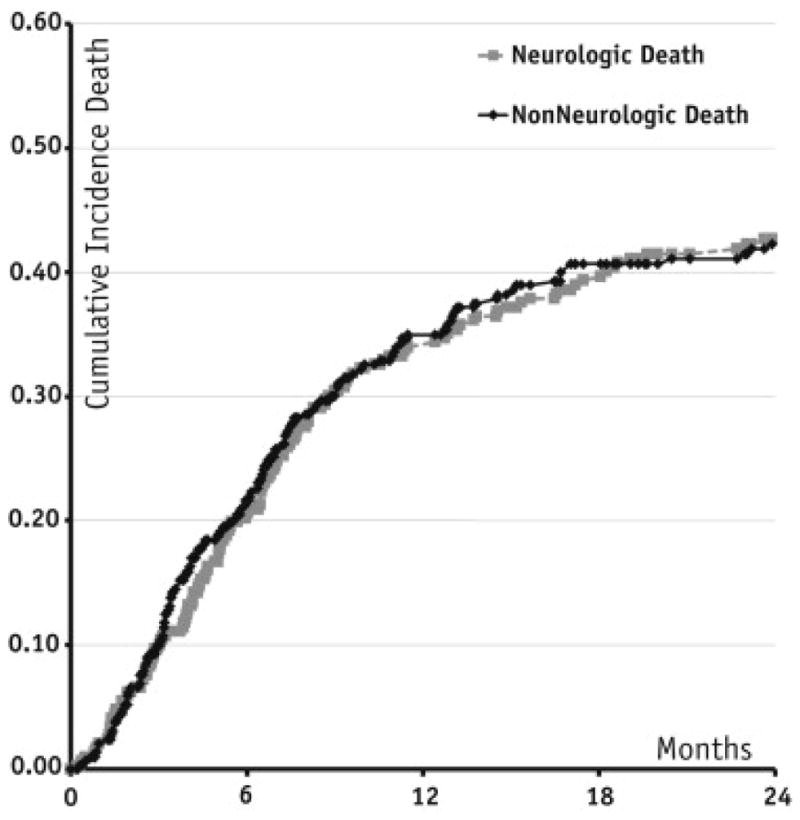
Cumulative incidence of central nervous system and non—central nervous system death.
Competing risk analysis
Competing risk analysis was performed to determine which factors predisposed patients to CNS versus non-CNS death. The following factors increased the hazard for CNS death: melanoma histology (relative to breast), decreasing lowest margin radiation dose, metastasis brainstem location, and increasing number of intracranial brain metastases at SRS salvage. Factors identifying patients at increased risk from death due to systemic disease included lung histology (relative to breast), declining Karnofsky performance status, and progressive systemic disease at the time of SRS salvage. The resultant model is displayed in Table 3. Cumulative incidence curves of factors identified to impact the hazard for neurologic death are displayed in Figure 2.
Table 3.
Competing risk model
| Covariate | Parameter | CNS death
|
Non-CNS death
|
||||
|---|---|---|---|---|---|---|---|
| HR | CI | P | HR | CI | P | ||
| Age | (Years) | 1.01 | 0.99–1.03 | .150 | 1.01 | 0.99–1.02 | .580 |
| Primary | Lung vs breast | 0.88 | 0.56–1.36 | .560 | 1.26 | 1.09–1.93 | .048 |
| Melanoma vs breast | 2.77 | 1.51–5.01 | <.001 | 0.45 | 0.19–1.10 | .080 | |
| Other vs breast | 1.30 | 0.68–2.48 | .430 | 0.69 | 0.31–1.49 | .340 | |
| Prior SRS | Yes vs no | 0.76 | 0.45–1.30 | .320 | 0.86 | 0.53–1.40 | .550 |
| Lowest margin dose | (Gray) | 0.97 | 0.94–0.99 | .013 | 1.01 | 0.98–1.05 | .350 |
| Brainstem location | Yes vs no | 2.13 | 1.31–3.46 | .002 | 0.47 | 0.18–1.20 | .110 |
| No. of intracranial metastases | 1.09 | 1.04–1.15 | <.001 | 0.94 | 0.88–1.02 | .06 | |
| Systemic disease status | Progressive vs stable* | 0.55 | 0.37–0.81 | .003 | 2.14 | 1.51–3.04 | <.001 |
| KPS | (%) | 0.99 | 0.98–1.01 | .550 | 0.98 | 0.96–0.99 | .037 |
Fig. 2.

Cumulative incidence of central nervous system (CNS) and non-CNS death by patient-, treatment-, and disease-related factors. (a) Histology, (b) brainstem location, (c) in-field failure versus no in-field failure, (d) distant brain failure versus no distant brain failure, (e) disease status—progressive versus no evidence of disease/stable, (f) low margin dose.
Competing risk nomogram
The final model was converted for use into an online calculator accessible at http://tinyurl.com/WBRTfail and http://tinyurl.com/WBRTnonCNSdeath for the risk of neurologic and nonneurologic death, respectively. The discrimination of the nomogram was estimated using the c-index and was found to be 0.66 (95% CI 0.63–0.71). Because the tumor size was not available, reference ranges of doses and sizes are provided for reference online because the tumor dose is often not known before making the decision for salvage. In this way, the treating physician can measure the lesion size, convert the size to an expected dose, and input the dose into the model to estimate the risk of neurologic and nonneurologic death. The calibration was assessed by reviewing the observed—predicted plots as indicated in Figure 3 and Supplementary Figure 1 (available online at www.redjournal.org).
Fig. 3.

Nomogram calibration plot.
Discussion
Brain metastases have traditionally portended a poor prognosis in patients with metastatic cancer, although much of the original data was collected in an era when brain metastases were diagnosed as large and symptomatic. Recent clinical trials have suggested that the current likelihood of dying of brain metastases in the modern era is as low as 20% (7), although there are populations that continue to have a higher rate of dying from brain metastases. In the original Radiation Therapy Oncology Group RPA, patients with brain metastases had estimated survival times of 3–7 months (7). As the acquisition of high-resolution staging MRIs has become standard of care for many patients with brain metastases, patients are being diagnosed with smaller asymptomatic brain metastases at a higher rate (14), and these patients can no longer fall under the same prognostic category as patients from the original Radiation Therapy Oncology Group series. In fact, the updated prognostic system represented by the dsGPA has estimated median survivals extending up to 25.3 months for the most favorable group (breast cancer) (11).
In light of the shifting landscape of clinical outcomes resulting from improved detection and treatment of both intracranial and extracranial disease progression, we sought to develop a competing risk model to stratify patients into additional risk categories based on their risk for neurologic and nonneurologic death after aggressive radiosurgical salvage, which could be used to guide treatment intensification and de-escalation, depending on the clinical context (15). The advantage of such data would be to determine (1) which patients die early of CNS death because these patients may experience only transient benefit from radiosurgical salvage and thus may require treatment intensification; (2) which patients have limited life expectancy and may benefit from early palliative care; and (3) which patients have an overwhelming likelihood of non-CNS death and thus would benefit from short-duration brain-directed therapies (or steroids) and systemic treatment intensification.
In this current competing risk model, we found that early mortality from CNS death was related to primary tumor histology, brainstem location, and lowest margin dose delivered to the metastasis. These parameters were used in building a calculator for ease of clinical use. There are emerging data from several other series that suggest that the primary tumor histology, particularly melanoma, can affect whether patients will die of their brain metastases (16, 17). This seems to be due to both an increased risk for in-field failure as well as increased risk for CNS hemorrhage (17, 18). Although radiosurgery does not seem to affect the likelihood of further hemorrhage, coincident hemorrhage at the treated site is associated with a higher risk for local failure (unpublished data). For this reason, surgery has been suggested for hemorrhagic brain metastasis or for patients with in-field failure if the clinical scenario and patient performance status is adequate.
Our model also identifies patients at increased risk from non-CNS causes, namely those with progressive systemic disease status and primary lung cancer. Patients with limited intracranial disease and low-volume extracranial disease with further systemic therapy options may benefit the most from limited intracranial and extracranial radiosurgical intervention and systemic therapy intensification (19, 20). Those succumbing to recurrent intracranial disease with adverse risk factors and progressive extracranial disease with may be best served by more conservative interventions such as hospice or early palliative care (21).
We observed that decreasing lowest margin dose increases the hazard of CNS death. The lowest margin dose represents a surrogate for a larger intracranial metastasis, given that larger lesions are treated with lower doses to avoid toxicity and this approach has been used by a number of authors (22). It was not possible to gather tumor size information, and this is a limitation of the present study. Larger tumors are more likely to interfere with global neurologic function, cause symptoms that affect activities of daily living, and fail conventional therapy. Similarly, larger lesions have a higher hazard of local failure due to their volume and reduced dose. In a separate analysis (not pictured) we demonstrated an increased hazard of CNS death from in-field (HR 1.5, 95% CI 1.1–1.9) but not distant brain (HR 0.89, 95% CI 0.7–1.8) failure when included as time-dependent covariates in a univariate model for CNS-only death. The effect of in-field failure as it relates to tumor size and median marginal dose has been controversial. Although it is impossible to dissect the effect of size from local failure, we observed a loss of the effect of increased hazard due to in-field failure when stratifying by lowest margin dose of ≥16 Gy versus <16 Gy (HR 0.94, 95% CI 0.6–1.5 vs HR 1.66, 95% CI 1.2–2.3). This increased likelihood of CNS death for larger brain metastases has been demonstrated in several prior series (1, 6, 8, 10). For this reason, high-risk populations such as patients with large brain metastases might benefit from a combined-modality approach, such as postoperative radiosurgery or concurrent systemic agents with WBRT or the combination of WBRT and SRS rather than delayed salvage.
Brainstem location increases the hazard for CNS death (adjutsted HR 2.2, 95% CI 1.3–3.9, P=.005). Because of the eloquence of the region, there is a narrow therapeutic window balancing local control versus toxicity. Size of the brain stem lesion is the predominant contributor to both local control and toxicity, with 1-cm3 volume seeming to be the toxicity threshold for grade 3 to 4 toxicity (23). Because brainstem lesions are generally not resectable, it may be that hypofractionation represents a treatment option for these tumors that does not have as high a rate of treatment-related toxicity.
Progressive systemic disease is likely the greatest competing risk for CNS death. It is likely that this relates to the availability of effective systemic therapies. As such, for patients without good systemic treatment options, treatment of asymptomatic CNS disease may not be of benefit. Patients with lung cancer were found in our series to be at particularly high risk of dying of nonneurologic causes, which may be a function of the fewer systemic therapies as compared with breast cancer and that these brain metastases may not be as prone to failure as ones from melanoma.
Late CNS deaths seem to be rare events: the majority of CNS deaths that occurred in our series occurred within 12 months of salvage therapy. However, both brainstem location and occurrence of a local failure were associated with cumulative incidence curves for CNS death that did not plateau with time. As such, these populations continue to have high rates of death from brain metastases with greater survival time, and likely require improved local therapies. Surgery and ablative therapy with adjuvant radiosurgery or implantation of chemotherapy wafers may ultimately play a role in decreasing the likelihood of local failure for some larger metastases.
Conclusion
Our competing risk analysis shows that in patients receiving salvage SRS after failure of WBRT, CNS death is a common event during the first year after SRS. Factors that predict CNS death include melanoma histology, brainstem location, and lower margin dose delivered to the metastasis. Late CNS deaths are rare and tend to occur in patients who experience local failures and those with brainstem metastases.
Supplementary Material
Summary.
Patients with intracranial metastases are at risk for neurologic death due to intracranial disease burden and death from other causes (comorbidities or progressive systemic disease). Our nomogram provides individual estimates of neurologic death after salvage stereotactic radiosurgery for patients who have failed prior whole-brain radiation therapy, based on histology, neuroanatomical location, age, lowest margin dose, and number of metastases after adjusting for their
Footnotes
Conflict of interest: none.
Supplementary material for this article can be found at www.redjournal.org.
References
- 1.Gaspar L, Scott C, Rotman M, et al. Recursive partitioning analysis (RPA) of prognostic factors in three Radiation Therapy Oncology Group (RTOG) brain metastases trials. Int J Radiat Oncol Biol Phys. 1997;37:745–751. doi: 10.1016/s0360-3016(96)00619-0. [DOI] [PubMed] [Google Scholar]
- 2.Patchell RA, Tibbs PA, Regine WF, et al. Postoperative radiotherapy in the treatment of single metastases to the brain: A randomized trial. JAMA. 1998;280:1485–1489. doi: 10.1001/jama.280.17.1485. [DOI] [PubMed] [Google Scholar]
- 3.Jensen CA, Chan MD, McCoy TP, et al. Cavity-directed radiosurgery as adjuvant therapy after resection of a brain metastasis. J Neurosurg. 2011;114:1585–1591. doi: 10.3171/2010.11.JNS10939. [DOI] [PMC free article] [PubMed] [Google Scholar]
- 4.Cochran DC, Chan MD, Aklilu M, et al. The effect of targeted agents on outcomes in patients with brain metastases from renal cell carcinoma treated with Gamma Knife surgery. J Neurosurg. 2012;116:978–983. doi: 10.3171/2012.2.JNS111353. [DOI] [PMC free article] [PubMed] [Google Scholar]
- 5.Aoyama H, Shirato H, Tago M, et al. Stereotactic radiosurgery plus whole-brain radiation therapy vs stereotactic radiosurgery alone for treatment of brain metastases: A randomized controlled trial. JAMA. 2006;295:2483–2491. doi: 10.1001/jama.295.21.2483. [DOI] [PubMed] [Google Scholar]
- 6.Chao ST, Barnett GH, Vogelbaum MA, et al. Salvage stereotactic radiosurgery effectively treats recurrences from whole-brain radiation therapy. Cancer. 2008;113:2198–2204. doi: 10.1002/cncr.23821. [DOI] [PubMed] [Google Scholar]
- 7.Harris S, Chan MD, Lovato JF, et al. Gamma Knife stereotactic radiosurgery as salvage therapy after failure of whole-brain radio-therapy in patients with small-cell lung cancer. Int J Radiat Oncol Biol Phys. 2012;83:e53–e59. doi: 10.1016/j.ijrobp.2011.11.059. [DOI] [PMC free article] [PubMed] [Google Scholar]
- 8.Wong WW, Schild SE, Sawyer TE, et al. Analysis of outcome in patients reirradiated for brain metastases. Int J Radiat Oncol Biol Phys. 1996;34:585–590. doi: 10.1016/0360-3016(95)02156-6. [DOI] [PubMed] [Google Scholar]
- 9.Lester-Coll NH, Dosoretz AP, Yu JB. Decision analysis of stereotactic radiation surgery versus stereotactic radiation surgery and whole-brain radiation therapy for 1 to 3 brain metastases. Int J Radiat Oncol Biol Phys. 2014;89:563–568. doi: 10.1016/j.ijrobp.2014.03.001. [DOI] [PubMed] [Google Scholar]
- 10.Chamberlain MC, Silbergeld DL. Is graded prognostic assessment an improvement compared with Radiation Therapy Oncology Group’s recursive partitioning analysis classification for brain metastases? J Clin Oncol. 2012;30:3315–3316. doi: 10.1200/JCO.2012.42.6429. author reply 3316–3317. [DOI] [PubMed] [Google Scholar]
- 11.Sperduto PW, Kased N, Roberge D, et al. Summary report on the graded prognostic assessment: An accurate and facile diagnosis-specific tool to estimate survival for patients with brain metastases. J Clin Oncol. 2012;30:419–425. doi: 10.1200/JCO.2011.38.0527. [DOI] [PMC free article] [PubMed] [Google Scholar]
- 12.Shaw E, Scott C, Souhami L, et al. Single dose radiosurgical treatment of recurrent previously irradiated primary brain tumors and brain metastases: Final report of RTOG protocol 90-05. Int J Radiat Oncol Biol Phys. 2000;47:291–298. doi: 10.1016/s0360-3016(99)00507-6. [DOI] [PubMed] [Google Scholar]
- 13.Cheng SC, Fine JP, Wei LJ. Prediction of cumulative incidence function under the proportional hazards model. Biometrics. 1998;54:219–228. [PubMed] [Google Scholar]
- 14.Loganathan AG, Chan MD, Alphonse N, et al. Clinical outcomes of brain metastases treated with Gamma Knife radiosurgery with 3.0 T versus 1.5 T MRI-based treatment planning: Have we finally optimised detection of occult brain metastases? J Med Imagin Radiat Oncol. 2012;56:554–560. doi: 10.1111/j.1754-9485.2012.02429.x. [DOI] [PubMed] [Google Scholar]
- 15.Nieder C, Nestle U, Motaref B, et al. Prognostic factors in brain metastases: Should patients be selected for aggressive treatment according to recursive partitioning analysis (RPA) classes? Int J Radiat Oncol Biol Phys. 2000;46:297–302. doi: 10.1016/s0360-3016(99)00416-2. [DOI] [PubMed] [Google Scholar]
- 16.Kuremsky JG, Urbanic JJ, Petty WJ, et al. Tumor histology predicts patterns of failure and survival in patients with brain metastases from lung cancer treated with Gamma Knife radiosurgery. Neurosurgery. 2013;73:641–647. doi: 10.1227/NEU.0000000000000072. discussion 647. [DOI] [PMC free article] [PubMed] [Google Scholar]
- 17.Neal MT, Chan MD, Lucas JT, Jr, et al. Predictors of survival, neurologic death, local failure, and distant failure after Gamma Knife radiosurgery for melanoma brain metastases. World Neurosurg. 2014;82:1250–1255. doi: 10.1016/j.wneu.2013.02.025. [DOI] [PMC free article] [PubMed] [Google Scholar]
- 18.Liew DN, Kano H, Kondziolka D, et al. Outcome predictors of Gamma Knife surgery for melanoma brain metastases. J Neurosurg. 2011;114:769–779. doi: 10.3171/2010.5.JNS1014. [DOI] [PubMed] [Google Scholar]
- 19.Hellman S, Weichselbaum RR. Oligometastases. J Clin Oncol. 1995;13:8–10. doi: 10.1200/JCO.1995.13.1.8. [DOI] [PubMed] [Google Scholar]
- 20.Milano MT, Katz AW, Muhs AG, et al. A prospective pilot study of curative-intent stereotactic body radiation therapy in patients with 5 or fewer oligometastatic lesions. Cancer. 2008;112:650–658. doi: 10.1002/cncr.23209. [DOI] [PubMed] [Google Scholar]
- 21.Bakitas M, Lyons KD, Hegel MT, et al. Effects of a palliative care intervention on clinical outcomes in patients with advanced cancer: The project ENABLE II randomized controlled trial. JAMA. 2009;302:741–749. doi: 10.1001/jama.2009.1198. [DOI] [PMC free article] [PubMed] [Google Scholar]
- 22.Sheehan JP. Radiosurgery in patients with renal cell carcinoma metastasis to the brain: Long-term outcomes and prognostic factors influencing survival and local tumor control. J Neurosurg. 2003;98:342–349. doi: 10.3171/jns.2003.98.2.0342. [DOI] [PubMed] [Google Scholar]
- 23.Kilburn JM, Ellis TL, Lovato JF, et al. Local control and toxicity outcomes in brainstem metastases treated with single fraction radiosurgery: Is there a volume threshold for toxicity? J Neurooncol. 2014;117:167–174. doi: 10.1007/s11060-014-1373-x. [DOI] [PMC free article] [PubMed] [Google Scholar]
Associated Data
This section collects any data citations, data availability statements, or supplementary materials included in this article.