Abstract
African trypanosomiasis, otherwise known as sleeping sickness in humans and nagana in animals, is a parasitic protist passed cyclically by the tsetse fly. Despite more than a century of control and eradication efforts, the fly remains widely distributed across Africa and coextensive with other prevalent diseases. Control and planning are hampered by spatially and temporally variant vector distributions, ecologically irrelevant boundaries, and neglect. Tsetse are particularly well suited to move into previously disease-free areas under climate change scenarios, placing unprepared populations at risk. Here we present the modeling framework ATcast, which combines a dynamically downscaled regional climate model with a temporally and spatially dynamic species distribution model to predict tsetse populations over space and time. These modeled results are integrated with Kenyan population data to predict, for the period 2050 to 2059, exposure potential to tsetse and, by association, sleeping sickness and nagana across Kenya.
Keywords: climate change, Kenya, risk projection, spatial models, tsetse
African trypanosomiasis (AT), a neglected tropical disease, is a zoonotic, parasitic infection of wildlife, domesticated animals, and humans. Its causative agents (parasites of the Trypanosoma brucei species complex) are transmitted by the bite of the tsetse fly (genus Glossina). Approximately 8.5 million km2 in thirty-seven sub-Saharan Africa countries are infested with tsetse (Allsopp 2001), resulting in approximately 70 million people with exposure risk (World Health Organization [WHO] 2010). Two major epidemics occurred in the first half of the twentieth century, one between 1896 and 1906 and the other in 1920 (WHO 2010). By the mid-1960s, human African trypanosomiasis (HAT) appeared to be under control. By the mid-1970s, however, HAT reemerged due to a breakdown in surveillance and control programs compounded by drug resistance, genetic changes in the parasite, civil conflict, and anthropogenic (land use and cover changes) and natural (climate) environmental change. In the mid-1990s it was estimated that at least 300,000 cases were underreported due to lack of surveillance capabilities, diagnostic expertise, and health care access (WHO 2010). In response to these limitations, the WHO, with public and private partnerships, initiated a new surveillance and elimination program, under which approximately 25,000 new cases were reported with an annual estimated rate of 50,000 to 70,000 cases (Weekly Epidemiological Record 2006). In 2010, the number of reported human cases of the disease dropped to 7,131, leading some to hope for eventual complete control of the human disease complex (WHO 2011). The disease is also considered one of the most important economically debilitating diseases in sub-Saharan Africa, with animal African trypanosomiasis (AAT) reducing livestock productivity by 20 percent to 40 percent in tsetse areas (Hursey 2001). In Kenya, where agriculture accounts for roughly a quarter of gross domestic product, the economic burden of African trypanosomiasis is acutely felt at both local and national scales (Bourn et al. 2001).
We hypothesize that climate change and anthropogenic activity combine to modify the environment to enhance or degrade habitat suitability for tsetse. We know that tsetse occupy environmental niches in Kenya that, based on existing biophysical data, they should not, and we know that tsetse are missing from areas in Kenya where they should exist in large and stable populations. These findings make cost-effective surveillance, control, and intervention efforts extremely difficult and traditional epidemiological prediction almost impossible. Many studies of tsetse exist (cf. Welburn, Maudlin, and Simarro 2009), but there are no disease vector studies that integrate fundamental niche models, species movement models, and climate change data. Some studies for other vectors have shown promise (i.e., Peterson [2009] for malaria; González et al. [2010] for leishmaniasis), but validation is largely limited to existing data sets (Kulkarni, Desrochers, and Kerr 2010) and often only linked to temporally static, biophysical variables. Although consistently reported to be important, few studies have empirically linked human activities, ecological stressors, vector responses, and disease emergence interacting at multiple spatio-temporal scales. In response, we quantify systematically the space–time distribution of tsetse across Kenya and deterministically predict the changing tsetse distributions expected to emerge with a changing climate. Future tsetse distributions are then placed and discussed within the social framework of Kenya.
Tsetse Control
Today, the international public health strategy for many vector-borne diseases has changed from eradication to ecological perspective vector control (Torr, Hargrove, and Vale 2005; Ferguson et al. 2010). A wide variety of techniques exist to control tsetse populations, including insecticide spraying, wild host culling, and land cover modification. The combination of ineffective application, emergent resistance, and environmental concerns, however, motivated the search for alternative strategies (Grant 2001). The sterile insect technique, one such alternative that has received widespread publicity for controlling tsetse in Zanzibar, has been ineffective in other locations. Anthropogenic landscape modification (autonomous control) involves the removal of tsetse habitat through the natural expansion of human settlement and cropland. This indirect method of control is the most effective and least expensive of the land clearing methods; however, it is difficult to quantify the extent to which tsetse habitat is reduced and it is not a practical policy solution (Bourn et al. 2001). The most frequently used ecologically friendly techniques are point-source control methods, which attract the flies with a combination of visual and odor cues to traps or targets (Leak, Ejigu, and Vreysen 2008). Although cost effective, widespread implementation of point-source control methods has been difficult and never effective over the long term. In East Africa, governments generally lack the infrastructure to manage and sustain the traps over large, diffuse affected areas and often situate traps or targets with only anecdotal evidence of tsetse presence (Hide 1999).
Tsetse and Trypanosomiasis in Kenya
Eight species of tsetse are found in Kenya, covering roughly 25 percent of Kenya’s land area, including 60 percent of productive rangeland. Tsetse occupy diverse habitats in distinct “fly belts”: the North and South belts near Mt. Kenya, the South Rift, Lake Victoria basin, Central Kenya, Trans Mara-Narok, and the Coastal belts. These belts are infested with one or more tsetse species with distributional limits that are set by intersections of physical, biological, and anthropogenic boundaries (Ford 1971). The most common habitats are riparian vegetation and woody savannah. Typical environmental limits for tsetse are day temperatures below 17°C and above 36°C, annual rainfall less than 300 mm, and lack of suitable resting sites (Jordan 1986; Terblanche et al. 2008). Different tsetse fly species can coexist in the same areas, making it difficult to assess quickly the causative agent in human or animal epidemics (Hide 1999). Tsetse flies are one of the few insect K-strategists, with long life expectancy (average of ninety days per female), high survival rates (>90 percent daily survivorship in adults), and low reproduction rates of one live pupa deposited in a suitable soil every six to nine days. The tsetse fly vector carries the parasites to different animal hosts, allowing cyclical transmission, but the primary animal reservoirs are wild ungulates and domestic cattle. Humans might also contribute to the reservoir pool (WHO 2010), and both animals and humans contribute to Trypanosoma genetic exchange (Hide 1999). Taxonomically, tsetse exist as three distinct clades. We focus on the morsitans or savannah group.
Methods
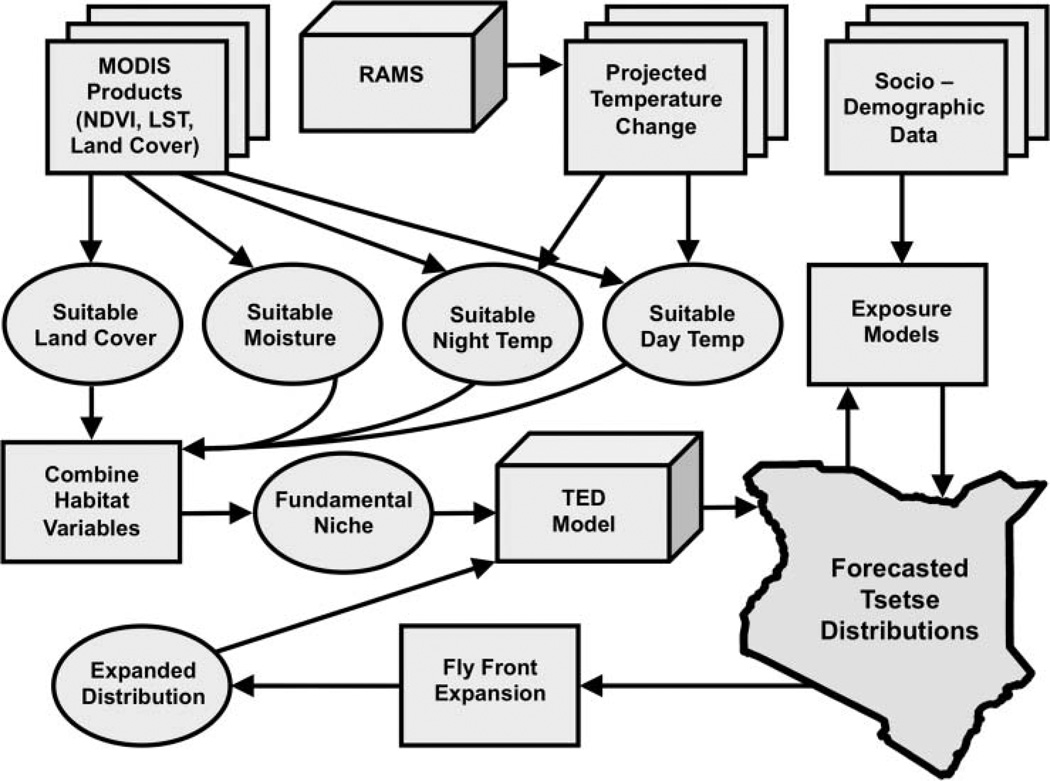
Our modeling environment, ATcast (for African Trypanosomiasis Forecasting System), is an integrated space–time projection ecological model (Figure 1). The Tsetse Ecological Distribution (TED) model (DeVisser et al. 2010), a spatially explicit dynamic subcomponent of ATcast, predicts tsetse distributions at 250-m spatial and sixteen-day temporal resolution and can be described in two parts: (1) a spatially explicit fundamental niche model that identifies suitable tsetse habitat and (2) a fly movement model that integrates tsetse distributions and fly movement rates. The fundamental niche model uses four Moderate Resolution Imaging Spectroradiometer (MODIS) data sets: (1) the MODIS Terra Normalized Difference Vegetation Index (NDVI) Vegetation Indices 250 m V005 (MOD13Q1) product as a surrogate for available moisture (Williams et al. 1992), (2) the MODIS Terra Day Land Surface Temperature (LST) 1 km V005 product (MOD11A2), (3) the MODIS Terra Night LST 1 km V005 product (MOD11A2), and (4) the 1 km MODIS type 1 Global Land Cover product. Each of the four data sets is classified to a suitable versus unsuitable habitat classification scheme and combined to create a tsetse fundamental niche map every sixteen days. Temperature, moisture, and land cover parameterizations vary by species, but here are set for G. morsitans, commonly known as the woody savannah species and the most spatially extensive tsetse in Kenya (Bourn et al. 2001).
Figure 1.
The African Trypanosomiasis Forecasting System (ATcast) modeling framework. MODIS = Moderate Resolution Imaging Spectroradiometer; NDVI = Normalized Difference Vegetation Index; LST = Land Surface Temperature; RAMS = Resional Atmospheric Modeling System; TED = Tsetse Ecological Distribution.
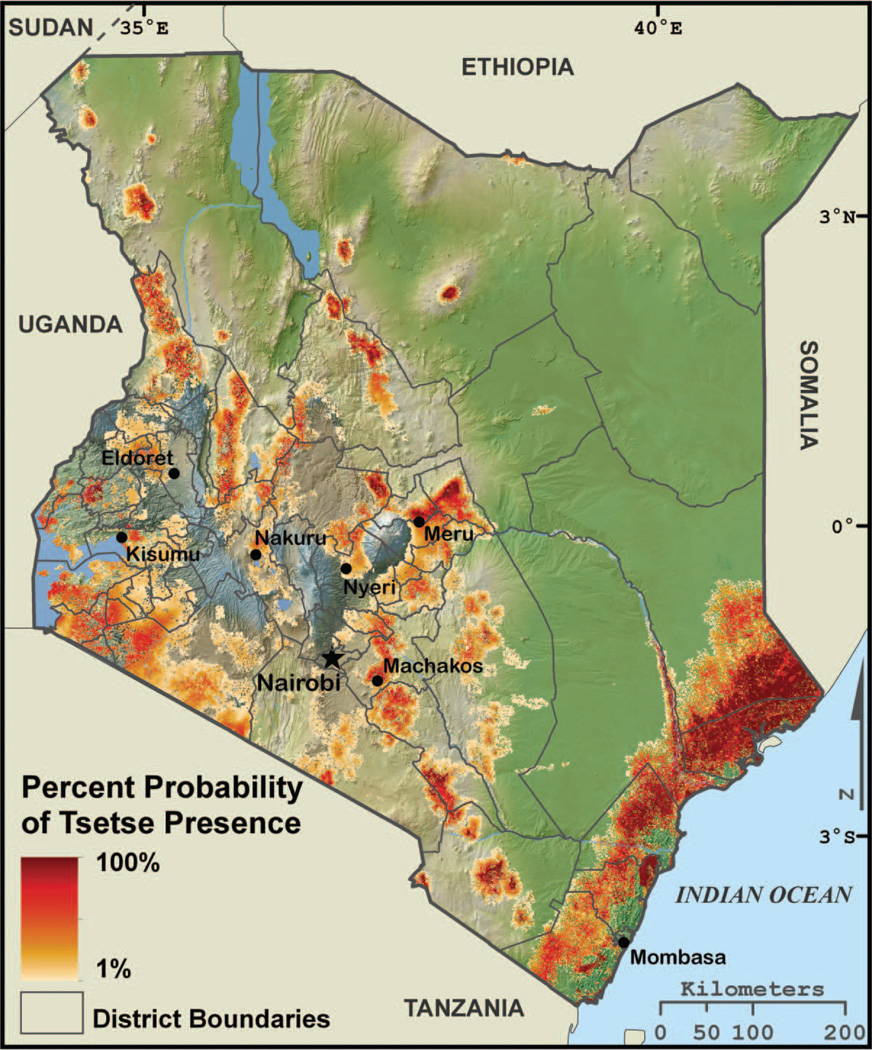
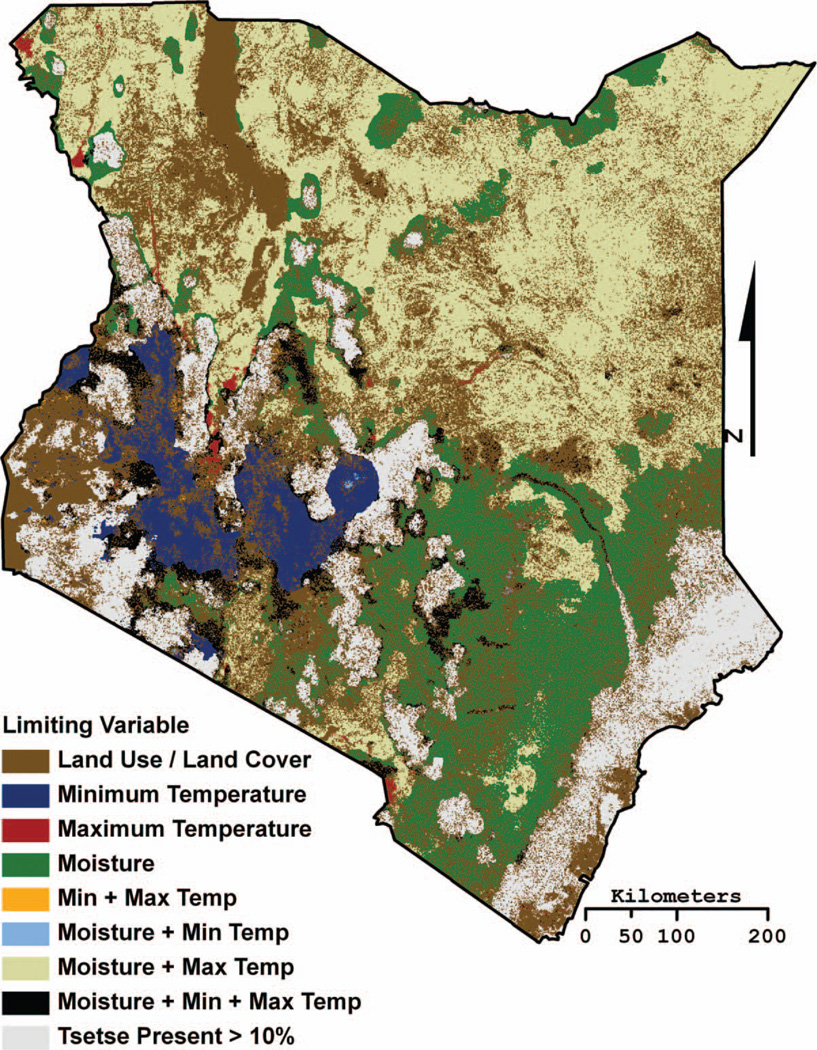
Habitat suitability alone is a poor predictor of tsetse presence, so a fly movement model was developed to identify potential tsetse distributions within the fundamental niche. The fly movement model does not predict the movement rates of individuals but rather models tsetse distributions as a dynamic population-scale “fly front” (Hargrove 2000). If ecologically suitable tsetse habitat predicted by the fundamental niche model is encountered by the expanded tsetse distributions, then tsetse are allowed to persist in that location. This results in individual binary presence–absence maps at sixteen-day intervals, from 1 January 2001 to the acquisition date of the most recently available MODIS data products used in the model (here 15 October 2010). The probability of tsetse presence is the product of the sum of the binary distribution maps divided by the total number of scenes. The maximum extent of tsetse distributions is also produced and identifies any cells in which tsetse were predicted present during the time period analyzed (Figure 2). The formal validation of the TED model is presented in DeVisser et al. (2010). Figure 3 is the limiting variable map constructed by using one landscape variable (i.e., day LST, night LST, NDVI, or Land Cover) at a time to model sensitivity of the tsetse fundamental niche. The maximum extents of tsetse distributions were then calculated for each of the four maps and compared to the normal TED model maximum extent map, identifying locations where one or more landscape variables are limiting tsetse distributions. The limiting variable map helps identify those areas immediately susceptible to change (Figure 3). For example, if under a future climate scenario moisture were to increase, these areas might become suitable for tsetse. Alternatively, areas where land cover is the limiting variable would likely become suitable if the land was abandoned. The minimum and maximum temperature limiting variables are explicitly modeled in the following climate projection section.
Figure 2.
The Tsetse Ecological Distribution (TED) model percentage probability map overlaid on a physiographic map of Kenya. The location of several of the largest cities and district boundaries are included as indicators of higher human population densities. (Color figure available online.)
Figure 3.
The spatial location where an environmental variable (i.e., land cover, minimum temperature, maximum temperature, and moisture) limits tsetse distributions within the Tsetse Ecological Distribution (TED) model. Combination classes indicate locations where more than one variable limits tsetse distributions (e.g., moisture + maximum temperature predicted to be both too hot and too dry at some point in the year for tsetse distributions to persist). The tsetse present >10% class indicates the locations where the TED model percentage probability map predicts a greater than 10 percent probability of tsetse always being present. (Color figure available online.)
To model climate change, we loosely coupled the Regional Atmospheric Modeling System (RAMS) version 4.4 (Cotton et al. 2003) with TED. The RAMS model is a state-of-the-art atmospheric model that numerically solves the fully compressible nonhydrostatic equations described by Tripoli and Cotton (1982) and captures exchanges of heat, momentum, and radiation between the surface and atmosphere. The modeled spatial extent spanned Kenya, Tanzania, Uganda, Rwanda, and Burundi and the vertical domain had thirty-three levels stretching to 32,581 m high. Surface and vegetation dynamics were governed by the LEAF-2 submodel (Walko et al. 2000). Land cover was taken from Torbick et al. (2006) with land cover parameters including albedo and fractional cover linked to appropriate global land cover classes. The RAMS parameterization was similar to that described in Moore et al. (2010), which documents extensive validation against observation and explains how MODIS vegetation time-series spline functions replaced more generic latitude–longitude functions to represent leaf area index and fractional cover for East Africa. For validation, six-hourly boundary conditions were obtained from the National Centers for Environmental Prediction (Kalnay et al. 1996).
The RAMS-derived climate simulations spanned two decades: 2000–2009 and 2050–2059, driven with boundary conditions supplied from the Community Climate System Model 3.0 SRES Scenario A1B (cf. Gent 2006); CO2 levels with RAMS were updated in concordance with the boundary conditions. To explore possible changes in tsetse distributions given potential climate change, projected change in mean monthly minimum and maximum temperature between 2001 and 2009 and 2051 and 2059 from RAMS were added to the mean MODIS LST data and used as inputs in the TED model. The change in mean monthly minimum temperature was added to the mean nighttime LST data under the assumption that minimum temperatures most often occur at night. The change in mean monthly maximum temperature was subsequently added to the mean daytime LST data. Given the use of mean LST data, mean NDVIs in conjunction with the mode land use–land cover (LULC) class of each cell were used in lieu of projected NDVI and LULC data. The tsetse percentage probability map and maximum extent map from the TED model using the RAMS-projected changes in mean monthly temperature were then compared to the maps generated using the mean day and night LST, mean NDVI, and mode LULC data from 2001 to 2009, and potential changes in tsetse distributions were then identified.
At mesoscales, model assessment and validation were divided into design evaluation, sensitivity, and application error and uncertainty (cf. Santner, Williams, and Notz 2003). The projection components were particularly challenging to evaluate. There are very few studies that address uncertainty attendant to regional climate model choice due to the complexities of multiple comparable simulations (model intercomparison projects excepted). The few that have indicate that the choice of regional climate model has a large impact on measures of uncertainty, particularly in areas where parameterizations are poorly characterized. Because climate uncertainty propagates into forecast models, this additional constraint allowed for defining the limits of the ATcast projections (cf. Moore and Messina 2010). To reduce model-driven uncertainty in the results, the climate projections focused on the use of temperature data alone. Moisture, population, and land cover projections could all be used, but the cone of uncertainty would surely exceed the parameter space of even this deterministic model implementation.
Results and Discussion
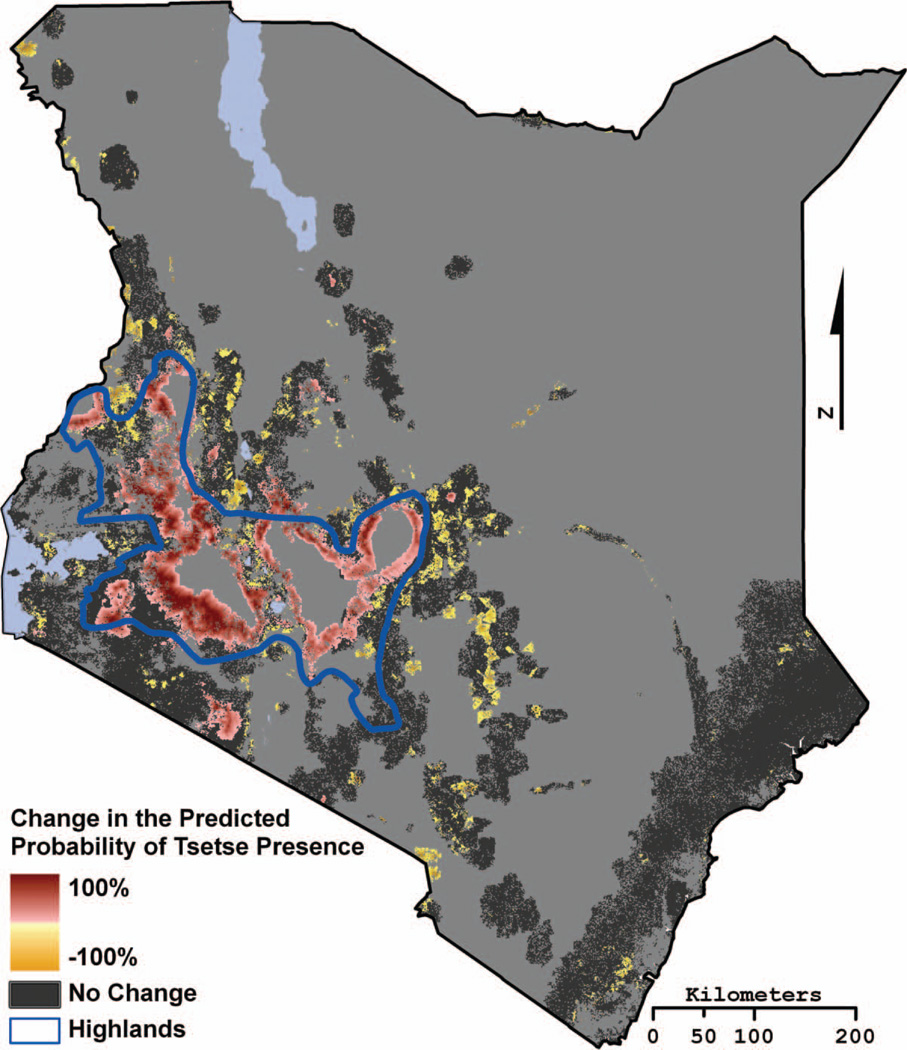
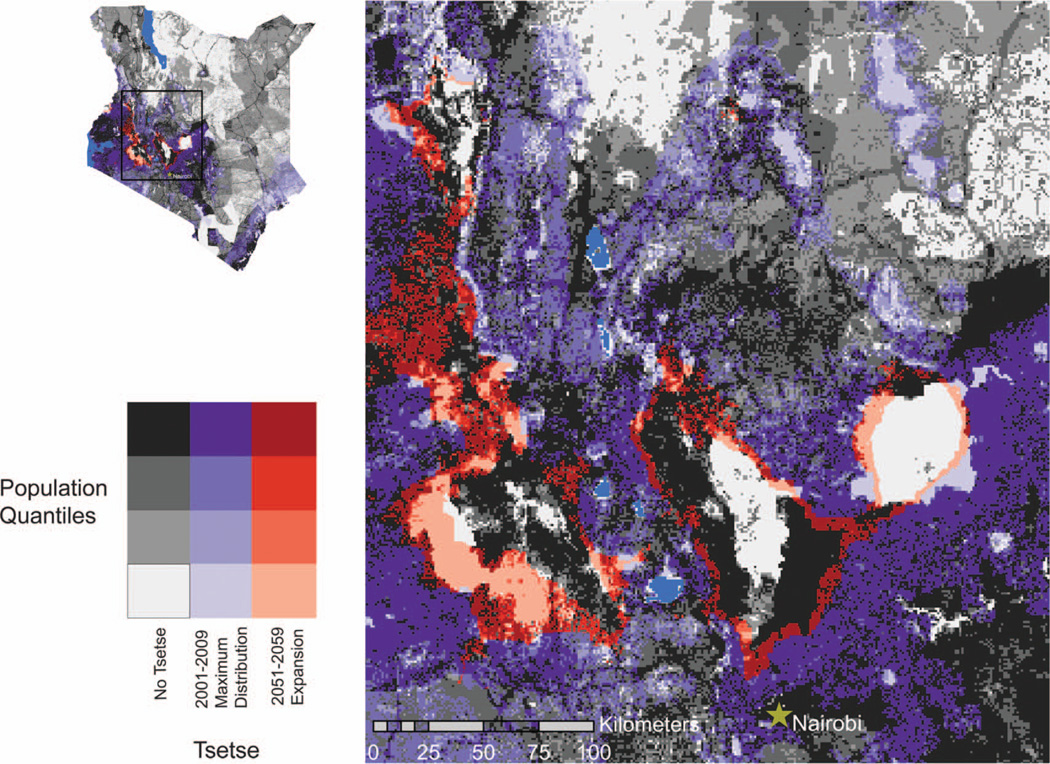
The risk of acquiring AT is largely dependent on the intensity and duration of tsetse exposure and the susceptibility of the host population. Figure 4 presents those areas with emerging tsetse populations and those areas that should experience a decline in tsetse, with the important Highlands region identified. Slightly less than 20 percent of Kenya’s land is considered high- or medium-potential agricultural land (Alila and Atieno 2006). Because most of Kenya’s croplands are concentrated in the higher and historically more reliable rainfall zones of the Highlands, Lake Victoria basin, and a narrow strip along the coast, cropping and mixed farming have a distinct spatial distribution across Kenya. In fact, more than 90 percent of Kenya’s croplands are found in these areas, and specifically for all areas identified as impacted by changing tsetse distributions in Figure 4, agriculture is the predominant occupation (World Resources Institute et al. 2007). Figure 5 is a bivariate plot map comparing current and future tsetse distributions, focusing on the Highlands region, with human population quantiles derived from the 2008 gridded global population data (Landscan 2008).
Figure 4.
The Tsetse Ecological Distribution (TED) model–projected change in the percentage probability of tsetse occurrence based on projected change in temperature from Regional Atmospheric Modeling System. An expansion of tsetse indicates a location where tsetse were not predicted in 2001–2009 but are projected by 2051–2059. A contraction in tsetse indicates a location where tsetse were predicted in 2001–2009 but not projected as present by 2051–2059. A positive value indicates a location where the probability of tsetse occurrence is projected to increase by the displayed percentage. Conversely, a negative value indicates a location where the probability of tsetse occurrence is projected to decrease by the displayed percentage. The region referred to as the Kenyan Highlands is outlined in blue. (Color figure available online.)
Figure 5.
Present tsetse distributions (2001–2009) and future tsetse expansion areas (2051–2059) with corresponding distributions of human population. The future expansion of tsetse distributions will take place primarily in the Highlands, the most populated areas of Kenya. Human population in areas of no tsetse is represented with colors ranging from light gray to black. Human population in areas of present tsetse distributions is represented with colors ranging from light purple to dark purple. Human population in areas of future tsetse expansion is represented with colors ranging from light red to dark red. Ancillary data sources: Population (Landscan 2008), lakes (World Resources Institute et al. 2007). (Color figure available online.)
Following van de Steeg et al.’s (2010) Highland districts definition, Table 1 identifies districts of greatest tsetse expansion and, of these, all but Koibatek and Elgeyo are found in the Highlands. Further, of the districts where expansion is taking place, only Narok and Koibatek have a population density lower than Kenya’s population average. Of the districts where the greatest amount of contraction is taking place, only Machakos is found in the Highlands and only Makueni and Machakos have population densities greater than Kenya’s average population density.
Table 1.
Districts with greatest expansion and contraction in tsetse distributions from 2001–2009 period to 2051–2059 period
| Expansion | |||
|---|---|---|---|
| District/area of district (km2) | Expansion (km2) | Population density | Predominant livelihood strategy |
| Narok/17,731.80 | 1,866.41 | 33.39 | PA/WLUL/MF-H |
| Uasin Gishu/3,373.89 | 962.35 | 232.35a | MF-H/WLUL |
| Nakuru/7,605.95 | 708.68 | 180.00a | MF-H/MF-M/WLUL |
| Kericho/2,581.04 | 638.84 | 285.50a | MF-H/WLUL |
| Bomet/2,369.87 | 600.74 | 247.72a | MF-H/MF-M/WLUL/FMF |
| Nyandarua/3,270.53 | 574.98 | 170.68a | MF-H/MF-M/WLUL |
| Nyeri/3,370.60 | 567.72 | 219.09a | MF-H/MF-M/FMF/WLUL |
| Nandi/2,873.14 | 485.81 | 218.81a | MF-H |
| Koibatek/2,996.59 | 394.29 | 53.88 | MF-H/MF-M |
| Elgeyo/1,450.21 | 278.84 | 113.31a | MF-M/PA |
| Contraction | |||
|---|---|---|---|
| District/area of district (km2) | Contraction (km2) | Population density | Predominant livelihood strategy |
| Kitui/30,391.70 | 662.81 | 30.88 | MF-M/WLUL/FMF |
| Kajiado/21,847.20 | 511.92 | 18.63 | PA/MF-M/WLUL |
| Turkana/61,037.30 | 397.87 | 8.3 | PA/WLUL |
| West Pokot/9,284.93 | 303.62 | 36.86 | PA/MF-M |
| Makueni/8,281.20 | 206.32 | 105.92a | MF-M |
| Baringo/7,943.17 | 187.35 | 34.72 | PA/MF-M |
| Machakos/6,021.20 | 167.22 | 176.78a | MF-M/WLUL |
| Koibatek/2,996.59 | 144.88 | 53.88 | MF-H/MF-M |
| Samburu/21,189.30 | 131.52 | 7.96 | PA |
| Isiolo/25,114.10 | 115.09 | 4.65 | PA |
Note: Expansion represents the potential increase in tsetse distributions within a district from the 2001–2009 period to the 2051–2059 period. Contraction represents the potential decrease in tsetse distributions within a district from the 2001–2009 period to the 2051–2059 period. Population figures calculated using Landscan (2008) product for Kenya. MF-H = mixed farming—high potential; MF-M = mixed farming—marginal; PA = pastoral or agropastoral; WLUL = waged labor or urban livelihood; FMF = forests or mixed fishing. Livelihood strategies determined using World Resources Institute et al. (2007).
Indicates that district population is greater than the 2008 average population density of 68 people/km2 (Landscan 2008).
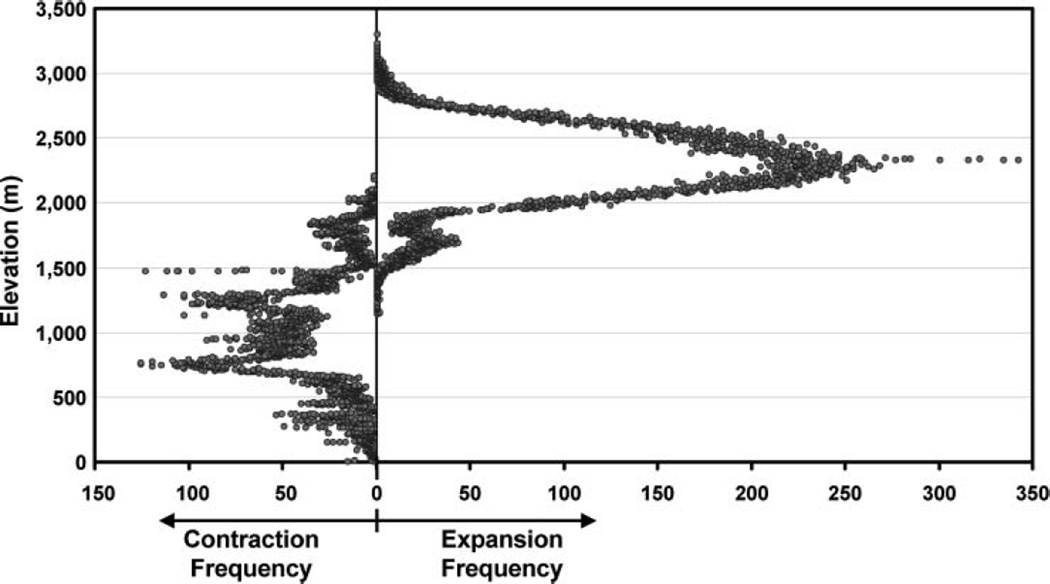
Of the districts with the greatest net change (Table 2), only Kitui and Kajiado are experiencing a net decrease in tsetse distributions, both rangeland districts with relatively low human population densities. Of the districts with the greatest net change, all districts experiencing a net increase in tsetse distributions are found in the Highlands (notice that the two non-Highland districts where expansion was taking place—Koibatek and Elgeyo—are no longer listed). Additionally, apart from Narok, all districts with a net increase have a population density greater than Kenya’s average population density. Figure 6 presents an alternative view of the distribution of expansion and contraction zones. Although the Highland region is not all at similarly high elevations, it represents a general physiographic description of the region. That the link between elevation change and expansion or contraction is strong is not surprising given that the dynamic variable was temperature. It does provide additional support for the concern that tsetse will expand into the economically critical higher elevation areas of Kenya.
Table 2.
Districts with the greatest net change in tsetse distributions from 2001–2009 period to 2051–2059 period
| Net change | |||
|---|---|---|---|
| District/area of district (km2) | Net change (km2) | Infested % 2001–2009 | Infested % 2051–2059 |
| Narok/17,731.80 | 1,840.83 | 56.64 | 67.02 |
| Uasin Gishu/3,373.89 | 957.35 | 20.78 | 49.15 |
| Kitui/30,391.70 | −662.81 | 19.39 | 17.21 |
| Kericho/2,581.04 | 638.84 | 49.78 | 74.53 |
| Nakuru/7,605.95 | 629.44 | 27.92 | 36.20 |
| Bomet/2,369.87 | 600.74 | 57.72 | 83.07 |
| Nyandarua/3,270.53 | 574.98 | 5.07 | 22.65 |
| Nyeri/3,370.60 | 567.72 | 37.77 | 54.62 |
| Kajiado/21,847.20 | −511.92 | 14.06 | 11.72 |
| Nandi/2,873.14 | 485.81 | 38.07 | 54.98 |
Note: Net change represents the districts with the greatest total change in potential tsetse distributions from the 2001–2009 period to the 2051–2059 period.
Figure 6.
The frequency of cells with projected expanded/contracted maximum extent tsetse distributions from the Tsetse Ecological Distribution (TED) model using projected change in temperature from Regional Atmospheric Modeling System, plotted against elevation in 1-m increments.
Susceptible human populations are those who live in proximity or travel into ecosystems suitable for tsetse habitation in which there are inadequate control or population preventative measures. It is likely that males and females within different age groups have different occupation and mobility patterns, resulting in similar levels of risk within ecosystems but differential levels of risk across ecosystems. Further, infected populations with lower incomes are at higher risk of debilitating sequelae because of limited access to preventative and curative resources. Finally, varying levels of population density are associated with varying levels of human risk depending on the threshold level of the ecosystem and tsetse prevention and control efforts. Specifically, emerging epidemic or endemic ecosystems require different thresholds of tsetse vectors and infective reservoirs to support the transmission cycle. For example, in densely populated Highland areas trypanosomiasis transmission might have high potential in emerging ecosystems (i.e., new tsetse niches) if there is a growing human-infection reservoir base in addition to animal reservoirs and prevention and control measures have not been initiated.
At the contextual level, political commitment, the transportation network, and the socioeconomic infrastructure in which populations reside and travel can directly or indirectly impact the transmission cycle at different scales. Structural factors at both national and local scales include policies related to resource allocation for trypanosomiasis prevention and control programs, health care, and laboratory facilities dedicated to the diagnosis and treatment of trypanosomiasis infection. Further, the proximity of major and minor towns (i.e., distance and time) to tsetse or animal reservoir control programs influences the likelihood of correct diagnosis. Area poverty might increase the risk of tsetse exposure and human trypanosomiasis via the poor quality of the local environment (e.g., presence of wild animal reservoirs and overgrowth of brush). Finally, it is likely that future contextual factors (i.e., structural factors and area poverty) will indirectly impact tsetse exposure and trypanosomiasis infection by exacerbating population-level risk factors in certain ecosystems. These demographic and social variables and their direct and indirect interactive effects on the risk of human trypanosomiasis infection should drive specific risk-reduction control strategies.
Tsetse flies are a particularly attractive vector insect for disease ecology space–time modeling. First, tsetse fly populations of the various known species tend to have low vagility (i.e., low dispersal rate) and tend to cluster in favorable habitats. Second, tsetse population density varies substantially seasonally, and there is only modest evidence for density-dependent control of population density, suggesting that density-independent factors operate primarily in regulating population size (Rogers and Randolph 1985). Thus, both locally and regionally, populations can be expected to vary spatially in density as a function of the availability and dynamics of adequate habitat for adults and for their live-born progeny. This largely explains the mystery surrounding emergent and disappearing populations, but scalar climate impacts alter the ability of tsetse to move into historically occupied spaces and also open historically inhospitable spaces. This is not endogenously predictable and is completely missed by the traditionally relied upon presence-only sampling.
Climate change will alter many infectious disease systems and impact heretofore unsuspecting and vulnerable populations (cf. Sutherst 2004). We certainly agree with Rogers and Randolph’s (2002) assertion that proposals for the eradication of tsetse typically ignore historical, political, and ecological precedents. Tsetse flies exist in a complex space–time dynamic directly driven by ecological and anthropomorphic conditions. Reflecting this, ATcast produces spatio-temporal map products identifying the realized niche for tsetse and populations at risk given the complex multiscale interactions of climate, people, and the environment.
Tsetse and AT are very likely to (re)emerge under climate change scenarios as significant disease challenges. Planning, mapping, and monitoring efforts benefit from collaborations among interested organizations, although much remains to be done (Simarro et al. 2010). The probable expansion of tsetse into the Kenyan Highlands directly threatens the core of the agricultural dairy industry and places what is currently a large population of people at new exposure risk. By effectively preparing the health care system, veterinary services, and control measures, these potentially serious impacts might be mitigated.
Acknowledgments
This research was supported by the National Institutes of Health, Office of the Director, Roadmap Initiative, and NIGMS Award No. RGM084704A.
References
- Alila PO, Atieno R. Agricultural policy in Kenya: Issues and processes. Paper presented at the Future Agricultures Consortium Workshop, Institute of Development Studies; University of Sussex, UK. 2006. [Google Scholar]
- Allsopp R. Options for vector control against trypanosomiasis in Africa. Trends in Parasitology. 2001;17(1):15–19. doi: 10.1016/s1471-4922(00)01828-6. [DOI] [PubMed] [Google Scholar]
- Bourn D, Reid R, Rogers D, Snow B, Wint W. Environmental change and the autonomous control of tsetse and trypanosomiasis in sub-Saharan Africa. Oxford, UK: Information Press; 2001. [Google Scholar]
- Cotton WR, Pielke RA, Sr, Walko RL, Liston GE, Tremback C, Jiang H, McAnelly RL, Harrington JY, Nicholls ME. RAMS 2001: Current status and future directions. Meteorology Atmospheric Physics. 2003;82(1–4):5–29. [Google Scholar]
- DeVisser MH, Messina JP, Moore NJ, Lusch DP, Maitima J. A dynamic species distribution model of Glossina subgenus Morsitans: The identification of tsetse reservoirs and refugia. Ecosphere. 2010;1(1) Art. 6. [Google Scholar]
- Ferguson HM, Dornhaus A, Beeche A, Borgemeister C, Gottlieb M, Mulla MS, Gimnig JE, Fish D, Killeen GF. Ecology: A prerequisite for malaria elimination and eradication. PLoS Medicine. 2010;7(8):e1000303. doi: 10.1371/journal.pmed.1000303. [DOI] [PMC free article] [PubMed] [Google Scholar]
- Ford J. The role of the trypanosomiases in African ecology: A study of the tsetse fly problem. Oxford, UK: Oxford University Press; 1971. [Google Scholar]
- Gent PR, editor. Special issue on Community Climate System Model (CCSM) Journal of Climate. 2006;19(11) [Google Scholar]
- González C, Wang O, Strutz SE, González-Salazar C, Sánchez-Cordero V, Sarkar S. Climate change and risk of leishmaniasis in North America: Predictions from ecological niche models of vector and reservoir species. PLoS Neglected Tropical Diseases. 2010;4(1):e585. doi: 10.1371/journal.pntd.0000585. [DOI] [PMC free article] [PubMed] [Google Scholar]
- Grant IF. Insecticides for tsetse and trypanosomiasis control: Is the environmental risk acceptable? Trends in Parasitology. 2001;17(1):10–14. doi: 10.1016/s1471-4922(00)01848-1. [DOI] [PubMed] [Google Scholar]
- Hargrove JW. A theoretical study of the invasion of cleared areas by tsetse flies (Diptera: Glossinidae) Bulletin of Entomological Research. 2000;90:201–209. doi: 10.1017/s0007485300000328. [DOI] [PubMed] [Google Scholar]
- Hide G. History of sleeping sickness in East Africa. Clinical Microbiology Reviews. 1999;12(1):112–125. doi: 10.1128/cmr.12.1.112. [DOI] [PMC free article] [PubMed] [Google Scholar]
- Hursey BS. The programme against African trypanosomiasis: Aims, objectives and achievements. Trends in Parasitology. 2001;17(1):2–3. doi: 10.1016/s1471-4922(00)01851-1. [DOI] [PubMed] [Google Scholar]
- Jordan AM. Trypanosomiasis control and African rural development. New York: Longman; 1986. [Google Scholar]
- Kalnay E, Kanamitsu M, Kistler R, Collins W, Dea-van D, Iredell M, Saha S, et al. The NCEP/NCAR 40-year reanalysis project. Bulletin of the American Meteorology Society. 1996;77(3):437–471. [Google Scholar]
- Kulkarni MA, Desrochers RE, Kerr JT. High resolution niche models of malaria vectors in northern Tanzania: A new capacity to predict malaria risk? PLoS One. 2010;5(2):e9396. doi: 10.1371/journal.pone.0009396. [DOI] [PMC free article] [PubMed] [Google Scholar]
- Landscan. 2008 global population database. Oak Ridge, TN: UT-Battelle, operated by Oak Ridge National Laboratory; 2008. [Google Scholar]
- Leak SGA, Ejigu D, Vreysen MJ. Collection of baseline entomological baseline data for tsetse area-wide integrated pest management programmes. Rome, Italy: Food and Agriculture Organization of the United Nations; 2008. [Google Scholar]
- Moore N, Messina J. A landscape and climate data logistic model of tsetse distribution in Kenya. PLoS One. 2010;5(7):e11809. doi: 10.1371/journal.pone.0011809. [DOI] [PMC free article] [PubMed] [Google Scholar]
- Moore N, Torbick N, Pijanowski B, Lofgren B, Wang J, Kim D-Y, Andresen J, Olson J. Adapting MODIS-derived LAI and fractional cover into the RAMS model in East Africa. International Journal of Climatology. 2010;30(13):1954–1969. [Google Scholar]
- Peterson AT. Shifting suitability for malaria vectors across Africa with warming climates. BMC Infectious Diseases. 2009;9:59. doi: 10.1186/1471-2334-9-59. [DOI] [PMC free article] [PubMed] [Google Scholar]
- Rogers DJ, Randolph SE. Population ecology of tsetse. Annual Review of Entomology. 1985;30:197–216. doi: 10.1146/annurev.en.30.010185.001213. [DOI] [PubMed] [Google Scholar]
- Rogers DJ, Randolph SE. A response to the aim of eradicating tsetse from Africa. Trends in Parasitology. 2002;18(12):534–536. doi: 10.1016/s1471-4922(02)02422-4. [DOI] [PubMed] [Google Scholar]
- Santner TJ, Williams BJ, Notz WI. The design and analysis of computer experiments. New York: Springer-Verlag; 2003. [Google Scholar]
- Simarro PP, Cecchi G, Paone M, Franco JR, Diarra A, Ruiz JA, Fèvre EM, Courtin F, Mattioli RC, Jannin JG. The atlas of human African trypanosomiasis: A contribution to global mapping of neglected tropical diseases. International Journal of Health Geographics. 2010;9:57. doi: 10.1186/1476-072X-9-57. [DOI] [PMC free article] [PubMed] [Google Scholar]
- Sutherst RW. Global change and human vulnerability to vector-borne diseases. Clinical Microbiology Reviews. 2004;17(1):136–173. doi: 10.1128/CMR.17.1.136-173.2004. [DOI] [PMC free article] [PubMed] [Google Scholar]
- Terblanche JS, Clusella-Trullas S, Deere JA, Chown SL. Thermal tolerance in a south-east African population of the tsetse fly Glossina pallidipes (Diptera, Glossinidae): Implications for forecasting climate change impacts. Journal of Insect Physiology. 2008;54(1):114–127. doi: 10.1016/j.jinsphys.2007.08.007. [DOI] [PubMed] [Google Scholar]
- Torbick N, Lusch D, Qi J, Moore N, Olson J, Ge J. Developing land use/land cover parameterization for climate and land modeling in East Africa. International Journal of Remote Sensing. 2006;27(19):4227–4244. [Google Scholar]
- Torr SJ, Hargrove JW, Vale GA. Towards a rational policy for dealing with tsetse. Trends in Parasitology. 2005;21(11):537–541. doi: 10.1016/j.pt.2005.08.021. [DOI] [PubMed] [Google Scholar]
- Tripoli G, Cotton W. The Colorado State University three-dimensional cloud/mesoscale model: Part I. General theoretical framework and sensitivity experiments. Journal de Recherches Atmospheriques. 1982;16:185–219. [Google Scholar]
- Van de Steeg JA, Verburg PH, Baltenweck I, Staal SJ. Characterization of the spatial distribution of farming systems in the Kenyan Highlands. Applied Geography. 2010;30(2):239–253. [Google Scholar]
- Walko RL, Band LE, Baron J, Kittel TGF, Lammers R, Lee TJ, Ojima D, et al. Coupled atmosphere-biophysics-hydrology models for environmental modeling. Journal of Applied Meteorology. 2000;39(6):931–944. [Google Scholar]
- Weekly Epidemiological Record. Human African trypanosomiasis (sleeping sickness): Epidemiological update. Weekly Epidemiological Record. 2006;8(81):69–80. [Google Scholar]
- Welburn SC, Maudlin I, Simarro PP. Controlling sleeping sickness—A review. Parasitology. 2009;136(14):1943–1949. doi: 10.1017/S0031182009006416. [DOI] [PubMed] [Google Scholar]
- Williams B, Rogers D, Staton G, Ripley B, Booth T. Statistical modeling of georeferenced data: Mapping tsetse distributions in Zimbabwe using climate and vegetation data. In: Perry BD, Hansen JW, editors. Modelling vector-borne and other parasitic diseases. Nairobi, Kenya: The International Laboratory for Research on Animal Diseases; 1992. pp. 267–280. [Google Scholar]
- World Health Organization (WHO) [last accessed 30 November 2010];African trypanosomiasis (sleeping sickness) 2010 http://www.who.int/mediacentre/factsheets/fs259/en/
- World Health Organization (WHO) [last accessed 7 July 2011];New cases of human African trypanosomiasis continue to drop: Decline strengthens prospects for elimination. 2011 http://www.who.int/neglected_diseases/disease_management/HAT_cases_drop/en/index.html.
- World Resources Institute; Department of Resource Surveys and Remote Sensing, Ministry of Environment and Natural Resources, Kenya; Central Bureau of Statistics, Ministry of Planning and National Development, Kenya; and International Livestock Research Institute. Nature’s benefits in Kenya, an atlas of ecosystems and human well-being. Washington, DC, and Nairobi, Kenya: World Resources Institute; 2007. [Google Scholar]


