

Abstract
Background
Nasopharyngeal carcinoma (NPC) is an epithelial malignancy highly prevalent in southern China, and incidence rates among Han Chinese people vary according to geographic region. Recently, three independent genome-wide association studies (GWASs) confirmed that HLA-A is the main risk gene for NPC. However, the results of studies conducted in regions with dissimilar incidence rates contradicted the claims that HLA-A is the sole risk gene and that the association of rs29232 is independent of the HLA-A effect in the chromosome 6p21.3 region.
Methods
We performed a meta-analysis, selecting five single-nucleotide polymorphisms (SNPs) in chromosome 6p21.3 mapped in three published GWASs and four case–control studies. The studies involved 8994 patients with NPC and 11,157 healthy controls, all of whom were Han Chinese.
Results
The rs2517713 SNP located downstream of HLA-A was significantly associated with NPC (P = 1.08 × 10−91, odds ratio [OR] = 0.58, 95 % confidence interval [CI] = 0.55–0.61). The rs29232 SNP exhibited a moderate level of heterogeneity (I2 = 47 %) that disappeared (I2 = 0 %) after stratification by moderate- and high-incidence NPC regions.
Conclusions
Our results suggested that the HLA-A gene is strongly associated with NPC risk. In addition, the heterogeneity revealed by the meta-analysis of rs29232 might be associated with regional differences in NPC incidence among Han Chinese people. The higher OR of rs29232 and the fact that rs29232 was independent of the HLA-A effect in the moderate-incidence population suggested that rs29232 might have greater relevance to NPC incidence in a moderate-incidence population than in a high-incidence population.
Electronic supplementary material
The online version of this article (doi:10.1186/s12885-015-1607-0) contains supplementary material, which is available to authorized users.
Background
Nasopharyngeal carcinoma (NPC), a malignancy that forms in the epithelium of the nasopharynx, has a distinct geographic distribution and is highly prevalent in southern China, Southeast Asia, and North Africa. Although all Han Chinese populations exhibit an increased risk of NPC, the incidence rate varies by region. For example, male populations in Guangdong and Guangxi in southern China have consistently exhibited a higher incidence rate (20.6–39.94/100 000 person-years) compared with those in moderate-incidence regions, such as Taiwan (8.6/100 000 person-years), and those in most of the Western world (less than 1/100 000 person-years) [1–5]. The etiology of NPC is multifactorial, involving genetic components, Epstein–Barr virus infection, and other types of environmental exposure [1]. The variations in NPC incidence might be due to differences in environmental exposure among geographic regions; however, the genetic components underlying the differences in incidence in Han Chinese populations remain underexplored.
The genetic association of human leukocyte antigen (HLA) class I genes, particularly HLA-A, with NPC was established in 1974 [6] and has been confirmed in more than 100 association studies adopting traditional HLA genotyping techniques. Studies have consistently identified an association between NPC and HLA-A*1101, HLA-A*0207, and HLA-B*5801 [7–9]. The distribution of these three alleles in the human genome appears to be consistent with the geographical distribution of NPC incidence in southeastern China; the allele frequency is particularly high in regions with high NPC incidence rates [10–12]. However, no difference in HLA allele frequency has been observed in the results of NPC association studies conducted in regions with various incidence rates [13–15], suggesting that the HLA genes might not directly lead to differences in NPC incidence.
Three independent genome-wide association studies (GWASs) [16–18] have identified multiple significant association signals in chromosome 6p21.3 near the HLA-A gene, which exhibited extremely strong linkage disequilibrium (LD) (Fig. 1). These observations raised the question as to whether these associated single-nucleotide polymorphisms (SNPs) represent an independent effect or are only proxies of the HLA-A gene. Studies conducted in medium- and high-incidence regions (Taiwan [16, 19], and Guangdong and Guangxi [17, 18], respectively) have yielded contradictory conclusions.
Fig. 1.
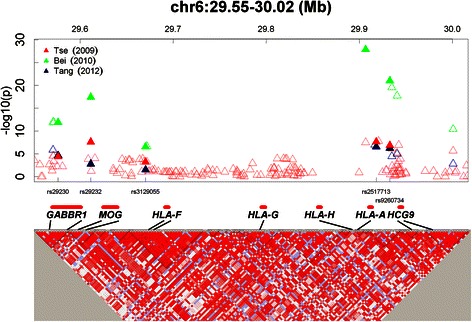
Chromosome 6p21.3 polymorphisms discovered in three NPC GWASs. Top: The triangles indicate the P values reported by the GWASs on a negative logarithmic scale according to the chromosome locations of the SNPs. Red: Tse [16]; Green: Bei [17]; Blue: Tang [18]. The solid triangles indicate the SNPs used in the meta-analysis. The hollow triangles indicate the other SNPs listed in the GWASs. Bottom: Detailed LD structure depicted in HaploView by using control samples from the NPC GWAS in Taiwan [16]. The increasing intensities of red represent lower D’ values
To evaluate the effect of HLA-A and its neighboring gene on NPC susceptibility, we conducted a meta-analysis on the association between the five most frequently studied chromosome 6p21.3 SNPs (rs9260734, rs2517713, rs3129055, rs29232, and rs29230) and NPC susceptibility. Thus far, no meta-analysis has been conducted to explore the overall NPC risk and the genetic heterogeneity associated with chromosome 6p21 SNPs. In the current study, we postulated that moderate heterogeneity in rs29232 might contribute to the regional variation in NPC incidence rates.
Methods
Identification and eligibility of relevant studies
We reviewed the literature on PubMed for all relevant reports (the most recent search update was December 10, 2014), using the search terms “NPC,” “association,” and “HLA,” and limiting the results to English-language papers. In this meta-analysis, studies had to fulfill the following criteria: 1) evaluate the correlation between SNPs mapped by GWASs in the HLA-A region and NPC in Han Chinese populations, 2) use a case–control design, and 3) report the genotype frequency for both cases and controls and/or odds ratios (ORs).
Description of studies
The meta-analysis was based on summary data reported by three previous GWASs on NPC [16–18] and four follow-up case–control studies [19–22] focusing on the HLA class I region. We extracted data according to the aforementioned inclusion criteria. The following data was collected from each study: 1) first author’s name, 2) year of publication, 3) sample collection area, 4) genotyping platform, 5) SNPs assessed, 6) number of cases and controls, 7) sex ratio, and 8) age range (Table 1). Twelve SNPs discovered by Tse et al. [16] were used as major targets for analysis; the citation of these SNPs was standardized using rs numbers, as suggested by Tse et al. For rs2517713, two SNPs (rs2860580 and rs9260475) acted as surrogates according to the strong LD relationship between the target and surrogate SNPs in the HapMap Han Chinese in Beijing (CHB) population (rs2860580–rs2517713: D’ = 1, r2 = 0.90; rs9260475–rs2517713: D’ = 1, r2 = 0.91). When available, the following information was obtained from the studies and included in the meta-analysis: 1) minor allele frequency (MAF) in the case and control samples, 2) P values for the original association, and 3) ORs and 95 % confidence intervals (CIs). When the target SNPs were genotyped in both the discovery and validation groups, the combined genotyping data was used.
Table 1.
Characteristics of the studies included in the meta-analysis
| Stage I | Stage II | |||||||||||||||
|---|---|---|---|---|---|---|---|---|---|---|---|---|---|---|---|---|
| Sample | Genotyping | Sample | Gender (%)a | Ageb | Genotyping | Sample | Gender (%)a | Ageb | ||||||||
| Study | Population | Method | SNPs | Case | Control | Case | Control | Case | Control | Method | Case | Control | Case | Control | Case | Control |
| Tse (2009) | Taiwan | Illumina Hap550 | 480,365 | 277 | 285 | 76 | 67 | 49 (12) | 50 (14) | TaqMan | 635 | 1,640 | 73 | 73 | 50 (13) | 59 (14) |
| Bei (2010) | Guangdongc | Illumina Hap610 | 464,328 | 1,583 | 1,894 | 73 | 69 | 46 (11) | 47 (11) | TaqMan | 3,507 | 3,063 | 74 | 67 | 46 (12) | 44 (12) |
| Tang (2012) | Guangxi and Guangdong | Affymatrix 6.0 | 591,458 | 567 | 476 | - | - | - | - | TaqMan | 923 | 1,105 | - | - | - | - |
| Li (2011) | Guangdong | TaqMan | 233 | 360 | 360 | 72 | 34 | 46 (11) | 41 (9) | |||||||
| Zhao (2012) | Guangdong | SNPstream | 100 | 206 | 180 | 71 | 67 | - | - | Sequenome | 535 | 525 | 73 | 76 | - | - |
| Hsu (2012) | Taiwan | TaqMan | 12 | 337 | 286 | 70 | 70 | 46 | 46 | |||||||
| Gao (2014) | Guangdong and Guangxi | TaqMan | 16 | 350 | 619 | 67 | 43 | 45 (11) | 46 (10) | TaqMan | 816 | 1721 | 73 | 61 | 45 (11) | 46 (12) |
aGender: Male percentage. bAge: mean and standard deviation. cMost of the samples were from Guangdong, except 922 GWAS controls were Han Chinese from Singapore
Assessment of publication bias
Typical publication bias is a result of small sample sizes. Although the studies included in the meta-analysis had an adequate number of cases, the sample sizes were small compared with those of GWASs on other types of cancer. Furthermore, a low level of population admixture in a large study can cause publication bias. Therefore, potential publication bias was assessed using funnel and P–M plots [23, 24]. Funnel plotting and Egger’s linear regression test were performed using the Metafor package [23] in R [25], Version 3.0.2. When publication bias occurred, the funnel plot was noticeably asymmetric. Egger’s linear regression test was used to test the funnel-plot symmetry. The M values of P–M plots represented the posterior probability that an effect existed in each study. A low M value (<0.1) suggested that the study had no effect, and therefore, such studies were excluded from further analysis [24].
Meta-analysis
All meta-analysis results presented in this report were calculated using the Metasoft software package, Version 2.0.1 [26]. The P–M plot, forest plot, and funnel plot were plotted using Metafor [27]. To evaluate the association between 6p21.3 SNPs and the risk of NPC, we calculated the pooled ORs and associated 95 % CIs. Standard meta-analysis involving the fixed effects model and conventional random effects model was conducted using the standard error and effect size reported in each study [24, 27]. If the target SNPs were genotyped in both discovery and validation stages (Table 1), the combined data was used, otherwise only stage I data was used for meta-analysis. The fixed effects model made a conditional inference on the heterogeneity among the true effects, whereas the conventional random effects model treated the heterogeneity as purely random. Sensitivity analysis was conducted to assess the potential influences of any single study on the pooled ORs. In each meta-analysis, included studies were individually removed to ensure that no study significantly altered the pooled ORs and associated P values. Power analysis was conducted using the Power and Sample Size Calculation software Version 3.1.2 [28, 29].
Test of heterogeneity
The heterogeneity effect was quantified using the I2 test [30]. The I2 values ranged from 0 to 100 %, and values of 25, 50, and 75 % were considered to represent low, moderate, and high levels of heterogeneity, respectively. Heterogeneity was estimated using Cochran’s Q statistic, and P < 0.1 was considered to indicate significant heterogeneity [31].
Results
Study selection
The primary search yielded 59 articles, of which seven were identified as potentially relevant, following a review of the title and abstract. In total, seven studies were included in the meta-analysis after a full-text review (Additional file 1: Figure S1). The overall study population in the current meta-analysis comprised 20,151 subjects, of which 8994 were patients with NPC and 11,157 were controls. We analyzed seven studies that examined Han Chinese subjects from Taiwan [16, 19], Guangdong [17, 18, 20–22], and Guangxi [18, 22] (Table 1) and assessed five chromosome 6p21.3 SNPs: (rs9260734 [HCG6], rs2517713 [HLA-A], rs3129055 [HLA-F], rs29232 [GABBR1], and rs29230 [GABBR1]). Two surrogate SNPs, rs2860580 [17] and rs9260475 [21], represented rs2517713 because the LD (D’ = 1, r2 > 0.9) between the target and surrogate SNPs in the HapMap CHB population was extremely high [32].
Publication bias and synthesis of results
We used P–M and funnel plots to assess the publication bias of the included studies, detecting no evidence of potential publication bias in our target SNPs (Additional file 1: Figure S2). As expected, rs2517713 of the HLA-A gene was the most significantly associated with NPC (OR = 0.58, 95 % CI = 0.55–0.61, P = 1.08 × 10−91) (Table 2). Analysis of three of the five SNPs did not reveal heterogeneity (I2 = 0). Although we used surrogate SNPs (rs2860580 and rs9260475) in the meta-analysis of rs2517713, we did not observe publication bias (Additional file 1: Figure S2b) or heterogeneity (I2 = 0, Table 2), suggesting that SNPs with high LD (D’ = 1, r2 > 0.9) could be treated as the same SNP in the meta-analysis. We observed a moderate level of heterogeneity in rs3129055 (I2 = 58 %, P = 0.0361) and rs29232 (I2 = 47 %, P = 0.1091); however, the heterogeneity for rs29232 was not statistically significant (P > 0.1). Because Cochran’s Q statistic is severely underpowered in analyses with only four to five studies, heterogeneity might still exist despite a lack of nominal statistical significance [33]. Two SNPs that exhibited heterogeneity (rs3129055 and rs29232) were the same SNPs independent from the HLA-A effect [16]. The random effect of rs29232 exhibited a highly significant P value of 1.90 × 10⁻¹⁶ (OR = 1.47, 95 % CI = 1.34–1.61); however, the random effect of rs3129055 (P = 1.43 × 10⁻⁵, OR = 1.28, 95 % CI = 1.14–1.42) did not exhibit genome-wide significance (<10−7).
Table 2.
Meta-analysis of the associations between chromosome 6p21 SNPs and NPC susceptibility
| Sample | MAF | Heterogeneity | |||||||||
|---|---|---|---|---|---|---|---|---|---|---|---|
| Gene | SNP | Study | Case | Control | Case | Control | P | OR | 95 % CI | I2 % | P |
| HCG9 | rs9260734 | Tse (2009) | 912 | 1,925 | 0.22 | 0.34 | 6.77E-18 | 0.54 | 0.47–0.62 | ||
| Bei (2010) | 1,583 | 1,894 | 0.22 | 0.33 | 9.80E-22 | 0.56 | 0.49–0.67 | ||||
| Tang (2012) | 923 | 1,105 | - | - | 2.63E-11 | 0.59 | 0.50–0.69 | ||||
| Li (2011) | 360 | 360 | 0.25 | 0.32 | 9.70E-03 | 0.74 | 0.53–1.01 | ||||
| Zhao (2012) | 535 | 525 | - | 0.32 | 3.30E-07 | 0.60 | 0.49–0.73 | ||||
| Hsu (2012) | 336 | 288 | 0.24 | 0.35 | 1.88E-03 | 0.57 | 0.40–0.81 | ||||
| Guo (2014) | 1166 | 2340 | - | - | 5.96E-17 | 0.60 | 0.53–0.68 | ||||
| Fixed effect | 9.68E-57 | 0.59 | 0.55–0.63 | 0 | 0.7774 | ||||||
| Random effect | 9.68E-57 | 0.59 | 0.55–0.63 | ||||||||
| HLA-A | rs2517713 | Tse (2009) | 912 | 1,925 | 0.24 | 0.38 | 3.90E-20 | 0.53 | 0.47–0.61 | ||
| rs2860580a | Bei (2010) | 5,090 | 4,957 | - | - | 3.65E-65 | 0.58 | 0.54–0.62 | |||
| Tang (2012) | 923 | 1,105 | - | - | 1.92E-11 | 0.60 | 0.52–0.70 | ||||
| Li (2011) | 360 | 360 | 0.28 | 0.36 | 5.30E-04 | 0.67 | 0.48–0.91 | ||||
| rs9260475a | Zhao (2012) | 206 | 180 | - | 0.38 | 1.00E-04 | 0.49 | 0.34–0.70 | |||
| Hsu (2012) | 337 | 286 | 0.26 | 0.38 | 1.90E-03 | 0.58 | 0.41–0.82 | ||||
| Guo (2014) | 1166 | 2340 | - | - | 2.44E-16 | 0.62 | 0.55–0.70 | ||||
| Fixed effect | 1.08E-91 | 0.58 | 0.55–0.61 | 0 | 0.5265 | ||||||
| Random effect | 1.08E-91 | 0.58 | 0.55–0.61 | ||||||||
| HLA-F | rs3129055 | Tse (2009) | 912 | 1,925 | 0.41 | 0.31 | 7.36E-11 | 1.51 | 1.34–1.71 | ||
| Bei (2010) | 1,583 | 1,894 | 0.37 | 0.30 | 3.00E-07 | 1.31 | 1.19–1.58 | ||||
| Tang (2012) | 923 | 1,105 | - | - | 3.43E-02 | 1.17 | 1.01–1.34 | ||||
| Li (2011) | 360 | 360 | 0.36 | 0.34 | 3.69E-01 | 1.11 | 0.81–1.50 | ||||
| Hsu (2012) | 344 | 294 | 0.38 | 0.30 | 4.44E-02 | 1.42 | 1.02–1.98 | ||||
| Guo (2014) | 1166 | 2340 | - | - | 2.00E-02 | 1.14 | 1.02–1.28 | ||||
| Fixed effect | 6.44E-12 | 1.26 | 1.18–1.34 | 58 | 0.0361 | ||||||
| Random effect | 1.43E-05 | 1.28 | 1.14–1.42 | ||||||||
| GABBR1 | rs29232 | Tse (2009) | 912 | 1,925 | 0.59 | 0.46 | 8.97E-17 | 1.67 | 1.48–1.88 | ||
| Bei (2010) | 1,583 | 1,894 | 0.53 | 0.43 | 3.90E-18 | 1.56 | 1.43–1.75 | ||||
| Tang (2012) | 923 | 1,105 | - | - | 4.35E-06 | 1.36 | 1.20–1.56 | ||||
| Hsu (2012) | 342 | 290 | 0.53 | 0.41 | 2.41E-03 | 1.63 | 1.19–2.24 | ||||
| Guo (2014) | 1166 | 2340 | - | - | 1.85E-08 | 1.35 | 1.21–1.49 | ||||
| Fixed effect | 1.46E-30 | 1.45 | 1.36–1.54 | 47 | 0.1092 | ||||||
| Random effect | 1.90E-16 | 1.47 | 1.34–1.61 | ||||||||
| GABBR1 | rs29230 | Tse (2009) | 912 | 1,925 | 0.18 | 0.26 | 4.77E-09 | 0.64 | 0.56–0.75 | ||
| Bei (2010) | 1,583 | 1,894 | 0.19 | 0.27 | 1.30E-12 | 0.64 | 0.54–0.75 | ||||
| Tang (2012) | 923 | 1,105 | - | - | 9.48E-09 | 0.61 | 0.52–0.72 | ||||
| Li (2011) | 360 | 360 | 0.18 | 0.27 | 1.43E-04 | 0.61 | 0.42–0.86 | ||||
| Hsu (2012) | 341 | 290 | 0.17 | 0.25 | 2.34E-02 | 0.63 | 0.43–0.93 | ||||
| Guo (2014) | 1166 | 2340 | - | - | 1.36E-13 | 0.62 | 0.57–0.67 | ||||
| Fixed effect | 5.78E-34 | 0.62 | 0.57–0.67 | 0 | 0.9988 | ||||||
| Random effect | 5.78E-34 | 0.62 | 0.57–0.67 | ||||||||
aSNPs used as surrogate for rs2517713. The r2 between rs2860580 and rs2517713 was 0.91; r2 between rs2860580 and rs9260475 was 0.90
Sensitivity analysis
To investigate the potential influence of a single study on the overall meta-analysis estimation, we omitted one study at a time. Similar results were obtained for the three SNPs that did not exhibit heterogeneity (rs9260734, rs2517713, and rs29230) regardless of any study being omitted (Additional file 1: Table S1), indicating that our results were supported by reliable data. The ORs and I2 of the two SNPs exhibiting heterogeneity (rs3129055 and rs29232) calculated using the sensitivity test differed. Power analysis of each target SNP in the total sample size involved the following assumptions: two-tailed α = 0.05 and the frequency of minor alleles in control samples. According to the ORs obtained through meta-analysis, the present sample size showed a power of 1.00 for detecting a significant association.
Subgroup analysis
We stratified the studied population on the basis of region, namely the moderate-incidence region (Taiwan) [16, 19] and high-incidence regions (Guangdong and Guangxi) [17, 18, 22] (Table 3). The heterogeneity decreased markedly from 47 to 0 % in both the moderate- and high-incidence regions, suggesting that the heterogeneity of rs29232 was attributable to the geographical difference in NPC incidence.
Table 3.
Meta-analysis of rs29232 in studies with samples from various incidence regions
| Sample | Fixed effect | Random effect | Heterogeneity | ||||||||
|---|---|---|---|---|---|---|---|---|---|---|---|
| Population | Case | Control | P | OR | 95 % CI | P | OR | 95 % CI | I2 % | P | |
| All | 4,926 | 7,554 | 1.46E-30 | 1.45 | 1.36–1.54 | 1.90E-16 | 1.51 | 1.34–1.61 | 47 | 0.1092 | |
| Moderate incidence region | Taiwan | 1,254 | 2,215 | 3.43E-13 | 1.70 | 1.47–1.95 | 3.43E-13 | 1.70 | 1.47–1.95 | 0 | 0.7998 |
| High incidence region | Guangdong and Guangxia | 3,672 | 5,339 | 2.92E-20 | 1.40 | 1.30–1.49 | 2.92E-13 | 1.40 | 1.30–1.49 | 0 | 0.4627 |
aMost of the samples were from high incidence region (Guangdong and Guangxi) except 922 controls were Han Chinese from Singapore
Discussion and conclusions
In the present meta-analysis, four of the five chromosome 6p21.3 polymorphisms exhibited strong and consistent positive associations with NPC. The three SNPs (rs2517713, rs9260734, and rs29230) yielded highly consistent results with no heterogeneity, despite differences in the genotyping platform (Table 1) and the use of surrogate SNPs for rs2517713 (Table 2). The strongest association was discovered in rs2517713 near the HLA-A gene (P = 1.08 × 10−91, OR = 0.58, 95 % CI = 0.55–0.61), further confirming the critical role of the HLA-A gene in the susceptibility of NPC.
NPC has a distinct ethnic and geographic distribution. The allele frequencies of NPC-associated alleles (HLA-A*1101, HLA-A*0207, and HLA-B*5801) in the human genome are consistent with the geographical distribution of NPC incidence in southeastern Asia [10–12], suggesting that the genetic differences among populations might play a crucial role in NPC incidence. However, in the NPC association studies, the frequency of HLA alleles did not differ noticeably in populations with dissimilar incidence rates, suggesting that HLA genes might not directly cause this difference. In the current meta-analysis, we did not observe heterogeneity in the HLA-A SNPs, which supports our hypothesis. By contrast, our analysis indicated that rs29232 exhibited distinct features in Han Chinese populations in regions with different incidence rates. First, the heterogeneity of rs29232 was markedly reduced when we stratified the meta-analysis according to the incidence region. Second, in the subgroup analysis, the OR of rs29232 was higher in moderate-incidence regions than in the high-incidence regions. Finally, in previous NPC association studies, rs29232 was independent of the HLA-A effect in moderate-incidence regions, but not in high-incidence regions. These results suggest that rs29232 might contribute to the difference in NPC incidence in Han Chinese populations.
Studies conducted in regions with different incidence rates have yielded inconsistent results regarding rs29232. A GWAS conducted in Taiwan, a moderate-NPC-incidence region, using multiple logistic regression analysis and stepwise logistic regression concluded that rs29232 was significantly associated with NPC, even after the removal of the HLA-A SNP (rs2517713) and sequence-based HLA-A alleles (HLA-A*0207/0215 N and HLA-A*110101/0121 N) [16]. Another independent post-GWAS case–control study conducted in Taiwan yielded similar results, indicating that HLA-A and rs29232 are likely to be independent risk factors for NPC, and that NPC risk is highest among people carrying homozygous HLA-A*0207 and rs29232 risk alleles [19]. By contrast, a GWAS conducted in Guangdong, a high-NPC-incidence region, revealed that the strength of the association with rs29232 greatly diminished after the researchers controlled for the effect of rs2860580 (HLA-A), whereas the strength of the association with rs2860580 (HLA-A) decreased after they adjusted for rs29232. Collectively, these results suggest that the associations with rs29232 and rs2860580 (HLA-A) were correlated rather than probabilistically independent [17]. In an NPC GWAS conducted in Guangdong and Guangxi, a similar multivariate logistic regression analysis indicated that rs29232- and GABBR1-related SNPs were nonsignificant after adjustment for HLA-A-related SNPs and alleles. The authors of the study stated that all the other significant associations identified were only proxies for HLA-A*1101 because of the strong LD within the region [18]. To summarize, study findings from moderate-incidence regions support the independent role of rs29232, whereas those from high-incidence regions indicate that only one true association signal (HLA-A) exists within this chromosome region.
In the current study, no heterogeneity was observed among studies except in rs3129055 (I2 = 58 %, P = 0.0361, HLA-F) and rs29232 (I2 = 47 %, P = 0.1092, GABBR1). However, the heterogeneity in rs29232 was not statistically significant (P > 0.1). Because tests of heterogeneity are severely underpowered in analyses of only a few studies [33], heterogeneity might still exist despite a lack of statistical significance. Since the meta-analysis result for rs3129055 did not achieve genome-wide significance (<10−7), we excluded it from further analysis. The moderate level of heterogeneity (I2 = 47) of rs29232 markedly decreased (I2 = 0) when we stratified the study population according to geographic region (Table 3), suggesting that regional differences in NPC incidence caused the heterogeneity. Furthermore, the ORs were higher in the moderate-incidence regions (OR = 1.70, 95 % CI = 1.47–1.95) than in the high-incidence regions (OR = 1.40, 95 % CI = 1.30–1.49). Since rs29232 was a significant association signal independent of the effect of the HLA-A gene in the moderate-incidence regions, we suspected that rs29232 caused the regional difference in NPC incidence among Han Chinese people. Compared with high-incidence populations, moderate-incidence populations might be more strongly affected by rs29232.
Although the current evidence on the role of rs29232 and the GABBR1 gene seems self-contradictory, previous studies have provided consistent findings regarding the role of GABBR1 in NPC. GABBR1 encodes the protein gamma-aminobutyric acid B receptor 1 (GABBR1), a G protein-coupled receptor that forms a heterodimer with GABAB receptor 2, thereby triggering downstream signaling events involved in the proliferation, differentiation, and migration of cancer cells. One study reported that the intensity of the GABBR1 signal in tumor cells was significantly higher than that detected in adjacent normal epithelial cells (P < 0.001) in the immunohistochemical staining of NPC tissues [16].
The rs29232 SNP exhibited a lower LD (r2 < 0.6) than did all other SNPs in the HapMap CHB data set in the MHC region. This finding suggests that the role of rs29232 might not directly relate to the downstream GABBR1 gene or other neighboring genes, but rather affect genes located in other regions or chromosomes through long-range cis-acting or trans-acting. Nevertheless a recent genome-wide SNP–SNP interaction analysis detected no significant interaction between rs29232 and other SNPs [34]. Further investigation of the role of rs29232 and its relationship with the incidence and etiology of NPC is vital. In explorations of the genetic factors underlying disease susceptibility, epidemiological factors, such as disease incidence rates, are rarely considered. In the current study, an association analysis of rs29232 in regions with high or moderate incidence rates was performed. Future studies conducted in low-incidence regions such as northern China may clarify the relationship between genetic factors and geographic incidence rates. In addition, using imputation or next-generation sequencing to explore the detailed genotypes near rs29232 can further reveal the genetic causes underlying the variation in regional NPC incidence rates. The current study suggested that genetic effects might be involved in epidemiological factors such as regional disease incidences. However, epidemiological factors have rarely been considered in large cross-region association studies. Thus, we suggest that future large cross-region meta-analyses include geographic incidence rates as potential confounding factors.
In this meta-analysis, the results indicated a strong effect of HLA-A on NPC susceptibility and a potential role of rs29232 in the regional differences in NPC incidence among Han Chinese people. However, this study had several limitations. First, although the conclusion was based on several previous studies, the heterogeneity for rs29232 observed in this study was nonsignificant. Second, although the number of subjects in the studies included in the analysis was high, the number of studies included was relatively low. Finally, meta-analyses constitute retrospective research and, thus, are subject to methodological limitations. To minimize potential bias, we used standard methods for study selection, data extraction, and data analysis. Nonetheless, the results presented here should be interpreted with caution until additional studies on rs29232 that control for incidence rates according to region are conducted.
Acknowledgements
The authors thank Wan-Lun Hsu for providing detailed data for the meta-analysis. This work was supported by the Ministry of Education (funding granted to Chang Gung University), the National Science Council (NSC 101-2314-B-182-051-MY3, MOST 104-2314-B-182-033-MY3), and Chang Gung Memorial Hospital (CMRPD1A0383, CMRPD3D0121), Taiwan. The funders played no role in the study design, data collection and analysis, decision to publish, or preparation of the manuscript. Dr. Shugart was supported by the Intramural Research Program at NIMH (MH002930-04).
Abbreviations
- NPC
Nasopharyngeal carcinoma
- SNP
Single-nucleotide polymorphism
- HLA
Human leukocyte antigen
- GWAS
Genome-wide association study
- LD
Linkage disequilibrium
- MAF
Minor allele frequency
- OR
Odds ratio
- CI
Confidence interval
- FE
Fixed effect
- RE
Random effect
- CHB
Han Chinese in Beijing
- GABBR1
Gamma-aminobutyric acid B receptor 1
Additional file
Supplementary Table S1. Sensitivity analysis of meta-analysis. Supplementary Figure S1. PRISMA Flow chart of literature review and study selection. Supplementary Figure S2. Forest plots, funnel plots and P-M plots for NPC association. (PDF 1068 kb)
Footnotes
Competing interests
The authors declare that they have no competing interests.
Authors’ contributions
WHS and YYS conceived and designed the study and prepared the manuscript. WHS and CCC collected data and performed the statistical analysis. All authors read and approved the final manuscript.
Authors’ information
The views expressed in this presentation do not necessarily represent the views of the NIMH, NIH, HHS, or the U.S. government.
Contributor Information
Wen-Hui Su, Email: whsu@mail.cgu.edu.tw.
Chi-Cking Chiu, Email: duovip@gmail.com.
Yin Yao Shugart, Email: kay1yao@mail.nih.gov.
References
- 1.Jia WH, Qin HD. Non-viral environmental risk factors for nasopharyngeal carcinoma: a systematic review. Semin Cancer Biol. 2012;22(2):117–26. doi: 10.1016/j.semcancer.2012.01.009. [DOI] [PubMed] [Google Scholar]
- 2.Vokes EE, Liebowitz DN, Weichselbaum RR. Nasopharyngeal carcinoma. Lancet. 1997;350(9084):1087–91. doi: 10.1016/S0140-6736(97)07269-3. [DOI] [PubMed] [Google Scholar]
- 3.Boyle P, Levin B. World Cancer Report 2008: International Agency for Research on Cancer; Distributed by WHO Press, Lyon/Geneva; 2008.
- 4.Hsu C, Shen YC, Cheng CC, Hong RL, Chang CJ, Cheng AL. Difference in the incidence trend of nasopharyngeal and oropharyngeal carcinomas in Taiwan: implication from age-period-cohort analysis. Cancer Epidemiol Biomarkers Prev. 2006;15(5):856–61. doi: 10.1158/1055-9965.EPI-05-0821. [DOI] [PubMed] [Google Scholar]
- 5.Yu MC, Yuan JM. Epidemiology of nasopharyngeal carcinoma. Semin Cancer Biol. 2002;12(6):421–9. doi: 10.1016/S1044579X02000858. [DOI] [PubMed] [Google Scholar]
- 6.Simons MJ, Wee GB, Day NE, Morris PJ, Shanmugaratnam K, De-The GB. Immunogenetic aspects of nasopharyngeal carcinoma: I. Differences in HL-A antigen profiles between patients and control groups. Int J Cancer. 1974;13(1):122–34. doi: 10.1002/ijc.2910130114. [DOI] [PubMed] [Google Scholar]
- 7.Hildesheim A, Wang CP. Genetic predisposition factors and nasopharyngeal carcinoma risk: a review of epidemiological association studies, 2000–2011: Rosetta Stone for NPC: genetics, viral infection, and other environmental factors. Semin Cancer Biol. 2012;22(2):107–16. doi: 10.1016/j.semcancer.2012.01.007. [DOI] [PMC free article] [PubMed] [Google Scholar]
- 8.Bei JX, Jia WH, Zeng YX. Familial and large-scale case–control studies identify genes associated with nasopharyngeal carcinoma. Semin Cancer Biol. 2012;22(2):96–106. doi: 10.1016/j.semcancer.2012.01.012. [DOI] [PubMed] [Google Scholar]
- 9.Su WH, Hildesheim A, Chang YS. Human leukocyte antigens and Epstein-Barr virus-associated nasopharyngeal carcinoma: old associations offer new clues into the role of immunity in infection-associated cancers. Front Oncol. 2013;3:299. doi: 10.3389/fonc.2013.00299. [DOI] [PMC free article] [PubMed] [Google Scholar]
- 10.Lancaster AK, Single RM, Solberg OD, Nelson MP, Thomson G. PyPop update--a software pipeline for large-scale multilocus population genomics. Tissue Antigens. 2007;69(Suppl 1):192–7. doi: 10.1111/j.1399-0039.2006.00769.x. [DOI] [PMC free article] [PubMed] [Google Scholar]
- 11.Cao SM, Simons MJ, Qian CN. The prevalence and prevention of nasopharyngeal carcinoma in China. Chin J Cancer. 2011;30(2):114–9. doi: 10.5732/cjc.010.10377. [DOI] [PMC free article] [PubMed] [Google Scholar]
- 12.Solberg OD, Mack SJ, Lancaster AK, Single RM, Tsai Y, Sanchez-Mazas A, et al. Balancing selection and heterogeneity across the classical human leukocyte antigen loci: a meta-analytic review of 497 population studies. Hum Immunol. 2008;69(7):443–64. doi: 10.1016/j.humimm.2008.05.001. [DOI] [PMC free article] [PubMed] [Google Scholar]
- 13.Hildesheim A, Apple RJ, Chen CJ, Wang SS, Cheng YJ, Klitz W, et al. Association of HLA class I and II alleles and extended haplotypes with nasopharyngeal carcinoma in Taiwan. J Natl Cancer Inst. 2002;94(23):1780–9. doi: 10.1093/jnci/94.23.1780. [DOI] [PubMed] [Google Scholar]
- 14.Yu KJ, Gao X, Chen CJ, Yang XR, Diehl SR, Goldstein A, et al. Association of human leukocyte antigens with nasopharyngeal carcinoma in high-risk multiplex families in Taiwan. Hum Immunol. 2009;70(11):910–4. doi: 10.1016/j.humimm.2009.08.005. [DOI] [PMC free article] [PubMed] [Google Scholar]
- 15.Tang M, Zeng Y, Poisson A, Marti D, Guan L, Zheng Y, et al. Haplotype-dependent HLA susceptibility to nasopharyngeal carcinoma in a Southern Chinese population. Genes Immun. 2010;11(4):334–42. doi: 10.1038/gene.2009.109. [DOI] [PMC free article] [PubMed] [Google Scholar]
- 16.Tse KP, Su WH, Chang KP, Tsang NM, Yu CJ, Tang P, et al. Genome-wide association study reveals multiple nasopharyngeal carcinoma-associated loci within the HLA region at chromosome 6p21.3. Am J Hum Genet. 2009;85(2):194–203. doi: 10.1016/j.ajhg.2009.07.007. [DOI] [PMC free article] [PubMed] [Google Scholar]
- 17.Bei JX, Li Y, Jia WH, Feng BJ, Zhou G, Chen LZ, et al. A genome-wide association study of nasopharyngeal carcinoma identifies three new susceptibility loci. Nat Genet. 2010;42(7):599–603. doi: 10.1038/ng.601. [DOI] [PubMed] [Google Scholar]
- 18.Tang M, Lautenberger JA, Gao X, Sezgin E, Hendrickson SL, Troyer JL, et al. The principal genetic determinants for nasopharyngeal carcinoma in china involve the HLA class I antigen recognition groove. PLoS Genet. 2012;8(11) doi: 10.1371/journal.pgen.1003103. [DOI] [PMC free article] [PubMed] [Google Scholar]
- 19.Hsu WL, Tse KP, Liang S, Chien YC, Su WH, Yu KJ, et al. Evaluation of human leukocyte antigen-A (HLA-A), other non-HLA markers on chromosome 6p21 and risk of nasopharyngeal carcinoma. PLoS One. 2012;7(8) doi: 10.1371/journal.pone.0042767. [DOI] [PMC free article] [PubMed] [Google Scholar]
- 20.Li Y, Fu L, Wong AM, Fan YH, Li MX, Bei JX, et al. Identification of genes with allelic imbalance on 6p associated with nasopharyngeal carcinoma in southern Chinese. PLoS One. 2011;6(1) doi: 10.1371/journal.pone.0014562. [DOI] [PMC free article] [PubMed] [Google Scholar]
- 21.Zhao M, Cai H, Li X, Zheng H, Yang X, Fang W, et al. Further evidence for the existence of major susceptibility of nasopharyngeal carcinoma in the region near HLA-A locus in Southern Chinese. J Transl Med. 2012;10:57. doi: 10.1186/1479-5876-10-57. [DOI] [PMC free article] [PubMed] [Google Scholar]
- 22.Guo X, Winkler CA, Li J, Guan L, Tang M, Liao J, et al. Evaluation and integration of genetic signature for prediction risk of nasopharyngeal carcinoma in Southern China. BioMed Res Int. 2014;2014:434072. doi: 10.1155/2014/434072. [DOI] [PMC free article] [PubMed] [Google Scholar]
- 23.Begg CB, Mazumdar M. Operating characteristics of a rank correlation test for publication bias. Biometrics. 1994;50(4):1088–101. doi: 10.2307/2533446. [DOI] [PubMed] [Google Scholar]
- 24.Han B, Eskin E. Interpreting meta-analyses of genome-wide association studies. PLoS Genet. 2012;8(3) doi: 10.1371/journal.pgen.1002555. [DOI] [PMC free article] [PubMed] [Google Scholar]
- 25.R Development Core Team R. A Language and Environment for Statistical Computing. Vienna, Austria: the R Foundation for Statistical Computing. 2012. ISBN: 3-900051-07-0. Available online at http://www.R-project.org/.
- 26.Han B, Eskin E. Random-effects model aimed at discovering associations in meta-analysis of genome-wide association studies. Am J Hum Genet. 2011;88(5):586–98. doi: 10.1016/j.ajhg.2011.04.014. [DOI] [PMC free article] [PubMed] [Google Scholar]
- 27.Viechtbauer W. Conducting meta-analyses in R with the metafor package. J Stat Softw. 2010;36(3):1–48. doi: 10.18637/jss.v036.i03. [DOI] [Google Scholar]
- 28.Dupont WD, Plummer WD., Jr Power and sample size calculations. A review and computer program. Control Clin Trials. 1990;11(2):116–28. doi: 10.1016/0197-2456(90)90005-M. [DOI] [PubMed] [Google Scholar]
- 29.Dupont WD, Plummer WD., Jr Power and sample size calculations for studies involving linear regression. Control Clin Trials. 1998;19(6):589–601. doi: 10.1016/S0197-2456(98)00037-3. [DOI] [PubMed] [Google Scholar]
- 30.Zintzaras E, Ioannidis JP. Heterogeneity testing in meta-analysis of genome searches. Genet Epidemiol. 2005;28(2):123–37. doi: 10.1002/gepi.20048. [DOI] [PubMed] [Google Scholar]
- 31.Higgins JP, Thompson SG, Deeks JJ, Altman DG. Measuring inconsistency in meta-analyses. BMJ. 2003;327(7414):557–60. doi: 10.1136/bmj.327.7414.557. [DOI] [PMC free article] [PubMed] [Google Scholar]
- 32.International HapMap C, Frazer KA, Ballinger DG, Cox DR, Hinds DA, Stuve LL, et al. A second generation human haplotype map of over 3.1 million SNPs. Nature. 2007;449(7164):851–61. doi: 10.1038/nature06258. [DOI] [PMC free article] [PubMed] [Google Scholar]
- 33.Ioannidis JP, Patsopoulos NA, Evangelou E. Heterogeneity in meta-analyses of genome-wide association investigations. PLoS One. 2007;2(9) doi: 10.1371/journal.pone.0000841. [DOI] [PMC free article] [PubMed] [Google Scholar]
- 34.Su WH, Yao Shugart Y, Chang KP, Tsang NM, Tse KP, Chang YS. How genome-wide SNP-SNP interactions relate to nasopharyngeal carcinoma susceptibility. PLoS One. 2013;8(12) doi: 10.1371/journal.pone.0083034. [DOI] [PMC free article] [PubMed] [Google Scholar]