Abstract
During the past 2 decades, Bacillus megaterium has been systematically developed for the gram-per-liter scale production of recombinant proteins. The plasmid-based expression systems employed use a xylose-controlled promoter. Protein production analyses at the single-cell level using green fluorescent protein as a model product revealed cell culture heterogeneity characterized by a significant proportion of less productive bacteria. Due to the enormous size of B. megaterium, such bistable behavior seen in subpopulations was readily analyzed by time lapse microscopy and flow cytometry. Cell culture heterogeneity was not caused simply by plasmid loss: instead, an asymmetric distribution of plasmids during cell division was detected during the exponential-growth phase. Multicopy plasmids are generally randomly distributed between daughter cells. However, in vivo and in vitro experiments demonstrated that under conditions of strong protein production, plasmids are retained at one of the cell poles. Furthermore, it was found that cells with accumulated plasmids and high protein production ceased cell division. As a consequence, the overall protein production of the culture was achieved mainly by the subpopulation with a sufficient plasmid copy number. Based on our experimental data, we propose a model whereby the distribution of multicopy plasmids is controlled by polar fixation under protein production conditions. Thereby, cell lines with fluctuating plasmid abundance arise, which results in population heterogeneity. Our results provide initial insights into the mechanism of cellular heterogeneity during plasmid-based recombinant protein production in a Bacillus species.
INTRODUCTION
The Gram-positive Bacillus group is central to the industrial and biotechnological production of proteases, amylases, antibiotics, and special chemicals on a ton scale. Bacillus subtilis, Bacillus licheniformis, Bacillus amyloliquefaciens, and Bacillus megaterium are only some examples of this commercially important class of bacteria (1, 2). More specifically, Bacillus megaterium is an attractive host for heterologous protein production. In particular, its lack of endogenous endotoxins and alkaline proteases, its stable maintenance and replication of plasmids, its strong protein secretion system, and its capacity to grow on various cheap carbon sources are important criteria for its successful application in biotechnology industries (3, 4). At approximately 4 by 1.5 μm, it is one of the largest known bacteria, exhibiting a volume 100 times greater than that of Escherichia coli (5).
We constructed a series of plasmids with the aim of producing recombinant protein. These expression systems utilized a strong xylose-inducible promoter, PxylA, part of the B. megaterium xylABT operon (6). The xylA and xylB genes encode enzymes involved in xylose degradation, while xylT encodes a xylose transporter. In the absence of xylose, the expression of the operon is repressed by the xylose repressor, XylR, while in the presence of xylose, the expression of the operon is derepressed. The xylR gene is located upstream of the xylABT operon, is transcribed in a divergent direction, and is negatively autoregulated (7). For the construction of a xylose-inducible expression system, the xylR gene, with its corresponding promoters PxylR and PxylA, was cloned into a freely replicating broad-host-range plasmid and was further optimized by introducing strong promoter elements (8). The plasmidless B. megaterium strain DSM319 is usually employed as a production host (9). As a model protein product for the expression system, the gene for the readily detectable green fluorescent protein (GFP) was used. In a previous study, as much as 1.25 g GFP/liter was produced using the vector system developed (10). However, the culture showed a significant amount of protein production heterogeneity at the single-cell level. Flow cytometry analyses of GFP-producing B. megaterium grown in a bioreactor revealed a stable subpopulation of about 30% low-level producers, even under strong, selective conditions (11). Less productive cells were found alive, indicating the formation of a stable subpopulation within a culture of clonal cells. Moreover, these cells were still proliferating, excluding persistence as a reason for low production. These observations are of significant commercial interest, since the growth of less productive subpopulations consumes valuable resources during protein production processes.
Here we investigated this bimodal production behavior of individual cell lineages to elucidate its underlying mechanistic principles. Subpopulations were analyzed via single-cell analyses using flow cytometry and time lapse microscopy. In order to study, at the molecular level, the influence of the plasmid copy number on bimodal production behavior, we observed plasmid abundance and localization. In addition, fluorescence in situ hybridization (FISH) was employed for the direct cellular localization of plasmids. Our data suggest that the bimodality observed was not a product of differential gene-regulatory circuits but rather a matter of unequal plasmid distribution between daughter cells, even under selective conditions. In particular, the common assumption concerning free plasmid diffusion is questioned, and a mechanism leading to the unequal distribution of plasmids is proposed. Our results provide new insights into the distribution of heterologous multicopy plasmids during the process of recombinant protein production.
MATERIALS AND METHODS
Strains, media, plasmids, and primers.
Bacillus megaterium DSM319 (9) was grown in A5 medium (8) containing 30 g/liter fructose instead of glucose and supplemented with 10 μg/ml tetracycline. Cell cultures were performed either as batch cultures or in a BioLector microbioreactor system (m2p-labs, Baesweiler, Germany). The E. coli strain DH10B (Invitrogen Life Technologies, Carlsbad, CA, USA) was used for all cloning purposes. All plasmids and primers used in this study are described in Table 1. All the studies reported were based on the pSSBm85 plasmid or derivatives of this plasmid (10). This plasmid carries the gfp+ gene (referred to below as gfp; encoding GFP), a variant of wild-type gfp whose gene product exhibits increased fluorescence (12). This gfp variant was originally described for the pMUTIN-GFP+ plasmid (13). For the construction of a C-terminal XylR-mCherry fusion encoded in our expression system, the following steps were carried out. Starting with the pSSBm85 plasmid (10), the stop codon of xylR was replaced by a new KpnI site. This was accomplished by the introduction of a synthetic AflII/SpeI fragment comprising the whole xylR gene (GeneArt Life Technologies, Carlsbad, CA, USA), resulting in pKMMBm1. The xylR-mCherry for and xylR-mCherry rev oligonucleotides were used as primers to amplify the mCherry gene from the pJS72 plasmid (14) with the introduction of flanking AflII and KpnI restriction sites. The xylR-mCherry fusion (pKMMBm2) was realized by cloning the mCherry-carrying AflII/KpnI fragment downstream of xylR into AflII/KpnI-cut pKMMBm1 (see Fig. S1 in the supplemental material). The ΔxylR mutant plasmid, pKMMBm5, was created by cutting the XmaI/KpnI fragment from pKMMBm1, thus removing the xylR gene, generating blunt ends using Klenow polymerase, and religating the plasmid. For pRBBm99, pSSBm85 was cut with AflII/SphI, blunt ends were generated, and the plasmid was religated.
TABLE 1.
Strains, plasmids, and primers used in this study
| Strain, plasmid, or primer | Description or sequencea | Reference or source |
|---|---|---|
| Strains | ||
| B. megaterium DSM319 | Wild-type strain | 9 |
| B. megaterium WH321 | Genomic xylR mutant | 32 |
| B. megaterium WH377 | Genomic xylT mutant | 31 |
| B. subtilis DSM402 | B. subtilis subsp. subtilis strain 168 carrying the pBC16 plasmid (DSM23521) | DSMZb |
| Plasmids | ||
| pSSBm85 | Promoter-optimized shuttle vector for xylose-inducible production of GFP; PxylA-gfp | 10 |
| pRBBm99 | Derivative of pSSBm85 lacking xylR and PxylA-gfp | This work |
| pKMMBm1 | XmaI site introduced at the 5′ end of xylR, and xylR stop codon replaced with a KpnI site, in pSSBm85 | This work |
| pKMMBm2 | mCherry cloned into KpnI and AflII sites of pKMMBm1; xylR-mCherry fusion | This work |
| pKMMBm5 | pSSBm85 ΔxylR mutant | This work |
| pJS72 | pETDuet vector (Novagen) containing mCherry | 14 |
| pBC16 | Natural plasmid isolate originating from Bacillus cereus, precursor for pSSBm85 | 26 |
| Primers | ||
| xylR-mCherry_for | 5′-TATCAGGTACCGTGAGCAAGGGCGAGGAG-3′ | This work |
| xylR-mCherry_rev | 5′-TATCACTTAAGTTACTTGTACAGCTCGTCCATG-3′ | This work |
| xylT_for | 5′-CGGAGGGTTACTGTTTGGATATGAC-3′ | This work |
| xylT_rev | 5′-CCGTGTGCTAAAGATCCTAACCCTA-3′ | This work |
| xylR_for | 5′-GCCTTGTAGATCGTCATCAGCAAA-3′ | This work |
| xylR_rev | 5′-CGTATGCTCCTGCATTAGCTTCAT-3′ | This work |
| gfp_for | 5′-TCTCGGACACAAACTCGAGTACAAC-3′ | This work |
| gfp_rev | 5′-CTGCTAGTTGAACGGATCCATCTTC-3′ | This work |
| rpoB_for | 5′-GGCGACGAAGTAGTAAAAGGTGAGA-3′ | This work |
| rpoB_rev | 5′-GGCATCCTCATAGTTGTAACCATCC-3′ | This work |
| gyrB_for | 5′-TACATGGTGTAGGTGCCTCAGTTGT-3′ | This work |
| gyrB_rev | 5′-ACTTTTAAGTCAGCAGCCGGTACAC-3′ | This work |
| heli1_for | 5′-GATGTAATCCATACGTCAGCTGTGC-3′ | This work |
| heli1_rev | 5′-CCGGCTTCCTTGATTTATAACTGG-3′ | This work |
| heli2_for | 5′-GTCGAACCTGTACACGGTGACTTTT-3′ | This work |
| heli2_rev | 5′-GCTTCCGTAATAGGTCTGTTCATGC-3′ | This work |
In primer sequences, specific restriction enzymes used for cloning are underlined.
DSMZ, German Collection of Microorganisms and Cell Cultures.
Flow cytometry and cell sorting.
Flow cytometry and cell sorting were performed using a Cube8 (Sysmex Partec, Münster, Germany) and a FACSAria II (Becton Dickinson, Mountain View, CA) flow cytometer, respectively. For this purpose, B. megaterium cells were grown for 6 h, diluted to an optical density at 595 nm (OD595) of 0.05, and further cultured in A5 medium supplemented with 10 μg/ml tetracycline. Gene expression was induced with 0.5% xylose at an OD595 of 0.2. The culture was harvested and was washed twice with 1× phosphate-buffered saline (PBS). For flow cytometry, cells were sonicated and were diluted to a final concentration of 106 cells/sample. Finally, 105 events were counted. For cell sorting, approximately 106 to 107 cells were recovered. Data analyses were performed in R Bioconductor using the flowCore and flowViz software packages (15, 16).
Quantitative reverse-transcription PCR (qRT-PCR).
B. megaterium carrying the pSSBm85 plasmid was cultivated aerobically in A5 medium containing 10 μg/ml tetracycline. A 5-h preculture was diluted to an OD578 of 0.05, and gene expression was induced by the addition of 0.5% xylose after 1.5 h in the early-exponential phase. Producing cells were harvested and sorted, after an additional hour, into fractions of high and low GFP producers. Total RNA was isolated from the sorted cells and was purified using an innuPREP RNA minikit, and DNA was removed with an innuPREP DNase I Digest kit (Analytik Jena, Jena, Germany). RNA purity was checked using a 2100 Bioanalyzer (Agilent Technologies, Santa Clara, CA, USA); RNA integrity numbers (RINs) of 8.2 to 10.0 were achieved. First-strand cDNA synthesis was performed with SuperScript II reverse transcriptase and hexameric random primer oligonucleotides (Invitrogen Life Technologies, Carlsbad, CA, USA). RNA was degraded using 200 mM NaOH and 100 mM EDTA, neutralized with 200 mM HEPES and 1.2 M sodium acetate, and further purified using a PCR purification kit (Qiagen, Hilden, Germany). Quantitative real-time PCR was performed on a CFX96 real-time PCR detection system (Bio-Rad, Hercules, CA, USA). The 20-μl final reaction mixture contained 5 ng of cDNA, 10 μl of SsoFast EvaGreen supermix (Bio-Rad), and 20 pmol of each appropriate primer (Table 1). The relative quantification of gene expression was carried out using the efficiency-corrected relative quantification method (17) and a model-based estimation of real-time PCR amplification efficiency (18) improved with a log-logistic 5-parameter model (19). Reference genes were determined and validated using the geNorm algorithm in the R Bioconductor package SLqPCR (20). As reference genes, rpoB (encoding the RNA polymerase beta subunit), gyrB (encoding DNA gyrase subunit B), the gene encoding SNF2 helicase-associated protein, and the gene encoding SNF2 family helicase were finally chosen. Data analysis for the calculation of quantification cycle (Cq) values, relative expression ratios, and statistics were carried out using the qpcR package (21).
Microscopy and image analysis.
Fluorescence time lapse microscopy was performed with an Axiovert 200M microscope (Zeiss, Jena, Germany), an Axiocam charge-coupled device (CCD) camera (Zeiss), and a Heating System 1 microscope incubator (ibidi, Martinsried, Germany). An agar block method was used for the preparation of cells and live-cell imaging (22). The agarose pad was prepared using A5 medium supplemented with 1.5% agarose, 0.5% xylose, and 10 μg/ml tetracycline in low 35-mm μ-dishes coated with ibiTreat (ibidi Labware, Martinsried, Germany). For 4′,6-diamidino-2-phenylindole (DAPI) staining, living cells taken from a culture 2 h after gene induction were incubated for 5 min in 300 nM DAPI dihydrochloride (Invitrogen Life Technologies, Carlsbad, CA, USA). Cells were washed three times with A5 medium and were pipetted onto an agarose pad as described previously (22). Automated image capture was performed every 5 min at an incubation temperature of 37°C. Image analyses were done using Axiovision 4.8 (Zeiss) and TLM-Tracker software (23). Bimodal cell lineage distributions were analyzed using the diptest R package (http://CRAN.R-project.org/package=diptest).
Fluorescence in situ hybridization.
FISH probes were prepared as described previously (24, 25). For this purpose, pRBBm99 or pBC16 (26) vector DNA was digested in fragments ranging from 20 to 280 bp using 4-base-cutting restriction enzymes (AluI, HaeIII, MseI, MspI, RsaI, and Sau3AI) and was subsequently labeled with Cy3-dCTP (GE Healthcare, Amersham, United Kingdom) by terminal transferase (New England BioLabs, Ipswich, MA, USA). FISH was performed as described previously (27), with modifications made in washing steps (25). In addition, fixed cells were treated with lysozyme (2 mg/ml) for 10 min at 37°C. Fixation and staining were performed on a flat, 18-well μ-slide coated with poly-l-lysine (ibidi Labware). Cell boundaries were detected using TLM-Tracker image-processing software (23).
Data analysis and mathematical modeling.
Data analysis and mathematical modeling were performed using R (R Development Core Team, 2010), Bioconductor (28), and simbTUM software (http://sourceforge.net/projects/simbtumtum/). The R packages employed are listed under the relevant methods.
RESULTS
Heterogeneity of recombinant GFP production by B. megaterium.
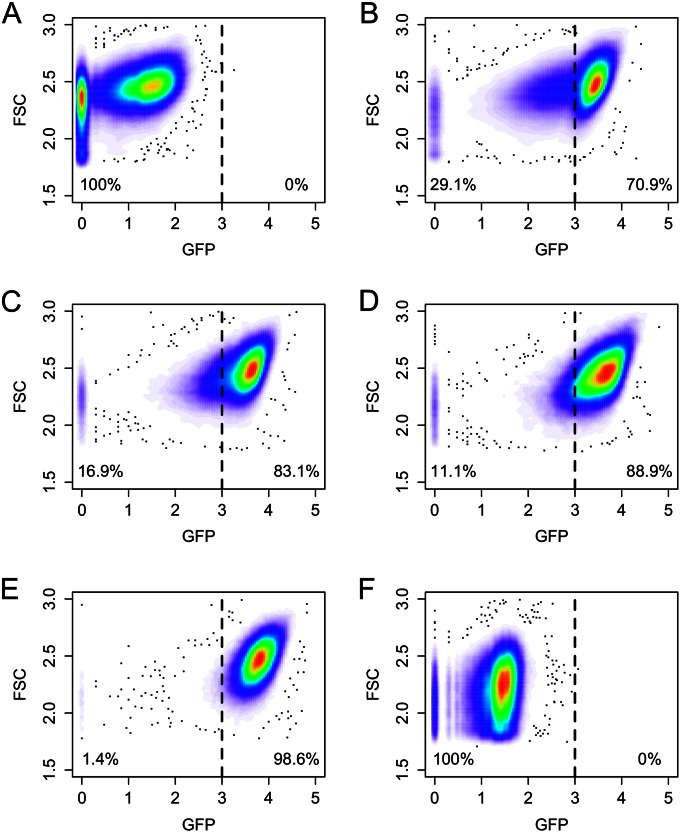
We previously observed a continuous population heterogeneity during high-level GFP production by B. megaterium growing in a bioreactor (11). In order to understand the dynamics of this phenomenon, a growing population was further investigated at the single-cell level. First, recombinant gene expression by a B. megaterium culture containing the GFP production plasmid pSSBm85 (10) was induced by the addition of xylose in the early-exponential-growth phase, and cells were analyzed afterwards, at various time points, by flow cytometry. As expected, prior to the induction of gene expression, cells did not produce a significant amount of GFP product. However, a large fraction of cells (about 72%) showed very low GFP levels, indicating a basal expression rate by the PxylA promoter in the absence of xylose (Fig. 1A). With time, an increasing fraction of cells began to produce large amounts of GFP; however, for considerable subpopulation proportions of 29.1% (1 h after induction), 16.9% (2 h after induction), and 11.1% (3 h after induction), respectively, no GFP protein or only low levels were detected (Fig. 1B to D). Five hours after xylose addition and upon entry into the stationary-growth phase, major parts of the population shifted into a production state (Fig. 1E). Finally, in the late-stationary phase, the recombinant-GFP production rate became reduced again and regressed toward the initial GFP production pattern observed prior to xylose addition (Fig. 1A and F). Thus, a marked protein production heterogeneity was obvious during the plasmid-based production of recombinant GFP in B. megaterium.
FIG 1.
Time course of heterologous GFP production by recombinant B. megaterium and analysis of subpopulations by using flow cytometry. (A) Before gene induction by the addition of xylose, the majority of the population did not produce GFP; a small fraction of cells produced low levels. (B to D) Between 1, 2, and 3 h, respectively, after the induction of gene expression, the population shifted toward highly productive cells, but with a significant subset of less productive cells. (E) After 5 h, when cells had already entered the stationary phase, almost all cells reached their highest production levels. (F) In the late-stationary phase (22 h after induction), production levels decreased, and the population shifted toward its initial state. The dashed line in every panel indicates the two rectangular gates “non/low GFP-producing cells” and “GFP-producing cells” (cutoff level) that were defined at the beginning of the flow cytometry analyses. The fluorescence intensity of GFP (x axis) is given in arbitrary units. FSC, forward scatter.
Bistability is not mediated by positive feedback via the xylose transporter.
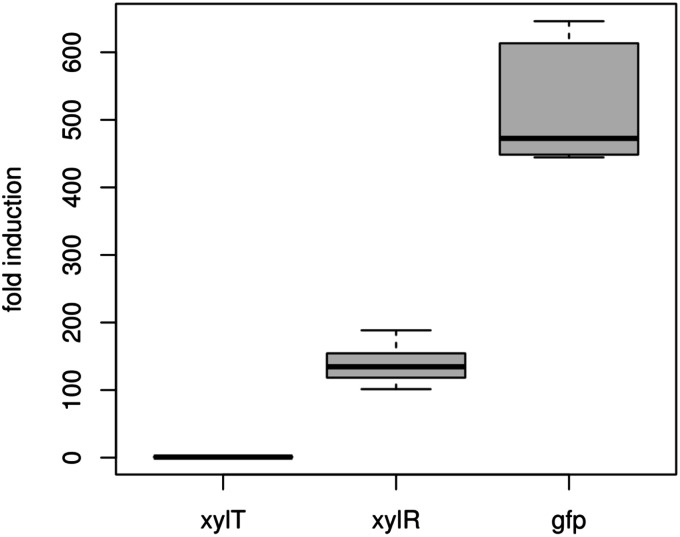
The nonuniform gene expression in clonal cell cultures that results in distinct subpopulations is commonly known as bistability. This phenomenon is usually caused by positive-feedback loops in gene-regulatory circuits (29). Bistable behavior was also observed for the structurally similar lac operon of E. coli after the induction of gene expression with lactose (30). In the lac system, the repressor LacI becomes inactivated by lactose, derepressing genes for lactose catabolism. Here, bistability is mediated by positive feedback via the increased formation of the lactose permease, LacY, which facilitates lactose uptake into the cell, which, in turn, inhibits repression by LacI. In order to test if the scenario outlined applies to our observation for the B. megaterium xyl operon, we investigated this transporter-inducer feedback loop in our system. Expression levels of the xylose repressor gene, xylR, and the xylose transporter gene, xylT, in highly productive and less productive cells were analyzed in greater detail. Induced cells were sorted according to their GFP contents into two fractions. First, sorted cells producing low levels of GFP were plated onto A5 medium agar plates supplemented with 0.5% xylose. However, it became obvious that these cells were still capable of producing large quantities of GFP, which excluded mutations or complete plasmid loss. The qRT-PCR analyses of sorted cells from both subpopulations revealed mRNA ratios of the genes involved in the expression system. In highly productive cells, the expression of xylR and gfp was induced about 150- and 500-fold, respectively, while the xylose transporter gene, xylT, remained unaffected (Fig. 2). Although xylT is the last gene of the xylABT operon, it seems to be uncoupled from the XylR-mediated regulation of xylA. This finding can be explained by the existence of an internal transcriptional terminator within the operon upstream of xylT (31). In agreement with this, xylT mutants of B. megaterium continued to show the observed culture heterogeneity (unpublished data). Thus, in contrast to the lac system, the observed phenotype seems not to be mediated via induction of the sugar transporter. The observation that large amounts of GFP product correlated with strong induction ratios of both gfp and xylR led to the idea that the heterogeneity arising is a gene dose effect, most likely mediated by unevenly distributed plasmids.
FIG 2.
Comparison of gene expression in sorted B. megaterium cells (productive subpopulations compared to less productive subpopulations) using quantitative RT-PCR. Genes encoding the main components of the pSSBm85 expression system (xylT, xylR, and gfp) were investigated. The xylose repressor gene, xylR, and the target gene, gfp, were induced about 150-fold and 500-fold, respectively. In contrast, the xylose transporter gene, xylT, was expressed constitutively.
Unequal distribution of recombinant plasmids to daughter cells after cell division.
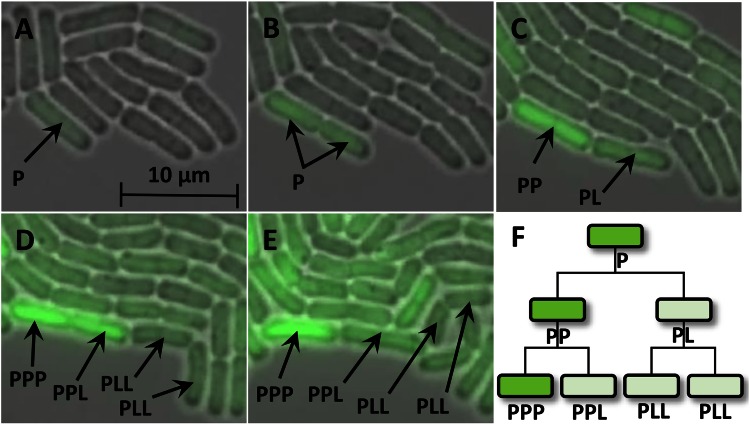
In order to obtain deeper insights into the dynamics of the emerging heterogeneity in the bacterial population, time lapse microscopy movies of a growing microcolony producing GFP in response to xylose were recorded. B. megaterium is a bacterium particularly well suited for live-cell imaging due to its large size relative to those of other bacteria. We observed that a few scattered cells produced GFP during the first 2 h after xylose addition (Fig. 3A). However, what was particularly striking with regard to GFP production by these cells was that cell division in a GFP-producing cell was followed by one daughter cell continuing GFP production, while the second, seemingly genetically identical daughter cell paused in its production of GFP. In addition, not only was GFP production interrupted in the second daughter cell; GFP abundance even decreased, suggesting its dilution or even its degradation after cell division (Fig. 3B to E). Such phenomena were observed, almost without exception, for all cells in the growing B. megaterium microcolony (see Movie S1 in the supplemental material). As a result, some individual cell lines produced large amounts of GFP, while the rest of the population remained less productive (Fig. 3F). We hypothesized that such an observation could be explained only by the unequal distribution of cellular components required for recombinant protein production. However, during the growth of the microcolony, an increasing number of cell lines apparently reached the highly productive state, which finally led to a shift of the overall population toward GFP production.
FIG 3.
(A to E) Images taken from a time lapse microscopy movie showing a growing, GFP-producing microcolony of B. megaterium carrying the pSSBm85 plasmid. Time points are 120 (A), 150 (B), 180 (C), 210 (D), and 260 (E) min after the induction of gene expression by the addition of xylose. Each producer cell (P) generated daughter cells: a producer cell and a less productive cell (L). (F) The resulting cell lineage tree schematically shows a lineage of highly productive cells.
Candidates that might cause such an uneven distribution of cellular components resulting in the observed differences in GFP production were either the recombinant plasmid itself or the XylR repressor, or both. To investigate the influence of XylR, we first constructed a plasmid lacking the xylR gene, named pKMMBm5. After the transformation of our wild-type strain, we did not obtain a real null mutant, because one xylR copy was still present in the genome of DSM319. However, the number of free XylR proteins in this strain in relation to the available XylR-binding sites on the multicopy plasmid was postulated to be negligible. This was confirmed by analyzing a completely xylR deficient mutant, WH321 (ΔxylR) (32) carrying pKMMBm5, for which culture heterogeneity remained (see Fig. S2 in the supplemental material). In agreement with this assumption, B. megaterium DSM319 carrying the pKMMBm5 plasmid permanently produced GFP in the absence of xylose. An analysis of time lapse movies revealed that, in this case, a separation into highly productive and less productive cell lines also took place (see Movie S2 in the supplemental material). Thus, the behavior of these strains was virtually identical to that of the parental strain expressing xylR from the pSSBm85 plasmid (see Movie S1 in the supplemental material). In order to monitor the distribution of the recombinant plasmid and the XylR repressor to daughter cells during cell division, we fused XylR at its C terminus to the red fluorescent protein mCherry. The resulting recombinant plasmid was termed pKMMBm2 (see Fig. S1 in the supplemental material). With this approach, it was possible to determine the relationship between GFP production and XylR abundance by measuring green and red fluorescence, respectively. Additionally, the in vivo visualization and localization of plasmids was possible through the XylR-mCherry bound to plasmid-encoded, XylR binding sites. Our approach was sufficiently sensitive, with only two XylR binding sites per plasmid, due to the multicopy nature of the plasmid used. We were fully aware of the localization problems related to mCherry fusion proteins (33). Consequently, an independent experimental approach via FISH was also employed (see below).
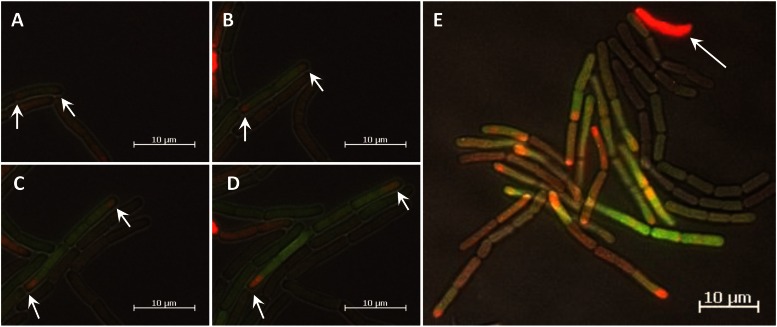
Time lapse movies with B. megaterium carrying the pKMMBm2 plasmid revealed a unique spatial expression pattern. After the induction of gene expression, GFP production by various cell lineages was identical to that by the parental strain, with native XylR encoded by the pSSBm85 plasmid. In addition, some cells then generated strong red tips, indicating XylR-mCherry-plasmid complexes asymmetrically distributed to the cell poles, while other cells showed a weak, but equal, distribution of XylR-mCherry. On closer inspection of the chronological sequence of images, red tips were seen to occur frequently at the marginal cells of growing cell chains (Fig. 4A to D; see also Movies S3 and S4 in the supplemental material). At first glance, this surprising pattern strongly suggested that after cell division, XylR-plasmid complexes accumulated at the old cell poles and that segregation of plasmids by free diffusion to the new cell pole was somehow inhibited. At a later growth phase, some red-tipped cells became deeply red, lacked GFP, and stopped dividing, while neighboring producer cells continued to grow (Fig. 4E; see also Movie S5 in the supplemental material). The latter, deeply red cells appeared to accumulate plasmid XylR complexes while GFP became degraded. The noted cessation of cell division was in good agreement with the observation that in later growth phases, cells with strong red fluorescence were found almost exclusively at the end of cell chains (see Fig. S5A in the supplemental material).
FIG 4.
(A to D) Time series of B. megaterium carrying the pKMMBm2 plasmid. Time points are 120 (A), 160 (B), 190 (C), and 210 (D) min after gene induction. Producer cells developed red tips (arrows), indicating XylR-mCherry-plasmid complexes located at the old cell poles. (E) Microcolony of high and low producers. Occasionally, deeply red cells lacking GFP arose, which probably accumulated plasmid-XylR complexes (arrow); these cells stopped proliferating.
Cell lineage analysis revealed asymmetric plasmid distribution and plasmid accumulation at cell poles.
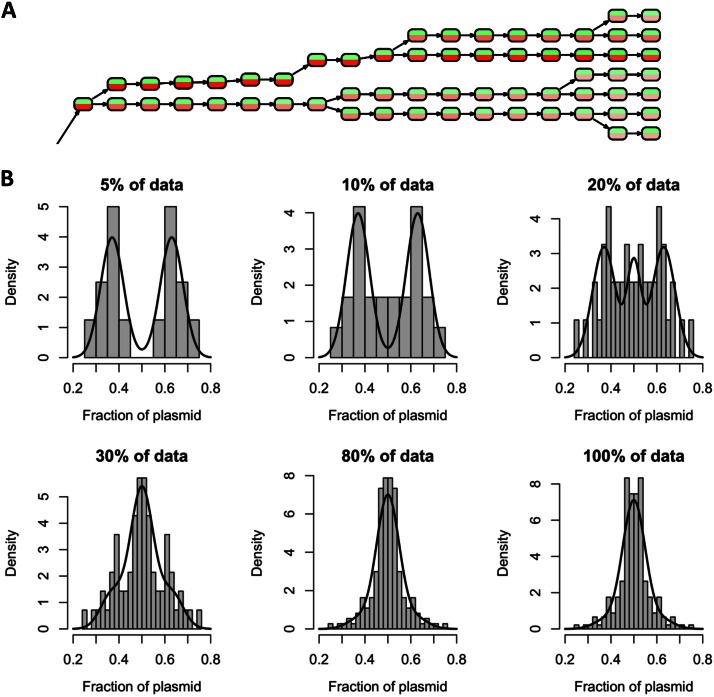
In order to better understand the nature of plasmid transmission, cell lineage analyses of a growing microcolony of B. megaterium DSM319 carrying the pKMMBm2 plasmid (producing the XylR-mCherry variant) were performed. For this reason, image analyses of successive frames derived from time lapse movies were carried out (23). This approach involved a segmentation step, in which cells were spatially recognized, and a tracking step, in which cells were temporally connected from frame to frame. In addition, red fluorescence and green fluorescence in relation to the pole age were determined for each cell at each time point. The final result was a cell lineage tree giving detailed information about the dynamics of cell division events, plasmid distribution, and GFP production. The appearance of red cell lines in the tree reflected XylR-mCherry-plasmid complexes, and the tree also showed the corresponding asymmetrical plasmid distribution behavior (Fig. 5A; see also Fig. S3 in the supplemental material).
FIG 5.
(A) Part of the reconstructed cell lineage tree derived from a time lapse movie of B. megaterium carrying the pKMMBm2 plasmid (see Movie S3 in the supplemental material). Nodes represent single cells at specific time points. Red and green indicate the respective fluorescence intensities. The complete tree is available in Fig. S3 in the supplemental material. (B) Relationship of bimodal plasmid distribution to the amount of plasmid per cell. Histograms show the fraction of segregated plasmids in relation to the percentage of cells with the strongest XylR-mCherry signal (referred to as “% of data” in the heading of each diagram). Bimodal distributions were found for 5 to 20% of cells, all containing large amounts of XylR-mCherry. Fitted curves were generated using a mixture model consisting of the 10% of cells most highly fluorescing and the rest. Highly fluorescing cells were fitted using a binormal distribution superposition of two normal distributions, localized at 0.5 ± 0.13 (with a variance of 0.05). The remaining mother cells with low fluorescence were fitted to one normal distribution (with a mean of 0.5 and a variance of 0.03).
In order to determine the fraction of plasmids inherited from the mother cell, the magnitude of red fluorescence intensity of each daughter cell was divided by the sum of the red fluorescence intensities of both daughter cells. Thus, values around 0.5 reflected equal distribution, while significantly lower and higher values indicated unequal distributions. Histograms of the calculated segregation ratios showed a bimodal distribution for strongly fluorescent cells, while mother cells with low fluorescence revealed normal distributions (Fig. 5B). These results confirmed the observation from the preceding section that asymmetric red-tipped cells were produced only in the presence of strong XylR-mCherry signals. Moreover, the colocalization technique used was not sensitive enough to visualize single scattered plasmids within the cell, so strong noise around the mean was to be expected at low signals.
Hartigan's dip test was applied to quantify the observed bimodality (34). For strong fluorescence signals (5% of the mother cells with the highest fluorescence), a P value of 6.3E−4 was found, indicating a high significance for a bimodal distribution. The mixture model used to characterize the total population (Fig. 5B) provided evidence for a distribution mechanism dependent on the cellular plasmid concentration. When the plasmid concentration was rather low, both daughter cells usually received almost the same number of plasmids. At higher cellular plasmid concentrations, an unequal distribution led to considerable differences in plasmid concentrations in the daughter cells. Unequally distributed plasmid complexes were found at both the old and the new cell pole. Thus, the phenomenon described seemed to be of a stochastic nature and not related to cell pole aging.
Retention of plasmids is linked to protein biosynthesis.
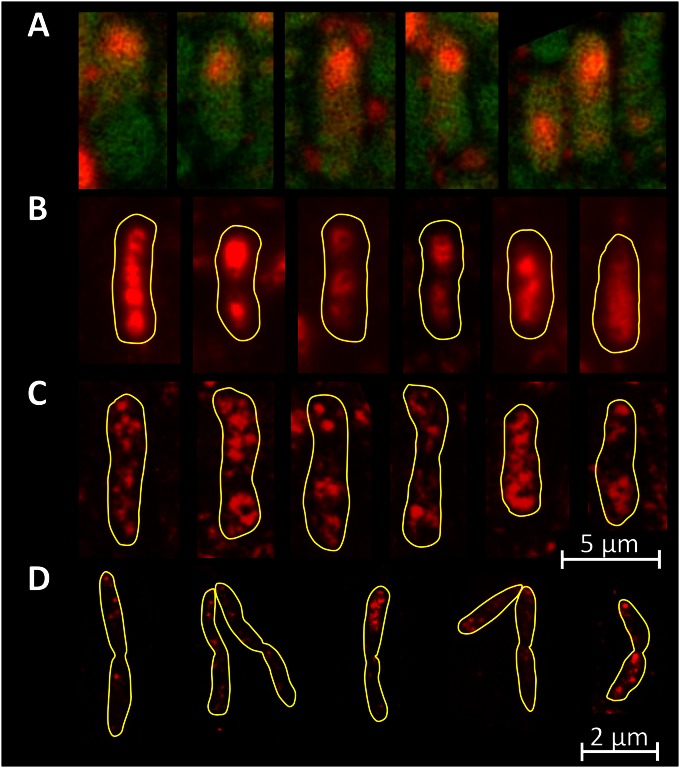
In order to measure the influence of protein production on the distribution of the plasmids, we performed FISH analyses for the direct detection of cellular plasmids (25). Using Cy3-labeled plasmid probes, we directly visualized the pSSBm85 plasmid in cells during the exponential-growth phase. The results clearly confirmed that under conditions of induced GFP production, plasmid DNA became asymmetrically localized to one of the cell poles in the largest proportion of cells (Fig. 6A). Moreover, a few cells exhibited extremely strong FISH signals, confirming plasmid accumulation in these cells as detected by time lapse microscopy. In contrast, recombinant B. megaterium cells grown without the addition of the inducing xylose largely lacked unequal distribution of plasmids (Fig. 6B). This led to the conclusion that protein biosynthesis strongly influenced by the distribution mechanism of the plasmids. As a further control, we performed FISH experiments with B. megaterium carrying the 4.6-kB pBC16 plasmid, which is a precursor of our 7.2-kB GFP production plasmid pSSBm85 (26). In this case, an exclusively equal plasmid distribution was observed. Interestingly, signals were detected as distinct groups of foci distributed all over the cell (Fig. 6C). We also tested pBC16 in Bacillus subtilis, with similar results (Fig. 6D).
FIG 6.
Localization of plasmids using FISH. (A) B. megaterium carrying pSSBm85, induced with xylose, showed an unequal distribution of plasmids. These preferentially remained at one cell pole. (B) In the absence of gene induction, pSSBm85 plasmid distribution is hardly affected. (C) The smaller precursor plasmid pBC16 was found clustered in several foci distributed all over the cell. (D) The same behavior was seen in B. subtilis carrying the pBC16 plasmid, resulting in distinct foci of plasmid accumulation.
The nucleoid location overlaps with the plasmid location but is restricted to central parts of the cell.
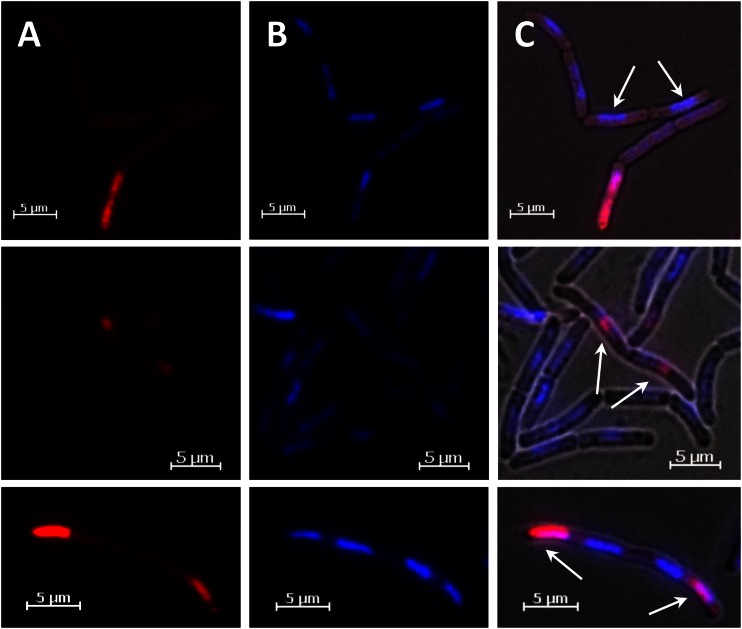
Next, we analyzed if plasmid localization was influenced by the chromosomal DNA of the nucleoid. It has been shown that for smaller bacteria, such as E. coli, high-copy-number plasmids simply occupy the nucleoid-free space within the bacterial cell (35). For the in vivo colocalization of plasmid and nucleoid DNAs, the pKMMBm2 system was used in combination with DAPI staining of DNA. Various stages of cell division were analyzed. Prior to cell division, the nucleoid was localized in the central part of the cell (Fig. 7, top). At this stage, the XylR-mCherry-plasmid complexes were mainly distributed all over the cell, including the cell poles. Subsequently, in the course of cell division, plasmid complexes were localized at one of the cell poles of the daughter cells, whereas the nucleoid was segregated close to the new poles (Fig. 7, center). Finally, after cell division, the whole cell was occupied by the plasmid DNA, whereas the nucleoid DNA was restricted to the middle part. Due to asymmetric plasmid distribution, terminal cells of cell chains, especially, contained large amounts of XylR-plasmid complexes (Fig. 7C, bottom).
FIG 7.
Coordinated distribution of plasmid and chromosomal DNA in protein-producing B. megaterium. Different stages of plasmid and nucleoid positioning during the cell division of B. megaterium carrying pKMMBm2 were visualized. (A) Plasmid-XylR-mCherry complexes. (B) The nucleoid visualized via DAPI staining. (C) Overlay of both images with the inclusion of the bright-field image. (Top) Before cell division, the nucleoid was localized in the central part of the cell, excluding the poles (arrows), while XylR-mCherry was mainly distributed all over the cell. (Center) During cell division, the plasmid-XylR-mCherry complexes were localized at the old cell poles (arrows), while the nucleoid was segregated near the new pole. (Bottom) This process led to bacterial chains, with terminal cells containing large amounts of XylR-plasmid complexes (arrows).
Influence of unequal plasmid distribution on protein production dynamics.
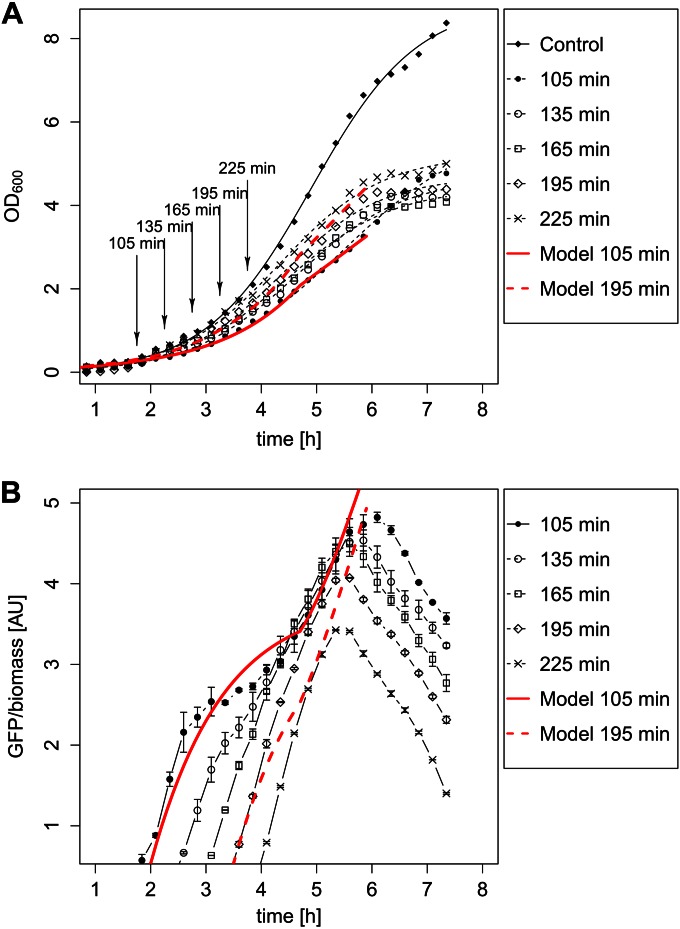
The possible influence of population heterogeneity on heterologous protein production processes was subsequently analyzed systematically. Two striking effects with major influences on protein production dynamics have been observed so far. First, flow cytometry data showed that the degree of heterogeneity was highest during the first three hours after induction, comprising the early-exponential-growth phase (Fig. 1). During this stage, the population consisted of highly productive cells with a high plasmid copy number and less productive cells with a low plasmid copy number. Second, a subpopulation of cells with highly accumulated plasmids was formed, which finally led to the termination of cell division (Fig. 4E). As a result, after induction, only the subpopulation carrying many plasmids produced large amounts of the product. Time lapse movies showed that these early producers had reduced growth, and cells with too many accumulated plasmids even stopped growing, whereas the subpopulation carrying fewer plasmids continued to grow (see Movie S5 in the supplemental material). In the short term, both a shift toward less productive cells and their selection were expected. In the long term, the number of less productive cells with accumulated plasmids was expected to increase, which is not desirable for biotechnological processes. Consequently, we expected a complex relationship between the growth rate, plasmid abundance, and GFP production rate. In order to experimentally investigate this effect in more detail, we measured the growth behavior and GFP production of batch cultures in a microbioreactor at various times after the induction of GFP production by xylose. The first striking observation was that, independently of the time of gene induction, cells stopped growing after 4 to 5 h. At the same time, GFP production stopped, and in due course, GFP became actively degraded. Disintegration of GFP could be excluded, because the in vivo half-life of GFP in B. megaterium was determined to be at least 9.5 h (see Fig. S4 in the supplemental material). The effect described above, namely, the shift between highly productive and less productive cells, could indeed be observed in the form of delayed production showing an inflection point, especially for early induction times (Fig. 8). This production behavior fitted a mathematical model dealing with two subpopulations (see Fig. S6 in the supplemental material). Another pertinent observation was that for early time points, the noise of the measured GFP production was greater, suggesting a stochastic plasmid distribution process. In summary, the observed unequal plasmid distribution obviously influences the dynamics and yield of the recombinant GFP production process in B. megaterium.
FIG 8.
GFP production by B. megaterium carrying pSSBm85 in response to the time of induction and the growth phase. (A) Growth curves at various times of induction and growth curve for the control without an inducer. (B) GFP abundance normalized to biomass for various induction times. The red curves show the modeled growth (A) and modeled production behavior (B) for induction times of 105 min (solid lines) and 195 min (dashed lines).
Model of plasmid distribution in recombinant protein-producing B. megaterium.
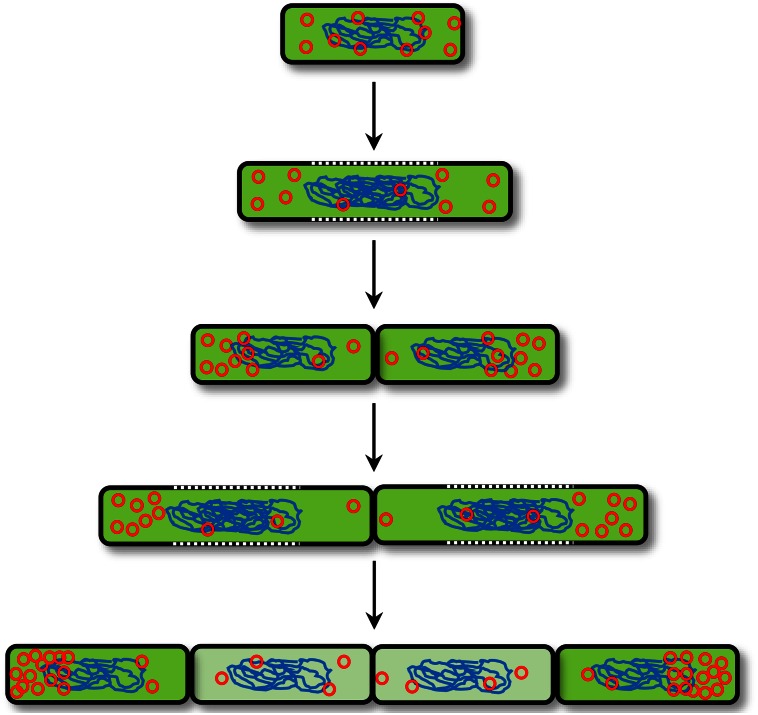
We integrated our results into a model that explained the observed population heterogeneity during recombinant protein production (Fig. 9). Starting from a state of equal plasmid distribution, cells began to produce GFP. Prior to cell division, a major proportion of plasmids remained at the cell poles. Subsequently, this polar fixation led to daughter cells with high and low plasmid abundances. In turn, these differences in gene dose caused by different copy numbers directly influenced the degree of recombinant protein production. As a consequence, cell lines with highly productive and less productive cells arose. The observed, characteristic pattern of neighboring producing and nonproducing cells in combination with red-tipped cells in growing cell chains of B. megaterium mirrored our model directly (Fig. 3 and 4; see also Movies S1 to S4 in the supplemental material).
FIG 9.
Proposed model of constrained plasmid distribution that explains the population heterogeneity during recombinant protein production. Polar fixation of plasmids (red circles) after cell division led to cell lines with high and low production performances. In this schema, plasmids were fixed to the old cell pole. However, polar fixation can affect either the old or the new cell pole.
DISCUSSION
We provide evidence to show that unequal plasmid distribution by polar fixation is the major reason for population heterogeneity during recombinant plasmid-based protein production in B. megaterium. Our postulated mechanism of plasmid distribution contradicts the commonly assumed free diffusion of multicopy plasmids with respect to the protein production conditions used. In our study, uneven distribution of plasmids led to an immediate decrease in product production rates in daughter cells with lower plasmid concentrations. Given that in the stationary phase, most cells were apparent producers, one might consider this effect to be an insignificant, transient phenomenon. However, in growing cells likely present in chemostats or fed-batch bioreactors, a stable subpopulation of less productive cells exists permanently (11). Moreover, highly productive cells accumulated plasmids and ceased growing, which finally led to a breakdown in production.
Such a phenomenon should not be confused with the well-known segregational instability describing complete plasmid loss in subpopulations (36); in contrast to our observed unequal plasmid distribution, that effect is commonly observed under nonselective conditions. However, the factors affecting segregational instability may also be related to our observations. Recently, a relationship between gene expression and plasmid segregation was shown for ColE1-like plasmids in E. coli (37): it was argued that transcription and translation interfere with plasmid replication, leading to low copy numbers and finally to plasmid loss. We did not detect complete plasmid loss, and a highly related plasmid has been described as being stably maintained in B. megaterium, even without selective pressure (38). We eventually concluded that the transcriptional and translational machinery slows down the distribution of plasmids in B. megaterium. In another study in E. coli, strong transcription was shown to drive plasmids to a location of high transcriptional activity close to the cell poles (39). In our B. megaterium system, rather larger patches of plasmid complexes were detected, which remained at one cell pole after cell division, with a preference for when the expression system was induced. This is in good agreement with results reported for B. subtilis, where different studies showed that active ribosomes are located at the cell poles of this bacterium (40) and that the cellular localizations of DNA and ribosomes overlap, indicating a coupled transcription/translation process (41).
However, despite the formation of plasmid clusters at the cell poles, it is somehow ensured that at least one plasmid enters the new cell after cell division. Although it was shown previously that plasmids are preferentially located near the cell poles and are grouped in clusters of foci (25, 35), it is generally assumed that high-copy-number plasmids without a partitioning system segregate by random diffusion. In contrast, low-copy-number plasmids segregated by a partitioning system were found localized near the center or quarter position of the cell and behaved like minichromosomes (42).
We also tested the distribution behavior of the much smaller pBC16 precursor plasmid, which belongs to a widely dispersed family of small multicopy plasmids of Gram-positive bacteria mediating naturally occurring tetracycline resistance among bacilli and other soil bacteria (43). In the latter case, several plasmid foci were found randomly distributed all over the cytoplasm, and thus, we argue that plasmid size may play a crucial role in the formation of distinct foci. Due to the facts that plasmids generally occurred in clustered foci and that free diffusion within living cells is generally constrained, the random diffusion model was previously questioned; it was postulated that chromosome-encoded proteins recruit at least one plasmid copy from the cluster and mediate the partitioning via a yet-unknown mechanism (44, 45).
Previous reports revealed that the pUB110 plasmid, which is related to the expression plasmid we employed, was found bound to the cell membrane via specific attachment regions (46, 47). However, confocal laser scanning microscopy (CLSM) analyses in combination with 3-dimensional (3D) image stack reconstruction suggested that the plasmids were not bound to the membrane but, instead, were arranged in a central region of the transaxial plane (see Fig. S5B in the supplemental material). A plausible explanation may be the lower number of membrane attachment sites in pKMMBm2 than in the original plasmid (see Fig. S1 in the supplemental material).
In the long term, the accumulation of plasmids negatively affected the cell division rate of the bacteria. One reason could be an increased metabolic burden, which may bring the production capacity of a cell to its limit. Another explanation might be associated with bacterial cell aging. Since plasmids also accumulated at the old poles, it can be expected that the vitality of mother cells will decrease with increasing number of generations (48, 49). However, in this study, we showed that the cell pole was chosen randomly, and therefore, this effect should be only marginal.
So far, very little is known about the distribution of high-copy-number plasmids, especially in Gram-positive bacteria (50). Our findings show a polar fixation for the plasmid used in the production of large amounts of recombinant proteins in B. megaterium. However, the molecular mechanisms behind these observations remain largely unknown. Further studies are required to shed light on the molecular principles involved.
Supplementary Material
ACKNOWLEDGMENTS
This work was funded by the German Research Foundation (DFG), within the priority program SPP1617, “Phenotypic heterogeneity and sociobiology of bacterial populations.”
We thank Maria Höxter and Lothar Gröbe for support in cell sorting and Irmtraud Steinmetz for confocal laser scanning microscope imaging. We are also grateful to Joe Pogliano for providing the FISH protocol and to Peter Graumann for providing the pJS72 plasmid. Additionally, we owe thanks to Gerald Seidel for supplying the xylR mutants of B. megaterium (strain WH321) and to Birte Bieser for critical reading of the manuscript.
Footnotes
Supplemental material for this article may be found at http://dx.doi.org/10.1128/AEM.00807-15.
REFERENCES
- 1.Dong H, Zhang D. 2014. Current development in genetic engineering strategies of Bacillus species. Microb Cell Fact 13:63. doi: 10.1186/1475-2859-13-63. [DOI] [PMC free article] [PubMed] [Google Scholar]
- 2.Liu L, Liu Y, Shin H-D, Chen RR, Wang NS, Li J, Du G, Chen J. 2013. Developing Bacillus spp. as a cell factory for production of microbial enzymes and industrially important biochemicals in the context of systems and synthetic biology. Appl Microbiol Biotechnol 97:6113–6127. doi: 10.1007/s00253-013-4960-4. [DOI] [PubMed] [Google Scholar]
- 3.Terpe K. 2006. Overview of bacterial expression systems for heterologous protein production: from molecular and biochemical fundamentals to commercial systems. Appl Microbiol Biotechnol 72:211–222. doi: 10.1007/s00253-006-0465-8. [DOI] [PubMed] [Google Scholar]
- 4.Bunk B, Schulz A, Stammen S, Münch R, Warren MJ, Rohde M, Jahn D, Biedendieck R. 2010. A short story about a big magic bug. Bioeng Bugs 1:85–91. doi: 10.4161/bbug.1.2.11101. [DOI] [PMC free article] [PubMed] [Google Scholar]
- 5.Vary PS, Biedendieck R, Fuerch T, Meinhardt F, Rohde M, Deckwer W-D, Jahn D. 2007. Bacillus megaterium—from simple soil bacterium to industrial protein production host. Appl Microbiol Biotechnol 76:957–967. doi: 10.1007/s00253-007-1089-3. [DOI] [PubMed] [Google Scholar]
- 6.Rygus T, Hillen W. 1991. Inducible high-level expression of heterologous genes in Bacillus megaterium using the regulatory elements of the xylose-utilization operon. Appl Microbiol Biotechnol 35:594–599. [DOI] [PubMed] [Google Scholar]
- 7.Rygus T, Scheler A, Allmansberger R, Hillen W. 1991. Molecular cloning, structure, promoters and regulatory elements for transcription of the Bacillus megaterium encoded regulon for xylose utilization. Arch Microbiol 155:535–542. doi: 10.1007/BF00245346. [DOI] [PubMed] [Google Scholar]
- 8.Malten M, Hollmann R, Deckwer W-D, Jahn D. 2005. Production and secretion of recombinant Leuconostoc mesenteroides dextransucrase DsrS in Bacillus megaterium. Biotechnol Bioeng 89:206–218. doi: 10.1002/bit.20341. [DOI] [PubMed] [Google Scholar]
- 9.Eppinger M, Bunk B, Johns MA, Edirisinghe JN, Kutumbaka KK, Koenig SS, Creasy HH, Rosovitz MJ, Riley DR, Daugherty S, Martin M, Elbourne LD, Paulsen I, Biedendieck R, Braun C, Grayburn S, Dhingra S, Lukyanchuk V, Ball B, Ul-Qamar R, Seibel J, Bremer E, Jahn D, Ravel J, Vary PS. 2011. Genome sequences of the biotechnologically important Bacillus megaterium strains QM B1551 and DSM319. J Bacteriol 193:4199–4213. doi: 10.1128/JB.00449-11. [DOI] [PMC free article] [PubMed] [Google Scholar]
- 10.Stammen S, Müller BK, Korneli C, Biedendieck R, Gamer M, Franco-Lara E, Jahn D. 2010. High-yield intra- and extracellular protein production using Bacillus megaterium. Appl Environ Microbiol 76:4037–4046. doi: 10.1128/AEM.00431-10. [DOI] [PMC free article] [PubMed] [Google Scholar]
- 11.Biedendieck R, Yang Y, Deckwer W-D, Malten M, Jahn D. 2007. Plasmid system for the intracellular production and purification of affinity-tagged proteins in Bacillus megaterium. Biotechnol Bioeng 96:525–537. doi: 10.1002/bit.21145. [DOI] [PubMed] [Google Scholar]
- 12.Scholz O, Thiel A, Hillen W, Niederweis M. 2000. Quantitative analysis of gene expression with an improved green fluorescent protein. Eur J Biochem 267:1565–1570. doi: 10.1046/j.1432-1327.2000.01170.x. [DOI] [PubMed] [Google Scholar]
- 13.Kaltwasser M, Wiegert T, Schumann W. 2002. Construction and application of epitope- and green fluorescent protein-tagging integration vectors for Bacillus subtilis. Appl Environ Microbiol 68:2624–2628. doi: 10.1128/AEM.68.5.2624-2628.2002. [DOI] [PMC free article] [PubMed] [Google Scholar]
- 14.Soufo HJD, Graumann PL. 2010. Bacillus subtilis MreB paralogues have different filament architectures and lead to shape remodelling of a heterologous cell system. Mol Microbiol 78:1145–1158. doi: 10.1111/j.1365-2958.2010.07395.x. [DOI] [PubMed] [Google Scholar]
- 15.Hahne F, LeMeur N, Brinkman RR, Ellis B, Haaland P, Sarkar D, Spidlen J, Strain E, Gentleman R. 2009. flowCore: a Bioconductor package for high throughput flow cytometry. BMC Bioinformatics 10:106. doi: 10.1186/1471-2105-10-106. [DOI] [PMC free article] [PubMed] [Google Scholar]
- 16.Sarkar D, Le Meur N, Gentleman R. 2008. Using flowViz to visualize flow cytometry data. Bioinformatics 24:878–879. doi: 10.1093/bioinformatics/btn021. [DOI] [PMC free article] [PubMed] [Google Scholar]
- 17.Pfaffl MW. 2001. A new mathematical model for relative quantification in real-time RT-PCR. Nucleic Acids Res 29:e45. doi: 10.1093/nar/29.9.e45. [DOI] [PMC free article] [PubMed] [Google Scholar]
- 18.Tichopad A, Dilger M, Schwarz G, Pfaffl MW. 2003. Standardized determination of real-time PCR efficiency from a single reaction set-up. Nucleic Acids Res 31:e122. doi: 10.1093/nar/gng122. [DOI] [PMC free article] [PubMed] [Google Scholar]
- 19.Spiess A-N, Feig C, Ritz C. 2008. Highly accurate sigmoidal fitting of real-time PCR data by introducing a parameter for asymmetry. BMC Bioinformatics 9:221. doi: 10.1186/1471-2105-9-221. [DOI] [PMC free article] [PubMed] [Google Scholar]
- 20.Vandesompele J, De Preter K, Pattyn F, Poppe B, Van Roy N, De Paepe A, Speleman F. 2002. Accurate normalization of real-time quantitative RT-PCR data by geometric averaging of multiple internal control genes. Genome Biol 3:RESEARCH0034. doi: 10.1186/gb-2002-3-7-research0034. [DOI] [PMC free article] [PubMed] [Google Scholar]
- 21.Ritz C, Spiess A-N. 2008. qpcR: an R package for sigmoidal model selection in quantitative real-time polymerase chain reaction analysis. Bioinformatics 24:1549–1551. doi: 10.1093/bioinformatics/btn227. [DOI] [PubMed] [Google Scholar]
- 22.Young JW, Locke JCW, Altinok A, Rosenfeld N, Bacarian T, Swain PS, Mjolsness E, Elowitz MB. 2012. Measuring single-cell gene expression dynamics in bacteria using fluorescence time-lapse microscopy. Nat Protoc 7:80–88. doi: 10.1038/nprot.2011.432. [DOI] [PMC free article] [PubMed] [Google Scholar]
- 23.Klein J, Leupold S, Biegler I, Biedendieck R, Münch R, Jahn D. 2012. TLM-Tracker: software for cell segmentation, tracking and lineage analysis in time-lapse microscopy movies. Bioinformatics 28:2276–2277. doi: 10.1093/bioinformatics/bts424. [DOI] [PubMed] [Google Scholar]
- 24.Dernburg AF, Sedat JW. 1998. Mapping three-dimensional chromosome architecture in situ. Methods Cell Biol 53:187–233. [DOI] [PubMed] [Google Scholar]
- 25.Pogliano J, Ho TQ, Zhong Z, Helinski DR. 2001. Multicopy plasmids are clustered and localized in Escherichia coli. Proc Natl Acad Sci U S A 98:4486–4491. doi: 10.1073/pnas.081075798. [DOI] [PMC free article] [PubMed] [Google Scholar]
- 26.Bernhard K, Schrempf H, Goebel W. 1978. Bacteriocin and antibiotic resistance plasmids in Bacillus cereus and Bacillus subtilis. J Bacteriol 133:897–903. [DOI] [PMC free article] [PubMed] [Google Scholar]
- 27.Jensen RB, Shapiro L. 1999. The Caulobacter crescentus smc gene is required for cell cycle progression and chromosome segregation. Proc Natl Acad Sci U S A 96:10661–10666. doi: 10.1073/pnas.96.19.10661. [DOI] [PMC free article] [PubMed] [Google Scholar]
- 28.Gentleman RC, Carey VJ, Bates DM, Bolstad B, Dettling M, Dudoit S, Ellis B, Gautier L, Ge Y, Gentry J, Hornik K, Hothorn T, Huber W, Iacus S, Irizarry R, Leisch F, Li C, Maechler M, Rossini AJ, Sawitzki G, Smith C, Smyth G, Tierney L, Yang JY, Zhang J. 2004. Bioconductor: open software development for computational biology and bioinformatics. Genome Biol 5:R80. doi: 10.1186/gb-2004-5-10-r80. [DOI] [PMC free article] [PubMed] [Google Scholar]
- 29.Dubnau D, Losick R. 2006. Bistability in bacteria. Mol Microbiol 61:564–572. doi: 10.1111/j.1365-2958.2006.05249.x. [DOI] [PubMed] [Google Scholar]
- 30.Ozbudak EM, Thattai M, Lim HN, Shraiman BI, Van Oudenaarden A. 2004. Multistability in the lactose utilization network of Escherichia coli. Nature 427:737–740. doi: 10.1038/nature02298. [DOI] [PubMed] [Google Scholar]
- 31.Schmiedel D, Kintrup M, Küster E, Hillen W. 1997. Regulation of expression, genetic organization and substrate specificity of xylose uptake in Bacillus megaterium. Mol Microbiol 23:1053–1062. doi: 10.1046/j.1365-2958.1997.2881654.x. [DOI] [PubMed] [Google Scholar]
- 32.Rygus T, Hillen W. 1992. Catabolite repression of the xyl operon in Bacillus megaterium. J Bacteriol 174:3049–3055. [DOI] [PMC free article] [PubMed] [Google Scholar]
- 33.Landgraf D, Okumus B, Chien P, Baker TA, Paulsson J. 2012. Segregation of molecules at cell division reveals native protein localization. Nat Methods 9:480–482. doi: 10.1038/nmeth.1955. [DOI] [PMC free article] [PubMed] [Google Scholar]
- 34.Reyes-Lamothe R, Tran T, Meas D, Lee L, Li AM, Sherratt DJ, Tolmasky ME. 2014. High-copy bacterial plasmids diffuse in the nucleoid-free space, replicate stochastically and are randomly partitioned at cell division. Nucleic Acids Res 42:1042–1051. doi: 10.1093/nar/gkt918. [DOI] [PMC free article] [PubMed] [Google Scholar]
- 35.Gordon GS, Sitnikov D, Webb CD, Teleman A, Straight A, Losick R, Murray AW, Wright A. 1997. Chromosome and low copy plasmid segregation in E. coli: visual evidence for distinct mechanisms. Cell 90:1113–1121. doi: 10.1016/S0092-8674(00)80377-3. [DOI] [PubMed] [Google Scholar]
- 36.Hartigan JA, Hartigan PM. 1985. The dip test of unimodality. Ann Stat 13:70–84. doi: 10.1214/aos/1176346577. [DOI] [Google Scholar]
- 37.Summers DK. 1996. The biology of plasmids, p 68–82. Blackwell Science Ltd., Oxford, United Kingdom. [Google Scholar]
- 38.Popov M, Petrov S, Nacheva G, Ivanov I, Reichl U. 2011. Effects of a recombinant gene expression on ColE1-like plasmid segregation in Escherichia coli. BMC Biotechnol 11:18. doi: 10.1186/1472-6750-11-18. [DOI] [PMC free article] [PubMed] [Google Scholar]
- 39.Sánchez-Romero M-A, Lee DJ, Sánchez-Morán E, Busby SJW. 2012. Location and dynamics of an active promoter in Escherichia coli K-12. Biochem J 441:481–485. doi: 10.1042/BJ20111258. [DOI] [PMC free article] [PubMed] [Google Scholar]
- 40.Sojka L, Fucík V, Krásný L, Barvík I, Jonák J. 2007. YbxF, a protein associated with exponential-phase ribosomes in Bacillus subtilis. J Bacteriol 189:4809–4814. doi: 10.1128/JB.01786-06. [DOI] [PMC free article] [PubMed] [Google Scholar]
- 41.Mascarenhas J, Weber MH, Graumann PL. 2001. Specific polar localization of ribosomes in Bacillus subtilis depends on active transcription. EMBO Rep 2:685–689. doi: 10.1093/embo-reports/kve160. [DOI] [PMC free article] [PubMed] [Google Scholar]
- 42.Meinhardt F, Stahl U, Ebeling W. 1989. Highly efficient expression of homologous and heterologous genes in Bacillus megaterium. Appl Microbiol Biotechnol 30:343–350. doi: 10.1007/BF00296622. [DOI] [Google Scholar]
- 43.Polak J, Novick RP. 1982. Closely related plasmids from Staphylococcus aureus and soil bacilli. Plasmid 7:152–162. doi: 10.1016/0147-619X(82)90074-9. [DOI] [PubMed] [Google Scholar]
- 44.Million-Weaver S, Camps M. 2014. Mechanisms of plasmid segregation: have multicopy plasmids been overlooked? Plasmid 75:27–36. doi: 10.1016/j.plasmid.2014.07.002. [DOI] [PMC free article] [PubMed] [Google Scholar]
- 45.Nordström K, Gerdes K. 2003. Clustering versus random segregation of plasmids lacking a partitioning function: a plasmid paradox? Plasmid 50:95–101. doi: 10.1016/S0147-619X(03)00056-8. [DOI] [PubMed] [Google Scholar]
- 46.Korn R, Winston S, Tanaka T, Sueoka N. 1983. Specific in vitro binding of a plasmid to a membrane fraction of Bacillus subtilis. Proc Natl Acad Sci U S A 80:574–578. doi: 10.1073/pnas.80.2.574. [DOI] [PMC free article] [PubMed] [Google Scholar]
- 47.Tanaka T, Sueoka N. 1983. Site-specific in vitro binding of plasmid pUB110 to Bacillus subtilis membrane fraction. J Bacteriol 154:1184–1194. [DOI] [PMC free article] [PubMed] [Google Scholar]
- 48.Stewart EJ, Madden R, Paul G, Taddei F. 2005. Aging and death in an organism that reproduces by morphologically symmetric division. PLoS Biol 3:e45. doi: 10.1371/journal.pbio.0030045. [DOI] [PMC free article] [PubMed] [Google Scholar]
- 49.Lindner AB, Madden R, Demarez A, Stewart EJ, Taddei F. 2008. Asymmetric segregation of protein aggregates is associated with cellular aging and rejuvenation. Proc Natl Acad Sci U S A 105:3076–3081. doi: 10.1073/pnas.0708931105. [DOI] [PMC free article] [PubMed] [Google Scholar]
- 50.Wang JD, Rokop ME, Barker MM, Hanson NR, Grossman AD. 2004. Multicopy plasmids affect replisome positioning in Bacillus subtilis. J Bacteriol 186:7084–7090. doi: 10.1128/JB.186.21.7084-7090.2004. [DOI] [PMC free article] [PubMed] [Google Scholar]
Associated Data
This section collects any data citations, data availability statements, or supplementary materials included in this article.


