Abstract
Background
Spectral analysis of the radio-frequency (RF) signals that underlie grayscale EUS images has been used to provide quantitative, objective information about tissue histology.
Objective
Our purpose was to validate RF spectral analysis as a method to distinguish between chronic pancreatitis (CP) and pancreatic cancer (PC).
Design & Setting
A prospective study of eligible patients was conducted to analyze the RF data obtained using electronic-array echoendoscopes.
Patients
Pancreatic images were obtained using electronic array echoendoscopes from 41 patients in a prospective study, including 15 patients with pancreatic cancer, 15 with chronic pancreatitis, and 11 with normal pancreas.
Main outcome measurements
Midband fit, slope, intercept, correlation coefficient, and root-mean-square (RMS) deviation from a linear regression of the calibrated power spectra were determined and compared among the groups.
Results
Statistical analysis showed that significant differences were observable between groups for mean midband fit, intercept, and RMS deviation (T-test p < 0.05). Discriminant analysis of these parameters was then performed to classify the data. For CP (n = 15) vs. PC (n = 15), the same parameters provided 83% accuracy and AUC of 0.83.
Limitations
Moderate sample size and spatial averaging inherent to the technique.
Conclusions
This study shows that mean spectral parameters of the backscattered signals obtained using electronic array echoendoscopes can provide a non-invasive method to quantitatively discriminate between chronic pancreatitis and pancreatic cancer.
Introduction
EUS has emerged as one of the most accurate modalities for diagnosing diseases of the pancreas, and for loco-regional staging of GI malignancy. It is a sensitive non-operative method for diagnosis and staging of pancreatic malignancy.1-7 However, differentiating pancreatic cancer (PC) from benign pancreatic diseases such as chronic pancreatitis (CP), autoimmune pancreatitis, and recent acute pancreatitis remains challenging.8-11 EUS is highly operator-dependent as it relies upon user interpretation of various features of a qualitative image such as size, homogeneity, and echogenicity.12,13 Although EUS-guided fine needle aspiration (FNA) can obtain diagnostic cytologic material, imaging characteristics are still vital to target tissue for FNA. Furthermore, sensitivity of FNA for diagnosis of malignancy is influenced by factors such as endoscopist's skill, needle characteristics, number of passes, sample preparation, and pathologist's interpretation.14
A great need exists for objective means of differentiating benign from neoplastic tissue to increase the diagnostic accuracy of EUS and improve the yield of FNA. Recent studies have used elastography, digital image analysis with artificial neural networks and pattern recognition technology15-18 in an attempt to introduce objective parameters. Spectrum analysis of backscattered radio-frequency (RF) ultrasound signals in US imaging19-23 has also been exploited for objective, quantitative tissue characterization. The method has proven to be effective for identifying tissue changes due to prostate cancer,24-26 breast cancer,27 ocular cancer,28 lymph node metastases from cancers of the breast29 and colon,30-33 liver disease,34 intravascular plaque,35 and hyperthermic lesions36-38 and has also been implemented to perform real-time tissue-type imaging.39 In brief, the method of spectrum analysis extracts parameters from the ultrasound backscattered from local inhomogeneities in tissue. The nature of the backscattered signals depends on the effective size and acoustic concentration of the scatterers as well as the local variations in acoustic impedance (product of density and sound speed). Analysis of the spectral characteristics of the backscattered RF signals may allow different tissue types to be distinguished, e.g., a malignant tumor scatters ultrasound differently than normal tissue because of its different microstructure.40 The assessment by spectral parameters is quantitative and, with proper calibration, is independent of the system and user. Our previous studies involving patients using radial echoendoscopes with single-element, mechanically-rotating transducers41,42 showed that mean spectral parameters computed from EUS RF data can discriminate normal pancreas from diseased pancreas.
Over the past decade, radial and curvilinear electronic-array echoendoscopes have widely replaced mechanical echoendoscopes. The mechanical echoendoscopes have a lower image frame rate relative to electronic transducers because of the time required to send and receive images from the full 360-degree plane with a single physically rotating transducer. The images acquired by electronic radial echoendoscopes are believed to be better compared with those acquired by mechanical radial echoendoscopes.43,44 The aim of this study was to test the ability of spectral analysis of EUS backscattered signals obtained from radial and curvilinear electronic-array echoendoscopes to distinguish between normal pancreas (NP), pancreatic cancer (PC), and chronic pancreatitis (CP).
Patients and Methods
Patients and clinical protocol
EUS images of the pancreas were obtained from a total of 41 patients (20 men and 21 women; mean age 62, range 40–87) at University Hospitals Case Medical Center, Cleveland, Ohio, USA, from May 2009 to March 2010. As the data acquisition process does not affect the procedure itself, a waiver of patient consent for this study was granted by our institutional review board. The indications were abnormal pancreatic imaging [pancreatic mass (13), parenchymal abnormalities (2), ductal abnormalities (3)], chronic pancreatitis (6), abdominal pain (3), submucosal lesions in the GI tract (6), recurrent or focal acute pancreatitis (2), obstructive jaundice (1), family history of pancreatic cancer (1), peri-pancreatic fluid collection (1), abnormal imaging of bile ducts (2), and known pancreatic adenocarcinoma for fiducial placement (1). FNA was performed in a total of 18 patients. A total of 15 patients had adenocarcinoma (including one that had known pancreatic adenocarcinoma). Eleven patients had sonographically normal pancreas, where FNA was not performed. Fifteen patients were noted to have more than or equal to 3 EUS criteria suggestive of chronic pancreatitis. Using the Rosemont classification,45 EUS findings were consistent with chronic pancreatitis in 10 patients (at least 2 major features or a major feature with ≥ 3 minor features), suggestive of chronic pancreatitis in 2 patients (1 major A with < 3 minor features or 1 major B and ≥ 3 minor features) and indeterminate (>3, <5 minor features) in one. Chronic pancreatitis was confirmed after surgical resection in 2 patients.
Diagnostic criteria
Normal pancreas (NP) cases met all of the following criteria: (1) Referred for EGD/EUS for a non-pancreas indication (e.g. evaluation of submucosal nodules). (2) No history of alcohol abuse as defined by habitual consumption of > 40 g ethanol weekly. (3) No prior personal history of pancreatitis. (4) No family history of pancreatitis. (5) No diagnosis of pancreatitis or pancreatic cancer in the year after EUS examination, as determined by follow-up telephone questionnaire and/or review of medical records. Chronic pancreatitis (CP) cases met all of the following criteria: (1) Referred for EGD/EUS for evaluation of pancreas. (2) Greater than or equal to 3 EUS criteria for chronic pancreatitis: (a) hyperechoic foci, (b) hyperechoic stranding, (c) lobularity, (d) cyst, (e) calcification, (f) ductal dilation, (g) side branch dilation, (h) duct irregularity, (i) hyperechoic duct margins, (j) atrophy, (k) inhomogeneous echo pattern. (3) No diagnosis of pancreatic cancer in the year after EUS examination, as determined by follow-up telephone questionnaire and/or review of medical records. Pancreatic cancer (PC) cases met all of the following criteria: (1) Pancreatic mass lesion identified on EUS. (2) FNA cytology positive for adenocarcinoma OR positive ERCP brush cytology for adenocarcinoma OR positive mucosal biopsy for adenocarcinoma OR surgical pathology positive for adenocarcinoma.
RF data acquisition and analysis
A commercially available clinical ultrasound system (Exera EU-ME1, Olympus America, Center Valley, Pennsylvania, USA) was used with radial (GF-UE160-AL5) and curvilinear (GF-UC140P-AL5) electronic-array ultrasonic gastrovideoscopes (Olympus America, Center Valley, Pennsylvania, USA). The radial and curvilinear echoendoscopes contain arrays of ultrasound transducer elements which are electronically excited in sets to generate 360° or 180° B-scan cross-sectional images, respectively, typically consisting of hundreds of A-scan lines. Both echoendoscopes can be set to operate in 5, 6, 7.5, and 10 MHz modes, but for all cases included in our studies they were only operated in the 6 MHz mode. The radial echoendoscope was used with range settings of 6 cm and 9 cm, while the curvilinear echoendoscope was used with range settings of 4 cm, 5 cm, 6 cm. For both echoendoscopes, the range is defined as the diameter of circular or half-circular cross-section in the field of view and chosen by the endoscopist performing the procedure to best visualize the region(s) of interest. When data were acquired in RF mode, both echoendoscopes could have one focus with adjustable location during transmission, but the location of the focus was not varied from the default location for any given range setting. Both echoendoscopes used dynamic focusing during reception of the backscattered ultrasound signals. When the endoscopist saved the image data, the RF data corresponding to that single captured image were digitized by the Exera EU-ME1 system and saved automatically at essentially the same time. (The use of this mode was an improvement over previous studies41,42 wherein images and corresponding RF data were obtained serially using a digital oscilloscope to acquire the RF data.)
The RF data were then imported into our custom-designed, MATLAB-based (MATLAB 2010b, Mathworks, Natick, Massachusetts, USA) analysis software for off-line image reconstruction and data processing. As an initial check, our analysis software first re-created images from the acquired RF data (reconstructed image), by applying a high-pass Butterworth filter (cut-off at 1 MHz, stop-band suppression > 80 dB, pass-band ripple < 0.01 dB) to remove low frequency electronic noise, computing the envelope of the RF data from absolute value of its Hilbert transform, and then applying logarithmic compression. Figure 1 shows a comparison of images saved directly by the Exera EU-ME1 system (system image) with our reconstructed images for both the radial and curvilinear echoendoscopes. Except for minor differences in grayscale range settings, excellent agreement was obtained. The gain, contrast, line density, and frame correlation settings, which affect the appearance of the system image, did not change the underlying RF data acquired by the system.
Figure 1. Comparison of system images with images reconstructed from RF EUS data.
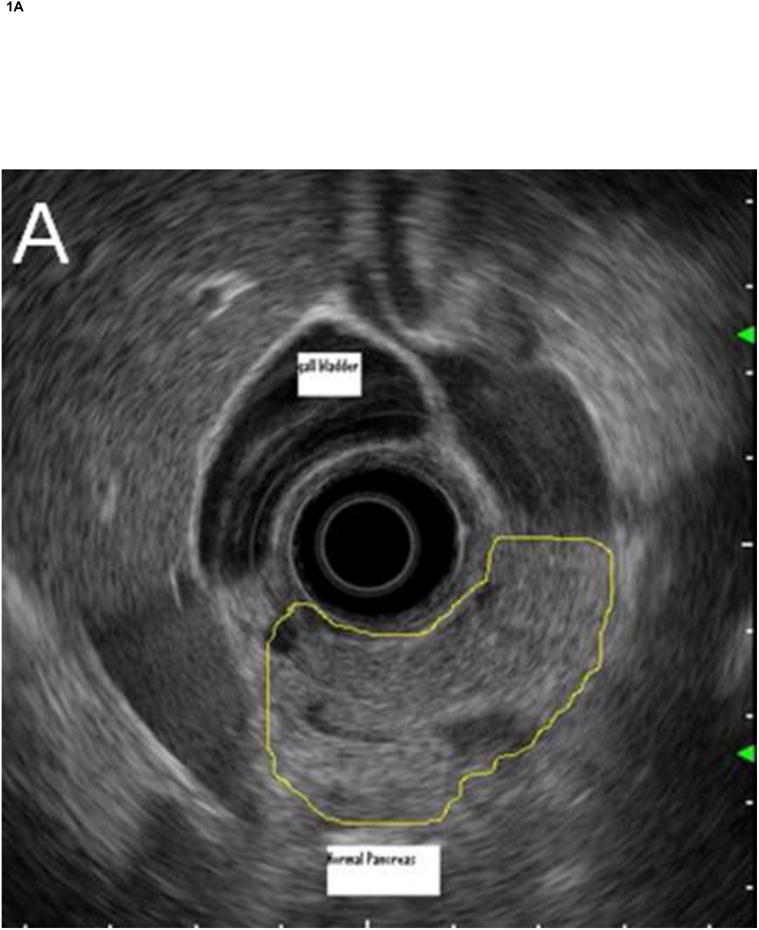
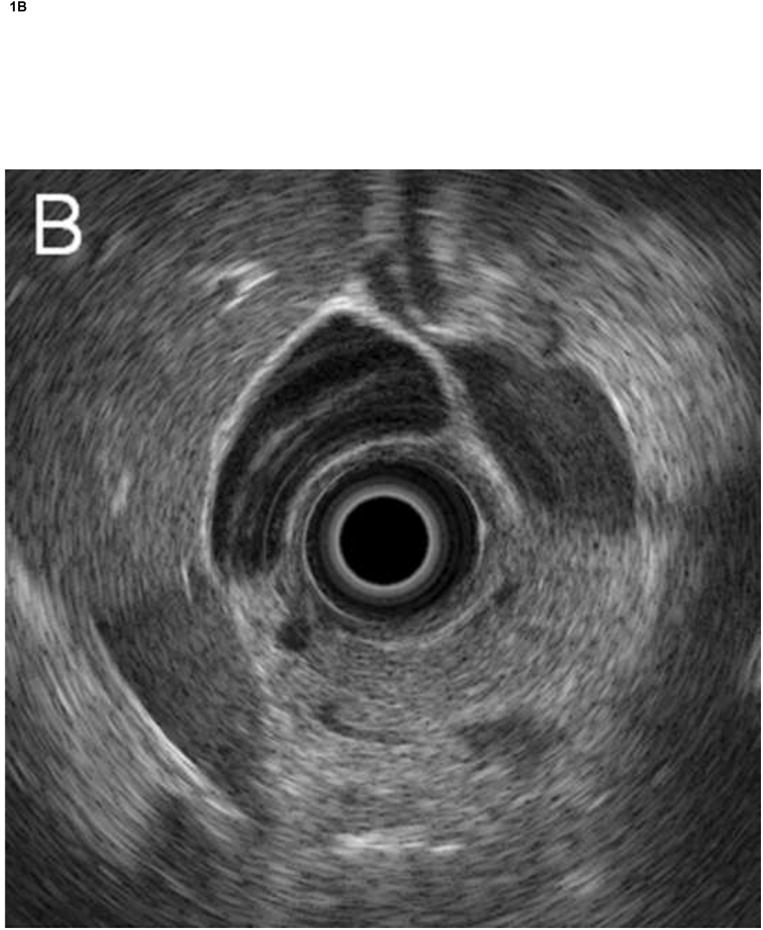
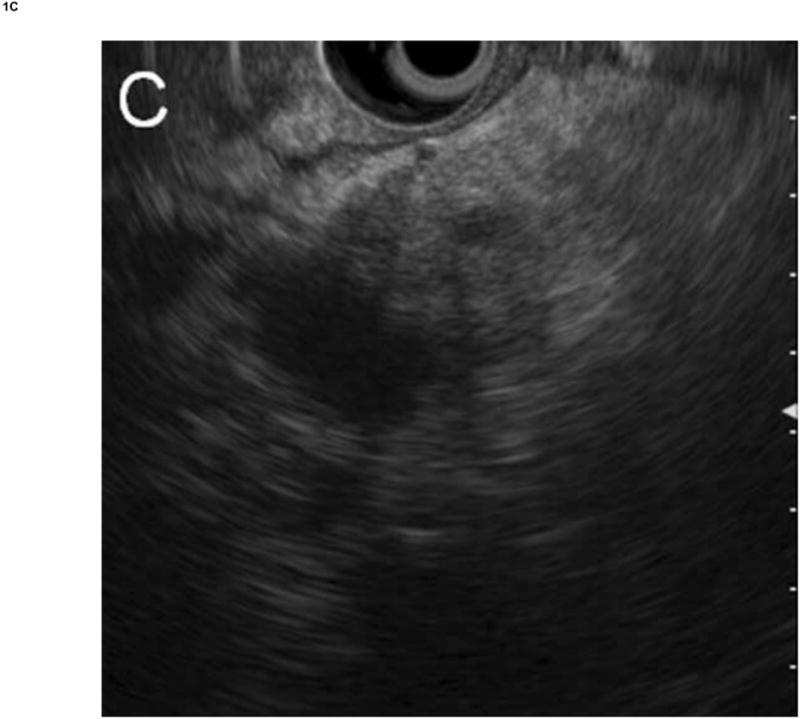
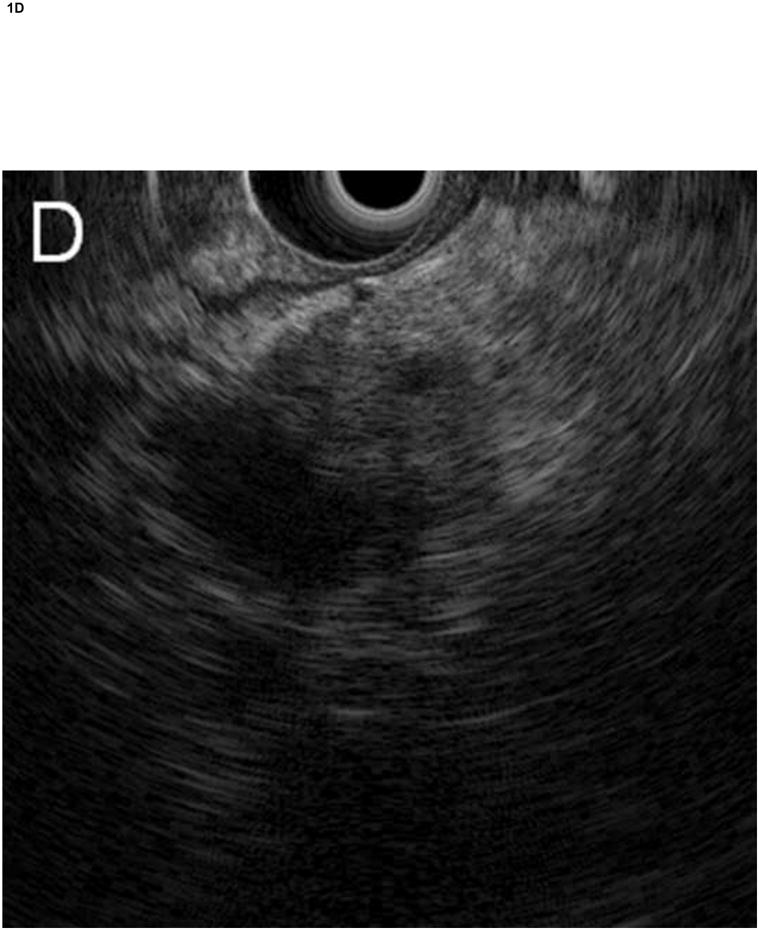
Radial echoendoscope (Olympus GF-UE160-AL5): (A) system image and (B) reconstructed image. Curvilinear echoendoscope (Olympus GF-UC140P-AL5): (C) system image and (D) reconstructed image.
Before RF data analysis, regions of interest (ROIs) were identified and manually segmented by the endoscopist who performed the examination on the system image according to the evaluation criteria described below. The ROIs were then independently translated by a single investigator onto the reconstructed image to select corresponding segments of RF data to ensure consistency. Each sector-shaped area was sized to be maximum within the designated ROIs. Power spectra were calculated by computing the Fast Fourier Transform (FFT) for the signals of each A-scan RF data within the ROI after gating by a series of sliding Hamming windows46,47 of 0.8 μs (∼0.62 mm), each offset by 0.1 μs (∼0.077 mm).
Spectrum calibration
To remove the effects associated with the composite transfer function of the electronic transmitter/receiver and transducer of the EUS system, calibration is typically performed by dividing the power spectrum from the tissue by the spectrum of an ideal reflector. However, we did not have control over the electronic gain settings for the RF data acquisition (not the image gain setting), and, as such, we could not use a strong ultrasound reflector (e.g., glass) without saturating the received signal from an ideal reflector. Based our previous study,42 calibration was performed using reflections from the flat wall of an acrylic plastic chamber filled with a gelatin-based phantom. The phantom was used to attenuate the signal amplitude enough to prevent saturation of the signal by the system electronics without affecting the spectrum of the signal.
The calibration chambers were created using the following method. The phantom was synthesized by first making a gelatin solution of bovine gelatin (80 g, 200 bloom, BH-200-040-F-G, Gelatin Innovations, Chicago, Illinois, USA), 1-propanol (27 mL, 402893, Sigma-Aldrich, St. Louis, Missouri, USA), p-toluic acid (1 g, T36803, Sigma-Aldrich), and distilled water (150 mL). This mixture was heated and mixed to dissolve the gelatin. Next, graphite (57.8 g in 150 mL distilled water, MZ-25, American Grease Stick Co., Muskegon, Michigan, USA) and Amberlite (6 g in 75 mL distilled water, 10–20 μm diameter particles, I-6641, Lot 85H02042, Sigma-Aldrich) were added to the gelatin solution to increase attenuation and scattering. After the resulting solution was well-mixed, the heating was turned off, and a small amount of formaldehyde (5 mL, 252549, Sigma-Aldrich) was added as a preservative. To create the test chamber for a specific endoscope and range setting, a plastic cylinder (18 mm diameter) was placed into the chamber at the known focal distance for that range setting, and the liquid phantom material was poured into the chamber around the cylinder. The entire chamber was then placed in a refrigerator. After the phantom solidified, the cylinder was removed, thereby leaving a hole to accommodate the endoscope and provide a reflecting surface at the proper distance. This procedure was repeated for each range setting of both endoscopes.
To obtain the RF calibration data, the hole in the gelatin phantom was filled with water before the insertion of the endoscope transducer, and the endoscope's balloon was inflated with water until the balloon was in full contact with the phantom. The orientation of the endoscope tip was then manually adjusted to ensure that the central axis of the endoscope was parallel to the wall. RF data was then acquired, and the spectrum was computed by FFT. The phantom material was independently measured using the substitution method48 to have an attenuation of 1.5 dB/MHz/cm. The calibration spectrum was then compensated for round-trip attenuation. Figure 2A and 2B show some examples images of the calibration measurements for the radial and curvilinear echoendoscopes, respectively.
Figure 2. Calibration experiments.
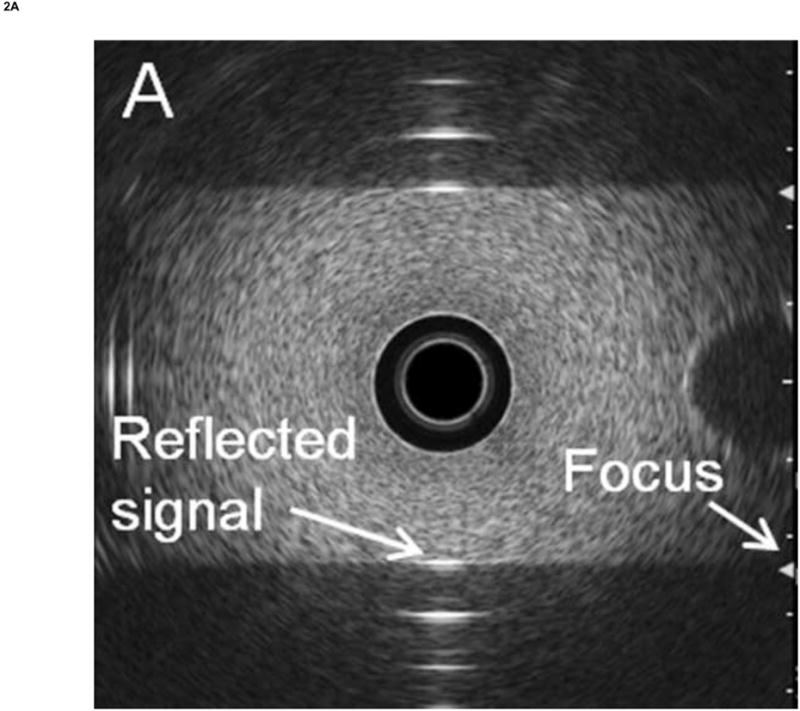
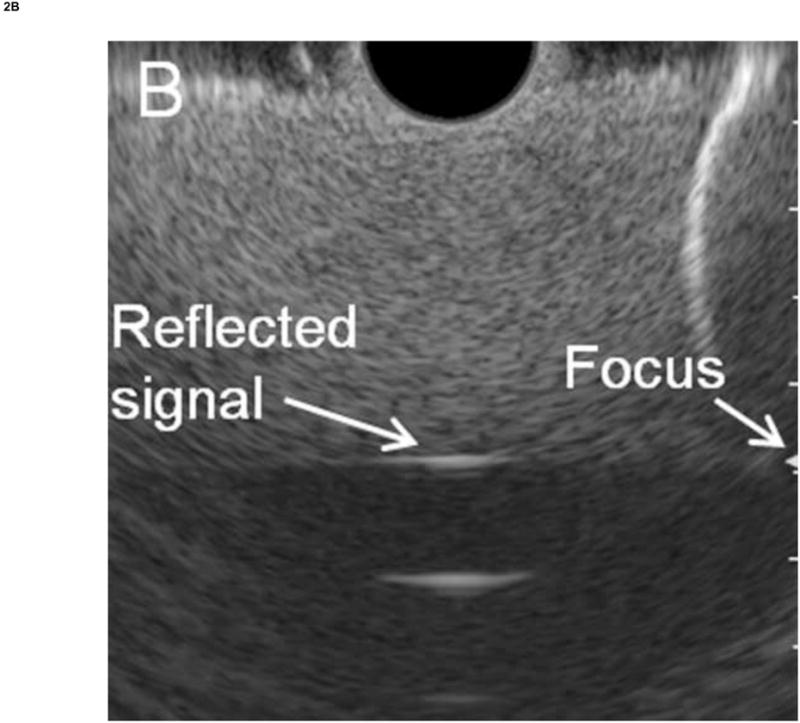
Calibration was performed by measuring the RF EUS signal reflected from a flat plastic reflector using an appropriate phantom material to prevent signal saturation. (A) Radial echoendoscope. (B) Curvilinear echoendoscope. In both cases, the green arrows on the right side of the display indicate the focus of the transducer.
To perform the calibration, the tissue spectrum is divided by the calibration spectrum. Because the calibrated spectra are typically quasi-linear over the ultrasound frequency band used,41 they can be effectively characterized by linear regression using their slope, intercept, and their midband fit, which is the value of the linear function evaluated at the midpoint of the −15dB frequency bandwidth. Both the midband fit and slope values were corrected for the attenuation of the intervening tissue between the transducer and the ROI using an assumed attenuation of 0.5 dB/MHz/cm; the intercept is not affected by this attenuation correction.23 The square of the correlation coefficient R2 and root-mean-square (RMS) deviation of the regression line from the data were also recorded as normalized and unnormalized measures of the deviation of the calibrated spectrum from linearity.
Statistical analysis
The spectral parameters generated from each window were averaged over each ROI. The resulting values were then analyzed using Student's T-test for independent samples (PC vs CP). T-tests assumed equal variance, and all parameters satisfied the Shapiro–Wilk normality test, unless otherwise noted.
Once parameters were identified that provided statistically significant differences between group means, linear discriminant analysis (LDA) was performed to classify the data using equal prior probabilities for each group and the within-groups covariance matrix. For LDA where the same data was used for training and testing, the leave-one-out approach was used for cross-validation. All statistical calculations were performed using SPSS (Version 16, SPSS, Chicago, Illinois, USA). A binormal receiver operating characteristic (ROC) curve was then fit to the resulting discriminant scores by using the maximum likelihood estimation routine of ROCKIT (Version 1.1B2, University of Chicago, Chicago, Ill).49 Classification performance was assessed by computing the area under the curve (AUC) from ROCKIT.
Sample size calculations
For the validation study, sample size calculations were performed a priori using G*Power50 (Version 3, Heinrich-Heine-University, Dusseldorf, Germany) based on the results of our previous studies,42 assuming a significance level of 0.05, power of 0.80, and equal group sizes. These calculations estimated that a total of 9–27 pancreas cases were needed depending on the choice of parameter. Post hoc power calculations using the same software indicated that the actual power achieved was greater than 0.82 for all spectral parameters with significant differences between groups.
Results
Table 1 provide a summary of the mean values over each ROI for each spectral parameter, comparing NP with the diseased pancreas (DP = CP and PC) cases. T-tests indicated that NP differed significantly from DP for midband fit, intercept, and RMS deviation. The midband fit and intercept were higher (less negative) on average for NP than DP, while the RMS deviation was less for NP than for DP. Table 2 shows the mean values of the spectral parameters comparing the PC with the CP cases. Again, the T-tests showed that PC differed significantly from CP for midband fit, intercept, and RMS deviation.
Table 1. Descriptive statistics and hypothesis testing results comparing normal and diseased pancreas (pancreatic cancer and chronic pancreatitis) data.
Column 1: Spectral parameters. Column 2–3: Means and standard deviations of spectral parameters averaged over the regions of interest. Row 3: The p-values resulting from Student's T-test assuming equal variance between groups unless otherwise noted.
| Mean Parameter | Normal Pancreas (n = 11) | Diseased Pancreas (n = 30) | T-test p-value |
|---|---|---|---|
| Midband Fit [dB] | −53.2 (8.9) | −63.5 (9.0) | 0.002 |
| Slope [dB/MHz] | 0.085 (0.56) | 0.040 (0.60) | 0.83 |
| Intercept [dB] | −53.6 (10.7) | −63.7 (9.3) | 0.005 |
| Corr. Coefficient R2 | 0.36 (0.10) | 0.34 (0.08) | 0.52 |
| RMS Deviation [dB] | 4.08 (0.29) | 4.65 (0.72) | < 0.001a |
T-test assumes unequal variances because Levene's test indicates p < 0.05.
Table 2. Descriptive statistics and hypothesis testing results comparing pancreatic cancer and chronic pancreatitis data.
Column 1: Spectral parameters. Column 2–3: Means and standard deviations of spectral parameters averaged over the regions of interest. Row 3: The p-values resulting from Student's T-test assuming equal variance between groups unless otherwise noted.
| Mean Parameter | Chronic Pancreatitis (n = 15) | Pancreatic Cancer (n = 15) | T-test p-value |
|---|---|---|---|
| Midband Fit [dB] | −58.3 (9.0) | −68.6 (5.5) | < 0.001 |
| Slope [dB/MHz] | −0.075 (0.56) | 0.15 (0.64) | 0.31 |
| Intercept [dB] | −57.9 (8.9) | −69.5 (5.1) | < 0.001 |
| Corr. Coefficient R2 | 0.36 (0.09) | 0.31 (0.05) | 0.12a |
| RMS Deviation [dB] | 4.28 (0.68) | 5.01 (0.56) | 0.003b |
T-test assumes unequal variances because Levene's test indicates p < 0.05.
Normality assumption may be violated for chronic pancreatitis data as the Shaprio-Wilk statistic has p < 0.05. However, a nonparametric Mann-Whitney U test still indicates a significant result with p < 0.001.
LDA was performed to classify the data between the PC and CP classes using midband fit and RMS deviation and leave-one-out cross-validation with the results shown in Table 3. The canonical discriminant function coefficients were 0.101 for the midband fit and −0.496 for the RMS deviation with a constant value of 8.74. (The use of intercept and RMS deviation or intercept and midband fit gave comparable or worse results.) With the malignant outcome considered a “positive” test result, the classification had sensitivity of 80%, specificity of 87%, positive predictive value of 86%, negative predictive value of 81%, and overall accuracy of 83%. Figure 3A shows the scatterplot of the PC and CP data along with the dividing line between these cases according to the LDA, while Fig. 3B shows the corresponding binormal estimate of the ROC curve with AUC of 0.83.
Table 3. Classification results from linear discriminant analysis of pancreas data into pancreatic cancer (PC) and chronic pancreatitis (CP) groups.
Classification was performed using midband fit and RMS deviation as independent variables, and the reported values used “leave one out” cross-validation. Rows 1–2: Classification results using counts. Rows 3–4: Classification results using percentages. The overall accuracy of classification was 83%. (See Figure 3 for the corresponding scatterplot and ROC curve.)
| Tissue State | Predicted State | |||
|---|---|---|---|---|
|
| ||||
| PC | CP | Total | ||
| Count | PC | 12 | 3 | 15 |
| CP | 2 | 13 | 15 | |
| % | PC | 80.0 | 20.0 | 100 |
| CP | 13.3 | 86.7 | 100 | |
Figure 3. Linear discriminant analysis and receiver operating characteristic (ROC) curve for the diseased pancreas data.
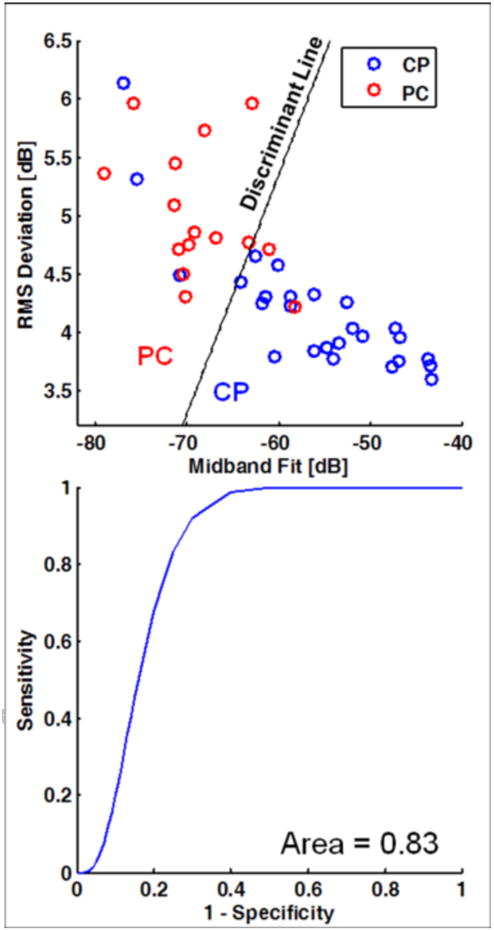
(A) Scatterplot of data with coordinates given by midband fit and RMS deviation. The dividing lines for the classification of pancreatic cancer (PC) vs. chronic pancreatitis (CP) are based on linear discriminant analysis. (B) Corresponding binormal maximum likelihood estimate of the ROC curve. The area under the curve is 0.83. (See Table 3 for the corresponding classification matrix.)
Discussion
In this study, we have demonstrated the ability of spectrum analysis of EUS backscattered RF signals acquired from electronic-array echoendoscopes to distinguish between chronic pancreatitis and pancreatic cancer. Many EUS systems in clinical use today use echoendoscopes with electronically controlled transducer arrays. These systems are often preferred because of their higher frame rates, a wider range of adjustable focal depths on transmission, and improved image quality using dynamic focusing on reception of the backscattered signals from tissue. Hence it is encouraging to see that similar or better results can be obtained using this more prevalent endoscopic imaging technology. While the current results were obtained for a particular set of electronic-array echoendoscopes, the method is applicable to any system where the RF data is available and appropriate calibration is performed.
In our previous studies with single-element echoendoscopes,41,42 we reported that midband fit and correlation coefficient R2 were useful for discriminating between CP and PC with PC having lower midband fit and correlation coefficient with sensitivity of 85%, specificity of 71%, and overall accuracy of 85% using all data from both studies.42 The current study found that midband fit, intercept, and RMS deviation were the parameters that showed the most significant differences between the tissue states with sensitivity of 80%, specificity of 87%, overall accuracy of 83%, and ROC AUC of 0.83. Hence in both the current and previous studies, midband fit and a measure of spectrum nonlinearity were useful, and the current study gave comparable results. One additional difference between our previous and current studies that may account for the improved result is that the effects of signal attenuation were approximately compensated for in the current study, an effect that may be important when imaging pancreas tissue at larger depths. Finally, we note that our results are consistent with a recently-reported study using the same EUS system which demonstrated that midband fit and intercept could be used to distinguish between CP and PC, with PC showing reduced midband fit and intercept as compared to CP.51
Spectrum analysis of backscattered RF ultrasound signals brings added value to B-mode images because the RF signals have been shown to be sensitive to microstructural scatterer properties (e.g., size, concentration, acoustic impedance), which may have dimensions that are beyond the normal resolution of the grayscale B-mode image. In addition, the use of calibrated spectra removes the effect of instrument settings and operator interpretation and thereby allows for more objective, quantitative analysis of the imaging data. Based on the current results, the reduction in midband fit and intercept without significant change in the slope observed in pancreatic cancer suggests that changes in scatterer concentration and acoustic impedance may be more significant than those due to scatterer size.52,53 However, this interpretation should be made with care as the traditional theoretical framework for relating spectral backscatter parameters to microstructural properties is based on the assumption of single-element transducer.19
Additional work will be useful to address the limitations of this study. Because histological results were only available for cases with suspected malignancy (PC), the benign cases had to be inferred from other more indirect clinical and “classic” EUS diagnosis criteria. As such, the study only included fairly well-defined cases, and additional work is needed to assess the utility of the approach in more ambiguous situations. Ex vivo scanning of resected tissue could be useful for better explaining the microstructural origin of the observed changes in the spectral parameters. Second, theoretical formulation of spectrum analysis of RF data from array transducers is needed to provide better interpretation of spectral parameters, because array transducers usually have no axis symmetry for the ultrasound beam, unlike single element transducers. Third, the modest sample size precluded the use of additional criteria (e.g., texture or morphological parameters) with more sophisticated classification methods (e.g., support vector machines) that could result in an improved ability to discriminate between tissue states. Finally, the spatial averaging inherent in the ROI method limits the spatial resolution over which the spectral parameters can be computed. As suggested in a previous pilot study,41 the use of higher frequency modes available in some echoendoscopes (up to 10 MHz in the endoscopes in this study) could improve resolution and provide wider bandwidth for spectrum analysis, provided that the RF signals are not decreased severely by attenuation. The use of multiple frequency modes would necessitate additional calibration measurements.
Conclusion
This study shows that spectral analysis of the EUS RF backscatter signals from radial and curvilinear electronic-array echoendoscopes can discriminate between chronic pancreatitis and pancreatic cancer in vivo. Significant differences were observed between tissue states using the mean midband fit, intercept, and RMS deviation parameters with classification accuracy of 83% for chronic pancreatitis vs. pancreatic cancer (ROC AUC = 0.83). With further development, this method may prove useful for providing real-time “digitally-stained” images with coloration corresponding to the probability of various normal or disease states, thereby providing endoscopists with more timely and improved accuracy of diagnosis with EUS.
Acknowledgments
The authors would like to acknowledge Olympus for making the RF data available and providing technical information about the EU-ME1 system. We would also like to thank Brian Wolf for his technical assistance with the system.
Grant support: This work was supported by University Hospitals Case Medical Center and the University of Michigan. Amitabh Chak was supported by a K24 Midcareer Award in Patient Oriented Research, National Institutes of Health (Grant DK002800).
Acronyms
- AUC
Area under the curve
- CP
Chronic pancreatitis
- EGD
Esophagogastroduodenoscopy
- EUS
Endoscopic ultrasound
- FFT
Fast Fourier transform
- FNA
Fine needle aspiration
- LDA
Linear discriminant analysis
- NP
Normal pancreas
- PC
Pancreatic cancer
- RF
Radio frequency
- ROC
Receiver operating characteristic
- ROI
Region of interest
Footnotes
Institutions participating in the study: Division of Gastroenterology, University Hospitals Case Medical Center, Case Western Reserve University, Cleveland, Ohio, USA
Meeting presentations: A preliminary description of this study was presented at Digestive Disease Week 2010, New Orleans, Louisiana, 1–5 May 2010 [abstract: Kumon et al., Gastrointest Endosc 2010;71:AB120–121].
Publisher's Disclaimer: This is a PDF file of an unedited manuscript that has been accepted for publication. As a service to our customers we are providing this early version of the manuscript. The manuscript will undergo copyediting, typesetting, and review of the resulting proof before it is published in its final citable form. Please note that during the production process errors may be discovered which could affect the content, and all legal disclaimers that apply to the journal pertain.
References
- 1.Rosch T, Lorenz R, Braig C, et al. Endoscopic ultrasound in pancreatic tumor-diagnosis. Gastrointest Endosc. 1991;37:347–52. doi: 10.1016/s0016-5107(91)70729-3. [DOI] [PubMed] [Google Scholar]
- 2.Rosch T, Braig C, Gain T, et al. Staging of pancreatic and ampullary carcinoma by endoscopic ultrasonography - comparison with conventional sonography, computed-tomography, and angiography. Gastroenterology. 1992;102:188–99. doi: 10.1016/0016-5085(92)91800-j. [DOI] [PubMed] [Google Scholar]
- 3.Palazzo L, Roseau G, Gayet B, et al. Endoscopic ultrasonography in the diagnosis and staging of pancreatic adenocarcinoma - results of a prospective-study with comparison to ultrasonography and CT scan. Endoscopy. 1993;25:143–50. doi: 10.1055/s-2007-1010273. [DOI] [PubMed] [Google Scholar]
- 4.Gress FG, Hawes RH, Savides TJ, et al. Role of EUS in the preoperative staging of pancreatic cancer: a large single-center experience. Gastrointest Endosc. 1999;50:786–91. doi: 10.1016/s0016-5107(99)70159-8. [DOI] [PubMed] [Google Scholar]
- 5.Midwinter MJ, Beveridge CJ, Wilsdon JB, et al. Correlation between spiral computed tomography, endoscopic ultrasonography and findings at operation in pancreatic and ampullary tumours. Brit J Surg. 1999;86:189–93. doi: 10.1046/j.1365-2168.1999.01042.x. [DOI] [PubMed] [Google Scholar]
- 6.Mertz HR, Sechopoulos P, Delbeke D, et al. EUS, PET, and CT scanning for evaluation of pancreatic adenocarcinoma. Gastrointest Endosc. 2000;52:367–71. doi: 10.1067/mge.2000.107727. [DOI] [PubMed] [Google Scholar]
- 7.Rivadeneira DE, Pochapin M, Grobmyer SR, et al. Comparison of linear array endoscopic ultrasound and helical computed tomography for the staging of periampullary malignancies. Ann Surg Oncol. 2003;10:890–7. doi: 10.1245/aso.2003.03.555. [DOI] [PubMed] [Google Scholar]
- 8.Bhutani MS, Gress FG, Giovannini M, et al. The No Endosonographic Detection of Tumor (NEST) Study: a case series of pancreatic cancers missed on endoscopic ultrasonography. Endoscopy. 2004;36:385–9. doi: 10.1055/s-2004-814320. [DOI] [PubMed] [Google Scholar]
- 9.Catanzaro A, Richardson S, Veloso H, et al. Long-term follow-up of patients with clinically indeterminate suspicion of pancreatic cancer and normal EUS. Gastrointest Endosc. 2003;58:836–40. doi: 10.1016/s0016-5107(03)02301-0. [DOI] [PubMed] [Google Scholar]
- 10.Chong AK, Hawes RH, Hoffman BJ, et al. Diagnostic performance of EUS for chronic pancreatitis: a comparison with histopathology. Gastrointest Endosc. 2007;65:808–14. doi: 10.1016/j.gie.2006.09.026. [DOI] [PubMed] [Google Scholar]
- 11.Ardengh JC, Lopes CV, Campos AD, et al. Endoscopic ultrasound and fine needle aspiration in chronic pancreatitis: differential diagnosis between pseudotumoral masses and pancreatic cancer. J Pancreas (Online) 2007;8:413–21. [PubMed] [Google Scholar]
- 12.Gardner TB, Gordon SR. Interobserver agreement for pancreatic endoscopic ultrasonography determined by same day back-to-back examinations. J Clin Gastroenterol. 2011 doi: 10.1097/MCG.0b013e3181f42d69. [DOI] [PubMed] [Google Scholar]
- 13.Topazian M, Enders F, Kimmey M, et al. Interobserver agreement for EUS findings in familial pancreatic-cancer kindreds. Gastrointest Endosc. 2007;66:62–7. doi: 10.1016/j.gie.2006.09.018. [DOI] [PubMed] [Google Scholar]
- 14.Savides TJ, Donohue M, Hunt G, et al. EUS-guided FNA diagnostic yield of malignancy in solid pancreatic masses: a benchmark for quality performance measurement. Gastrointest Endosc. 2007;66:277–82. doi: 10.1016/j.gie.2007.01.017. [DOI] [PubMed] [Google Scholar]
- 15.Das A, Nguyen CC, Li F, et al. Digital image analysis of EUS images accurately differentiates pancreatic cancer from chronic pancreatitis and normal tissue. Gastrointest Endosc. 2008;67:861–7. doi: 10.1016/j.gie.2007.08.036. [DOI] [PubMed] [Google Scholar]
- 16.Zhang MM, Yang H, Jin ZD, et al. Differential diagnosis of pancreatic cancer from normal tissue with digital imaging processing and pattern recognition based on a support vector machine of EUS images. Gastrointest Endosc. 2010;72:978–85. doi: 10.1016/j.gie.2010.06.042. [DOI] [PubMed] [Google Scholar]
- 17.Iglesias-Garcia J, Larino-Noia J, Abdulkader I, et al. Quantitative endoscopic ultrasound elastography: An accurate method for the differentiation of solid pancreatic masses. Gastroenterology. 2010;139:1172–80. doi: 10.1053/j.gastro.2010.06.059. [DOI] [PubMed] [Google Scholar]
- 18.Janssen J, Schlorer E, Greiner L. EUS elastography of the pancreas: feasibility and pattern description of the normal pancreas, chronic pancreatitis, and focal pancreatic lesions. Gastrointest Endosc. 2007;65:971–8. doi: 10.1016/j.gie.2006.12.057. [DOI] [PubMed] [Google Scholar]
- 19.Lizzi FL, Greenebaum M, Feleppa EJ, et al. Theoretical framework for spectrum analysis in ultrasonic tissue characterization. J Acoust Soc Am. 1983;73:1366–73. doi: 10.1121/1.389241. [DOI] [PubMed] [Google Scholar]
- 20.Lizzi FL, Ostromogilsky M, Feleppa EJ, et al. Relationship of ultrasonic spectral parameters to features of tissue microstructure. IEEE Trans Ultrason Ferroelectr Freq Control. 1987;34:319–29. doi: 10.1109/t-uffc.1987.26950. [DOI] [PubMed] [Google Scholar]
- 21.Insana MF, Brown DG. Acoustic scattering theory applied to soft biological tissues. In: Shung KK, editor. Ultrasonic scattering in biological tissues. Boca Raton, FL: CRC Press; 1993. pp. 75–124. [Google Scholar]
- 22.Insana MF, Hall TJ, Cook LT. Backscatter coefficient estimation using array transducers. IEEE Trans Ultrason Ferroelectr Freq Control. 1994;41:714–23. doi: 10.1109/58.308508. [DOI] [PubMed] [Google Scholar]
- 23.Lizzi FL, Feleppa EJ, Alam SK, et al. Ultrasonic spectrum analysis for tissue evaluation. Pattern Recog Lett. 2003;24:637–58. [Google Scholar]
- 24.Feleppa EJ, Liu T, Kalisz A, et al. Ultrasonic spectral-parameter imaging of the prostate. Int J Imaging Sys Tech. 1997;8:11–25. [Google Scholar]
- 25.Scheipers U, Ermert H, Sommerfeld HJ, et al. Ultrasonic multifeature tissue characterization for prostate diagnostics. Ultrasound Med Biol. 2003;29:1137–49. doi: 10.1016/s0301-5629(03)00062-0. [DOI] [PubMed] [Google Scholar]
- 26.Feleppa EJ, Mamou J, Porter CR, et al. Quantitative ultrasound in cancer imaging. Semin Oncol. 2011;38:136–50. doi: 10.1053/j.seminoncol.2010.11.006. [DOI] [PMC free article] [PubMed] [Google Scholar]
- 27.Golub RM, Parsons RE, Sigel B, et al. Differentiation of breast tumors by ultrasonic tissue characterization. J Ultrasound Med. 1993;12:601–8. doi: 10.7863/jum.1993.12.10.601. [DOI] [PubMed] [Google Scholar]
- 28.Silverman RH, Folberg R, Rondeau MJ, et al. Spectral parameter imaging for detection of prognostically significant histologic features in uveal melanoma. Ultrasound Med Biol. 2003;29:951–9. doi: 10.1016/s0301-5629(03)00907-4. [DOI] [PubMed] [Google Scholar]
- 29.Tateishi T, Machi J, Feleppa EJ, et al. In vitro diagnosis of axillary lymph node metastases in breast cancer by spectrum analysis of radio frequency echo signals. Ultrasound Med Biol. 1998;24:1151–9. doi: 10.1016/s0301-5629(98)00100-8. [DOI] [PubMed] [Google Scholar]
- 30.Noritomi T, Machi J, Feleppa EJ, et al. In vitro investigation of lymph node metastasis of colorectal cancer using ultrasonic spectral parameters. Ultrasound Med Biol. 1998;24:235–43. doi: 10.1016/s0301-5629(97)00274-3. [DOI] [PubMed] [Google Scholar]
- 31.Tateishi T, Machi J, Feleppa EJ, et al. In vitro investigation of detectability of colorectal lymph nodes and diagnosis of lymph node metastasis in colorectal cancer using B-mode sonography. J Clin Ultrasound. 2004;32:1–7. doi: 10.1002/jcu.10210. [DOI] [PubMed] [Google Scholar]
- 32.Mamou J, Coron A, Hata M, et al. Three-dimensional high-frequency characterization of cancerous lymph nodes. Ultrasound Med Biol. 2010;36:361–75. doi: 10.1016/j.ultrasmedbio.2009.10.007. [DOI] [PMC free article] [PubMed] [Google Scholar]
- 33.Mamou J, Coron A, Oelze ML, et al. Three-dimensional high-frequency backscatter and envelope quantification of cancerous human lymph nodes. Ultrasound Med Biol. 2011;37:345–57. doi: 10.1016/j.ultrasmedbio.2010.11.020. [DOI] [PMC free article] [PubMed] [Google Scholar]
- 34.King DL, Lizzi FL, Feleppa EJ, et al. Focal and diffuse liver disease studied by quantitative microstructural sonography. Radiology. 1985;155:457–62. doi: 10.1148/radiology.155.2.2984720. [DOI] [PubMed] [Google Scholar]
- 35.Nasu K, Tsuchikane E, Katoh O, et al. Accuracy of in vivo coronary plaque morphology assessment: a validation study of in vivo virtual histology compared with in vitro histopathology. J Am Coll Cardiol. 2006;47:2405–12. doi: 10.1016/j.jacc.2006.02.044. [DOI] [PubMed] [Google Scholar]
- 36.Lizzi FL, Astor M, Liu T, et al. Ultrasonic spectrum analysis for tissue assays and therapy evaluation. Int J Imaging Sys Tech. 1997;8:3–10. [Google Scholar]
- 37.Siebers S, Schwabe M, Scheipers U, et al. Evaluation of ultrasonic texture and spectral parameters for coagulated tissue characterization. In: Yuhas MP, editor. 2004 IEEE Ultrason Symp Proc; 2004 Aug 24-27; Montreal, Canada. Piscataway, NJ: IEEE; 2005. pp. 1804–7. [Google Scholar]
- 38.Silverman RH, Muratore R, Ketterling JA, et al. Improved visualization of high-intensity focused ultrasound lesions. Ultrasound Med Biol. 2006;32:1743–51. doi: 10.1016/j.ultrasmedbio.2006.05.012. [DOI] [PMC free article] [PubMed] [Google Scholar]
- 39.Feleppa EJ, Ennis RD, Schiff PB, et al. Spectrum-analysis and neural networks for imaging to detect and treat prostate cancer. Ultrason Imaging. 2001;23:135–46. doi: 10.1177/016173460102300301. [DOI] [PubMed] [Google Scholar]
- 40.Oelze ML, O'Brien WD, Jr, Blue JP, et al. Differentiation and characterization of rat mammary fibroadenomas and 4T1 mouse carcinomas using quantitative ultrasound imaging. IEEE Trans Med Imaging. 2004;23:764–71. doi: 10.1109/tmi.2004.826953. [DOI] [PubMed] [Google Scholar]
- 41.Kumon RE, Olowe K, Faulx AL, et al. EUS spectrum analysis for in vivo characterization of pancreatic and lymph node tissue: a pilot study. Gastrointest Endosc. 2007;66:1096–106. doi: 10.1016/j.gie.2007.05.052. [DOI] [PubMed] [Google Scholar]
- 42.Kumon RE, Pollack MJ, Faulx AL, et al. In vivo characterization of pancreatic and lymph node tissue by using EUS spectrum analysis: a validation study. Gastrointest Endosc. 2010;71:53–63. doi: 10.1016/j.gie.2009.08.027. [DOI] [PMC free article] [PubMed] [Google Scholar]
- 43.Niwa K, Hirooka Y, Niwa Y, et al. Comparison of image quality between electronic and mechanical radial scanning echoendoscopes in pancreatic diseases. J Gastroen Hepatol. 2004;19:454–9. doi: 10.1111/j.1440-1746.2003.03317.x. [DOI] [PubMed] [Google Scholar]
- 44.Papanikolaou IS, Delicha EM, Adler A, et al. Prospective, randomized comparison of mechanical and electronic radial endoscopic ultrasound systems: Assessment of performance parameters and image quality. Scand J Gastroentero. 2009;44:93–9. doi: 10.1080/00365520802400859. [DOI] [PubMed] [Google Scholar]
- 45.Catalano MF, Sahai A, Levy M, et al. EUS-based criteria for the diagnosis of chronic pancreatitis: the Rosemont classification. Gastrointest Endosc. 2009;69:1251–61. doi: 10.1016/j.gie.2008.07.043. [DOI] [PubMed] [Google Scholar]
- 46.Harris FJ. Use of windows for harmonic-analysis with discrete Fourier-transform. P IEEE. 1978;66:51–83. [Google Scholar]
- 47.Press WH, Flannery BP, Teukolsky SA, et al. Numerical Recipes in FORTRAN: The Art of Scientific Computing. New York, NY: Cambridge University Press; 1992. [Google Scholar]
- 48.D'astous FT, Foster FS. Frequency-dependence of ultrasound attenuation and backscatter in breast-tissue. Ultrasound Med Biol. 1986;12:795–808. doi: 10.1016/0301-5629(86)90077-3. [DOI] [PubMed] [Google Scholar]
- 49.University of Chicago. Receiver Operating Characteristic program software downloads. http://xray.bsd.uchicago.edu/krl/KRL_ROC/software_index.htm.
- 50.Faul F, Erdfelder E, Lang AG, et al. G*Power 3: a flexible statistical power analysis program for the social, behavioral, and biomedical sciences. Behav Res Methods. 2007;39:175–91. doi: 10.3758/bf03193146. [DOI] [PubMed] [Google Scholar]
- 51.Irisawa A, Takagi T, Ikeda T, et al. A new EUS imaging diagnosis for pancreatic cancer: A pilot Study of differential diagnosis between chronic pancreatitis and pancreatic cancer based on the quantitative analysis with new technology using raw image. Gastrointest Endosc. 2011;73:AB144. [Google Scholar]
- 52.Lizzi FL, Astor M, Kalisz A, et al. Ultrasonic spectrum analysis for assays of different scatterer morphologies: Theory and very-high frequency results. In: Levy M, Schneider SC, McAvoy BR, editors. 1996 IEEE Ultrason Symp; 1996 Nov 3-6; San Antonio, Texas, USA. Piscataway, NJ: IEEE; pp. 1155–9. [Google Scholar]
- 53.Lizzi FL. Ultrasonic scatterer-property images of the eye and prostate. In: Schneider SC, Levy M, McAvoy BR, editors. 1997 IEEE Ultrason Symp; 1997 Oct 5-8; Toronto, Canada. Piscataway, NJ: IEEE; 1998. pp. 1109–16. [Google Scholar]


