

Abstract
DNA methylation is essential in mammalian development. We have hypothesized that methylation differences induced by trisomy 21 (T21) contribute to the phenotypic characteristics and heterogeneity in Down syndrome (DS). In order to determine the methylation differences in T21 without interference of the interindividual genomic variation, we have used fetal skin fibroblasts from monozygotic (MZ) twins discordant for T21. We also used skin fibroblasts from MZ twins concordant for T21, normal MZ twins without T21, and unrelated normal and T21 individuals. Reduced Representation Bisulfite Sequencing (RRBS) revealed 35 differentially methylated promoter regions (DMRs) (Absolute methylation differences = 25%, FDR < 0.001) in MZ twins discordant for T21 that have also been observed in comparison between unrelated normal and T21 individuals. The identified DMRs are enriched for genes involved in embryonic organ morphogenesis (FDR = 1.60 e -03) and include genes of the HOXB and HOXD clusters. These DMRs are maintained in iPS cells generated from this twin pair and are correlated with the gene expression changes. We have also observed an increase in DNA methylation level in the T21 methylome compared to the normal euploid methylome. This observation is concordant with the up regulation of DNA methyltransferase enzymes (DNMT3B and DNMT3L) and down regulation of DNA demethylation enzymes (TET2 and TET3) observed in the iPSC of the T21 versus normal twin. Altogether, the results of this study highlight the epigenetic effects of the extra chromosome 21 in T21 on loci outside of this chromosome that are relevant to DS associated phenotypes.
Introduction
Genomic aneuploidy is a common cause of human genetic disorders that often results in dysregulation of gene expression patterns. A classic example of genomic aneuploidy is trisomy 21 (T21), which results to a collection of phenotypes known as Down syndrome (DS)[1]. Using monozygotic (MZ) twins discordant for T21, we have recently shown that the differential expression in T21 is organized in gene expression dysregulation domains (GEDDs) across the genome [2]. The DS associated phenotypes can be the result of the extra chromosomal material per se, or specific genes on chromosome 21. Some of the DS phenotypes (e.g., cognitive impairment) are consistently present in all DS individuals, while others show incomplete penetrance [1]. For the variable phenotypes with incomplete penetrance allele specific trisomy may be involved. In accordance with this hypothesis, we have reported the association of chromosome 21 SNPs and CNVs with an increased risk of congenital heart defect (CHD) in DS [3]. Alternatively, the variability of the phenotypes or the severity of the syndrome may be due to changes of the epigenetic landscape. Indeed, epigenetic alterations are known to contribute to human health and diseases [4–8]. Epigenetic modifications may also explain why MZ twins are not always phenotypically identical [9]. DNA methylation is among the best-studied epigenetic modifications thus far [8]. Potentially, DNA methylation could be involved in the response to gene dosage imbalances, for example in the case of aneuploidies. However, it is unclear if specific epigenetic events are needed for the development of DS phenotypes. There have been a few studies investigating the DNA methylation states in DS. In 2009, Zhang et al investigated chromosome 21 genes in DS and non-DS cells, and have found differences in promoter methylation of chromosome 21 genes [10]. Moreover, Kerkel et al., investigated DNA methylation profiling of 27,000 CpGs genome-wide using methylation arrays in peripheral blood leukocytes and T lymphocytes and reported gene specific abnormalities of CpG methylation in DS cases [11]. Although the number of CpGs investigated in this study (27,000 CpGs) is only a small fraction of CpGs, the results highlighted the importance of studying DNA methylation in aneuploid cases on a larger scale. Furthermore, Jin et al., investigated DNA methylation alterations associated with DS, in placenta villi of 11 DS cases and 6 normal controls [12], and identified genes with differential DNA methylation. However, it is not clear if these observations are specific to T21, or the results of the interindividual variability [13].
In the present study we hypothesized that there are epigenetic modifications in T21 that could potentially be linked to DS associated phenotypes. We applied Reduced Representation Bisulphite Sequencing (RRBS) to profile DNA methylation changes in a pair of rare MZ twins discordant for T21 [2,14] and two pairs of rare MZ twins concordant for trisomy 21, but discordant for CHD. We also studied two pairs of unaffected MZ twins without T21, as well as unrelated normal and T21 cases as controls. In addition, we have used iPS cells generated from MZ twins discordant for T21 to determine whether changes in DNA methylation in T21 are maintained during reprogramming. The results of this study identified epigenetic changes in genes involved in embryonic organ morphogenesis in MZ twins discordant for T21, and genes with potential involvement in heart development in T21 MZ twins discordant for CHD.
Material and Methods
Description of samples
Primary fetal fibroblasts from the MZ twins discordant for T21 were derived from skin tissue collected post mortem (Table 1, samples 1, 2, 3 and 4) [2,14]. Primary skin fibroblasts were also obtained from a pair of MZ twins concordant for T21, but discordant for CHD (VSD, ventricular septal defect in particular) (Table 1, samples 5 and 6). Informed consent was obtained for all these twin samples, and the Geneva University Ethics Committee approved the study. Additionally, we used amniocytes from a pair of MZ twins concordant for T21, but discordant for CHD (AVSD, Atrio Ventricular Septal Defect) (Table 1, samples 7 and 8). This twin set was obtained from Institut mère-enfant Alix de Champagne in France [15]. Moreover, primary fibroblasts from two pairs of healthy unaffected MZ twins (both normal euploid twins) have been used (Table 1, samples 9, 10, 11, and 12). Samples 9 and 10 have been obtained from the Geneva GenCord project [13], and samples 11 and 12 have been obtained from the TwinsUK resource (http://www.twinsuk.ac.uk) at the King's College London. The primary fibroblasts from unrelated T21 and normal individuals were taken from Prandini et al [16]. In addition to these samples, we also studied induced pluripotent stem cells (iPS) generated from the fetal skin fibroblasts of the MZ twins discordant for T21 [17] (Table 1, samples 15, 16 and 17). Table 1 shows the description of the samples used in this study.
Table 1. Description of samples used for DNA methylation analyses.
| Sample set | Sample ID | Gender | Description | Age* | Passage |
|---|---|---|---|---|---|
| MZ twins discordant for T21 (Replicate 1) | Sample 1 | Female | Normal primary fetal skin fibroblasts | 13 WG | P13 |
| MZ twins discordant for T21 (Replicate 1) | Sample 2 | Female | T21 primary fetal skin fibroblasts | 13 WG | P13 |
| MZ twins discordant for T21 (Replicate 2) | Sample 3 | Female | Normal primary fetal skin fibroblasts | 13 WG | P13 |
| MZ twins discordant for T21 (Replicate 2) | Sample 4 | Female | T21 primary fetal skin fibroblasts | 13 WG | P13 |
| T21 MZ twins discordant for VSD | Sample 5 | Male | T21 with VSD primary skin fibroblasts | 4 years | P5 |
| T21 MZ twins discordant for VSD | Sample 6 | Male | T21 without VSD primary skin fibroblasts | 4 years | P5 |
| T21 MZ twins discordant for AVSD | Sample 7 | Male | T21 with AVSD amniocytes | 17 WG | NA |
| T21 MZ twins discordant for AVSD | Sample 8 | Male | T21 without AVSD amniocytes | 17 WG | NA |
| Normal MZ twins pair 1 | Sample 9 | Female | Normal primary fetal skin fibroblasts | Fetal | P5 |
| Normal MZ twins pair 1 | Sample 10 | Male | Normal primary fetal skin fibroblasts | Fetal | P5 |
| Normal MZ twins pair 2 | Sample 11 | Female | Normal primary skin fibroblasts | 53 years | P8 |
| Normal MZ twins pair 2 | Sample 12 | Female | Normal primary skin fibroblasts | 53 years | P9 |
| Unrelated normal and T21 | Sample 13 | Female | T21 primary skin fibroblasts | 3 days | P14 |
| Unrelated normal and T21 | Sample 14 | Female | Normal primary skin fibroblasts | 2 days | P14 |
| MZ twins discordant for T21 iPS cells | Sample 15 | Female | Normal iPS cells | 13 WG | P10 |
| MZ twins discordant for T21 iPS cells | Sample 16 | Female | T21 iPS cells | 13 WG | P10 |
| MZ twins discordant for T21 iPS cells | Sample 17 | Female | T21 iPS cells | 13 WG | P10 |
*WG, Weeks of Gestation.
NA, Not Applicable
Cell culture
All the primary fibroblast cells were grown in DMEM GlutaMAX media (Life Technologies) enriched with 10% fetal bovine serum (FBS) (Life Technologies) and 1% penicillin/streptomycin/fungizone mix (Amimed, BioConcept) at 37°C in a 5% CO2 incubator. All the iPS cells were grown as previously described [17].
DNA extraction was performed using Qiagen DNeasy Blood and Tissue Kit from the primary skin fibroblast cells. Total RNA was extracted using the TRIzol reagent (Life Technologies) according to the manufacturer’s instructions. RNA quality was checked on the Agilent 2100 Bioanalyzer and quantity was measured on a Qubit instrument (Life Technologies).
RRBS library preparation and sequencing
We prepared RRBS libraries according to Gu H et al., with some modifications [18]. Briefly, 2 μg of genomic DNA was digested overnight at 37°C with 2 μl 20U/μl MspI and 5μl NEB4 (New England Biolabs Inc.) in a total reaction volume of 50 μl, followed by heat inactivation at 80°C for 20 minutes. Subsequently the end repair and A tailing were performed by adding 2 μl dNTP mix (10mM), 2 μl 5U/ μl Klenow fragment (New England Biolabs Inc.), and 4μl of NEB2 (New England Biolabs Inc.) in a total reaction volume of 40 μl. This reaction was incubated at 30°C for 20 minutes, followed by 20°C for 37 minutes. Heat inactivation was performed at 75°C for 20 minutes. The end-repaired and A tailed molecules were ligated to the methylated version of the Illumina adapters; ilAdap Methyl PE1: ACACTCTTTCCCTACACGACGCTCTTCCGATC*T (all C’s are methylated, * = phosphorothioate bond) and ilAdap Methyl PE2: GATCGGAAGAGCGGTTCAGCAGGAATGCCGA*G (all C’s are methylated, 5’ phosphate, * = phosphorothioate bond). The ligation was done using 1μl T4 DNA ligase (2,000 U/μl) (New England Biolabs Inc.), 2μl T4 ligase buffer (10X) (New England Biolabs Inc.), and 1μl methylated adapters (paired end adapters)(15 μM) in a total reaction volume of 20μl. The reaction was incubated in a thermocycler at 16°C overnight. The adapter ligated DNA was then purified by phenol extraction and ethanol precipitation and dissolved in 15 μl EB buffer. Size selection of the adapter ligated DNA fragments (170 bp to 350 bp) was done by electrophoresing the 15 μl ligation reaction in a 2.5% NuSieve GTG agarose gel (Lonza). We subsequently purified the DNA using a Qiagen Qiaquick Gel Extraction kit as described in the manufacturer’s instructions. We then used 20 μl of this purified DNA in the sodium bisulfite conversion step, which was performed using the QIAGEN Epitect Bisulfite Kit (Qiagen, Valencia CA, USA). The purified bisulfite treated DNA was then PCR amplified in a reaction containing 100 μl KAPA2G Robust DNA polymerase mixture (KAPA biosystems), 40μl bisulphite treated DNA, 0.5 mM ilPCR PE1 primer (AAT GAT ACG GCG ACC ACC GAG ATC TAC ACT CTT TCC CTA CAC GAC GCT CTT CCG ATC* T; * = phosphorothioate bond), 0.5 mM ilPCR PE2 primer (CAA GCA GAA GAC GGC ATA CGA GAT CGG TCT CGG CAT TCC TGC TGA ACC GCT CTT CCG ATC* T; * = phosphorothioate bond) in a total reaction volume of 200 μl. The PCR mixture were divided amongst eight PCR tubes, and were incubated at 95°C for 2 minutes, followed by 20 cycles of (95°C for 20 seconds and 65°C for 30 seconds and 72°C for 30 seconds), and finally 72°C for 7 minutes. The PCR products were pooled, and purified by adding 360 μl AMPure magnetic beads (Agencourt Bioscience, Beverly, MA). We quantified the purified product using the Qubit fluorometer (Invitrogen). We also checked the template size distribution of the library on Agilent Bioanalyzer (Agilent 2100 Bioanalyzer). We then diluted each library to 10 nM and proceeded to sequence each library (pair ended 100bp) in a single lane on the Illumina HiSeq 2000 according the manufacturer's instructions.
DNA methylation data processing
The quality of the reads were measured by FASTQC (version 0.10.1) program as implemented in the trime galore wrapper (http://www.bioinformatics.babraham.ac.uk). Low quality base calls were removed from the 3' end of the reads before trimming the adapter sequences. Our cut off for base quality control was Phred quality score of 20. Subsequently, Cutadapt detected and trimmed the adapter sequences from the 3’ end of reads. Bismark aligner [19] was used for mapping reads against the human genome hg19. For post data analyses purposes, we used an R library package methylKit [20] and custom scripts implemented in R and Python. We used the MethylKit package to calculate methylation percentages per each single CpG. Percent methylation values for CpG dinucleotides were calculated by dividing the number of methylated Cs by the total coverage on that base. CpGs with at least 20X read coverage and at least a Phred score threshold of 20 were retained for calling CpG methylation. We calculated DNA methylation state at single CpG sites and over genomic features such as promoters, CpG islands, and gene bodies (Exons and Introns).
DNA methylation level at single CpG sites and genomic regions
DNA methylation level was calculated for each sample both at single CpG sites and genomic regions. Genomic regions (GRCh37/hg19) include CpG islands, CpG shores (defined as 2000bp flanking regions on each side of the CpG island), promoters (defined as -2000bp, +1000bp around the TSS), and gene body (introns and exons), lamina associated domains (LADs), and regions between LAD domains (iLADs) [21]. For scoring DNA methylation in our analyses, each individual CpG was required to pass a minimum Phred base quality score of 20 and be covered at least by 20 reads. To score DNA methylation over a region, the region was required to contain at least three CpGs each covered by at least 20 reads.
RNA library preparation, sequencing and data processing
mRNA-seq data were prepared from 5μg of total RNA using the Illumina mRNA-Seq Sample Preparation kit (#RS-100-0801), according to the manufacturer’s instructions. One library per lane was sequenced on an Illumina HiSeq 2000 instrument (paired-end 100bp). Reads were uniquely mapped against the human genome (hg19) using the default parameters of the GEM aligner [22]. Quantile normalization was applied on the RPKM data (Reads Per Kilobase per Million). mRNA-Seq data for fibroblasts of MZ twins discordant for T21 (Samples 1, 2, 3 and 4) were taken from [2]. mRNA-seq data from iPS cells generated from MZ twins discordant for T21 fibroblasts (Samples 15, 16 and 17) were taken from [17].
Results
In this study we have used MZ twins to evaluate the role of the extra copy of chromosome 21 in epigenetic modifications related to T21. We applied RRBS to quantify DNA methylation at single CpG sites, and over genomic features.
The RRBS method used in this study routinely achieved a bisulfite conversion rate greater than 99.8% for all of the samples studied, as calculated by methylKit [20]. A summary of mapped reads using the BisMark aligner against the human reference genome (hg19) is presented in S1 Table. Two technical replicates for the MZ twins discordant for T21 (replicate 1 and replicate 2) from the same culture, but with independent bisulfite conversion and library preparation were produced. The overall DNA methylation correlation between the two technical replicates was 0.90 for the normal twin (Samples 1 and 3 of Table 1) and 0.91 for T21 twin (Samples 2 and 4 of Table 1) (S1 Fig).
Fig 1 shows the RRBS coverage of CpG sites in the MZ twins discordant for T21. A total of 2,598,760 CpGs (Phred base quality ≥ 20 and base read coverage ≥ 20) have been covered. That includes 70.7% of gene promoters, and 80.8% of CpG islands (Fig 1). Using the MZ twins discordant for T21 (samples 1, 2, 3 and 4 of Table 1) we observed a higher level of DNA methylation in the T21 twin compared to the normal twin. This has been observed both at the level of single CpG sites and the genomic features (Fig 2). Fig 2 shows the probability density distribution for methylation differences between the T21 and normal twin (Fig 2). The DNA methylation levels of promoters, introns, exons, CpG islands, CpG shores, LADs, and iLADs were determined, and the overall methylation levels were compared between MZ twins discordant for trisomy 21 using Mann–Whitney U test (Fig 2). There is a significant overall hyper-methylation for all the genomic features analyzed in T21 twin. However, the hyper-methylation of T21 twin compared to the normal twin is even more pronounced in promoters (p = 6.7e-48) and CpG islands (p = 1.9e-41) compared to other genomic regions (Fig 2).
Fig 1. CpGs Coverage of MZ-twins discordant for T21.
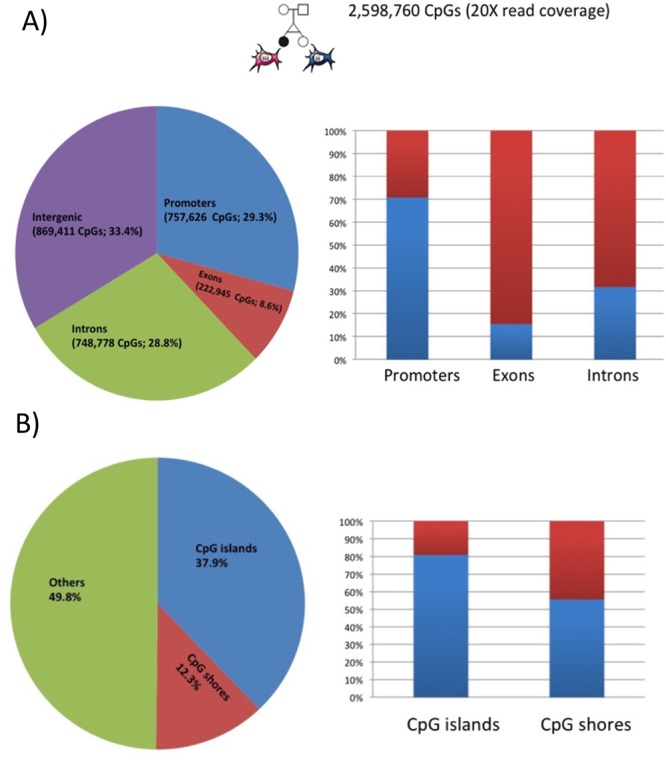
A) Distributions of covered CpGs (≥20X read coverage) by RRBS in promoters, exons, introns, and intergenic regions are shown in the pie chart. The blue bar in the histogram panel shows how many percentages of the genomic features are covered by RRBS. B) Distributions of covered CpGs (≥20X read coverage) by RRBS in CpG islands.
Fig 2. The overall DNA methylation level at single CpG resolution, and over genomic features.

The probability density distribution and the box-plot of DNA methylation shows differences between the T21 twin and the normal twin at the level of A) single CpG sites, B) promoters, C) CpG islands, D) Exons, E) Introns, F) LADs, and G) iLADs. The red line in the probability plot shows the probability distribution of T21 twin methylome subtracted from the normal twin methylome (T21—N). While, the blue line shows the probability distribution of the normal twin methylome subtracted from T21 twin methylome (N—T21). DNA hyper-methylation in T21 twin (T21 > Normal) is observed at the level of CpGs, and all the genomic features, but the effect is more pronounced in promoters and CpG islands.
We next mapped DNA methylation profile to a gene model as described by Laurent et al 2010 [23]. This gene model includes all annotated genomic features in the vicinity of all transcribed genes in these twins. This gene model was used to compare the DNA methylation fold changes over the transcription start sites (TTS), gene bodies, transcription termination sites (TTS), and intergenic regions (Fig 3). For this analysis, promoters were defined as -10 kb to +1 kb of the TSS, TTS regions as -1 kb to +10 kb of the TTS, gene body regions as +1 kb from the TSS to -1 kb from the TTS, and intergenic regions consisted of regions not included in the three above mentioned categories [23]. The density of DNA methylation in each region was calculated as the percentage of methyl-cytosine over the total number of covered Cs in that region. We then calculated the fold change of DNA methylation in the T21 twin compared to the normal twin, and observed a higher DNA methylation level (≥ 1.5 fold change) in the gene promoters of T21 twin versus the normal twin (Fig 3). Consistently, the results of unrelated T21 and normal (samples 13 and 14 of Table 1) also showed hyper-methylation around the TSS in T21 compared to the unrelated normal individuals. In contrast normal MZ twins (samples 9 and 10 of Table 1) and MZ twins concordant for T21 (samples 5 and 6 of Table 1) did not show such difference (Fig 3C and 3D).
Fig 3. DNA methylation profile over a “Gene Model”.

DNA methylation fold change in A) Monozygotic twins discordant for T21, B) Unrelated T21 and normal cases, C) Normal MZ twins, D) T21 MZ twins. TSS and TTS represent transcription start site and transcription termination sites, respectively. The plot shows an increase in the level of DNA methylation around TSS in T21 twin compared to the normal twin.
Differentially methylated regions (DMRs) in gene promoters
Since the RRBS method primarily enriches for promoter regions [24], we then focused in identifying differentially methylated regions (DMRs) in gene promoters in the MZ twins discordant for T21. Each promoter region was scored for being DMR using the Fisher's exact test. The P values were adjusted for multiple testing using the sliding linear model (SLIM) method that corrects P values to q-values as implemented in the methylKit package [20]. Promoters that met or exceeded a q-value of 0.001 and at least 25% absolute methylation differences were reported as being differentially methylated. Fig 4 illustrates the strategy that we have used in order to identify differentially methylated gene promoters in T21. DMRs in gene promoters from hg19 RefSeq genes (http://genome.ucsc.edu) were identified in each pair of twins and unrelated T21 and normal individuals. We have initially identified 462 gene promoters in MZ twins discordant for T21 that are differentially methylated (sample 1 and sample 3 versus sample 2 and sample 4). S2 Table represents the number of common DMRs observed in each sample set pair-wise comparisons (S2 Table). We have excluded any of the 462 DMRs identified in MZ twins discordant for T21 that have been also identified in at least one of the normal twins or T21 concordant twins. This was done in order to only keep those DMRs that are most likely to be due to the extra copy of chromosome 21. This filtering step resulted in 404 DMRs out of 462 to be uniquely present in MZ twins discordant for T21 (Fig 4). The majority of these DMRs are hypermethylated in T21 twins compared to the normal twin (353 gene promoters are hypermethylated and 51 gene promoters are hypomethylated).
Fig 4. Strategy used to define DMRs of gene promoters induced by the extra copy of chr21 in MZ twins discordant for T21.
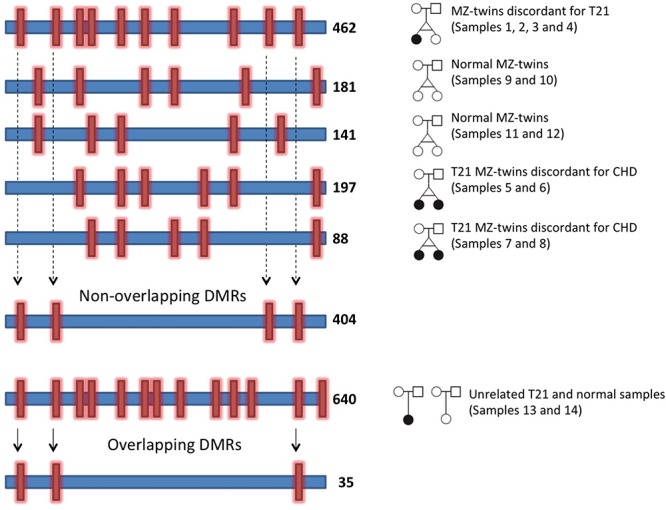
DMRs are identified in each pair of twins, as well as unrelated normal and T21 cases. DMRs that are common among MZ twins discordant for T21, T21 MZ twins, and normal MZ twins have been excluded from the final candidate list. Subsequently, from this reduced list of DMRs, those that have been observed in unrelated T21 and normal individuals were selected as T21 induced candidate DMRs for further analyses. Each horizontal blue bar represents one pair of sample. The red vertical bars show DMRs. The numbers on the right side of each blue bar shows the number of identified DMRs in each pair of sample.
Since DMRs identified in MZ twins discordant for T21 are likely to be DMRs in unrelated T21 and normal individuals, we only included those DMRs that were also differentially methylated in unrelated T21 and normal cases, as well (Fig 4). This filtering step identified 35 common DMRs that were kept for further analyses. These DMRs mapped to 37 human Refseq genes (hg19, Table 2). We next performed gene ontology (GO) analyses [25,26] on the 37 genes for which a DMR was identified in their promoter regions. Table 3 shows the significant GO terms and the associated genes in each category. Interestingly, the significant GO terms are linked to embryonic organ morphogenesis and development (Table 3). All the genes in this category are hyper-methylated in the T21 compared to the normal twin. We observed that the majority of the genes in this category, such as HOXD3, HOXD10, HOXD12, HOXB5, and HOXB6 were also differentially methylated in iPS cells generated from primary fetal skin fibroblasts (samples 15, 16 and 17). Table 4 shows the absolute methylation differences, and the log2 ratio of fold change in gene expression for the significant GO term in MZ twins discordant for T21 fibroblast cells and MZ twins discordant for T21 iPS cells (Table 4). Moreover, a comparison of these results for genes involved in embryonic organ morphogenesis with previous studies of DNA methylation in DS is shown in S3 Table. Interestingly, the pattern of differentially methylated region is also observed for HOXD10, HOXB5, HOXB6 and HOXD12 across multiple studies in different tissues [11,12,27–29] (S3 Table). Additionally, we analyzed the enrichment of histone marks and transcription factor binding sites (TFBS) in 37 gene promoters for which a DMR was identified in MZ twins discordant for T21. Table 5 shows the significant enrichment signals for histone marks (ENCODE_Histone_Modifications_2015) and TFBS (ENCODE_TF_ChIP-seq_2015) [30] in ENCODE human cell lines based on the program Enrichr [31]. As shown in Table 5, this analysis confirms that the reported DMRs are targets of a common set of transcription factors and epigenetic regulators, including CTCF and EZH2 binding sites, and H3K27me3, H3K4me1 and H2AFZ chromatin marks.
Table 2. DMRs in MZ twin discordant for T21.
| Chr. | Start | End | Meth (T21-N)* | Gene name | Gene description |
|---|---|---|---|---|---|
| chr1 | 24016268 | 24019268 | 68.33 | RPL11 | Ribosomal protein L11 |
| chr1 | 115123265 | 115126265 | 33.29 | BCAS2 | Breast carcinoma amplified sequence 2 |
| chr1 | 115123265 | 115126265 | 33.29 | DENND2C | DENN/MADD domain containing 2C |
| chr1 | 155909479 | 155912479 | 26.17 | RXFP4 | Relaxin/insulin-like family peptide receptor 4 |
| chr2 | 26780566 | 26783566 | 26.11 | OTOF | Otoferlin |
| chr2 | 176962529 | 176965529 | 55.30 | HOXD12 | Homeobox D12 |
| chr2 | 176979491 | 176982491 | 62.16 | HOXD10 | Homeobox D10 |
| chr2 | 177026804 | 177029804 | 35.19 | HOXD3 | Homeobox D3 |
| chr3 | 183722125 | 183725125 | -33.80 | ABCC5 | ATP-binding cassette, sub-family C |
| chr3 | 195941382 | 195944382 | 25.26 | SLC51A | Solute carrier family 51 |
| chr5 | 79550898 | 79553898 | 49.96 | SERINC5 | Serine incorporator 5 |
| chr5 | 140798536 | 140801536 | 25.12 | PCDHGA1 | Protocadherin gamma subfamily A |
| chr5 | 179498118 | 179501118 | -26.77 | RNF130 | Ring finger protein 130 |
| chr7 | 129140319 | 129143319 | 43.34 | SMKR1 | Small lysine-rich protein 1 |
| chr7 | 148934741 | 148937741 | 47.16 | ZNF212 | Zinc finger protein 212 |
| chr8 | 104381742 | 104384742 | 31.30 | CTHRC1 | Collagen triple helix repeat containing 1 |
| chr9 | 35904188 | 35907188 | -25.15 | HRCT1 | Histidine rich carboxyl terminus 1 |
| chr9 | 131682561 | 131685561 | -39.51 | PHYHD1 | Phytanoyl-coa dioxygenase domain 1 |
| chr9 | 132403448 | 132406448 | 40.11 | ASB6 | Ankyrin repeat and SOCS box containing 6 |
| chr9 | 133882503 | 133885503 | 30.65 | LAMC3 | Laminin, gamma 3 |
| chr10 | 100027007 | 100030007 | 41.49 | LOXL4 | Lysyl oxidase-like 4 |
| chr11 | 17564963 | 17567963 | 41.50 | USH1C | Usher syndrome 1C |
| chr15 | 74464086 | 74467086 | 38.36 | ISLR | Immunoglobulin superfamily leucine-rich |
| chr15 | 91471409 | 91474409 | 39.87 | HDDC3 | HD domain containing 3 |
| chr16 | 68266402 | 68269402 | 33.39 | ESRP2 | Epithelial splicing regulatory protein 2 |
| chr16 | 73124247 | 73127247 | 31.28 | HCCAT5 | Hepatocellular carcinoma transcript 5 |
| chr16 | 75527926 | 75530926 | 52.13 | CHST6 | Carbohydrate |
| chr17 | 8868029 | 8871029 | 25.36 | PIK3R5 | Phosphoinositide-3-kinase |
| chr17 | 46671319 | 46674319 | 45.27 | HOXB5 | Homeobox B5 |
| chr17 | 46671319 | 46674319 | 45.27 | HOXB6 | Homeobox B6 |
| chr19 | 4866780 | 4869780 | 44.22 | PLIN3 | Perilipin 3 |
| chr19 | 36247043 | 36250043 | 27.12 | HSPB6 | Heat shock protein B6 |
| chr19 | 46848250 | 46851250 | 25.66 | PPP5C | Protein phosphatase 5, catalytic subunit |
| chr19 | 55585220 | 55588220 | 30.81 | EPS8L1 | EPS8-like 1 |
| chr20 | 30223690 | 30226690 | -26.72 | COX4I2 | Cytochrome c oxidase subunit IV isoform 2 |
| chr20 | 45279100 | 45282100 | 25.21 | SLC13A3 | Solute carrier family 13 |
| chr21 | 46338949 | 46341949 | 55.20 | ITGB2 | Integrin, beta 2 |
*Meth (T21 –N) represents the percent methylation difference between T21 twin and normal twin. The positive sign means T21 twin is more methylated than the Normal twin, and the negative sign means Normal twin is more methylated than T21 twin.
Table 3. GO terms associated with DMRs identified in MZ twins discordant for T21.
| Biological Process | Gene Name | Gene Description | P | FDR |
|---|---|---|---|---|
| Embryonic organ morphogenesis | HOXD3 | Homeobox D3 | 6.52E-06 | 1.60E-03 |
| CTHRC1 | Collagen triple helix repeat containing 1 | |||
| USH1C | Usher syndrome1C | |||
| HOXB5 | Homeobox B5 | |||
| HOXB6 | Homeobox B6 | |||
| HOXD10 | Homeobox D10 | |||
| Embryonic skeletal system morphogenesis | HOXD3 | Homeobox D3 | 2.79E-05 | 3.40E-03 |
| HOXB5 | Homeobox B5 | |||
| HOXB6 | Homeobox B6 | |||
| HOXD10 | Homeobox D10 | |||
| Embryonic morphogenesis | HOXD12 | Homeobox D12 | 7.85E-05 | 3.40E-03 |
| HOXD3 | Homeobox D3 | |||
| HOXB5 | Homeobox B5 | |||
| HOXB6 | Homeobox B6 | |||
| HOXD10 | Homeobox D10 | |||
| CTHRC1 | Collagen triple helix repeat containing 1 | |||
| USH1C | Usher syndrome1C |
P, nominal p-value.
FDR, False Discovery Rate- Benjamini–Hochberg.
Table 4. DNA methylation differences and gene expression fold changes in fibroblasts and iPSC of MZ twins discordant for T21; the genes listed are from Table 3.
| MZ twins discordant for T21 fibroblast cells | MZ twins discordant for T21 iPS cells | |||
|---|---|---|---|---|
| Gene name | Methylation difference* (T21 twin-Normal twin) | Gene expression difference Log2 (T21/Normal) | Methylation difference* (T21 iPS–Normal iPS) | Gene expression difference Log2 (T21 iPS /Normal iPS) |
| HOXD3 | 35.2 | -0.80 | 36.4 | -5.7 |
| HOXD10 | 62.16 | -2.84 | -6.8 | -1.02 |
| HOXB5 | 45.3 | -0.32 | 59 | -7 |
| HOXB6 | 45.3 | -1.85 | 59 | -5 |
| CTHRC1 | 31.3 | -0.30 | -53.4 | 0.43 |
| USH1C | 41.5 | 00.0 | -5 | 0.4 |
| HOXD12 | 60.58 | 3.12 | 77.92 | -0.03 |
| Correlation | -0.86 | -0.56 | ||
* Methylation difference is the percent methylation differences between fibroblast cells of T21 twin and Normal twin (column 2) and between iPS cells of T21 twin and Normal twin (column 4).
Correlation is the Pearson correlation between DNA methylation differences in column 2 and Log2 ratio of gene expression differences in column 3, and between DNA methylation differences in column 4 and Log2 ratio of gene expression differences in column 5.
Table 5. Histone modification and TFBS enrichment analyses of DMRs associated with T21.
| ENCODE Histone Modification gene-set library (Human) | |||
| Histone Mark | P | FDR | Genes |
| H3K27me3 | 9E-05 | 0.01 | CHST6;ESRP2;LAMC3;USH1C;EPS8L1;HOXD3;HOXD10;RNF130;ZNF212;PIK3R5 |
| H3K4me1 | 5E-04 | 0.03 | ISLR;CHST6;HSPB6;LAMC3;PHYHD1;ITGB2;PCDHGA1;HOXD10;ZNF212 |
| H2AFZ | 2E-03 | 0.06 | DENND2C;PPP5C;ISLR;PHYHD1;RPL11;PCDHGA1;BCAS2;ZNF212 |
| ENCODE TF ChIP-seq gene-set library (Human) | |||
| TF | P | FDR | Genes |
| CTCF | 2E-04 | 0.1 | PPP5C;RPL11;ASB6;HOXD12;HDDC3;ZNF212;HOXB5;CTHRC1 |
| EZH2 | 1E-03 | 0.1 | PPP5C;CHST6;ESRP2;COX4I2;OTOF;EPS8L1;LOXL4;HDDC3;PIK3R5 |
P, nominal p-value.
FDR, False Discovery Rate- Benjamini–Hochberg.
Furthermore, since the majority of the DMRs detected in the MZ twin discordant for T21 are hyper-methylated in T21, we subsequently evaluated the genes that are known to be directly involved in DNA methylation and de-methylation processes. The addition of methyl group to CpGs is controlled at several different levels and is carried out by a family of enzymes called DNA methyltransferases (DNMTs) (DNMT2, DNMT3L, DNMT3a and DNMT3b) [32]. On the contrary, active DNA demethylation is carried out by ten-eleven translocation (TET) enzyme-mediated oxidation (TET1, TET2 and TET3) [33]. Based on RNAseq data available from the iPS cells generated from the MZ twins discordant for T21 (55), we have observed an over-expression of DNA methyltransferase enzymes (DNMT3B and DNMT3L) and down regulation of TET2 and TET3 involved in DNA demethylation processes in T21 iPS cells compared to the normal twin iPS cells (Fig 5). It is of note that DNMT3L maps on chromosome 21, and its expression level in the T21 iPS cells is three fold greater than in the normal iPS cells. However, we did not observe expression changes of these genes in the skin fibroblast cell cultures. This may suggest that these epigenetic changes potentially happen in early embryonic stages [34].
Fig 5. Gene expression fold changes of enzymes involved in DNA methylation.

The log2 ratio of fold change is based on the average RPKM values of four normal twin iPS cell replicates and the average RPKM values of three T21 twin iPS cell replicates.
Methylation differences in T21 MZ twins discordant for CHD
We had also the opportunity to study two sets of T21 MZ twins discordant for CHD, and thus investigated DMRs that could potentially be linked to this common but heterogeneous congenital phenotype in DS. The first twin set was discordant for VSD (Samples 5 and 6) (Table 1), and the second set for AVSD (Samples 7 and 8) (Table 1). AVSD is the most common (43% of CHD cases in DS), and VSD is the second common cardiac defect in DS (32% of CHD cases in DS) [35]. Although genomic variation on chromosome 21 has been shown to modify the risk of CHD [3], in the case of MZ twins the genome is similar. Therefore, CHD may be the result of epigenetic alterations in concert with T21, or a stochastic event. We have identified 197 DMRs (25% methylation differences and q-value less than 0.001) in MZ twins discordant for VSD (Samples 5 and 6), and 88 DMRs in MZ twins discordant for AVSD (Samples 7 and 8), including 13 common DMRs between two sets. Table 6 shows the common DMRs observed in both twin sets and their association with different heart phenotypes based on previous studies [36–43]. However, the direction of DNA methylation is different for some of the gene promoters (CBFA2T3, EPHA8, LY9, SLC9A3R2) between VSD and AVSD (Table 6). This may suggest that the up or down regulation of these genes can lead to different heart phenotypes. The GO term analyses performed on genes harboring DMRs in MZ-twins discordant for AVSD (Samples 7 and 8), show an enrichment for endocardial cushion morphogenesis genes (adjusted P value 0.0091) and genes involved in metanephric nephron tube formation (adjusted P value 0.008) (Table 7). Additionally, we observed enrichment for genes involved in pyridine-containing compound metabolic process (adjusted P value 0.033) in MZ twins discordant for VSD (Samples 5 and 6) (Table 7). Furthermore, the top scores for TFBS enrichment analyses for DMRs in T21 twins discordant for AVSD highlighted EP300, E2F6, SMC3 and CEBPB binding sites, and for T21 twins discordant for VSD highlighted POLR2A (polymerase (RNA) II polypeptide A), CTCF and EP300 (Tables 8 and 9). Moreover, the top scores for histone modification marks enrichment analyses confirms the enrichment of marks associated with active enhancers such as H3K4me1 and H3K27ac in DMRs associated with both AVSD and VSD (Tables 8 and 9).
Table 6. Common DMRs observed in the two sets of T21 MZ twins discordant for AVSD and VSD.
| Gene | Gene description | AVSD Twins | VSD Twins | Log2FC | Ref. |
|---|---|---|---|---|---|
| Meth. differences | Meth. differences | ||||
| PCDHGB1 | Protocadherin gamma subfamily B, 1 | -44.44 | -43.88 | -1.59 | - |
| PFKFB2 | 6-phosphofructo-2-kinase | 29.67 | 92.29 | -1.6 | - |
| TRPC3 | Transient receptor potential cationchannel | -26.14 | -43.45 | -0.86 | Ref. (26,33) |
| WDR27 | WD repeat domain 27 | -29.23 | -27.91 | -1 | - |
| YOD1 | YOD1 deubiquitinase | 29.66 | 92.28 | -1.4 | Ref. (28) |
| CBFA2T3 | Core-binding factor, runt domain | 26.46 | -26.06 | 0.09 | Ref. (27) |
| CSRNP2 | Cysteine-serine-rich nuclear protein 2 | 26.21 | 55.58 | -1.5 | - |
| DIP2C | DIP2 disco-interacting protein 2 homolog C | -34.88 | -25.81 | -1.32 | - |
| EPHA8 | EPH receptor A8 | 30.86 | -33.74 | 1 | - |
| LY9 | Lymphocyte antigen 9 | -55.7 | 34.54 | NA | - |
| NFATC1 | Nuclear factor of activated T-cells | -30.08 | -25.81 | -1 | Ref. (29,30) |
| SLC9A3R2 | Solute carrier family 9 | -38.78 | 32.26 | -1.8 | Ref. (31) |
| TNNT3 | Troponin T type 3 | -36.11 | -59.85 | 0 | Ref. (32) |
Methylation differences show the DNA methylation percent difference between normal twin and twin with cardiac defect. Log2FC shows log2 fold change of RPKM value of gene expression in T21 normal twin over T21 twin with VSD. Gene expression data for T21 twins discordant for AVSD is not available. NA, Not available.
Table 7. GO terms associated with DMRs identified in T21 MZ twins discordant for CHD.
| T21 MZ twins discordant for AVSD | ||||
| Biological process | Gene | Gene description | P | FDR |
| Endocardial cushion morphogenesis | ENG | Endoglin | 4.08E-05 | 9.00E-03 |
| TBX2 | T-box 2 | |||
| RBPJ | Recombination signal binding protein | |||
| SOX9 | SRY box 9 | |||
| Metanephric nephron tubule formation | PAX2 | Paired box 2 | 8.01E-06 | 8.00E-03 |
| SOX9 | SRY box 9 | |||
| PAX8 | Paired box 8 | |||
| T21 MZ twins discordant for AVSD | ||||
| Pyridine-containing compound metabolic process | PNPO | Pyridoxamine 5'-phosphate oxidase | 4.64E-05 | 3.30E-02 |
| GCK | Glucokinase | |||
| NUDT1 | Nudix | |||
| NMRK2 | Nicotinamide riboside kinase 2 | |||
| NADK | NAD kinase | |||
| LDHB | Lactate dehydrogenase B | |||
P, nominal p-value.
FDR-BH, False Discovery Rate- Benjamini–Hochberg.
Table 8. Histone modification and TFBS enrichment analyses of DMRs associated with VSD.
| ENCODE Histone modification gene-set library (Human) | |||
| Histone Mark | P | FDR | Genes |
| H2AFZ | 3.2E-08 | 1.3E-05 | PXT1;AGPAT6;HDAC5;ITGB5;CCDC149;VPS4A;NAT10;NOD1;ASH2L;CKMT2; |
| SEC14L1;FLAD1;WDR93;NDUFV3;IP6K1;ZNF687;ZBED3;CDKL3;TRPC3; | |||
| SETDB1;PCDHGA1;YOD1;ISG15;CORO2A;ESPL1;ZSCAN23;L1TD1;CDK12; | |||
| NIT1;SEC24D;HPD;LINC00346 | |||
| H3K4me1 | 3.0E-05 | 3.1E-03 | IFITM3;PXT1;CCDC149;SLC2A5;AQP3;PPCDC;CKMT2;KCTD20;C14ORF2; |
| PPP6R2;KIAA0226L;CD14;SMYD3;NAE1;DIP2B;ZNF589;CDKL3;ACBD4; | |||
| LYSMD1;DGKZ;GCFC2;SLC6A9;LUC7L3;STEAP1;HPD;CAPS2; | |||
| H3K27ac | 4.1E-05 | 3.4E-03 | CCDC101;PXT1;AGPAT6;NDUFA10;ISG20L2;ASH2L;C1ORF174;PHKG1;KCTD20; |
| STK36;DGCR8;NDUFV3;ZNF687;ZBED3;GUSBP1;C8ORF59;SETDB1;ATAD5; | |||
| LRBA;IFNGR2;LYSMD1;ISG15;SMU1;NBR2;NIF3L1;CFDP1;NHP2L1;ESPL1; | |||
| NCL;MITD1;NAA16;ZNF414;CDK12;NIT1;STEAP1;C22ORF15;CAPS2;LINC00346 | |||
| ENCODE TF ChIP-seq gene-set library (Human) | |||
| TF | P | FDR | Genes |
| POLR2A | 7.7E-08 | 3.1E-05 | CSRNP2;FAF1;C15ORF61;ASH2L;ARID4B;C1ORF174;AQP3;PPCDC;UBL5;ALDH2; |
| C14ORF2;FUNDC1;PPP6R2;DGCR8;ZNF687;NUDT12;TMPO;WDR38;CDKL3; | |||
| GUSBP1;C8ORF59;TBCCD1;IFNGR2;TET2;YOD1;NIF3L1;NHP2L1;ESPL1;THRAP3; | |||
| NCL;LUC7L3;ZSCAN23;HPRT1;STEAP1;HPD;PXT1;AGPAT6;TSSC1;VPS4A;NOD1; | |||
| C17ORF51;OAZ2;SEC14L1;KCTD20;STK36;PNPO;SMYD3;NAE1;NDUFV3; | |||
| ZNF589;IP6K1;NADK;TBC1D16;GINS1;ACBD4;CCDC12;ATAD5;LRBA;SGTA; | |||
| LYSMD1;ISG15;SMU1;NUDT9;NBR2;STK24;CAPZA2;GNB4;MITD1;NAA16; | |||
| ISG15;SMU1;NUDT9;NBR2;STK24;CAPZA2;GNB4;MITD1;NAA16;SEC24D; | |||
| FERMT3;LINC00346 | |||
| EP300 | 1.1E-06 | 9.3E-05 | CSRNP2;FAF1;NDUFA10;C15ORF61;RPL10A;UBL5;ALDH2;FLAD1;FUNDC1; |
| PPP6R2;ZNF687;TMPO;CDKL3;GUSBP1;IQCD;GCFC2;NIF3L1;CFDP1;FAM161A; | |||
| NHP2L1;ESPL1;THRAP3;NCL;LGALS12;TLCD1;STEAP1;HPD;CCDC101;PXT1; | |||
| TSSC1;NOD1;MTMR6;SOCS2;SEC14L1;KCTD20;STK36;SMYD3;NDUFV3; | |||
| ZNF589;IP6K1;NADK;GINS1;SETDB1;CCDC12;ATAD5;LRBA;LYSMD1;SMU1; | |||
| NBR2;TCEA2;MITD1;ZNF414;HIST1H4D;LINC00346 | |||
| CTCF | 1.3E-06 | 9.4E-05 | BCAR3;CCDC101;AGPAT6;TSSC1;CCDC149;FAF1;VPS4A;NAT10;NOD1; |
| RPL10A;AQP3;CX3CL1;MTMR6;SOCS2;KCNT1;SEC14L1;ALDH2;PHKG1; | |||
| C14ORF2;FUNDC1;SMYD3;NAE1;DIP2B;ZNF589;WDR38;GUSBP1;ACBD4; | |||
| SETDB1;SGTA;PCDHGA1;CORO2A;NUDT9;NBR2;ESPL1;CAPZA2;TLCD1; | |||
| STEAP1;HPD;HIST1H4D;LINC00346 | |||
P, nominal p-value.
FDR, False Discovery Rate- Benjamini–Hochberg.
Table 9. Histone modification and TFBS enrichment analyses of DMRs associated with AVSD.
| ENCODE Histone modification gene-set library (Human) | |||
| Histone Mark | P | FDR | Genes |
| H3K4me1 | 1E-05 | 0.006 | GABRB3;FAM49A;PLA2G12B;TPM3;KRT8;TMC6;TMPRSS13;ROCK1P1; |
| RND1;HAUS1;LSM12;SPATA17;CCDC80;SUMO2;SLC26A9;MIR190B;ENG | |||
| H3K27me3 | 6E-04 | 0.052 | GABRB3;FAM49A;PLA2G12B;TPM3;KRT8;TMC6;TMPRSS13;ROCK1P1; |
| C9ORF129;F8;DLG3;PTCHD3;MIR190B;BCAS1;CES1 | |||
| ENCODE TF ChIP-seq gene-set library (Human) | |||
| EP300 | 2E-05 | 0.018 | H2AFB1;CSRNP2;LUZP1;CSTF3;ATP5A1;GPATCH2;RPL36A;RND1;PIM2; |
| ZNF585B;SLC35A2;MED1;TTC37;PTGIR;TIPIN;F8A1;HIST1H4K;KRT8; | |||
| PDE4DIP;YOD1;MARCH8;TMC6;HAUS1;LENG1;LATS1;PAN2;CDC20B;PKIB; | |||
| SPATA17;GSTA4;EBPL | |||
| E2F6 | 2E-04 | 0.049 | TTC37;TIPIN;CSRNP2;ATP5A1;MARCH8;CLK2;HAUS1;LENG1;LATS1;PAN2; |
| CDC20B | |||
| SMC3 | 1E-04 | 0.049 | SLC35A2;TTC37;CSRNP2;RPL36A;KRT8;MIR449C;RND1;PKIB;SPATA17; |
| GSTA4;ARSK; SERINC1;PIM2;LRRC4C;ZNF585B;BCAS1;CES1 | |||
| CEBPB | 2E-04 | 0.049 | MED1;CSRNP2;LUZP1;RPL36A;YOD1;MAGT1;CMAHP;RND1;LENG1; LATS1; |
| CDC20B;F8;LSM12;GSTA4;ARSK;SUMO2;EBPL;PIM2;ZNF585B;CES1 | |||
P, nominal p-value.
FDR, False Discovery Rate- Benjamini–Hochberg.
Discussion
DNA methylation analysis of fibroblasts from a rare pair of MZ twin discordant for T21, combined with normal MZ twins and T21 MZ twins as controls, revealed differences in promoter regions of genes involved in embryonic organ morphogenesis such as HOXB5, HOXB6, HOXD3, HOXD10 and HOXD12 in T21. Although the majority of these loci are hyper-methylated in the T21 compared to the normal twin, there is no enrichment for chromosome 21 genes. This highlights the point that the effect of the extra copy of chromosome 21 is not restricted to genes located on chromosome 21, and can modify the epigenetic status of loci located in the rest of the genome [2]. The fact that these gene regions are also differentially methylated in iPS cells suggests that these epigenetic marks are not tissue specific and are stably maintained.
HOX genes, transcription factors of the homeobox superfamily, are major regulators of animal development and regulate many biological processes including embryonic morphogenesis and differentiation [44,45]. Aberrant expression of HOX genes is associated with several abnormalities. For instance, altered expression of Hoxb6 in mice has been associated with craniofacial abnormalities [46]. HOXB5 encodes a protein that functions as a sequence-specific transcription factor that is mainly involved in lung and gut development [47]. Altered expression of HOXB5 is linked to AML, bronchopulmonary sequestration and congenital cystic adenomatoid malformation tissue [48,49]. Also, the HOXD gene cluster has been associated with severe genital and limb abnormalities [50–52]. Moreover, in accordance with the observation that HOXB and HOXD gene clusters are down-regulated in T21, Billingsley C et al reported this observation when comparing 13 Ts65Dn (DS mouse model) and 11 euploid mouse embryos at 13.5 days gestation (E13.5) [53]. Altogether, these results indicate that dysregulation of HOX genes mediated by DNA methylation modification may play an important role in DS associated phenotypes.
Another observation in the DNA methylation analyses of MZ twins discordant for T21 is the presence of a higher level of DNA methylation in the genome of the T21 twin compared to the normal twin, both in iPSC and fibroblasts. This observation was also reported in unrelated T21 and normal individuals [12]. When the genome was dissected in different genomic features, the DNA hyper-methylation was even more pronounced in promoters and CpG islands. Therefore, it suggests that the presence of the extra copy of chromosome 21 in DS cases is associated with an increase in the overall genome methylation in T21. The hyper-methylation state of the T21 methylome versus the normal methylome in iPSC is interestingly associated with the up-regulation of DNA methyl-transferase genes (DNMT3B and DNMT3L), and down-regulation of DNA de-methylation genes (TET2 and TET3) in T21 twin. However, it is still unclear if the presence of the extra copy of chromosome 21 per se, or specific gene(s) located on chromosome 21 is (are) leading this effect. It is of note that DNMT3L, a DNA methyltransferase regulator, maps on chromosome 21. Since DNA methylation patterns are established during early embryonic development [34], any changes in the methyltransferases activity can lead to disturbed methylation patterns in the cells [54]. DNMT3L increases the activity of DNMT3a and DNMT3b [54] that are the main enzymes required for De Novo DNA methylation and are extremely similar in structure and function [55,56]. However, it seems that DNMT3b is needed during early development, while DNMT3a is required for normal cellular differentiation [57]. Moreover, Baubec et al recently has shown the selective binding of DNMT3B to the bodies of transcribed genes, while excluded from active promoters and enhancers [58]. In accordance with the 3.1 fold change increase in the expression level of DNMT3L in T21 twin iPSC, we observed 3.2 fold change increase also in the expression level of DNMT3b in T21 iPSC compared to normal twin iPSC (Fig 5). These results suggest that the overexpression of specific genes on chromosome 21 (i.e., DNMT3L) (rather than the extra-material per se) leads to the hypermethylation of the genome in T21. However, further experiments are required to explore the association of DNMT3L and DNA methylation in the context of T21.
Moreover, we have observed enrichment for histone marks H3K27me3 and H3K4me1, and for CTCF and EZH2 binding sites in DMRs related to DS (Table 5). CTCF is a master regulator that plays a central role in multiple complex genomic processes, including transcription, imprinting, and chromatin interactions [59]. Recently, Wang et al reported a strong link between DNA methylation and the global occupancy patterns of CTCF. They have shown that the majority of CTCF binding sites are un-methylated and confirming an inverse relationship between methylation and CTCF occupancy [59]. EZH2 is also involved in maintaining the transcriptional repressive state of genes via H3K27me3 (repressive mark associated with constitutive heterochromatin), leading to transcriptional repression of the affected target gene. EZH2 also serves as a recruiting platform for DNA methyltransferase enzymes, thereby linking two epigenetic repression systems [60]. The fact that there is an enrichment for binding sites of CTCF and EZH2 which overlaps with the location of repressive histone marks H3K27me3 and H3K4me1 in DMRs associated with MZ twins discordant for T21, suggests that the altered methylation level in DNA sequence can potentially reflect the altered epigenetic architecture of chromatin structure. Whether DNA methylation alteration initiate the cascade of changes in the epigenetic architecture, or it is a result of changes in other epigenetic factors is not well known.
Furthermore, CHD is one of the most heterogeneous variable phenotypes in DS, and is present in 40% of the cases [35]. Recently, whole exome sequencing in a population of CHD cases pointed to the importance of epigenetic alterations in the pathogenicity of CHD in the general population [61]. Moreover, Serra-Juhé et al 2015 investigated the global methylation profile of fetal heart DNA in comparison to blood DNA from control subjects [62]. This study revealed a significant enrichment of differential methylation at genes related to muscle contraction and cardiomyopathies in the developing heart DNA in both isolated and syndromic heart malformations [62]. Since two sets of MZ twins in this study are concordant for T21, but discordant for CHD, they provide a unique opportunity to investigate the association of DNA methylation with the development of CHD in the context of T21. Interestingly, T21 MZ twins discordant for AVSD show enrichment for endocardial cushion morphogenesis genes (adjusted P-value 0.0091). This GO term includes ENG, TBX2, RBPJ, and SOX9 (Table 7) that all are involved in heart development [63–65]. The MZ twins discordant for VSD show enrichment for the genes involved in pyridine-containing compound metabolic process (adjusted P-value 0.033) (Table 7). However, it is not known whether the pyridine-containing compounds are involved in heart development. Additionally, the ENCODE transcription factor binding enrichment analyses show a significant enrichment for binding sites of EP300 and its paralog CREBBP that are ubiquitously expressed transcriptional co-activators and histone acetyl transferases. Both of these factors are essential for normal cardiac and neural development [66]. On the contrary, E2F6 and CTCF binding sites that are also significantly enriched in DMRs associated with T21 twins discordant for AVSD, are transcription repressors [67]. E2F6 interacts with Dnmt3b and is required for binding of DNMT3B at CpG-islands [68], however it is not known that this interaction leads to the establishment or to the maintenance of DNA methylation.
In conclusion, the study of DNA methylation differences in MZ twins discordant for T21 revealed epigenetic alterations of gene promoters that are involved in embryonic organ morphogenesis and might be relevant to DS phenotypes. These DMRs are also targets of a common set of transcription factors and epigenetic regulators. In addition, we have observed an overall hypermethylation of DS genome compared to euploid normal genome, particularly in promoters and CpG islands. Moreover, the study of DNA methylation differences in T21 twins discordant for CHD highlighted epigenetic alterations of gene promoters that might be linked to the heart development. Furthermore, there is a significant enrichment for binding sites of EP300 and CREBBP that are important for heart development in both twins discordant for AVSD, and discordant for VSD. Altogether, the results of this study highlight the epigenetic effects of the extra chromosome 21 in T21 on loci outside of this chromosome that are relevant to DS associated phenotypes.
Supporting Information
For the normal twin (Samples 1 and 3) the correlation is 0.90, and for the T21 twin (Samples 2 and 4) the correlation is 0.91. The colors represent the local densities at each point in the scatterplot. The red line is linear regression fit and the blue line is loess fit.
(TIFF)
Total reads, show the raw number of sequenced reads in million (M) obtained for each sample. Mapped, shows the number of reads uniquely mapped against the human genome hg19 in million (M).
(DOCX)
(DOCX)
*Fetal Liver Mononuclear Cells. DS, Down syndrome. N, normal. M, Million. K, Thousands.
(DOCX)
Acknowledgments
The computations were performed at the Vital-IT (http://www.vital-it.ch) Center for high-performance computing of the SIB Swiss Institute of Bioinformatics.
Data Availability
All relevant data are within the paper and its Supporting Information files. All the raw data have been submitted to the EMBL-EBI European Genome-phenome Archive (http://www.ebi.ac.uk/ega/) under accession number EGAS00001001051.
Funding Statement
This study was supported by grants from the NCCR–Frontiers in Genetics, the European AnEuploidy project, Fondation Child Care, SNF 144082, and ERC 249968 to S.E.A., the Wellcome Trust Strategic Award WT 098330/Z/12/Z (The LonDownS Consortium) to D.N., and grants from the Ernest Boninchi Fondation and Genico to A.F. The funders had no role in study design, data collection and analysis, decision to publish, or preparation of the manuscript.
References
- 1. Antonarakis SE, Lyle R, Dermitzakis ET, Reymond A, Deutsch S (2004) Chromosome 21 and down syndrome: from genomics to pathophysiology. Nat Rev Genet 5: 725–738. [DOI] [PubMed] [Google Scholar]
- 2. Letourneau A, Santoni FA, Bonilla X, Sailani MR, Gonzalez D, Kind J, et al. (2014) Domains of genome-wide gene expression dysregulation in Down's syndrome. Nature 508: 345–350. 10.1038/nature13200 [DOI] [PubMed] [Google Scholar]
- 3. Sailani MR, Makrythanasis P, Valsesia A, Santoni FA, Deutsch S, Popadin K, et al. (2013) The complex SNP and CNV genetic architecture of the increased risk of congenital heart defects in Down syndrome. Genome Res 23: 1410–1421. 10.1101/gr.147991.112 [DOI] [PMC free article] [PubMed] [Google Scholar]
- 4. Feil R, Fraga MF (2011) Epigenetics and the environment: emerging patterns and implications. Nat Rev Genet 13: 97–109. [DOI] [PubMed] [Google Scholar]
- 5. Jones PA (2012) Functions of DNA methylation: islands, start sites, gene bodies and beyond. Nat Rev Genet 13: 484–492. 10.1038/nrg3230 [DOI] [PubMed] [Google Scholar]
- 6. Low FM, Gluckman PD, Hanson MA (2011) Developmental plasticity and epigenetic mechanisms underpinning metabolic and cardiovascular diseases. Epigenomics 3: 279–294. 10.2217/epi.11.17 [DOI] [PubMed] [Google Scholar]
- 7. Mill J, Heijmans BT (2013) From promises to practical strategies in epigenetic epidemiology. Nat Rev Genet 14: 585–594. 10.1038/nrg3405 [DOI] [PubMed] [Google Scholar]
- 8. Smith ZD, Meissner A (2013) DNA methylation: roles in mammalian development. Nat Rev Genet 14: 204–220. 10.1038/nrg3354 [DOI] [PubMed] [Google Scholar]
- 9. Bell JT, Spector TD (2011) A twin approach to unraveling epigenetics. Trends Genet 27: 116–125. 10.1016/j.tig.2010.12.005 [DOI] [PMC free article] [PubMed] [Google Scholar]
- 10. Zhang Y, Rohde C, Tierling S, Jurkowski TP, Bock C, Santacruz D, et al. (2009) DNA methylation analysis of chromosome 21 gene promoters at single base pair and single allele resolution. PLoS Genet 5: e1000438 10.1371/journal.pgen.1000438 [DOI] [PMC free article] [PubMed] [Google Scholar]
- 11. Kerkel K, Schupf N, Hatta K, Pang D, Salas M, Kratz A, et al. (2010) Altered DNA methylation in leukocytes with trisomy 21. PLoS Genet 6: e1001212 10.1371/journal.pgen.1001212 [DOI] [PMC free article] [PubMed] [Google Scholar]
- 12. Jin S, Lee YK, Lim YC, Zheng Z, Lin XM, Ng DP, et al. (2013) Global DNA hypermethylation in down syndrome placenta. PLoS Genet 9: e1003515 10.1371/journal.pgen.1003515 [DOI] [PMC free article] [PubMed] [Google Scholar]
- 13. Gutierrez-Arcelus M, Lappalainen T, Montgomery SB, Buil A, Ongen H, Yurovsky A, et al. (2013) Passive and active DNA methylation and the interplay with genetic variation in gene regulation. Elife 2: e00523 10.7554/eLife.00523 [DOI] [PMC free article] [PubMed] [Google Scholar]
- 14. Dahoun S, Gagos S, Gagnebin M, Gehrig C, Burgi C, Simon F, et al. (2008) Monozygotic twins discordant for trisomy 21 and maternal 21q inheritance: a complex series of events. Am J Med Genet A 146A: 2086–2093. 10.1002/ajmg.a.32431 [DOI] [PubMed] [Google Scholar]
- 15. Grynberg M, Graesslin O, Teyssedre J, Quereux C, Gaillard D, Carre-Pigeon F (2007) Prenatal diagnosis in monozygotic twins with Down syndrome who had different phenotypes. Prenat Diagn 27: 552–554. [DOI] [PubMed] [Google Scholar]
- 16. Prandini P, Deutsch S, Lyle R, Gagnebin M, Delucinge Vivier C, Delorenzi M, et al. (2007) Natural gene-expression variation in Down syndrome modulates the outcome of gene-dosage imbalance. Am J Hum Genet 81: 252–263. [DOI] [PMC free article] [PubMed] [Google Scholar]
- 17. Hibaoui Y, Grad I, Letourneau A, Sailani MR, Dahoun S, Santoni FA, et al. (2014) Modelling and rescuing neurodevelopmental defect of Down syndrome using induced pluripotent stem cells from monozygotic twins discordant for trisomy 21. EMBO Mol Med 6: 259–277. 10.1002/emmm.201302848 [DOI] [PMC free article] [PubMed] [Google Scholar]
- 18. Gu H, Smith ZD, Bock C, Boyle P, Gnirke A, Meissner A (2011) Preparation of reduced representation bisulfite sequencing libraries for genome-scale DNA methylation profiling. Nat Protoc 6: 468–481. 10.1038/nprot.2010.190 [DOI] [PubMed] [Google Scholar]
- 19. Krueger F, Andrews SR (2011) Bismark: a flexible aligner and methylation caller for Bisulfite-Seq applications. Bioinformatics 27: 1571–1572. 10.1093/bioinformatics/btr167 [DOI] [PMC free article] [PubMed] [Google Scholar]
- 20. Akalin A, Kormaksson M, Li S, Garrett-Bakelman FE, Figueroa ME, Melnick A, et al. (2012) methylKit: a comprehensive R package for the analysis of genome-wide DNA methylation profiles. Genome Biol 13: R87 10.1186/gb-2012-13-10-r87 [DOI] [PMC free article] [PubMed] [Google Scholar]
- 21. Guelen L, Pagie L, Brasset E, Meuleman W, Faza MB, Talhout W, et al. (2008) Domain organization of human chromosomes revealed by mapping of nuclear lamina interactions. Nature 453: 948–951. 10.1038/nature06947 [DOI] [PubMed] [Google Scholar]
- 22. Marco-Sola S, Sammeth M, Guigo R, Ribeca P (2012) The GEM mapper: fast, accurate and versatile alignment by filtration. Nat Methods 9: 1185–1188. 10.1038/nmeth.2221 [DOI] [PubMed] [Google Scholar]
- 23. Laurent L, Wong E, Li G, Huynh T, Tsirigos A, Ong CT, et al. (2010) Dynamic changes in the human methylome during differentiation. Genome Res 20: 320–331. 10.1101/gr.101907.109 [DOI] [PMC free article] [PubMed] [Google Scholar]
- 24. Smith ZD, Gu H, Bock C, Gnirke A, Meissner A (2009) High-throughput bisulfite sequencing in mammalian genomes. Methods 48: 226–232. 10.1016/j.ymeth.2009.05.003 [DOI] [PMC free article] [PubMed] [Google Scholar]
- 25. Wang J, Duncan D, Shi Z, Zhang B (2013) WEB-based GEne SeT AnaLysis Toolkit (WebGestalt): update 2013. Nucleic Acids Res 41: W77–83. 10.1093/nar/gkt439 [DOI] [PMC free article] [PubMed] [Google Scholar]
- 26. Kirov S, Ji R, Wang J, Zhang B (2014) Functional annotation of differentially regulated gene set using WebGestalt: a gene set predictive of response to ipilimumab in tumor biopsies. Methods Mol Biol 1101: 31–42. 10.1007/978-1-62703-721-1_3 [DOI] [PubMed] [Google Scholar]
- 27. Jones MJ, Farre P, McEwen LM, Macisaac JL, Watt K, Neumann SM, et al. (2013) Distinct DNA methylation patterns of cognitive impairment and trisomy 21 in Down syndrome. BMC Med Genomics 6: 58 10.1186/1755-8794-6-58 [DOI] [PMC free article] [PubMed] [Google Scholar]
- 28. Malinge S, Chlon T, Dore LC, Ketterling RP, Tallman MS, Paietta E, et al. (2013) Development of acute megakaryoblastic leukemia in Down syndrome is associated with sequential epigenetic changes. Blood 122: e33–43. 10.1182/blood-2013-05-503011 [DOI] [PMC free article] [PubMed] [Google Scholar]
- 29. Eckmann-Scholz C, Bens S, Kolarova J, Schneppenheim S, Caliebe A, Heidemann S, et al. (2012) DNA-methylation profiling of fetal tissues reveals marked epigenetic differences between chorionic and amniotic samples. PLoS One 7: e39014 10.1371/journal.pone.0039014 [DOI] [PMC free article] [PubMed] [Google Scholar]
- 30. Consortium EP (2012) An integrated encyclopedia of DNA elements in the human genome. Nature 489: 57–74. 10.1038/nature11247 [DOI] [PMC free article] [PubMed] [Google Scholar]
- 31. Chen EY, Tan CM, Kou Y, Duan Q, Wang Z, Meirelles GV, et al. (2013) Enrichr: interactive and collaborative HTML5 gene list enrichment analysis tool. BMC Bioinformatics 14: 128 10.1186/1471-2105-14-128 [DOI] [PMC free article] [PubMed] [Google Scholar]
- 32. Lister R, Pelizzola M, Dowen RH, Hawkins RD, Hon G, Tonti-Filippini J, et al. (2009) Human DNA methylomes at base resolution show widespread epigenomic differences. Nature 462: 315–322. 10.1038/nature08514 [DOI] [PMC free article] [PubMed] [Google Scholar]
- 33. Pastor WA, Aravind L, Rao A (2013) TETonic shift: biological roles of TET proteins in DNA demethylation and transcription. Nat Rev Mol Cell Biol 14: 341–356. 10.1038/nrm3589 [DOI] [PMC free article] [PubMed] [Google Scholar]
- 34. Morgan HD, Santos F, Green K, Dean W, Reik W (2005) Epigenetic reprogramming in mammals. Hum Mol Genet 14 Spec No 1: R47–58. [DOI] [PubMed] [Google Scholar]
- 35. Ferencz C, Neill CA, Boughman JA, Rubin JD, Brenner JI, Perry LW (1989) Congenital cardiovascular malformations associated with chromosome abnormalities: an epidemiologic study. J Pediatr 114: 79–86. [DOI] [PubMed] [Google Scholar]
- 36. Wu X, Eder P, Chang B, Molkentin JD (2010) TRPC channels are necessary mediators of pathologic cardiac hypertrophy. Proc Natl Acad Sci U S A 107: 7000–7005. 10.1073/pnas.1001825107 [DOI] [PMC free article] [PubMed] [Google Scholar]
- 37. Zhang L, Tumer Z, Mollgard K, Barbi G, Rossier E, Bendsen E, et al. (2009) Characterization of a t(5;8)(q31;q21) translocation in a patient with mental retardation and congenital heart disease: implications for involvement of RUNX1T1 in human brain and heart development. Eur J Hum Genet 17: 1010–1018. 10.1038/ejhg.2008.269 [DOI] [PMC free article] [PubMed] [Google Scholar]
- 38. Ye X, Zhang HM, Qiu Y, Hanson PJ, Hemida MG, Wei W, et al. (2014) Coxsackievirus-induced miR-21 disrupts cardiomyocyte interactions via the downregulation of intercalated disk components. PLoS Pathog 10: e1004070 10.1371/journal.ppat.1004070 [DOI] [PMC free article] [PubMed] [Google Scholar]
- 39. Lange AW, Yutzey KE (2006) NFATc1 expression in the developing heart valves is responsive to the RANKL pathway and is required for endocardial expression of cathepsin K. Dev Biol 292: 407–417. [DOI] [PubMed] [Google Scholar]
- 40. de la Pompa JL, Timmerman LA, Takimoto H, Yoshida H, Elia AJ, Samper E, et al. (1998) Role of the NF-ATc transcription factor in morphogenesis of cardiac valves and septum. Nature 392: 182–186. [DOI] [PubMed] [Google Scholar]
- 41. Bhattacharya R, Wang E, Dutta SK, Vohra PK, E G, Prakash YS, et al. (2012) NHERF-2 maintains endothelial homeostasis. Blood 119: 4798–4806. 10.1182/blood-2011-11-392563 [DOI] [PMC free article] [PubMed] [Google Scholar]
- 42. Sung SS, Brassington AM, Krakowiak PA, Carey JC, Jorde LB, Bamshad M (2003) Mutations in TNNT3 cause multiple congenital contractures: a second locus for distal arthrogryposis type 2B. Am J Hum Genet 73: 212–214. [DOI] [PMC free article] [PubMed] [Google Scholar]
- 43. Seo K, Rainer PP, Shalkey Hahn V, Lee DI, Jo SH, Andersen A, et al. (2014) Combined TRPC3 and TRPC6 blockade by selective small-molecule or genetic deletion inhibits pathological cardiac hypertrophy. Proc Natl Acad Sci U S A 111: 1551–1556. 10.1073/pnas.1308963111 [DOI] [PMC free article] [PubMed] [Google Scholar]
- 44. Pearson JC, Lemons D, McGinnis W (2005) Modulating Hox gene functions during animal body patterning. Nat Rev Genet 6: 893–904. [DOI] [PubMed] [Google Scholar]
- 45. Shah N, Sukumar S (2010) The Hox genes and their roles in oncogenesis. Nat Rev Cancer 10: 361–371. 10.1038/nrc2826 [DOI] [PubMed] [Google Scholar]
- 46. Kaur S, Singh G, Stock JL, Schreiner CM, Kier AB, Yager KL, et al. (1992) Dominant mutation of the murine Hox-2.2 gene results in developmental abnormalities. J Exp Zool 264: 323–336. [DOI] [PubMed] [Google Scholar]
- 47. Fu M, Lui VC, Sham MH, Cheung AN, Tam PK (2003) HOXB5 expression is spatially and temporarily regulated in human embryonic gut during neural crest cell colonization and differentiation of enteric neuroblasts. Dev Dyn 228: 1–10. [DOI] [PubMed] [Google Scholar]
- 48. Tucci R, Campos MS, Matizonkas-Antonio LF, Durazzo M, Pinto Junior Ddos S, Nunes FD (2011) HOXB5 expression in oral squamous cell carcinoma. J Appl Oral Sci 19: 125–129. [DOI] [PMC free article] [PubMed] [Google Scholar]
- 49. Volpe MV, Pham L, Lessin M, Ralston SJ, Bhan I, Cutz E, et al. (2003) Expression of Hoxb-5 during human lung development and in congenital lung malformations. Birth Defects Res A Clin Mol Teratol 67: 550–556. [DOI] [PubMed] [Google Scholar]
- 50. Davis AP, Capecchi MR (1994) Axial homeosis and appendicular skeleton defects in mice with a targeted disruption of hoxd-11. Development 120: 2187–2198. [DOI] [PubMed] [Google Scholar]
- 51. Carpenter EM, Goddard JM, Davis AP, Nguyen TP, Capecchi MR (1997) Targeted disruption of Hoxd-10 affects mouse hindlimb development. Development 124: 4505–4514. [DOI] [PubMed] [Google Scholar]
- 52. Tschopp P, Duboule D (2011) A genetic approach to the transcriptional regulation of Hox gene clusters. Annu Rev Genet 45: 145–166. 10.1146/annurev-genet-102209-163429 [DOI] [PubMed] [Google Scholar]
- 53. Billingsley CN, Allen JR, Baumann DD, Deitz SL, Blazek JD, Newbauer A, et al. (2013) Non-trisomic homeobox gene expression during craniofacial development in the Ts65Dn mouse model of Down syndrome. Am J Med Genet A 161A: 1866–1874. 10.1002/ajmg.a.36006 [DOI] [PMC free article] [PubMed] [Google Scholar]
- 54. Hu YG, Hirasawa R, Hu JL, Hata K, Li CL, Jin Y, et al. (2008) Regulation of DNA methylation activity through Dnmt3L promoter methylation by Dnmt3 enzymes in embryonic development. Hum Mol Genet 17: 2654–2664. 10.1093/hmg/ddn165 [DOI] [PubMed] [Google Scholar]
- 55. Bestor TH (2000) The DNA methyltransferases of mammals. Hum Mol Genet 9: 2395–2402. [DOI] [PubMed] [Google Scholar]
- 56. Okano M, Bell DW, Haber DA, Li E (1999) DNA methyltransferases Dnmt3a and Dnmt3b are essential for de novo methylation and mammalian development. Cell 99: 247–257. [DOI] [PubMed] [Google Scholar]
- 57. Moore LD, Le T, Fan G (2013) DNA methylation and its basic function. Neuropsychopharmacology 38: 23–38. 10.1038/npp.2012.112 [DOI] [PMC free article] [PubMed] [Google Scholar]
- 58. Baubec T, Colombo DF, Wirbelauer C, Schmidt J, Burger L, Krebs AR, et al. (2015) Genomic profiling of DNA methyltransferases reveals a role for DNMT3B in genic methylation. Nature 520: 243–247. 10.1038/nature14176 [DOI] [PubMed] [Google Scholar]
- 59. Wang H, Maurano MT, Qu H, Varley KE, Gertz J, Pauli F, et al. (2012) Widespread plasticity in CTCF occupancy linked to DNA methylation. Genome Res 22: 1680–1688. 10.1101/gr.136101.111 [DOI] [PMC free article] [PubMed] [Google Scholar]
- 60. Vire E, Brenner C, Deplus R, Blanchon L, Fraga M, Didelot C, et al. (2006) The Polycomb group protein EZH2 directly controls DNA methylation. Nature 439: 871–874. [DOI] [PubMed] [Google Scholar]
- 61. Zaidi S, Choi M, Wakimoto H, Ma L, Jiang J, Overton JD, et al. (2013) De novo mutations in histone-modifying genes in congenital heart disease. Nature 498: 220–223. 10.1038/nature12141 [DOI] [PMC free article] [PubMed] [Google Scholar]
- 62. Serra-Juhe C, Cusco I, Homs A, Flores R, Toran N, Perez-Jurado LA (2015) DNA methylation abnormalities in congenital heart disease. Epigenetics: 0. [DOI] [PMC free article] [PubMed] [Google Scholar]
- 63. Akiyama H, Chaboissier MC, Behringer RR, Rowitch DH, Schedl A, Epstein JA, et al. (2004) Essential role of Sox9 in the pathway that controls formation of cardiac valves and septa. Proc Natl Acad Sci U S A 101: 6502–6507. [DOI] [PMC free article] [PubMed] [Google Scholar]
- 64. High FA, Epstein JA (2008) The multifaceted role of Notch in cardiac development and disease. Nat Rev Genet 9: 49–61. [DOI] [PubMed] [Google Scholar]
- 65. Harrelson Z, Kelly RG, Goldin SN, Gibson-Brown JJ, Bollag RJ, Silver LM, et al. (2004) Tbx2 is essential for patterning the atrioventricular canal and for morphogenesis of the outflow tract during heart development. Development 131: 5041–5052. [DOI] [PubMed] [Google Scholar]
- 66. Bamforth SD, Braganca J, Eloranta JJ, Murdoch JN, Marques FI, Kranc KR, et al. (2001) Cardiac malformations, adrenal agenesis, neural crest defects and exencephaly in mice lacking Cited2, a new Tfap2 co-activator. Nat Genet 29: 469–474. [DOI] [PubMed] [Google Scholar]
- 67. Trimarchi JM, Fairchild B, Verona R, Moberg K, Andon N, Lees JA (1998) E2F-6, a member of the E2F family that can behave as a transcriptional repressor. Proc Natl Acad Sci U S A 95: 2850–2855. [DOI] [PMC free article] [PubMed] [Google Scholar]
- 68. Velasco G, Hube F, Rollin J, Neuillet D, Philippe C, Bouzinba-Segard H, et al. (2010) Dnmt3b recruitment through E2F6 transcriptional repressor mediates germ-line gene silencing in murine somatic tissues. Proc Natl Acad Sci U S A 107: 9281–9286. 10.1073/pnas.1000473107 [DOI] [PMC free article] [PubMed] [Google Scholar]
Associated Data
This section collects any data citations, data availability statements, or supplementary materials included in this article.
Supplementary Materials
For the normal twin (Samples 1 and 3) the correlation is 0.90, and for the T21 twin (Samples 2 and 4) the correlation is 0.91. The colors represent the local densities at each point in the scatterplot. The red line is linear regression fit and the blue line is loess fit.
(TIFF)
Total reads, show the raw number of sequenced reads in million (M) obtained for each sample. Mapped, shows the number of reads uniquely mapped against the human genome hg19 in million (M).
(DOCX)
(DOCX)
*Fetal Liver Mononuclear Cells. DS, Down syndrome. N, normal. M, Million. K, Thousands.
(DOCX)
Data Availability Statement
All relevant data are within the paper and its Supporting Information files. All the raw data have been submitted to the EMBL-EBI European Genome-phenome Archive (http://www.ebi.ac.uk/ega/) under accession number EGAS00001001051.