

Abstract
Unlike focal or partial epilepsy, which has a confined range of influence, idiopathic generalized epilepsy (IGE) often affects the whole or a larger portion of the brain without obvious, known cause. It is important to understand the underlying network which generates epileptic activity and through which epileptic activity propagates. The aim of the present study was to investigate the thalamocortical relationship using non-invasive imaging modalities in a group of IGE patients. We specifically investigated the roles of the mediodorsal nuclei in the thalami and the medial frontal cortex in generating and spreading IGE activities. We hypothesized that the connectivity between these two structures is key in understanding the generation and propagation of epileptic activity in brains affected by IGE. Using three imaging techniques of EEG, fMRI and EEG-informed fMRI, we identified important players in generation and propagation of generalized spike-and-wave discharges (GSWDs). EEG-informed fMRI suggested multiple regions including the medial frontal area near to the anterior cingulate cortex, mediodorsal nuclei of the thalamus, caudate nucleus among others that related to the GSWDs. The subsequent seed-based fMRI analysis revealed a reciprocal cortical and bi-thalamic functional connection. Through EEG-based Granger Causality analysis using (DTF) and adaptive DTF, within the reciprocal thalamocortical circuitry, thalamus seems to serve as a stronger source in driving cortical activity from initiation to the propagation of a GSWD. Such connectivity change starts before the GSWDs and continues till the end of the slow wave discharge. Thalamus, especially the mediodorsal nuclei, may serve as potential targets for deep brain stimulation to provide more effective treatment options for patients with drug-resistant generalized epilepsy.
Keywords: Idiopathic generalized epilepsy, Generalized spike-wave discharge, EEG, fMRI, Independent component analysis, Granger Causality, Functional connectivity, Directed transfer function (DTF), Adaptive directed transfer function (ADTF)
Highlights
-
•
We studied the generalized epilepsy mechanisms and networks using EEG and fMRI.
-
•
Connectivity analysis revealed mediodorsal nucleus–medial frontal cortex network.
-
•
We investigated the thalamocortical network using Granger Causality.
-
•
Thalamus was found to be the prominent player in the thalamocortical interaction.
1. Introduction
Idiopathic generalized epilepsy (IGE) is characterized by various combinations of generalized tonic–clonic seizures, absence seizures, myoclonus (Blumenfeld, 2005; Zhang et al., 2011), and generalized spike-and-wave discharges (GSWDs) observed during interictal periods on electroencephalography (EEG) recordings (Hamandi et al., 2006; Moeller et al., 2011; Zhang et al., 2011). Focal spike–wave complexes occasionally are observed interictally in patients with IGE, although ictal EEG recordings show only generalized-onset seizures and no focal-onset seizures in IGE (Drury and Henry, 1993; Seneviratne et al., 2012). Unlike focal or partial epilepsy, which has a confined range of influence, IGE affects the whole or a larger portion of the brain often without obvious, known cause (Engel, 2001). Among drug-resistant epilepsy, patients with focal epilepsy may receive surgical resection to become seizure free. On the other hand, patients with generalized epilepsy do not have such a treatment option. Recently deep brain stimulation (Johnson et al., 2013) has been hypothesized as a way to treat epilepsy patients (Fisher et al., 2010). Therefore, it is important to distinguish the driver (or source) versus recipient (or sink) to understand how the epileptic activities propagate to the entire brain.
In the recent decades, it has been generally agreed that the highly interconnected circuitry of the cortex and thalamus plays a crucial role for generalized epilepsy (Blumenfeld, 2005). There is general agreement that both cortex and thalamus participate in the generation of typical spike–wave seizures, but their relative importance is still unclear. Previous works using EEG–functional magnetic resonance imaging (fMRI) and anatomical MR-based study (Bernhardt et al., 2009) indicated the involvements of thalamus, default mode network (Fox et al., 2005; Raichle et al., 2001), cerebellum, caudate nuclei and corticocortical networks in the generations of GSWDs (Bernhardt et al., 2009; Blumenfeld, 2005, 2003; Blumenfeld et al., 2009; Gotman et al., 2005; Hamandi et al., 2006). However, the exact interplay between the cortical and sub-cortical structures remains to be further explored.
The goal of the present study is to use noninvasive, multimodal imaging techniques to elucidate the underlying mechanisms that generate GSWDs in IGE patients. Specifically, we aim to map the cortical networks associated with GSWDs and investigate the causality between cortex and thalamus during GSWDs. We first performed EEG-informed fMRI analysis and identified regions of interest (ROI). We then tested the specific connectivity patterns by seed-based connectivity analysis in fMRI data. The seeds include both regions determined by the EEG-informed fMRI analysis and additional ones identified by EEG waveforms. ROIs that exhibited network properties, i.e. the ones that share temporal profile with remote regions, were further subjected to the Granger Causality analysis to identify sources and sinks within the networks.
EEG and fMRI are two noninvasive neuroimaging tools used in epilepsy research and clinical applications. EEG has a long history being used as an important diagnostic tool for epilepsy. EEG has the benefit of having high temporal resolution but often suffers from limited spatial resolution. With the advancement of source imaging techniques (He et al., 2011; He and Ding, 2013; Holmes et al., 2010; Koessler et al., 2010; Lantz et al., 2003), successfully localizing epileptic activity in focal epilepsy is possible (Ding et al., 2007; He and Ding, 2013; Lai et al., 2011; Lantz et al., 2003; Lu et al., 2012a; Michel et al., 2004; Sohrabpour et al., 2015; Yang et al., 2011). However, very few studies have looked into using dense-array EEG to study the temporal dynamics of the sources in IGE (Jung et al., 2005). With complementary high spatial and temporal resolution, simultaneous fMRI and EEG (He and Liu, 2008; Liu and He, 2008) has been shown to provided valuable information in diagnosis of epilepsy (Pittau et al., 2012; Zhang et al., 2015).
Seed-based connectivity analysis using resting state fMRI is another common technique in the studying of both healthy and diseased neurological networks (Greicius et al., 2009; Moeller et al., 2011; O'Muircheartaigh et al., 2012). Using this technique, remote areas that share the same temporal characteristics can be identified. Compared with EEG-informed fMRI, seed-based connectivity analysis does not rely on precise knowledge of the EEG event timing, which can be difficult to obtain given the noisy signal collected concurrently with fMRI. However, it requires prior knowledge in determining the ROIs as seeds. In our study, we used regions identified by the EEG-informed fMRI result as seed in conjunction with other areas that may potentially be involved in the network activities in generating GSWDs. By using seed-based analysis, we can obtain a more specific network level activity than using EEG-informed fMRI alone.
Once we establish a network that is involved in generating GSWDs, the next question is which node in the network is driving the others. Directed connectivity measures based on the concept of Granger Causality (Granger, 1969) has been proposed (Babiloni et al., 2005; Goebel et al., 2003; Kaminski and Blinowska, 1991) to discern the causal relationship among different temporal series. The direction can be estimated with the following rationale: the driver is earlier than the recipient implying that the driver contains information about the future of the recipient not contained in the past of the recipient while the reverse is not the case. The directed transfer function (DTF) has been used to quantify the directionality and strength of the connectivity profile among different brain regions (Kaminski and Blinowska, 1991). DTF has been successfully applied in the field of epilepsy research, to identify sources (active or efferent sources) and sinks (passive or afferent sources) that may play important roles in generating seizures and interictal activities (Ding et al., 2007; Lu et al., 2012b; Wilke et al., 2010). Built upon the DTF method, which computes the overall connectivity strength in a given time window, an adaptive DTF (ADTF) method was developed to study the time-variant propagation of interictal spikes (Wilke et al., 2011, 2008). The ADTF method may be able to capture the temporal dynamics of the propagation and shed light in the inter-play among the networks in the genesis and propagation of GSWDs.
The overall aim of this work is to use noninvasive, multimodal imaging techniques to map the brain networks associated with GSWDs and investigate the functional connectivity between cortex and thalamus during GSWDs. The novelty of the current work lies in using multimodal neuroimaging approaches to identify the critical roles of thalamocortical networks in generalized spike and wave discharges, including electrophysiological recordings (EEG), hemodynamic recordings (BOLD fMRI), EEG-informed fMRI and functional connectivity mapping.
2. Methods
2.1. Subjects
2.1.1. Patients
Ten patients (mean age 33 ± 14, three females) with idiopathic generalized epilepsy syndromes were recruited from the Department of Neurology of the University of Minnesota, USA. The patients included in this study were selected based on the criteria that there were visible interictal GSWDs recorded from clinical EEG (with rare focal spikes only if GSWDs were frequent interictally), normal brain MRI (or normal brain CT in subjects 5 and 10), and a clinical diagnosis of IGE. All the patients were evaluated by board certified epileptologists. The patients' data are summarized in Table 1. Written informed consent was obtained from all patients. The study has been approved by the Institutional Review Board of the University of Minnesota.
Table 1.
Summary of patient information. PT, patient; GTC, generalized tonic-clonic seizure; IGE, idiopathic generalized epilepsy; AED, anti-epileptic drug.
| Pt ID | Sex | Age | Onset | Interictal activities | Seizure types | AED |
|---|---|---|---|---|---|---|
| 1 | M | 58 | 54 | 3 Hz centrally predominant generalized spike and wave | GTC | Levetiracetam |
| 2 | M | 28 | 15 | Generalized spike and waves and polyspikes | GTC | Lamotrigine |
| 3 | F | 45 | 16 | Generalized spike and waves, rare left frontotemporal focal spikes. | GTC | Levetiracetam, Zonisamide, Lamotrigine |
| 4 | M | 20 | 20 | Generalized spike and wave, occasional left temporal spike and wave | GTC | Valproic acid |
| 5 | M | 40 | 20 | Generalized atypical spike–wave and polyspike–wave discharges. | GTC | Levetiracetam, Carbamazepine |
| 6 | F | 21 | 15 | Generalized anteriorly predominant 4–5 Hz spike wave discharges | GTC, myoclonus | Levetiracetam |
| 7 | M | 62 | 12 | Generalized spike and wave activities 2–4 Hz | GTC, myoclonus | Carbamazepine, Valproic acid |
| 8 | M | 21 | 19 | Generalized spike and wave activities and polyspikes at 1–4 Hz | GTC | Valproic acid, Lamotrigine |
| 9 | M | 24 | 15 | Generalized atypical spike–wave activity at 4–5 Hz | GTC | Levetiracetam, Lamotrigine, Felbamate |
| 10 | F | 20 | 13 | Generalized spike and waves | GTC, myoclonus | Levetiracetam |
PT, patient; GTC, generalized tonic-clonic seizure; IGE, idiopathic generalized epilepsy; AED, anti-epileptic drug.
2.1.2. Healthy controls
Ten healthy volunteers (ages 21–31 years, 26 ± 2.4 years, 6 males) participated in this study. All subjects had written consent according to a protocol approved by the Institutional Review Board of the University of Minnesota. A total of two functional MRI scans, each lasting for 6 min, were recorded from each subject while lying in the MR scanner quietly. Individual structural MRI was also collected.
2.1.3. EEG recording
64-channel EEG caps were placed on patients' scalp. One electrode was placed on patients' back to record cardiac activity for noise removal purpose. Electrode impedances were brought below 20 kΩ. The EEG was amplified using MR-compatible amplifiers (BrainAmp MR 64 plus, BrainProducts, Germany) and recorded at 1000 Hz. Two sessions of EEG were recorded both inside and outside of the scanner experiment. During outside scanner recording, each patient was instructed to sit still and rest with eyes open. Outside-scanner recording lasted about 30 min. During inside scanner recording, each patient was asked to lie still and relax. Each recording lasted for 6–20 min. We recorded simultaneous EEG and fMRI for at least a total of 40 min for each patient.
2.1.4. In-scanner EEG preprocessing
The MR gradient artifact was removed using a principal component analysis (PCA)-based optimal basis set (OBS) algorithm (Niazy et al., 2005). When detecting and removing the cardioballistic artifact (CBA), ECG signal from a single electrode on the subject's back, was used. The timing of each heartbeat artifact in this channel was determined using an R-peak detection algorithm adapted from Liu et al. (Liu et al., 2012; Liu and He, 2008). The final artifact correction procedure is based on a combination of ICA, OBS, and an information-theoretic rejection criterion (Liu et al., 2012). Briefly, the signal is decomposed into independent components, which are rejected if the mutual information between the component's time course and the CBA artifact is sufficiently high. The remaining components are then divided into epochs around each heartbeat and an optimal basis set is obtained across all epochs to fit and remove the artifacts. Detection of bad electrodes and data epochs was performed before CBA detection, and again after CBA correction. Electrodes were first re-referenced to a common average of electrodes connected to the same amplifier, and then to the combined average. Together with EEG data obtained from outside of MR scanner, the EEG signal was filtered and down-sampled to 256 Hz.
2.1.5. MRI recording and preprocessing
We used 3 T Siemens Magnetom Trio and Skyra MR scanners (Germany) with 16 channel head coil. The echo planar imaging (EPI) volumes underwent several preprocessing steps including three-dimensional (3-D) motion correction, slice scan time correction and linear trend removal. Then, the fMRI data were aligned with the anatomical MR images. All fMRI data were pre-processed for slice scan time correction, 3-D motion correction and temporal filtering. Matlab based toolbox SPM8 (Ashburner et al., 2010) was used for EEG-informed fMRI analysis. BrainVoyager QX software (Brain Innovation, Maastricht, Netherlands) was used for the seed-based connectivity analysis. Similar preprocessing steps were implemented in both software. All subject had individual structural MRI. In each set of structural MRI, there were 176 contiguous sagittal slices with 1 mm slice thickness (matrix size: 256 × 256; FOV: 256 mm × 256 mm; TR/TE = 20 ms/3.3 ms). Whole-brain functional images with BOLD contrast were acquired using gradient echo planar imaging sequence (32 axial 3-mm thick interleaved slices with 0.3-mm gap; TR/TE = 2000 ms/30 ms; flip angle = 90°; matrix size: 64 × 64; FOV: 192 mm × 192 mm). Structural MRIs were normalized via alignment to the anterior–posterior commissural line and then transformation into Talairach space. FMRI data were spatially coregistered to the anatomical MRI.
2.1.6. ICA analysis of EEG
Independent Component Analysis (ICA) is a widely used data-driven technique to separate spatio-temporal signals into spatial components that are independent from each other through the selected time segment. Infomax ICA algorithm (Bell and Sejnowski, 1995; Delorme and Makeig, 2004) was used to decompose the spatio-temporal electrophysiological data into multiple independent components (ICs) using a time-by-space formulation. ICA was performed on EEG obtained both in and out of the scanner to identify GSWD related components for the subsequent EEG-informed fMRI analysis.
2.1.7. EEG-informed fMRI analysis
In the EEG-informed fMRI analysis, the important issue is the identification of GSWD timing based on EEG collected in the scanner. Although the artifact removal algorithm used was adequate in removing the majority of noise, it is still possible that some GSWDs were distorted by the residual noise and were rendered difficult to identify using visual inspection. Compared to baseline activity, GSWDs are characterized by synchronized large amplitude discharges that are present in multiple channels. Such large changes in activities are visible in both raw EEG and independent components related to the GSWD activities. Therefore, the temporal correlation between the two signals can be used in this study for the selection of GSWD components. This method is similar to what was previously described in seizure imaging (Yang et al., 2011). Once an IC of interest was identified from out-scanner EEG, it can be used as a benchmark for the IC selection from in-scanner EEG. The detailed steps are as follows.
For EEG obtained outside of the scanner, timing of each GSWD was marked by two trained epileptologists. Each 10 s time window containing one or multiple GSWDs was selected and concatenated to form a GSWD-dense EEG. The cross correlation between the time course of each IC and the averaged time course of all of the EEG channels was computed (Yang et al., 2011). The IC with the maximum absolute cross correlation valued was selected as most representative of the GSWD activity. ICA was also performed on in-scanner EEG after artifact removal. The same IC selection method was applied to ICs from in-scanner EEG. The correlation between the spatial map of the selected IC from in-scanner EEG and that from out-scanner EEG was computed to ensure accuracy. Since both spatial maps from in and out of the scanner represent the same GSWD activities, the two should share similar spatial pattern. The timings of GSWD were then identified basing on the time course of the selected IC.
The regressor of the general linear model (GLM) was constructed using identified time points convolving with the canonical hemodynamic response function (HRF) (Jann et al., 2008; Marques et al., 2009). The final design matrix was composed of the regressor that represents GSWD activity and the 6 movement parameters as previously described (Marques et al., 2009). The group level analysis was performed using SPM8 (Ashburner et al., 2010). Individual T-statistic images were averaged using random-filed theory to correct for multiple comparison errors.
2.1.8. Seed-based ROI analysis
Seed-based ROI analysis was performed in BrainVoyager QX. FMRI data were filtered using a band-pass filter (0.009–0.15 Hz) to reduce low frequency drift and high-frequency noise (Lowe et al., 1998; Seeley et al., 2007). The ROIs used in this study were informed by the EEG-informed fMRI results, with additional seeds added based on EEG waveform in bilateral superior frontal regions where there are strong GSWD discharges observed on EEG. Such areas include the left and right superior gyri and the middle frontal superior gyrus. A seed in the anterior nucleus of the thalamus was also included, as it was the stimulation target of the SANTE trial (Fisher et al., 2010). Seeds were selected in the Brainvoyager software by referencing Talairach Client's (Lancaster et al., 2000, 1997) archive of Talairach labels and selecting a central coordinate for each seed. The time courses of both seed coordinates was regressed against all brain voxel time courses to create two brain maps of r-values for each fMRI scan. A p-value threshold less than 0.05 with correction via Bonferroni multiple comparisons was used to identify which voxels were significantly correlated with the seed location. All images were smoothed using a 2.0 mm full width at half maximum (FWHM) Gaussian kernel within BrainVoyager. The resulting voxels were clustered and counted to record a total volume of significantly correlated connectivity for each fMRI scan. At the group level, a second-level, random-effects analysis was performed. Connectivity maps were created with the same threshold levels and smoothing parameters described above. Only voxels with correlation less than the p-value of 0.05 corrected using the Bonferroni method, are reported as significant across subjects.
2.1.9. Granger Causality analysis
In each of the selected well-formed GSWDs, an epoch of approximately 400 ms before and 600 ms after the peak of the spike was extracted for the subsequent continuous source localization as described above. The distributed current density of the underlying neuronal activity was estimated to obtain the source waveform at each voxel. Time series of the source waveforms corresponding to three ROIs, i.e. left mediodorsal nucleus of the thalamus, right mediodorsal nucleus of the thalamus and the medial frontal cortex, were selected. These anatomical locations were chosen based on analysis previously described in the seed-based connectivity analysis. The three source waveforms were subjected to the DTF computation, similar to the procedure previously described (Ding et al., 2007; Lu et al., 2012b). Nonparametric permutation tests were conducted to test the significance of the obtained directional DTF values. 5000 times of phase shuffling of the original input signal were performed. The threshold was set at p < 0.01 to consider a DTF value as significant. As a step toward computing the overall DTF value between two time series, the contribution of each frequency point, at 1 Hz increment, was computed automatically. Since different frequencies might carry information differently, DTF output at each frequency point was averaged across all spikes spanning from 1 to 125 Hz to show the contributions of different frequency bands. Additionally, adaptive DTF (Wilke et al., 2011, 2008) was performed on individual spikes to study the time varying feature of the information flow at different time points of the spike–slow wave complex. This measure will aid in delineating the temporal changes of the connectivity strength and determining the dynamics in initiation and propagation of the GSWDs.
3. Results
Patient information is summarized in Table 1.
3.1. EEG-informed fMRI
Fig. 1A shows in one patient, a segment of the EEG waveforms. Five out of fifty corresponding IC time courses are shown in Fig. 1B. Fig. 1C shows the histogram of the temporal cross-correlation coefficients between each IC and the global field potential. The red rectangle indicates the correlation coefficient of the selected IC. Spatial weight distribution of the selected components is shown in Fig. 1D. The cross correlation between the spatial weight of this IC and that of out-scanner EEG is 1. The cross correlation between the time course of the selected IC and the averaged time course of all the EEG is 0.73. On a group level, the correlation between the spatial weight of the selected IC and that of out-scanner EEG is 0.99 ± 0.01. The cross correlation between the time course of the selected IC and the mean global field potential is 0.71 ± 0.05. Group-level EEG informed fMRI results are shown in Fig. 2. The highest activations were observed in anterior cingulate cortex, bilateral mediodorsal nuclei, left caudate nucleus, bilateral insula and bilateral sensorimotor areas.
Fig. 1.

Characteristics of the selected independent component (IC) to represent GSWDs. A. Waveform of an example segment of the EEG spike. B. Time courses of five ICs. Red rectangle indicates the time course of the selected IC. C. Distribution of the temporal correlation coefficients between all ICs and the global field potential. The red rectangle indicates the correlation coefficient of the selected IC. D. Topological map of the selected IC. The activity is centered at the medial frontal area.
Fig. 2.

Group results from EEG-informed fMRI using GLM. z-Axis is indicated in blue. Activities are found in medial frontal cortex, bilateral mediodorsal nuclei, caudate nuclei, bilateral insula and sensorimotor cortex.
3.2. Seed-based connectivity study
Seed-based connectivity analysis with seed in left, right superior gyrus, and the insula showed these regions are connected bilaterally (Fig. 3A, B and E). But seeds in middle frontal superior gyrus, caudate nucleus and sensorimotor cortex are only temporally correlated to the close vicinities (Fig. 3C, D and F).
Fig. 3.

Seed based analysis in the patient group. A. Seed in the right superior gyrus. B. Seed in the left superior gyrus. C. Seed in the mediofrontal superior gyrus. D. Seed in the right caudate nucleus. E. Seed in the left insula cortex. F. Seed in the left sensorimotor cortex.
Group average of seed-based analysis in ACC for both patients with IGE and healthy controls are shown in Fig. 4A. The total voxel counts among all activities that are correlated to the ACC were significantly different between patients with IGE and healthy controls (p < 0.05 by nonparametric Wilcoxon Test, Fig. 4B). There was a linear positive trend between the degree of connectivity between ACC and the thalami, reflected by the number of voxels in the thalami that are correlated with the ACC time course, and the frequency of GSWDs (Fig. 4C). Activities in the thalami that are correlated with ACC are located in the bilateral mediodorsal nuclei.
Fig. 4.

Seed based analysis at medial frontal cortex. A. Seed-based connectivity analysis between healthy controls and patients with generalized epilepsy. Within the thalamus, voxels in the mediodorsal nuclei are related to the seed in the patients but not in controls. Seed location: medial frontal lobe. B. Voxel counts of the total number of voxels in the two groups that are correlated to the seed activity in medial frontal lobe. C. Scatter plot of voxel counts in the thalamus and the occurrence rate of GSWDs. Gp: group; HC: healthy control; GE: generalized epilepsy.
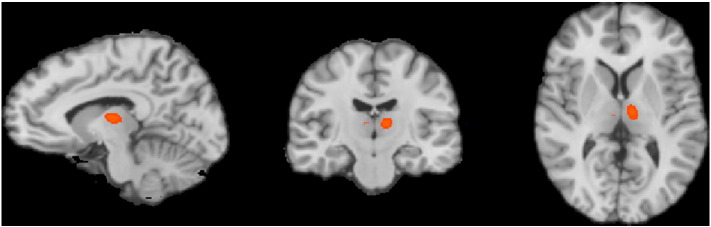
Group comparison of seed-based analysis in mediodorsal nuclei of the thalamus between patients with IGE and healthy controls are shown in Fig. 5A. The total voxel counts among all activities that are correlated to the mediodorsal nuclei were significantly different between patients with IGE and healthy controls (p < 0.05, Fig. 5B). There was a similar linear trend between the degree of connectivity and the frequency of GSWDs (Fig. 5C) as seen previously in Fig. 4C.
Fig. 5.

Seed based analysis at dorsal medial thalamus. A. Seed-based connectivity analysis between healthy controls and patients with generalized epilepsy. Voxels in the medial frontal cortex are related to the seed in the patients but not in controls. Seed location: mediodorsal nuclei of the thalami. B. Voxel count of the total number of voxels in the two groups that are correlated to the seed activity in medial frontal lobe. C. Scatter plot of voxel counts in the medial frontal cortex and the rate of GSWDs.
3.3. Granger Causality analysis
The connectivity patterns among the ROIs as measured by DTF are depicted in Fig. 6A. The blue and two red dots represent the ACC area in the medial frontal cortex and the two mediodorsal nuclei respectively. The arrows between the dots indicate the directionality of the flow, where the arrows are pointing from one area, the “source” toward another, the “sink”. The strengths of the information flowing from the medial frontal cortex is only about half in strength as the reverse direction. Fig. 6B quantitatively illustrates this difference in strengths in the two directions. The difference in strength between the two directions is statistically significant (p < 0.05). The time varying feature of the causality as results of the ADTF analysis is shown in Fig. 6C. The blue and red traces show the group averaged temporal changes of the connectivity during GSWD. The black trace shows an averaged EEG waveform. The most significant exchange seems to occur as early as 50 ms before the peak of the spike, initiated by the thalamus. The averaged information flow spanning the entire frequency range (1–125 Hz) is plotted in Fig. 6D by averaging over all spikes. There is a considerable variability but alpha and low gamma bands appear to have the most contribution.
Fig. 6.

A. Illustration of the connectivity patterns among different ROIs. The arrows indicate the directions and relative strengths of information flows. Red: ACC; Blue: mediodorsal nuclei of thalamus. B. Averaged information flow between thalamus nuclei and medial frontal cortex. Labels on the x-axis indicate the direction of flow. Cor: medial frontal cortex, Tha: mediodorsal nuclei. p < 0.05. C. Results of ADTF analysis of one spike with the accompanying EEG waveform. D. Averaged frequency contribution in information flow (y-axis).
4. Discussion
4.1. Seed-based connectivity
Seed-based connectivity analysis was performed with a focus on two specific structures: anterior cingulate cortex in the medial frontal lobe and the mediodorsal nuclei in the thalamus. These two structures have been previously mentioned in works of IGE but not been specifically studied. Medial frontal cortex has been known to generate GSWDs on EEG. However, it was also thought that the sources can be much more distributed only with center of gravity located near to the midline instead of having the actual focus in the medial frontal cortex. Using the seed-based connectivity analysis, we were able to specifically target this region and find its remote connections in the thalamus. This connection in IGE patients was more prominent compared with healthy controls.
Surprisingly, activity of just the mediodorsal nuclei, not the entire thalamus, is significantly correlated to the medial frontal lobe. Activation in mediodorsal nuclei has been previously seen anecdotally in a patient with history of generalized tonic-clonic seizure (Aghakhani, 2004). In agreement with this finding, all ten patients in the present group have generalized tonic–clonic seizure. Another previous study by Moeller and colleague found that in 6 children patients with IGE (Moeller et al., 2008). They saw symmetrical medial thalamic activation, which is also in agreement with our observation. When we put the seed in the mediodorsal nuclei, its connectivity with the medial frontal cortex was replicated as expected in the IGE patients and again absent in healthy controls. In fact, the specific cortical projections of mediodorsal nucleus to the frontal cortex has long been reported in rodents and monkeys (Krettek and Price, 1977; Leonard, 1969; Price and Drevets, 2010). However, the different degree of connection between IGE patient group and the control group is unexpected. It may be explained that a strengthened connection between the two structures in each patient can make the spread of GSWDs and seizure activity progress quickly. Furthermore, the degrees of connectivity between these two structures also seem to be positively correlated, albeit not statistically significant, with the discharge rate of GSWDs. Interestingly, a similar fMRI connectivity study (Moeller et al., 2011) on IGE patients showed slight difference in connectivity for seed in the left mediodorsal nucleus of the thalamus compared with control. This is in partial agreement with our findings. The reason they did not see bithalamic correlation, or the connection between the thalamus and the cingulate cortex could be due to the fact that Moeller and colleagues selected the GSWD-free periods for their analysis, where we did not make such selection. Therefore, the effect they observed is weaker compared with ours.
However, bilateral superior gyri and the middle frontal superior gyrus, where strong GSWDs are observed from raw EEG, do not seem to be involved in a thalamocortical level network activity. Left and right superior gyri did show temporal correlation between the two. Bilateral insulae showed such correlation as well.
Despite the preprocessing steps taken in reducing the effect of noise, the periphery of the cortex is still prone to movement artifacts in the fMRI recording. Therefore, seed-based analysis in close vicinity of the periphery may contain erroneous connection caused by noise rather than neurophysiological activities, as seen in Fig. 3E, coronal view.
4.2. Functions of ACC in GSWD
Devinsky et al. (1995) reported that the anterior executive region formed by ACC around the rostrum of the corpus callosum has numerous projections into motor systems, which can be linked to the motor response such as uncontrolled jerking movement in tonic–clonic seizure. There is also evidence indicating correlation between the neural activity in the ACC and the degree of consciousness in patients with disorders of consciousness (DOC) (Qin et al., 2010). It was shown that slow delta wave activity was generated in the frontal area accompanying loss of consciousness post secondarily generalized partial seizures and complex partial seizures (Blumenfeld et al., 2009; Yang et al., 2012). This may partially explain another significant symptom of generalized epilepsy, such as the momentary loss of awareness during or post seizures.
4.3. Functions of mediodorsal nuclei
The central role of mediodorsal nuclei has been shown in the interconnected medial frontal cortico-striato-pallido-thalamic and amygdalo-striato-pallido-thalamic networks in multiple animal models ranging from rats to monkeys (Price and Drevets, 2010; Ray and Price, 1993, 1992; Russchen et al., 1987). The projections from mediodorsal nuclei to the amygdala and hippocampus form important circuitries that regulate emotions and memory (Price and Drevets, 2010). Not surprisingly, depression and memory loss are some of the prominent comorbidities in patients with epilepsy (Hesdorffer et al., 2000; Nilsson et al., 1997). However, we did not see explicit change in the seed-based functional connectivity between mediodorsal nuclei and amygdala or hippocampus. These changes may be too subtle or not time linked to GSWDs.
4.4. Predictive value of connectivity and epileptic activity
We initially hypothesized that the degree of global connectivity to the thalamus, which is defined as the total voxel counts within the brain that are correlated to the seed in the thalamus, may be indicative of the rate of occurrence of GSWDs. However, it appeared not to be the case. Instead, the number of voxels in the thalamus that are connected with the ACC alone appears to be positively correlated to the rate of GSWDs. Since ACC is probably related to the GSWD signals, the degree of connection between thalamus and ACC may be able to serve as a predictor of the level of activity observed on scalp. However, because of the limited recording period (up to 2.5 h total) of EEG in each patient, the actual GSWD rate may deviate from the value we obtained. This limitation could influence the strength of the correlation between the connectivity and discharge rate.
4.5. Hemodynamic response function
In this study, we used canonical HRF to convolve with spike timing to construct regressor in the EEG-informed fMRI step. Canonical HRF is the most widely used function to represent the link between electrophysiological activity and the corresponding hemodynamic activity. However, there have been several recent studies pointing out that a canonical HRF may not be the best in presenting the actual function, as it may vary from person to person or may even change from location to location (Bai et al., 2010; LeVan et al., 2010). To mitigate this issue, we opted for canonical HRF basis functions with time and dispersion derivatives which can model small differences in the latency and the duration of the peak response (Ashburner et al., 2010).
4.6. Causality measures
DTF and ADTF of EEG activity have been previously applied in finding driving sources in epileptic activities (Ding et al., 2007; He et al., 2011; Lin et al., 2009; Lu et al., 2012b). Our DTF findings showed a reciprocal causal relationship between the frontal cortex and the thalamus, where thalamus serves more as a driver. Specifically, mediodorsal nuclei of the thalamus have strong projection to the medial frontal cortex in the ACC area. The reverse projection is much weaker in comparison, approximately at half of the strength. The reciprocal directionality of Granger Causality is generally accepted (Ding and He, 2013). This particular thalamocortical reciprocal relationship is also in agreement with the understanding of the interconnected thalamocortical circuitry in generating spontaneous spike–waves in IGE (Blumenfeld, 2005). The crucial role of thalamus as part of the cortico-thalamo-cortical network, in sustaining seizures has been shown recently by Paz et al. in a rat model with optogenetics (Paz et al., 2013). Based on our ADTF finding (Fig. 6C), which shows the temporal evolution of the connectivity strength, thalamus seems to play an important role from the initiation to the propagation of the GSWDs. The main changes in the connectivity strength from the thalamus to the cortex occur as early as 50 ms before the start of the spike. It drops after the end of the slow wave discharge. This is in agreement with previously reported by Moeller et al. (2008) using EEG–fMRI, information exchange among the thalamocortical precedes the peak of the spike GSWD, though the changes we observed occur only 50 ms prior to the GSWD events, as opposed to the seconds level window observed by Moeller et al.
4.7. Method considerations
There are a few considerations regarding our approach that are worth noting. First, due to volume conduction effect, the time courses extracted using weighted minimum norm type of inverse source estimation algorithms might be smeared. It could result in cross-talk and false interactions. Other source localization approaches, such as nulling, where nulling constraints are used to cancel signals from specific cortical locations beamforming (Cheung et al., 2010; Hui et al., 2010), might be able to decrease such effects. However, these methods are not without their own limitations. For example, nulling beamformer requires that we know the locations and extent of the sources to be canceled. Such information is often not available in practical applications. Another potential issue with our model is that we only studied the relationships between the medial frontal cortex and the mediodorsal nuclei of the thalamus. This is because these structures were implicated by our EEG-informed fMRI and fMRI connectivity analysis. Other anatomical entities, such as other nuclei in the thalamus that were not included in the present study, or hippocampus, may potentially play a role in the network of generating GSWDs as well. Although seed-based connectivity analysis was performed on anterior nucleus and caudate nucleus of the thalamus (Supplementary Fig. S1) (Fig. 3D), we did not see they were involved in network level activity. Clusters that are temporally correlated to the seeds were confined to the close vicinity of each seed itself. It is possible, but unlikely, that the network activity was not in the form of temporal correlation and thus was not detected by our analysis method. Lastly, other causality measures, such as phase slope index (PSI) (Marzetti et al., 2008; Nolte et al., 2008), effective connectivity methods (DCM) (Friston, 2009; Murta et al., 2012) and structural equation models (SEM) may provide additional insight. Since such methods all require prior anatomically motivated assumptions, this ACC-mediodorsal nuclei network may serve as a model framework.
Supplementary Fig. S1.
Seed based connectivity analysis in the anterior nucleus of the thalamus.
A few other approaches using different recording systems may also help circumvent the volume conduction issue. For example, functional MRI, has excellent spatial resolution and whole brain coverage. But fMRI has limited temporal resolution due to hemodynamic effects. It was disputed whether fMRI can be a viable tool to study causal relationships, especially in the context of epilepsy research (David et al., 2008). It has been shown recently that by using a faster sampling rate, at the order of 250–500 ms repetition time (TR) it was possible to detect a multivariate network using Granger Causality in several simulation studies (Deshpande et al., 2010a,b). Unfortunately, the TR used in our study ranged from 2000 to 2500 ms. It may be too slow to delineate meaningful causal information at a scale of milliseconds or lower. With advancement in MRI acquisition techniques using multiband approaches, TR can be shortened to 400 ms (Feinberg et al., 2010; Uğurbil et al., 2013). At this rate, we may be able to extract causal information using fMRI time courses in future studies. Invasive recording using intracranial electrodes planted in the thalamus and cortex may provide the most direct measures of the neurophysiological activity and dynamic changes of GSWDs. Similar approach using Granger Causality and electrocorticalgraphy (ECoG) have been previously applied in seizure imaging with success (Wilke et al., 2011, 2010, 2008).
Additionally, we performed source reconstruction using sLORETA (Supplementary Fig. S2). The source of GSWD is located in the medial frontal lobe, more specifically, at the anterior cingulate cortex (ACC). Consistent with our results, Rodin et al. (1994) used regional dipoles to localize source of generalized epilepsy activities, and the location of equivalent dipole was around the midline of baso-frontal area. This location suggested by EEG source localization appeared to be plausible, given the general predominance of EEG in fronto-central region (Aghakhani, 2004; Montalenti et al., 2001). However a few recently published works suggested that potential spurious results may be yielded when applying source estimation methods to wide spread spike and wave discharges (Daunizeau et al., 2010; Kobayashi et al., 2005; Wennberg and Cheyne, 2013). Wennberg and Cheyne (2013) reported that despite intracranial evidence of cortical origins, the scalp EEG during K-complex was localized to deep brain regions using either dipole localization or distributed current density source imaging. While this finding was based on a low-density scalp electrode configuration (27 electrodes) in patients in whom intracranial EEG was available, Wennberg and Cheyne's results suggested the possibility of mislocalization of widespread bi-hemispheric activities to mid-deep brain (these authors also examined 87-ch scalp EEG in one healthy human volunteer without iEEG recordings). In our study, since there were no intracranial recordings in the patients studied, we cannot preclude the possibility of mislocalization of EEG sources due to technical limitations in solving the EEG inverse problem. However, our high-density EEG recording- (64-channel) based source analysis did return source locations that are in agreement with the EEG-informed fMRI results, a technique (Gotman et al., 2005) that is not based on inverse solutions. The middle frontal region was implicated by both approaches in the group of patients we studied. Further investigations are needed with regard to source localizations of GSWD. One possible approach is to validate using intracranial recordings. Another approach is to integrate BOLD fMRI to improve the EEG source localization accuracy (Dale and Sereno, 1993; Daunizeau et al., 2010, 2009; Liu and He, 2008; Pittau et al., 2012).
Supplementary Fig. S2.

EEG source localization results using sLORETA. A. Group average source localization results of all spikes. B. Time course of an example of independent component that has the highest correlation with the GSWD activity. C. Source localization using the spatial map of the independent component in B. D. Source localization at different time points of the GSWDs. Cortex was set at 50% transparency.
5. Conclusion
By combining the complementary strengths of EEG and fMRI, we showed consistent results concerning the originating and propagation of GSWDs. EEG-informed fMRI revealed multiple brain regions that may be involved in GSWDs. By means of seed-based fMRI, we tested the specific network level activity and found temporal correlation between cortical and bithalamic BOLD activities. According to the Granger Causality analysis the mediodorsal nuclei of the thalamus appears to serve as the main driver from the initiation and throughout the propagation of the GSWDs. Once validated, this work may provide insight in understanding the enigmatic etiology of generalized epilepsy and offer guidance in treatments.
The following are the supplementary data related to this article.
Supplementary material.
Acknowledgment
The authors would like to thank Mr. Keith Jamison, Dr. Lin Yang and Mr. Abbas Sohrabpour for the generous assistance and helpful discussions. This work was supported in part by NIH EB006433 and NSF CBET-1450956 and CBET-1264782.
References
- Aghakhani Y., Bagshaw A.P., Bénar C.G., Hawco C., Andermann F., Dubeau F., Gotman J. fMRI activation during spike and wave discharges in idiopathic generalized epilepsy. Brain. 2004;127(5):1127–1144. doi: 10.1093/brain/awh136. 15033899 [DOI] [PubMed] [Google Scholar]
- Ashburner J., Barnes G., Chen C.-C., Daunizeau J., Flandin G., Friston K., Gitelman D., Kiebel S., Kilner J., Litvak V., Moran R., Penny W., Stephan K., Gitelman D., Henson R., Hutton C., Glauche V., Mattout J., Phillips C. SPM. 2010. 8 Manual. [Google Scholar]
- Babiloni F., Cincotti F., Babiloni C., Carducci F., Mattia D., Astolfi L., Basilisco A., Rossini P.M., Ding L., Ni Y., Cheng J., Christine K., Sweeney J., He B. Estimation of the cortical functional connectivity with the multimodal integration of high-resolution EEG and fMRI data by directed transfer function. NeuroImage. 2005;24(1):118–131. doi: 10.1016/j.neuroimage.2004.09.036. 15588603 [DOI] [PubMed] [Google Scholar]
- Bai X., Vestal M., Berman R., Negishi M., Spann M., Vega C., Desalvo M., Novotny E.J., Constable R.T., Blumenfeld H. Dynamic Time course of typical childhood absence seizures: EEG, behavior, and functional magnetic resonance imaging. J. Neurosci. 2010;30(17):5884–5893. doi: 10.1523/JNEUROSCI.5101-09.2010. 20427649 [DOI] [PMC free article] [PubMed] [Google Scholar]
- Bell A.J., Sejnowski T.J. An information-maximization approach to blind separation and blind deconvolution. Neural Comput. 1995;7(6):1129–1159. doi: 10.1162/neco.1995.7.6.1129. 7584893 [DOI] [PubMed] [Google Scholar]
- Bernhardt B.C., Rozen D.A., Worsley K.J., Evans A.C., Bernasconi N., Bernasconi A. Thalamo-cortical network pathology in idiopathic generalized epilepsy: insights from MRI-based morphometric correlation analysis. Neuroimage. 2009;46(2):373–381. doi: 10.1016/j.neuroimage.2009.01.055. 19385011 [DOI] [PubMed] [Google Scholar]
- Blumenfeld H. From molecules to networks: cortical/subcortical interactions in the pathophysiology of idiopathic generalized epilepsy. Epilepsia. 2003;44:7–15. doi: 10.1046/j.1528-1157.44.s.2.2.x. 12752456 [DOI] [PubMed] [Google Scholar]
- Blumenfeld H. Cellular and network mechanisms of spike–wave seizures. Epilepsia. 2005;46:21–33. doi: 10.1111/j.1528-1167.2005.00311.x. 16302873 [DOI] [PubMed] [Google Scholar]
- Blumenfeld H., Varghese G.I., Purcaro M.J., Motelow J.E., Enev M., McNally K.A., Levin A.R., Hirsch L.J., Tikofsky R., Zubal I.G., Paige A.L., Spencer S.S. Cortical and subcortical networks in human secondarily generalized tonic–clonic seizures. Brain. 2009;132(4):999–1012. doi: 10.1093/brain/awp028. 19339252 [DOI] [PMC free article] [PubMed] [Google Scholar]
- Cheung B.L.P., Riedner B.A., Tononi G., Van Veen B.D. Estimation of cortical connectivity from EEG using state-space models. I.E.E.E. Trans. Biomed. Eng. 2010;57(9):2122–2134. doi: 10.1109/TBME.2010.2050319. 20501341 [DOI] [PMC free article] [PubMed] [Google Scholar]
- Dale A.M., Sereno M.I. Improved localization of cortical activity by combining EEG and MEG with MRI cortical surface reconstruction: a linear approach. J. Cogn. Neurosci. 1993;5(2):162–176. doi: 10.1162/jocn.1993.5.2.162. 23972151 [DOI] [PubMed] [Google Scholar]
- Daunizeau J., Laufs H., Friston K.J. EEG–fMRI information fusion: biophysics and data analysis. In: Mulert C., Lemieux L., editors. E.E.G.–FM.R.I. Springer; Berlin: 2009. pp. 511–526. [Google Scholar]
- Daunizeau J., Vaudano A.E., Lemieux L. Bayesian multi-modal model comparison: a case study on the generators of the spike and the wave in generalized spike–wave complexes. NeuroImage. 2010;49(1):656–667. doi: 10.1016/j.neuroimage.2009.06.048. 19559798 [DOI] [PubMed] [Google Scholar]
- David O., Guillemain I., Saillet S., Reyt S., Deransart C., Segebarth C., Depaulis A. Identifying neural drivers with functional MRI: an electrophysiological validation. PLOS Biol. 2008;6(12):2683–2697. doi: 10.1371/journal.pbio.0060315. 19108604 [DOI] [PMC free article] [PubMed] [Google Scholar]
- Delorme A., Makeig S. EEGLAB: an open source toolbox for analysis of single-trial EEG dynamics including independent component analysis. J. Neurosci. Methods. 2004;134(1):9–21. doi: 10.1016/j.jneumeth.2003.10.009. 15102499 [DOI] [PubMed] [Google Scholar]
- Deshpande G., Sathian K., Hu X. Assessing and compensating for zero-lag correlation effects in time-lagged Granger causality analysis of fMRI. I.E.E.E. Trans. Biomed. Eng. 2010;57(6):1446–1456. doi: 10.1109/TBME.2009.2037808. 20659822 [DOI] [PMC free article] [PubMed] [Google Scholar]
- Deshpande G., Sathian K., Hu X. Effect of hemodynamic variability on Granger causality analysis of fMRI. NeuroImage. 2010;52(3):884–896. doi: 10.1016/j.neuroimage.2009.11.060. 20004248 [DOI] [PMC free article] [PubMed] [Google Scholar]
- Devinsky O., Morrell M.J., Vogt B.A. Contributions of anterior cingulate cortex to behaviour. Brain. 1995;118(1):279–306. doi: 10.1093/brain/118.1.279. 7895011 [DOI] [PubMed] [Google Scholar]
- Ding L., Worrell G.A., Lagerlund T.D., He B. Ictal source analysis: localization and imaging of causal interactions in humans. NeuroImage. 2007;34(2):575–586. doi: 10.1016/j.neuroimage.2006.09.042. 17112748 [DOI] [PMC free article] [PubMed] [Google Scholar]
- Ding M., He B. Exploring functional and causal connectivity in the brain. In: He B., editor. Neural Engineering. Springer; US: 2013. pp. 545–564. [Google Scholar]
- Drury I., Henry T.R. Ictal patterns in generalized epilepsy. J. Clin. Neurophysiol. Off. Publ. Am. Electroencephalogr. Soc. 1993;10(3):268–280. doi: 10.1097/00004691-199307000-00003. 8408594 [DOI] [PubMed] [Google Scholar]
- Engel J., International League Against Epilepsy (ILAE) A proposed diagnostic scheme for people with epileptic seizures and with epilepsy: report of the ILAE Task Force on Classification and Terminology. Epilepsia. 2001;42(6):796–803. doi: 10.1046/j.1528-1157.2001.10401.x. 11422340 [DOI] [PubMed] [Google Scholar]
- Feinberg D.A., Moeller S., Smith S.M., Auerbach E., Ramanna S., Gunther M., Glasser M.F., Miller K.L., Ugurbil K., Yacoub E. Multiplexed echo planar imaging for sub-second whole brain FMRI and fast diffusion imaging. PLOS One. 2010;5(12):e15710. doi: 10.1371/journal.pone.0015710. 21187930 [DOI] [PMC free article] [PubMed] [Google Scholar]
- Fisher R., Salanova V., Witt T., Worth R., Henry T., Gross R., Oommen K., Osorio I., Nazzaro J., Labar D., Kaplitt M., Sperling M., Sandok E., Neal J., Handforth A., Stern J., DeSalles A., Chung S., Shetter A., Bergen D., Bakay R., Henderson J., French J., Baltuch G., Rosenfeld W., Youkilis A., Marks W., Garcia P., Barbaro N., Fountain N., Bazil C., Goodman R., McKhann G., Babu Krishnamurthy K., Papavassiliou S., Epstein C., Pollard J., Tonder L., Grebin J. Electrical stimulation of the anterior nucleus of thalamus for treatment of refractory epilepsy. Epilepsia. 2010;51(5):899–908. doi: 10.1111/j.1528-1167.2010.02536.x. 20331461 [DOI] [PubMed] [Google Scholar]
- Fox M.D., Snyder A.Z., Vincent J.L., Corbetta M., Van Essen D.C.V., Raichle M.E. The human brain is intrinsically organized into dynamic, anticorrelated functional networks. Proc. Natl. Acad. Sci. U. S. A. 2005;102(27):9673–9678. doi: 10.1073/pnas.0504136102. 15976020 [DOI] [PMC free article] [PubMed] [Google Scholar]
- Friston K. Causal modelling and brain connectivity in functional magnetic resonance imaging. PLOS Biol. 2009;7(2):e1000033. doi: 10.1371/journal.pbio.1000033. 19226186 [DOI] [PMC free article] [PubMed] [Google Scholar]
- Goebel R., Roebroeck A., Kim D.-S., Formisano E. Investigating directed cortical interactions in time-resolved fMRI data using vector autoregressive modeling and Granger causality mapping. Magn. Reson. Imaging. 2003;21(10):1251–1261. doi: 10.1016/j.mri.2003.08.026. 14725933 [DOI] [PubMed] [Google Scholar]
- Gotman J., Grova C., Bagshaw A., Kobayashi E., Aghakhani Y., Dubeau F. Generalized epileptic discharges show thalamocortical activation and suspension of the default state of the brain. Proc. Natl. Acad. Sci. U. S. A. 2005;102(42):15236–15240. doi: 10.1073/pnas.0504935102. 16217042 [DOI] [PMC free article] [PubMed] [Google Scholar]
- Granger C.W.J. Investigating causal relations by econometric models and Cross-spectral methods. Econometrica. 1969;37(3):424–438. [Google Scholar]
- Greicius M.D., Supekar K., Menon V., Dougherty R.F. Resting-state functional connectivity reflects structural connectivity in the default mode network. Cereb. Cortex. 2009;19(1):72–78. doi: 10.1093/cercor/bhn059. 18403396 [DOI] [PMC free article] [PubMed] [Google Scholar]
- Hamandi K., Salek-Haddadi A., Laufs H., Liston A., Friston K., Fish D.R., Duncan J.S., Lemieux L. EEG–fMRI of idiopathic and secondarily generalized epilepsies. Neuroimage. 2006;31(4):1700–1710. doi: 10.1016/j.neuroimage.2006.02.016. 16624589 [DOI] [PubMed] [Google Scholar]
- He B., Liu Z. Multimodal Functional Neuroimaging: Integrating Functional MRI and EEG/MEG. Biomedical Engineering, IEEE Reviews. 2008;1:23–40. doi: 10.1109/RBME.2008.2008233. [DOI] [PMC free article] [PubMed] [Google Scholar]
- He B., Dai Y., Astolfi L., Babiloni F., Yuan H., Yang L. eConnectome: a MatLab toolbox for mapping and imaging of brain functional connectivity. J. Neurosci. Methods. 2011;195(2):261–269. doi: 10.1016/j.jneumeth.2010.11.015. 21130115 [DOI] [PMC free article] [PubMed] [Google Scholar]
- He B., Ding L. Neural Engineering. Springer; Berlin: 2013. Electrophysiological neuroimaging; pp. 499–544. [Google Scholar]
- Hesdorffer D.C., Hauser W.A., Annegers J.F., Cascino G. Major depression is a risk factor for seizures in older adults. Ann. Neurol. 2000;47(2):246–249. 10665498 [PubMed] [Google Scholar]
- Holmes M.D., Tucker D.M., Quiring J.M., Hakimian S., Miller J.W., Ojemann J.G. Comparing noninvasive dense array and intracranial electroencephalography for localization of seizures. Neurosurgery. 2010;66(2):354–362. doi: 10.1227/01.NEU.0000363721.06177.07. 20087136 [DOI] [PubMed] [Google Scholar]
- Hui H.B., Pantazis D., Bressler S.L., Leahy R.M. Identifying true cortical interactions in MEG using the nulling beamformer. NeuroImage. 2010;49(4):3161–3174. doi: 10.1016/j.neuroimage.2009.10.078. 19896541 [DOI] [PMC free article] [PubMed] [Google Scholar]
- Jann K., Wiest R., Hauf M., Meyer K., Boesch C., Mathis J., Schroth G., Dierks T., Koenig T. BOLD correlates of continuously fluctuating epileptic activity isolated by independent component analysis. Neuroimage. 2008;42(2):635–648. doi: 10.1016/j.neuroimage.2008.05.001. 18585061 [DOI] [PubMed] [Google Scholar]
- Johnson M.D., Lim H.H., Netoff T.I., Connolly A.T., Johnson N., Roy A., Holt A., Lim K.O., Carey J.R., Vitek J.L., He B. Neuromodulation for brain disorders: challenges and opportunities. I.E.E.E. Trans. Biomed. Eng. 2013;60(3):610–624. doi: 10.1109/TBME.2013.2244890. 23380851 [DOI] [PMC free article] [PubMed] [Google Scholar]
- Jung K.-Y., Kim J.-M., Kim D.W., Chung C.-S. Independent component analysis of generalized spike-and-wave discharges: primary versus secondary bilateral synchrony. Clin. Neurophysiol. 2005;116(4):913–919. doi: 10.1016/j.clinph.2004.11.023. 15792901 [DOI] [PubMed] [Google Scholar]
- Kamiński M.J., Blinowska K.J. A new method of the description of the information flow in the brain structures. Biol. Cybern. 1991;65(3):203–210. doi: 10.1007/BF00198091. 1912013 [DOI] [PubMed] [Google Scholar]
- Kobayashi K., Yoshinaga H., Ohtsuka Y., Gotman J. Dipole modeling of epileptic spikes can be accurate or misleading. Epilepsia. 2005;46(3):397–408. doi: 10.1111/j.0013-9580.2005.31404.x. 15730537 [DOI] [PubMed] [Google Scholar]
- Koessler L., Benar C., Maillard L., Badier J.-M., Vignal J.P., Bartolomei F., Chauvel P., Gavaret M. Source localization of ictal epileptic activity investigated by high resolution EEG and validated by SEEG. NeuroImage. 2010;51(2):642–653. doi: 10.1016/j.neuroimage.2010.02.067. 20206700 [DOI] [PubMed] [Google Scholar]
- Krettek J.E., Price J.L. The cortical projections of the mediodorsal nucleus and adjacent thalamic nuclei in the rat. J. Comp. Neurol. 1977:157–191. doi: 10.1002/cne.901710204. 64477] [DOI] [PubMed] [Google Scholar]
- Lai Y., Zhang X., van Drongelen W., Korhman M., Hecox K., Ni Y., He B. Noninvasive cortical imaging of epileptiform activities from interictal spikes in pediatric patients. NeuroImage. 2011;54(1):244–252. doi: 10.1016/j.neuroimage.2010.07.026. 20643212 [DOI] [PMC free article] [PubMed] [Google Scholar]
- Lancaster J.L., Rainey L.H., Summerlin J.L., Freitas C.S., Fox P.T., Evans A.C., Toga A.W., Mazziotta J.C. Automated labeling of the human brain: a preliminary report on the development and evaluation of a forward-transform method. Hum. Brain Mapp. 1997;5(4):238–242. doi: 10.1002/(SICI)1097-0193(1997)5:4<238::AID-HBM6>3.0.CO;2-4. 20408222 [DOI] [PMC free article] [PubMed] [Google Scholar]
- Lancaster J.L., Woldorff M.G., Parsons L.M., Liotti M., Freitas C.S., Rainey L., Kochunov P.V., Nickerson D., Mikiten S.A., Fox P.T. Automated Talairach Atlas labels for functional brain mapping. Hum. Brain Mapp. 2000;10(3):120–131. doi: 10.1002/1097-0193(200007)10:3<120::AID-HBM30>3.0.CO;2-8. 10912591 [DOI] [PMC free article] [PubMed] [Google Scholar]
- Lantz G., Grave de Peralta R., Spinelli L., Seeck M., Michel C.M. Epileptic source localization with high density EEG: how many electrodes are needed? Clin. Neurophysiol. 2003;114(1):63–69. doi: 10.1016/s1388-2457(02)00337-1. 12495765 [DOI] [PubMed] [Google Scholar]
- Leonard C.M. The prefrontal cortex of the rat. I. Cortical projection of the mediodorsal nucleus. II. Efferent connections. Brain Res. 1969;12(2):321–343. doi: 10.1016/0006-8993(69)90003-1. 4184997 [DOI] [PubMed] [Google Scholar]
- LeVan P., Tyvaert L., Gotman J. Modulation by EEG features of BOLD responses to interictal epileptiform discharges. NeuroImage. 2010;50(1):15–26. doi: 10.1016/j.neuroimage.2009.12.044. 20026222 [DOI] [PMC free article] [PubMed] [Google Scholar]
- Lin F.-H., Hara K., Solo V., Vangel M., Belliveau J.W., Stufflebeam S.M., Hämäläinen M.S. Dynamic Granger–Geweke causality modeling with application to interictal spike propagation. Hum. Brain Mapp. 2009;30(6):1877–1886. doi: 10.1002/hbm.20772. 19378280 [DOI] [PMC free article] [PubMed] [Google Scholar]
- Liu Z., de Zwart J.A., van Gelderen P., Kuo L.-W., Duyn J.H. Statistical feature extraction for artifact removal from concurrent fMRI–EEG recordings. NeuroImage. 2012;59(3):2073–2087. doi: 10.1016/j.neuroimage.2011.10.042. 22036675 [DOI] [PMC free article] [PubMed] [Google Scholar]
- Liu Z., He B. fMRI–EEG integrated cortical source imaging by use of time-variant spatial constraints. NeuroImage. 2008;39(3):1198–1214. doi: 10.1016/j.neuroimage.2007.10.003. 18036833 [DOI] [PMC free article] [PubMed] [Google Scholar]
- Lowe M.J., Mock B.J., Sorenson J.A. Functional connectivity in single and multislice echoplanar imaging using resting-state fluctuations. NeuroImage. 1998;7(2):119–132. doi: 10.1006/nimg.1997.0315. 9558644 [DOI] [PubMed] [Google Scholar]
- Lu Y., Yang L., Worrell G.A., Brinkmann B., Nelson C., He B. Dynamic imaging of seizure activity in pediatric epilepsy patients. Clin. Neurophysiol. 2012;123(11):2122–2129. doi: 10.1016/j.clinph.2012.04.021. 22608485 [DOI] [PMC free article] [PubMed] [Google Scholar]
- Lu Y., Yang L., Worrell G.A., He B. Seizure source imaging by means of FINE spatio-temporal dipole localization and directed transfer function in partial epilepsy patients. Clin. Neurophysiol. 2012;123(7):1275–1283. doi: 10.1016/j.clinph.2011.11.007. 22172768 [DOI] [PMC free article] [PubMed] [Google Scholar]
- Marques J.P., Rebola J., Figueiredo P., Pinto A., Sales F., Castelo-Branco M. ICA decomposition of EEG signal for fMRI processing in epilepsy. Hum. Brain Mapp. 2009;30(9):2986–2996. doi: 10.1002/hbm.20723. 19172633 [DOI] [PMC free article] [PubMed] [Google Scholar]
- Marzetti L., Del Gratta C., Nolte G. Understanding brain connectivity from EEG data by identifying systems composed of interacting sources. NeuroImage. 2008;42(1):87–98. doi: 10.1016/j.neuroimage.2008.04.250. 18539485 [DOI] [PubMed] [Google Scholar]
- Michel C.M., Lantz G., Spinelli L., De Peralta R.G., Landis T., Seeck M. 128-channel EEG source imaging in epilepsy: clinical yield and localization precision. J. Clin. Neurophysiol. Off. Publ. Am. Electroencephalogr. Soc. 2004;21(2):71–83. doi: 10.1097/00004691-200403000-00001. 15284597 [DOI] [PubMed] [Google Scholar]
- Moeller F., Maneshi M., Pittau F., Gholipour T., Bellec P., Dubeau F., Grova C., Gotman J. Functional connectivity in patients with idiopathic generalized epilepsy. Epilepsia. 2011;52(3):515–522. doi: 10.1111/j.1528-1167.2010.02938.x. 21269293 [DOI] [PMC free article] [PubMed] [Google Scholar]
- Moeller F., Siebner H.R., Wolff S., Muhle H., Boor R., Granert O., Jansen O., Stephani U., Siniatchkin M. Changes in activity of striato-thalamo-cortical network precede generalized spike wave discharges. Neuroimage. 2008;39(4):1839–1849. doi: 10.1016/j.neuroimage.2007.10.058. 18082429 [DOI] [PubMed] [Google Scholar]
- Montalenti E., Imperiale D., Rovera A., Bergamasco B., Benna P. Clinical features, EEG findings and diagnostic pitfalls in juvenile myoclonic epilepsy: a series of 63 patients. J. Neurol. Sci. 2001;184(1):65–70. doi: 10.1016/s0022-510x(00)00496-2. 11231034 [DOI] [PubMed] [Google Scholar]
- Murta T., Leal A., Garrido M.I., Figueiredo P. Dynamic causal modelling of epileptic seizure propagation pathways: a combined EEG–fMRI study. Neuroimage. 2012;62(3):1634–1642. doi: 10.1016/j.neuroimage.2012.05.053. 22634857 [DOI] [PMC free article] [PubMed] [Google Scholar]
- Niazy R.K., Beckmann C.F., Iannetti G.D., Brady J.M., Smith S.M. Removal of FMRI environment artifacts from EEG data using optimal basis sets. Neuroimage. 2005;28(3):720–737. doi: 10.1016/j.neuroimage.2005.06.067. 16150610 [DOI] [PubMed] [Google Scholar]
- Nilsson L., Tomson T., Farahmand B.Y., Diwan V., Persson P.G. Cause-specific mortality in epilepsy: a cohort study of more than 9,000 patients once hospitalized for epilepsy. Epilepsia. 1997;38(10):1062–1068. doi: 10.1111/j.1528-1157.1997.tb01194.x. 9579951 [DOI] [PubMed] [Google Scholar]
- Nolte G., Ziehe A., Nikulin V.V., Schlögl A., Krämer N., Brismar T., Müller K.-R. Robustly estimating the flow direction of information in complex physical systems. Phys. Rev. Lett. 2008;100(23):234101. doi: 10.1103/PhysRevLett.100.234101. 18643502 [DOI] [PubMed] [Google Scholar]
- O'Muircheartaigh J., Vollmar C., Barker G.J., Kumari V., Symms M.R., Thompson P., Duncan J.S., Koepp M.J., Richardson M.P. Abnormal thalamocortical structural and functional connectivity in juvenile myoclonic epilepsy. Brain. 2012;135(12):3635–3644. doi: 10.1093/brain/aws296. 23250883 [DOI] [PMC free article] [PubMed] [Google Scholar]
- Paz J.T., Davidson T.J., Frechette E.S., Delord B., Parada I., Peng K., Deisseroth K., Huguenard J.R. Closed-loop optogenetic control of thalamus as a tool for interrupting seizures after cortical injury. Nat. Neurosci. 2013;16(1):64–70. doi: 10.1038/nn.3269. 23143518 [DOI] [PMC free article] [PubMed] [Google Scholar]
- Pittau F., Dubeau F., Gotman J. Contribution of EEG/fMRI to the definition of the epileptic focus. Neurology. 2012;78(19):1479–1487. doi: 10.1212/WNL.0b013e3182553bf7. 22539574 [DOI] [PMC free article] [PubMed] [Google Scholar]
- Price J.L., Drevets W.C. Neurocircuitry of mood disorders. Neuropsychopharmacology. 2010;35(1):192–216. doi: 10.1038/npp.2009.104. 19693001 [DOI] [PMC free article] [PubMed] [Google Scholar]
- Qin P., Di H., Liu Y., Yu S., Gong Q., Duncan N., Weng X., Laureys S., Northoff G. Anterior cingulate activity and the self in disorders of consciousness. Hum. Brain Mapp. 2010;31(12):1993–2002. doi: 10.1002/hbm.20989. 20336686 [DOI] [PMC free article] [PubMed] [Google Scholar]
- Raichle M.E., MacLeod A.M., Snyder A.Z., Powers W.J., Gusnard D.A., Shulman G.L. A default mode of brain function. Proc. Natl. Acad. Sci. U. S. A. 2001;98(2):676–682. doi: 10.1073/pnas.98.2.676. 11209064 [DOI] [PMC free article] [PubMed] [Google Scholar]
- Ray J.P., Price J.L. The organization of the thalamocortical connections of the mediodorsal thalamic nucleus in the rat, related to the ventral forebrain–prefrontal cortex topography. J. Comp. Neurol. 1992;323(2):167–197. doi: 10.1002/cne.903230204. 1401255 [DOI] [PubMed] [Google Scholar]
- Ray J.P., Price J.L. The organization of projections from the mediodorsal nucleus of the thalamus to orbital and medial prefrontal cortex in macaque monkeys. J. Comp. Neurol. 1993;337(1):1–31. doi: 10.1002/cne.903370102. 7506270 [DOI] [PubMed] [Google Scholar]
- Rodin E.A., Rodin M.K., Thompson J.A. Source analysis of generalized spike–wave complexes. Brain Topogr. 1994;7(2):113–119. doi: 10.1007/BF01186769. 7696088 [DOI] [PubMed] [Google Scholar]
- Russchen F.T., Amaral D.G., Price J.L. The afferent input to the magnocellular division of the mediodorsal thalamic nucleus in the monkey, Macaca fascicularis. J. Comp. Neurol. 1987;256(2):175–210. doi: 10.1002/cne.902560202. 3549796 [DOI] [PubMed] [Google Scholar]
- Seeley W.W., Menon V., Schatzberg A.F., Keller J., Glover G.H., Kenna H., Reiss A.L., Greicius M.D. Dissociable intrinsic connectivity networks for salience processing and executive control. J. Neurosci. 2007;27(9):2349–2356. doi: 10.1523/JNEUROSCI.5587-06.2007. 17329432 [DOI] [PMC free article] [PubMed] [Google Scholar]
- Seneviratne U., Cook M., D'Souza W. The electroencephalogram of idiopathic generalized epilepsy. Epilepsia. 2012;53(2):234–248. doi: 10.1111/j.1528-1167.2011.03344.x. 22150583 [DOI] [PubMed] [Google Scholar]
- Sohrabpour A., Lu Y., Kankirawatana P., Blount J., Kim H., He B. 2015. Effect of EEG electrode number on epileptic source localization in pediatric patients.25088733 [DOI] [PMC free article] [PubMed] [Google Scholar]
- Uğurbil K., Xu J., Auerbach E.J., Moeller S., Vu A.T., Duarte-Carvajalino J.M., Lenglet C., Wu X., Schmitter S., Van de Moortele P.F., Strupp J., Sapiro G., De Martino F., Wang D., Harel N., Garwood M., Chen L., Feinberg D.A., Smith S.M., Miller K.L., Sotiropoulos S.N., Jbabdi S., Andersson J.L.R., Behrens T.E.J., Glasser M.F., Van Essen D.C., Yacoub E., WU-Minn HCP Consortium Pushing spatial and temporal resolution for functional and diffusion MRI in the Human Connectome Project. NeuroImage. 2013;80:80–104. doi: 10.1016/j.neuroimage.2013.05.012. 23702417 [DOI] [PMC free article] [PubMed] [Google Scholar]
- Wennberg R., Cheyne D. On noninvasive source imaging of the human K-complex. Clin. Neurophysiol. 2013;124(5):941–955. doi: 10.1016/j.clinph.2012.10.022. 23200316 [DOI] [PubMed] [Google Scholar]
- Wilke C., Ding L., He B. Estimation of time-varying connectivity patterns through the use of an adaptive directed transfer function. I.E.E.E. Trans. Biomed. Eng. 2008;55(11):2557–2564. doi: 10.1109/TBME.2008.919885. 18990625 [DOI] [PMC free article] [PubMed] [Google Scholar]
- Wilke C., Van Drongelen W., Kohrman M., He B. Neocortical seizure foci localization by means of a directed transfer function method. Epilepsia. 2010;51(4):564–572. doi: 10.1111/j.1528-1167.2009.02329.x. 19817817 [DOI] [PMC free article] [PubMed] [Google Scholar]
- Wilke C., Worrell G., He B. Graph analysis of epileptogenic networks in human partial epilepsy. Epilepsia. 2011;52(1):84–93. doi: 10.1111/j.1528-1167.2010.02785.x. 21126244 [DOI] [PMC free article] [PubMed] [Google Scholar]
- Yang L., Wilke C., Brinkmann B., Worrell G.A., He B. Dynamic imaging of ictal oscillations using non-invasive high-resolution EEG. NeuroImage. 2011;56(4):1908–1917. doi: 10.1016/j.neuroimage.2011.03.043. 21453776 [DOI] [PMC free article] [PubMed] [Google Scholar]
- Yang L., Worrell G.A., Nelson C., Brinkmann B., He B. Spectral and spatial shifts of post-ictal slow waves in temporal lobe seizures. Brain. 2012;135(10):3134–3143. doi: 10.1093/brain/aws221. 22923634 [DOI] [PMC free article] [PubMed] [Google Scholar]
- Zhang C.H., Lu Y., Brinkmann B., Welker K., Worrell G., He B. Lateralization and localization of epilepsy related hemodynamic foci using presurgical fMRI. Clin. Neurophysiol. 2015;126(1):27–38. doi: 10.1016/j.clinph.2014.04.011. 24856460 [DOI] [PMC free article] [PubMed] [Google Scholar]
- Zhang Z., Liao W., Chen H., Mantini D., Ding J.-R., Xu Q., Wang Z., Yuan C., Chen G., Jiao Q., Lu G. Altered functional–structural coupling of large-scale brain networks in idiopathic generalized epilepsy. Brain. 2011;134(10):2912–2928. doi: 10.1093/brain/awr223. 21975588 [DOI] [PubMed] [Google Scholar]
Associated Data
This section collects any data citations, data availability statements, or supplementary materials included in this article.
Supplementary Materials
Supplementary material.