Significance
Combining acoustic metamaterials and compressive sensing, we demonstrate here a single-sensor multispeaker listening system that functionally mimics the selective listening and sound separation capabilities of human auditory systems. Different from previous research efforts that generally rely on signal and speech processing techniques to solve the “cocktail party” listening problem, our proposed method is a unique hardware-based approach by exploiting carefully designed acoustic metamaterials. We not only believe that the results of this work are significant for communities of various disciplines that have been pursuing the understanding and engineering of cocktail party listening over the past decades, but also that the system design approach of combining physical layer design and computational sensing will impact on traditional acoustic sensing and imaging modalities.
Keywords: metamaterials, cocktail party problem, compressive sensing
Abstract
Designing a “cocktail party listener” that functionally mimics the selective perception of a human auditory system has been pursued over the past decades. By exploiting acoustic metamaterials and compressive sensing, we present here a single-sensor listening device that separates simultaneous overlapping sounds from different sources. The device with a compact array of resonant metamaterials is demonstrated to distinguish three overlapping and independent sources with 96.67% correct audio recognition. Segregation of the audio signals is achieved using physical layer encoding without relying on source characteristics. This hardware approach to multichannel source separation can be applied to robust speech recognition and hearing aids and may be extended to other acoustic imaging and sensing applications.
The “cocktail party” or multispeaker listening problem is inspired by the remarkable ability of the human’s auditory system in selectively attending to one speaker or audio signal in a multiple-speaker noisy environment (1, 2). Over the past half a century (3), the quest to understand the underlying mechanism (4–6) and build functionally similar devices has motivated significant research efforts (4–8).
Previously proposed engineered multispeaker listening systems generally fall into two categories. The first kind is based on audio features and linguistic models of speech. For example, harmonic characteristics, temporal continuity, onset/offset of speech units combined with hidden Markov language models can be used to group overlapping audio signals into different sources (7, 9, 10). The drawback of such an approach is that certain audio characteristics have to be assumed (e.g., nonoverlapping in spectrogram) and linguistic model-based estimation can be very computationally intensive. The second kind relies on multisensor arrays to spatially filter sources (11). The need for multiple transducers and system complexity are the major disadvantages of the second approach.
In this work, we demonstrate a multispeaker listening system that separates overlapping simultaneous conversations by leveraging the wave modulation capabilities of acoustic metamaterials. Acoustic metamaterials are a broad family of engineered materials which can be designed to possess flexible and unusual effective properties (12, 13). In the past, acoustic metamaterials with high anisotropy (14, 15), extreme nonlinearity (16), or negative dynamic parameters (density, bulk modulus, refractive index) (17–20) have been realized. Applications such as scattering reducing sound cloak (21, 22), beam steering metasurface (23), and other wave manipulating devices (24–27) have been proposed and demonstrated. We demonstrate here that acoustic metamaterials can also be useful for encoding independent acoustic signals coming from different spatial locations by creating highly frequency-dependent and spatially complex measurement modes (28), and aid the solution finding for the inverse problem. Such physical layer encoding scheme exploits the spatiotemporal degrees of freedom of complex media, which contribute to a variety of random scattering-based sensing and wave-controlling techniques (29–32) and a recently demonstrated radiofrequency metamaterial-based imager (33). The listening system we demonstrate here provides a hardware-based computational sensing method for functionally mimicking cocktail party listening.
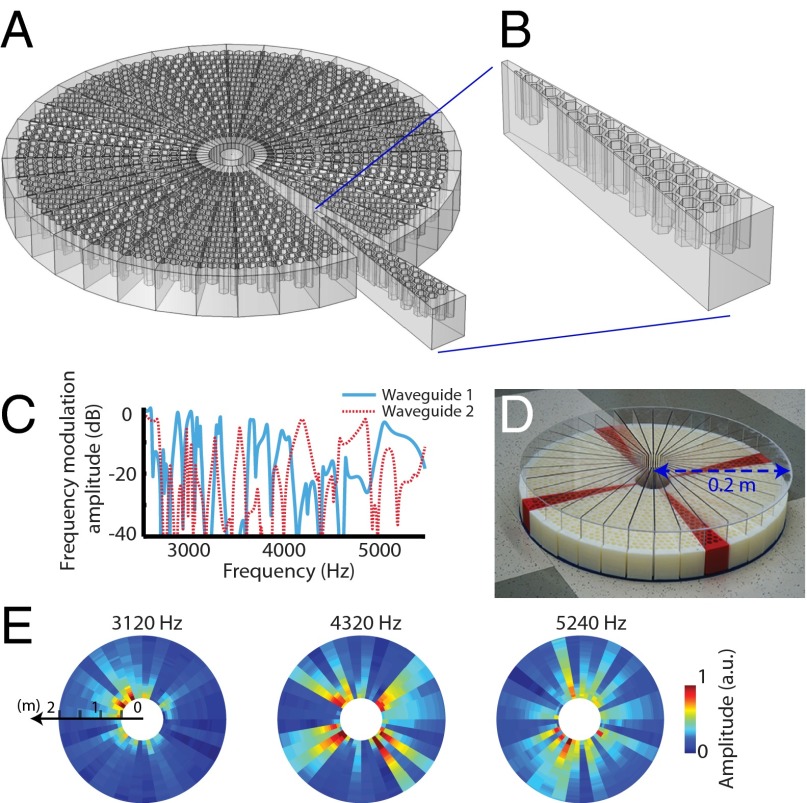
Inspired by the frequency-dependent filtering mechanism of the human cochlea system (1), we designed our multispeaker listening system with carefully engineered metamaterials to perform dispersive frequency modulation. This modulation is produced by an array of Helmholtz resonators, whose heights determine their resonating frequencies. The sensing system is shown in Fig. 1. The single sensor at the center is surrounded by 36 fan-like waveguides that cover 360° of azimuth. Each waveguide possesses a unique and highly frequency-dependent response (two examples are plotted in Fig. 1C), which is generated by the resonators with randomly selected resonant dispersion. The randomized modulation from all of the waveguides “scrambles” the original omnidirectional measurement modes of the single sensor. As a result, the measurement modes are complex in both the spatial and spectral dimensions. For example, in Fig. 1E, three modes measured at different frequencies are shown. Such location-dependent frequency modulation provides both spatial and spectral resolution to the inversion task (34).
Fig. 1.
(A) The 0.2-m radius structure of the metamaterial multispeaker listener and (B) one fan-like waveguide. (C) The frequency modulation of two fan-like waveguides obtained from simulation. (D) Fabricated prototype of the listener. (E) Measured amplitude patterns (normalized) of the measurement modes at 3,120, 4,320, and 5,240 Hz, respectively.
We can describe our sensing system with a general sampling model as , where is the vector form of the measured data (measurement vector); is the object vector to be estimated. The measurement matrix , which represents the forward model of the sensing system, is formed by stacking rows of linear sampling vectors [also known as test functions (35)] at sequentially indexed frequencies. This matrix is randomized by the physical properties of the metamaterials to generate highly uncorrelated information channels for sound wave from different azimuths and ranges. The level of randomization of the matrix determines the supported resolution and the multiplexing capability of the sensing system.
To quantify the signal encoding capacities of the modulation channels, here we have chosen the average mutual coherence as the metric of the sensing performance (36). ranges from a desirable 0 (indicating perfectly orthogonal modulation channels) to a useless 1 (indicating identical and thus indistinguishable modulation channels). Average mutual coherence is directly related to the mean-squared error (MSE) of the reconstruction (36). The frequency responses of the modulation channels that are used for calculating the average mutual coherences are obtained from the Fourier transform of the measured impulse responses of each spatial location. For our experiment presented here, the metamaterials are shown to provide to the sensing task an average mutual coherence of 0.198. In contrast, an omnidirectional sensor without the metamaterial coating exhibits an average mutual coherence of 0.929. (Details concerning the calculation of average mutual coherence and other quantitative characterization of the measurement matrix can be found in the Supporting Information.
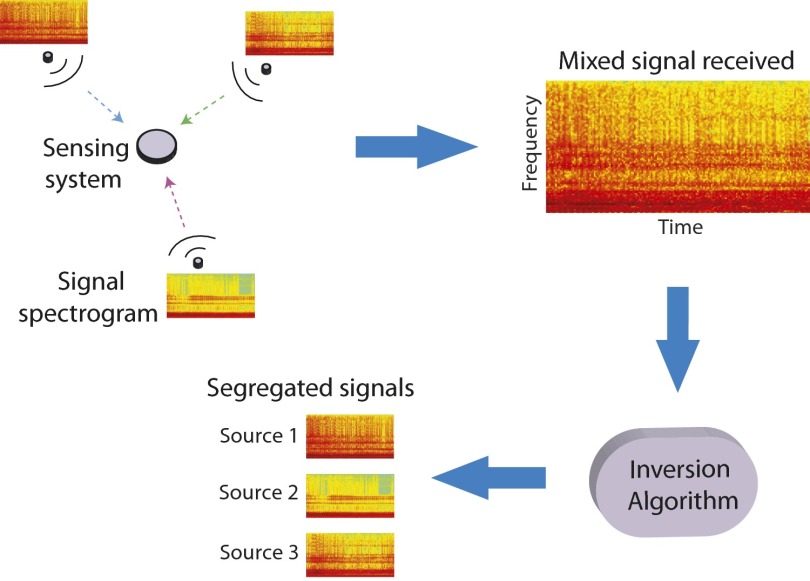
A multispeaker listening system should provide information about “who” is saying “what.” We thus design our sensing experiment as follows: Multiple sound sources simultaneously emit a sequence of independent audio messages (acting as a “conversation”). Each component of the conversation consists of 40 “words” randomly selected from a library containing 100 distinct but broadband synthesized pulses. The sound waves emitted from the sources first propagate in the free space and then are modulated by the encoding channels offered by the metamaterials, before they are collected as a single mixed waveform. In the data processing stage, the inversion algorithm segregates the mixed waveform and reconstructs the audio content of each source. The concept schematic of the measurement and reconstruction process is shown in Fig. 2. A Fourier component of the collected signal can be expressed as the superposition of the responses from all of the waveguides at this frequency: , where is the response from the ith waveguide. The measured data vector used for reconstruction is , and the object vector is a scalar vector containing elements ( is the number of the possible locations and is the size of the finite audio library). Because of the sparsity of (only several elements are nonzero, corresponding to the activated sources), the sensing process is an ideal fit for the framework of compressive sensing. L1-norm regularization is performed with the Two-step Iterative Shrinkage/Thresholding (TwIST) algorithm (37) to solve the ill-posed inverse problem.
Fig. 2.
Schematic of the measurement and reconstruction process.
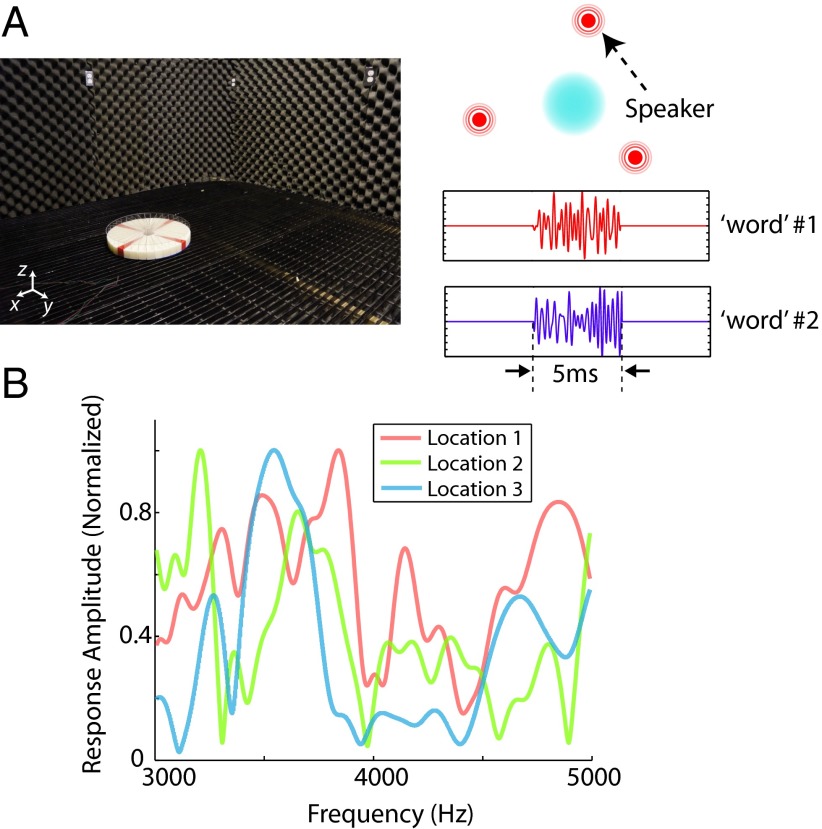
To examine the capability of the metamaterial sensing system in audio segregation, and ruling out other factors such as complex background [which may aid the reconstruction if they are well-characterized (38)], the tests were performed in an anechoic chamber as shown in Fig. 3. Three independent speakers were used as sources to emit words randomly selected from the predefined synthesized library. The measurement vector used as the input for the algorithm contains 51 complex elements corresponding to the discretized frequency responses between 3,000 and 5,000 Hz with an interval of 40 Hz. Compared with the 300 source location–audio pair possibilities (possible combinations of 3 source locations and 100 broadband signals), a compression factor of about 6:1 is achieved.
Fig. 3.
(A) Measurement performed in an anechoic chamber. (Left) Photo of the metamaterial listener in the chamber. (Right) Schematic of the setup and two examples of synthesized word. (B) Measured transfer functions for the locations of three speakers.
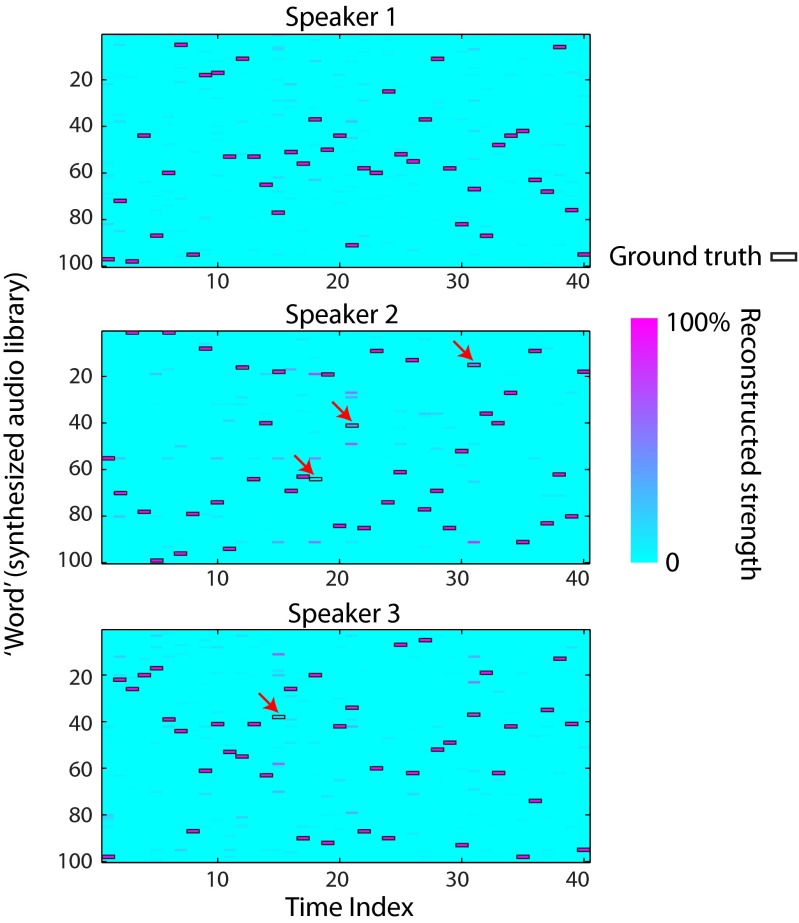
The results shown in Fig. 4 exhibit the reconstruction for each source location–audio combination, where the more purple color indicates higher signal strength. The ground truth marked with black rectangular boxes indicates three overlapping simultaneous speeches in a conversation. The metamaterial listener provides a faithful reconstruction with an average MSE of about 0.08. In contrast, when the metamaterial coating is removed and only an omnidirectional sensor is used to collect the overlapping audio signals, the reconstruction is too poor to provide separated information about the sources (MSE = 1.99; see the Supporting Information for the results of the controlled experiment without metamaterials), which is expected as the transfer functions from the source locations to the sensor are less different (or more mutually coherent) from each other in the case without metamaterials. If the prior knowledge that each source sends out one audio message at each time index is applied, we can define a recognized audio by selecting the message with the highest strength for each source at every time index. The recognition ratio can thus be calculated as the number of the recognized audio over the total number of the audio messages. For the case with metamaterials, the average recognition ratio for the three sources is 96.67%, whereas that for the case without metamaterials is close to zero. The results indicate that metamaterials contribute significantly in creating a forward model that aids the inversion of the sensing task.
Fig. 4.
Reconstruction results for three-speaker conversation. The black rectangles are ground truth and the purple color patches indicate the strength of reconstruction. Out of 40 time indices, on average 38.67 audios are correctly recognized (averaged over three sources) by comparing the audio of the maximum reconstructed strength with the ground truth. The incorrect recognitions are marked with red arrows.
Our proposed multispeaker listening system functionally mimics the selective listening capability of human auditory systems. The system employs only a single sensor, yet it can reconstruct the segregated signals with high fidelity. The device is also very simple and robust, as the passive metamaterial structure modulates the signal and, other than the microphone, no electronic or active components are used. The system proposed here does not rely on linguistic models or data mining algorithms (although it could be combined with such to extend its functionality) and has the advantages of low cost and low computational complexity. We also want to note that our demonstrated design does not reflect the mechanism of the cocktail party listening of human auditory systems, which is far more complicated and involves acoustic, cognitive, visual, as well as psychological factors (1–9).
In conclusion, we have demonstrated here an acoustic metamaterial-based multispeaker listener. Results of multiple-source audio segregation are demonstrated. We envision that it can be useful for multisource speech recognition and segregation, which are desired in many handheld, tabletop interactive devices. Besides, by extending such physical layer modulation approach to other applicable frequency ranges, we may expect other acoustic sensing and imaging applications such as hearing aid or ultrasound imaging.
Materials and Methods
The metamaterial listener prototype was fabricated with acrylonitrile butadiene styrene plastics using fused filament fabrication 3D printing technology. The design process was aided with a commercial full-wave simulation package COMSOL Multiphysics. Three-dimensional simulations with Pressure Acoustics Module were conducted to extract the frequency responses of all of the waveguides. The multispeaker listening experiment was performed in an anechoic chamber and multiple speakers used as audio sources were deployed on the floor of the chamber. Detailed discussions concerning the forward model derivation, the quality metric of the reconstruction, measurement matrix evaluation, the spatiotemporal degrees of freedom of the measurement modes, as well as the advantages of using metamaterials, can be found in the Supporting Information. The results of the controlled experiment without metamaterials and the multispeaker listening experiments with different configurations of sources can also be found in the Supporting Information.
SI Materials and Methods
Metamaterial-Based Resonances Design.
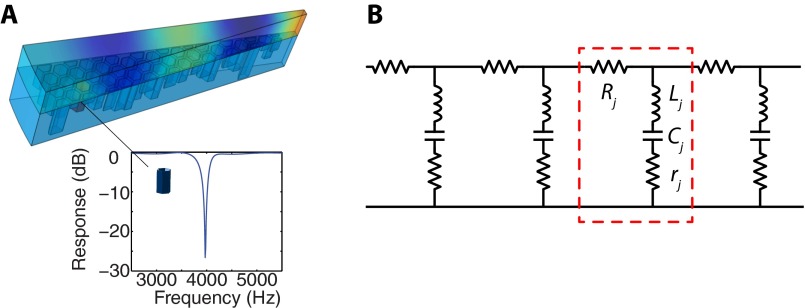
The resonating dispersion of each waveguide is contributed by an array of Helmholtz resonators distributed within the fan-shaped area. Such side branch resonators are commonly used as acoustic filters (39). The resonating frequency can be estimated as , where is the speed of sound, is the height of the resonator, and is the effective height increase due to the opening. Fig. S1A (Inset) shows the dispersion of the transmission of a resonator numerically retrieved from simulation.
Fig. S1.
(A) Fan-like waveguide with one resonator highlighted. (Inset) Simulation result of the amplitude of the transmission of the waveguide with only the contribution from the highlighted resonator. (B) Band-stop equivalent lumped elements network representation of the waveguide.
To aid the design of the sensing system, we model the resonator using lumped elements. For a side branch resonator indexed as j in the ith waveguide, the complex transmission can be expressed as . The ith waveguide is essentially a band-stop frequency filtering network composed of an array of resonators, as shown in Fig. S1B. The resonances are randomized and contribute to a measurement matrix that favors compressive sensing, as will be explained in SI Text, Supporting Information, below.
Experimental Setup.
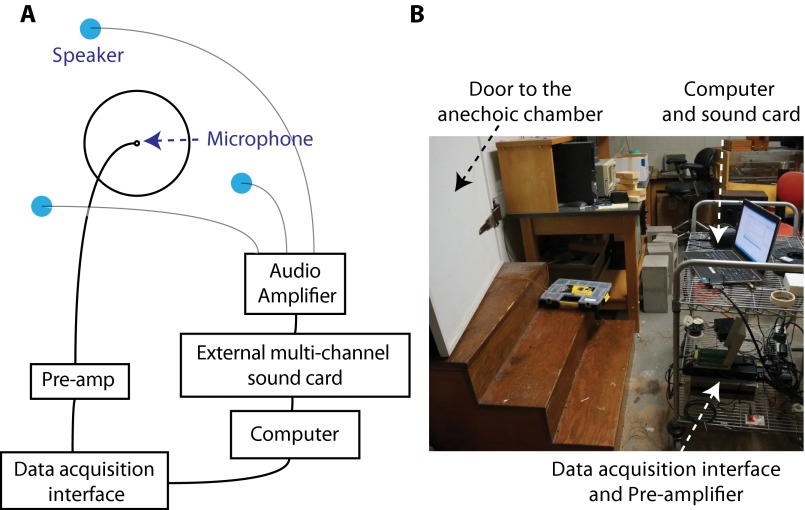
The layout of the experimental setup of the system is shown in Fig. S2. The metamaterial multispeaker listener is deployed on the floor of an anechoic chamber. The sensor at the center is an omnidirectional surface mount microelectromechanical microphone (Analog Devices ADMP401). The signal acquired by the microphone is sent to a preamplifier (Stanford Research SR560) before being digitized by a data acquisition device (NI PCI-6251). Multiple speakers are used as audio sources. They are placed on the floor of the chamber and mounted toward the ceiling so that the radiation of each is symmetrical with respect to the z axis (perpendicular to the floor).
Fig. S2.
(A) Schematic of the system layout. (B) Photograph of the data acquisition platform outside of the anechoic chamber.
A library of 100 broadband pulses were used as words for the multispeaker listening experiment. Each word has a length of 5 ms and the adjacent words are separated by a pause of 1 s to avoid overlapping of signals of different time indices. All of the words are synthesized by superposing randomized truncated cosine waves whose center frequencies span the spectral range of interest. The time-domain expression of a synthesized word can be expressed as , where and are computer-generated pseudorandom numbers within the range and , respectively. Two examples are shown in Fig. 3A (Inset) in the main text.
SI Text
Forward Model Derivation.
Assuming the resonances in each waveguide are distributed sparsely over the interested frequency range and only first-order filtering responses dominate, the overall frequency modulation of a waveguide can be approximated by the multiplication of the individual responses of the resonators: . For a source located at , the frequency response can be derived by propagating the waveguide responses from each waveguide aperture to the source location : , where is the spectrum of the audio signal from the source, is the waveguide radiation pattern which is mostly determined by the shape of the waveguide aperture, and is the Green’s function from the location of the aperture of the ith waveguide to the location . The coefficient includes all other factors such as sensor and speaker responses that are uniform for different source locations and audio signals.
Each column of the measurement matrix
represents the discretized Fourier components of a source emitting an audio message from the predefined library from one of the possible locations in the scene. The number of columns of the matrix is , where is the number of possible locations and is the size of the audio library. An element in the measurement matrix can be expressed as
Each row of the measurement matrix represents a test function for the object vector at one frequency, because a measurement value in the measured data vector is sampled in the way defined by the test function as , where the angle bracket indicates the inner product. The randomization of the measurement matrix for this sensing system is contributed by the carefully designed waveguide responses . Discussions on the quantified characterization of the measurement matrix are detailed in SI Text, Measurement Matrix Evaluation, below.
Reconstruction Quality Metric.
The average MSE is used as a metric to quantify the reconstruction quality. It is defined as , where is the number of all the possible source locations, is the maximum time index, is the reconstruction vector for the kth source at time index , and is the ground-truth vector for the same source at the time index. In our experiment, the nonzero values in the object vector (ground truth) are set to unity. However, nonunity relative amplitudes in the object vector in principle can still be reconstructed by the L1-norm regularization inverse algorithm (37).
Measurement Matrix Evaluation.
The measurement matrix reflects the physical properties of the sampling process (such as the efficiency of phase and amplitude modulations and the spectral responses of the measurement). Here we discuss the performance of measurement matrix, including the resolution and the stability of the inverse estimation.
The resolution of the inverse problem is associated with the number of measurement M and the sampling efficiency of those measurement modes. In compressive sensing, M is less than the dimensionality of the object vector N, which means that without any prior information, the measurement cannot fully recover the scene. To overcome such limitation, enough independent sampling provided by the measurement matrix is required. A quality measurement matrix reduces overlapping of measurement modes and thus increases sampling efficiency, providing an opportunity for a reconstruction to outperform an undersampled measurement. With a reconstruction algorithm that uses proper regularization, an ill-conditioned compressive sensing might still be able to recover the scene.
Here we use the average mutual coherence to evaluate the independence of the modulation channels (36, 40). The mutual coherence between two modulation channels and is . The average mutual coherence can be expressed as , which represents the average overlap between all m modulation channels. The average mutual coherence ranges from 0 to 1, with close-to-zero values meaning highly randomized modulations whereas close-to-unity values mean highly similar modulations. The average mutual coherence for the case with metamaterials is about 0.20, whereas that without metamaterials is about 0.93. The significantly reduced mutual coherence generally indicates high reconstruction fidelity and lower error (36).
The noise sensitivity of the measurement matrix can be considered as its contribution of noise amplification during the inverse process. Singular value decomposition can be used to analyze the measurement matrix to estimate the performance of the ill-conditioned inverse problem (34). Because small singular values cause the inverse process sensitive to the noise, a stable inverse problem should reduce the number of small singular values. One way to evaluate the performance has been inspired by the covariance matrix. The variance will be amplified by the sum of inverse square of the singular values . However, in an ill-posed inverse problem, such estimation will be dominated by those close-to-zero elements, which reduce the dynamic range of the evaluation. Practically, a threshold level can be set for singular value spectrum with the measured noise floor. The singular values above this threshold will be considered as effective and they dominate the sampling process. The number of effective singular values can thus provide a metric of the performance of the inversed problem.
The Spatiotemporal Degrees of Freedom of the Measurement Modes.
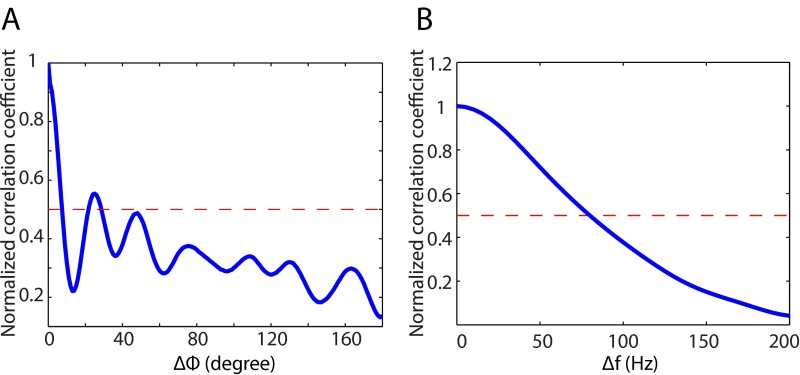
The quality of the measurement modes can be quantitatively described by the number of the degrees of freedom (DOF) in both spatial and spectral domains (41). The spatial DOF along a dimension x can be estimated as , where is the total range and is the correlation distance along this dimension. Similarly the spectral DOF can be estimated as , where is the system bandwidth and is the correlation frequency. Using the physical model described in an earlier section (SI Text, Forward Model Derivation), we calculated the decorrelation for both frequency and the azimuth of the measurement modes. The results are presented in Fig. S3 A and B. If we define the correlation range where the normalized correlation coefficient drops to 0.5, the azimuth correlation angle is about 8°, whereas the correlation frequency is about 80 Hz. This indicates that the number of DOF of the azimuth is about 45 and that within the spectrum of interest is about 38.
Fig. S3.
Azimuthal and spectral correlation curves estimated from the forward model. (A) Normalized correlation coefficient with respect to the shifted azimuthal angle. (B) Normalized correlation coefficient with respect to the shifted frequency.
There is a fundamental tradeoff between the quality factors of the physical layer modulations, the received signal power, and the DOF. On the one hand, the quality factors of the realized system will be lower than the ideal model and will thus decrease the DOF as suggested by Lipworth et al. (42). On the other hand, the modulations offered by metamaterials are essentially band-stop filtering. The higher the quality factors, the lower the received signals power. The interplay between these aspects needs to be tailored for further optimization of the sensing performance.
The Advantages of Using Metamaterials.
Resonator-based metamaterials contribute several unique features to our sensing system: (i) the flexible material parameter dispersions allow us to design and realize the optimal measurement modes for the sensing tasks. In the demonstrated work, the randomized resonating dispersions create sufficient incoherent information channels; (ii) the metamaterials allow us to achieve required spatial complexity and frequency dependency (DOF) within much smaller size, compared with the random scatterers-based methods where the device size typically needs to be orders of magnitude larger than the wavelength; and (iii) the system performance can be estimated relatively easily with the effective parameters of the metamaterials using theoretical forward models and full-wave simulations.
Controlled Experiment Without Metamaterials.
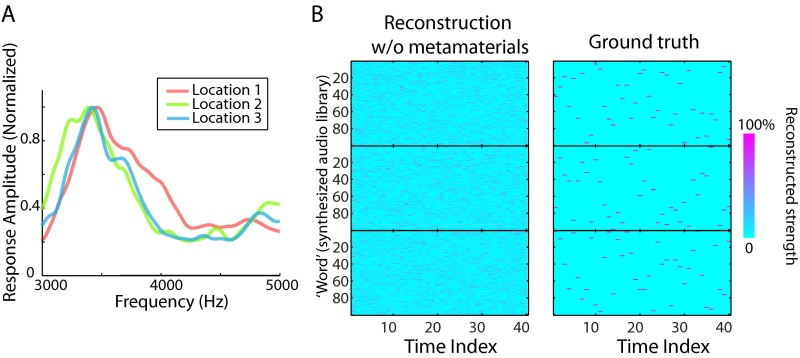
The control experiment of attempting to reconstruct three sources with only an omnidirectional microphone has an averaged MSE = 1.99, which is about 25× that of the reconstruction with metamaterial (MSE = 0.08). Both results are obtained using the sample experimental setup and with the same regularization parameters in the reconstruction algorithm. As is obvious from Fig. S4B, the reconstruction without metamaterial is too poor to provide useful information about the sources. The deficient reconstruction results from the more correlated modulations (transfer functions) for the three sources when the metamaterial coating is removed, as shown in Fig. S4A.
Fig. S4.
(A) Frequency responses measured for three sources with only an omnidirectional microphone. (B) Reconstruction results without metamaterials. (Left) Reconstruction. (Right) Ground truth. Out of 40 time indices, on average only 0.33 audios are correctly recognized (averaged over three sources) by comparing the audio of the maximum reconstructed strength with the ground truth.
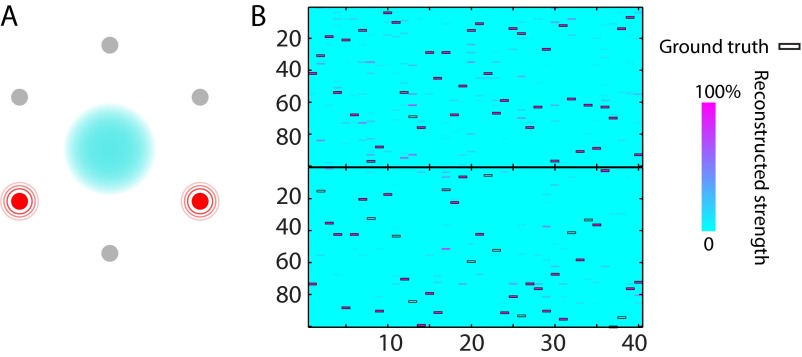
Reconstruction of Two Fixed Activated Sources out of Six Possible Locations.
The task of this reconstruction is to identify the locations of two activated sources out of six possible fixed locations and at the same time segregate their overlapping signals. The reconstruction for the six locations exhibits two blocks (corresponding to the two activated sources) with dominant signal strength (shown in Fig. S5), whereas four others with negligible reconstructed signal strength are not shown. This designed task is to demonstrate a simple combination of signal segregation and localization of fixed sources. A successful recognition is counted when the content reconstructed with the highest reconstruction strength is above 50% and matches the ground-truth word for each activated source at each time index (whereas the maximum reconstruction is below 10% for each silence source). The overall recognition ratio calculated using such definition is 87.5% for this task.
Fig. S5.
Reconstruction of two active resources out of six possible locations. (A) Schematic of the reconstruction task. Two red radiating circles indicate the sound-emitting sources, whereas the gray circles represent silent sources. (B) Reconstruction of two locations with significant reconstruction strength. The overall recognition ratio for this task is 87.5% using the criterion defined in SI Text.
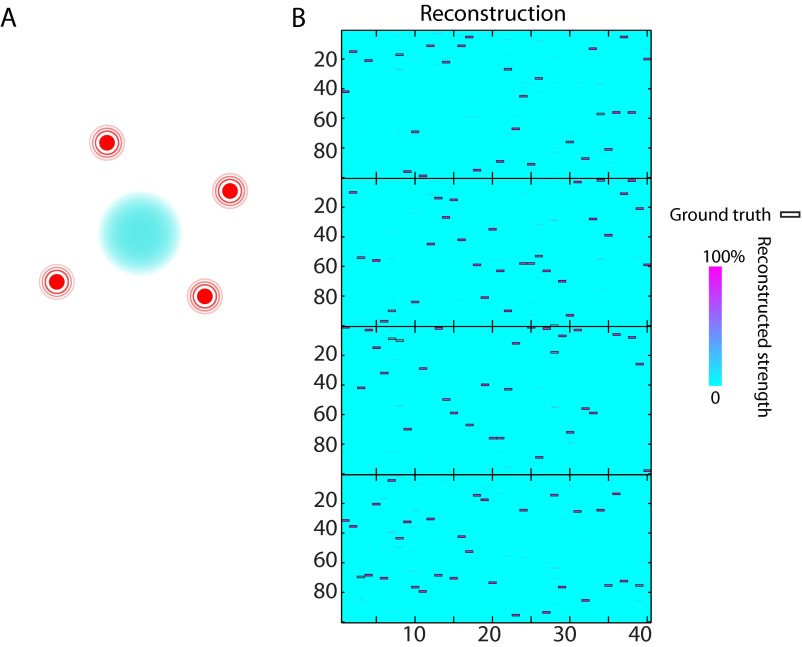
Reconstruction of Randomly Emitting Sources out of Four Possible Locations.
This task is to reconstruct the signals from four possible speakers. Unlike the previous task where the activated sources are fixed, in this task two or three speakers are randomly selected from the four possibilities at each time index to emit random words. The reconstruction results are shown in Fig. S6. Using the same definition of recognition as the previous task, the overall recognition ratio is 95%.
Fig. S6.
Reconstruction of two or three randomly selected active sources out of four possibilities. (A) Schematic of the reconstruction task. Four sources have the same possibility of radiating source and only two or three are randomly selected to emit sound at each time index. (B) Reconstruction of the four locations. The overall recognition ratio for this task is 95% using the criterion defined in SI Text.
Acknowledgments
The authors thank Prof. Michael Gehm and Prof. Donald B. Bliss for their help. This work was supported by a Multidisciplinary University Research Initiative under Grant N00014-13-1-0631 from the Office of Naval Research.
Footnotes
The authors declare no conflict of interest.
This article is a PNAS Direct Submission. P.S. is a guest editor invited by the Editorial Board.
This article contains supporting information online at www.pnas.org/lookup/suppl/doi:10.1073/pnas.1502276112/-/DCSupplemental.
References
- 1.Bregman AS. Auditory Scene Analysis: The Perceptual Organization of Sound. MIT Press; Cambridge, MA: 1994. [Google Scholar]
- 2.Blauert J. Spatial Hearing: The Psychophysics of Human Sound Localization. MIT Press; Cambridge, MA: 1997. [Google Scholar]
- 3.Cherry EC. Some experiments on the recognition of speech, with one and with two ears. J Acoust Soc Am. 1953;25(5):975–979. [Google Scholar]
- 4.Formisano E, De Martino F, Bonte M, Goebel R. “Who” is saying “what”? Brain-based decoding of human voice and speech. Science. 2008;322(5903):970–973. doi: 10.1126/science.1164318. [DOI] [PubMed] [Google Scholar]
- 5.Mesgarani N, Chang EF. Selective cortical representation of attended speaker in multi-talker speech perception. Nature. 2012;485(7397):233–236. doi: 10.1038/nature11020. [DOI] [PMC free article] [PubMed] [Google Scholar]
- 6.Bizley JK, Cohen YE. The what, where and how of auditory-object perception. Nat Rev Neurosci. 2013;14(10):693–707. doi: 10.1038/nrn3565. [DOI] [PMC free article] [PubMed] [Google Scholar]
- 7.Wang D, Brown GJ. Computational Auditory Scene Analysis: Principles, Algorithms, and Applications. Wiley-IEEE; Hoboken, NJ: 2006. [Google Scholar]
- 8.Rosenthal DF, Okuno HG. Computational Auditory Scene Analysis. Lawrence Erlbaum Associates; Mahwah, NJ: 1998. [Google Scholar]
- 9.Cooke M. Modelling Auditory Processing and Organisation. Cambridge Univ. Press; New York: 2005. [Google Scholar]
- 10.Rennie SJ, Hershey JR, Olsen PA. Single-channel multitalker speech recognition. IEEE Signal Process Mag. 2010;27(6):66–80. [Google Scholar]
- 11.Brandstein M, Ward D. Microphone Arrays: Signal Processing Techniques and Applications. Springer; New York: 2001. [Google Scholar]
- 12.Deymier PA. Acoustic Metamaterials and Phononic Crystals. Springer; New York: 2013. [Google Scholar]
- 13.Craster RV, Guenneau S. Acoustic Metamaterials: Negative Refraction, Imaging, Lensing and Cloaking. Springer; New York: 2012. [Google Scholar]
- 14.Li J, Fok L, Yin X, Bartal G, Zhang X. Experimental demonstration of an acoustic magnifying hyperlens. Nat Mater. 2009;8(12):931–934. doi: 10.1038/nmat2561. [DOI] [PubMed] [Google Scholar]
- 15.García-Chocano VM, Christensen J, Sánchez-Dehesa J. Negative refraction and energy funneling by hyperbolic materials: An experimental demonstration in acoustics. Phys Rev Lett. 2014;112(14):144301. doi: 10.1103/PhysRevLett.112.144301. [DOI] [PubMed] [Google Scholar]
- 16.Popa B-I, Cummer SA. Non-reciprocal and highly nonlinear active acoustic metamaterials. Nat Commun. 2014;5:3398. doi: 10.1038/ncomms4398. [DOI] [PubMed] [Google Scholar]
- 17.Fang N, et al. Ultrasonic metamaterials with negative modulus. Nat Mater. 2006;5(6):452–456. doi: 10.1038/nmat1644. [DOI] [PubMed] [Google Scholar]
- 18.Liang Z, Li J. Extreme acoustic metamaterial by coiling up space. Phys Rev Lett. 2012;108(11):114301. doi: 10.1103/PhysRevLett.108.114301. [DOI] [PubMed] [Google Scholar]
- 19.Xie Y, Popa B-I, Zigoneanu L, Cummer SA. Measurement of a broadband negative index with space-coiling acoustic metamaterials. Phys Rev Lett. 2013;110(17):175501. doi: 10.1103/PhysRevLett.110.175501. [DOI] [PubMed] [Google Scholar]
- 20.Hladky-Hennion A-C, et al. Negative refraction of acoustic waves using a foam-like metallic structure. Appl Phys Lett. 2013;102(14):144103. [Google Scholar]
- 21.Zhang S, Xia C, Fang N. Broadband acoustic cloak for ultrasound waves. Phys Rev Lett. 2011;106(2):024301. doi: 10.1103/PhysRevLett.106.024301. [DOI] [PubMed] [Google Scholar]
- 22.Zigoneanu L, Popa B-I, Cummer SA. Three-dimensional broadband omnidirectional acoustic ground cloak. Nat Mater. 2014;13(4):352–355. doi: 10.1038/nmat3901. [DOI] [PubMed] [Google Scholar]
- 23.Xie Y, et al. Wavefront modulation and subwavelength diffractive acoustics with an acoustic metasurface. Nat Commun. 2014;5:5553. doi: 10.1038/ncomms6553. [DOI] [PubMed] [Google Scholar]
- 24.Lemoult F, Fink M, Lerosey G. Acoustic resonators for far-field control of sound on a subwavelength scale. Phys Rev Lett. 2011;107(6):064301. doi: 10.1103/PhysRevLett.107.064301. [DOI] [PubMed] [Google Scholar]
- 25.Lemoult F, Kaina N, Fink M, Lerosey G. Wave propagation control at the deep subwavelength scale in metamaterials. Nat Phys. 2013;9(1):55–60. [Google Scholar]
- 26.Fleury R, Alù A. Extraordinary sound transmission through density-near-zero ultranarrow channels. Phys Rev Lett. 2013;111(5):055501. doi: 10.1103/PhysRevLett.111.055501. [DOI] [PubMed] [Google Scholar]
- 27.Ma G, Yang M, Xiao S, Yang Z, Sheng P. Acoustic metasurface with hybrid resonances. Nat Mater. 2014;13(9):873–878. doi: 10.1038/nmat3994. [DOI] [PubMed] [Google Scholar]
- 28.Brady DJ. Optical Imaging and Spectroscopy. Wiley; Hoboken, NJ: 2009. [Google Scholar]
- 29.Mosk AP, Lagendijk A, Lerosey G, Fink M. Controlling waves in space and time for imaging and focusing in complex media. Nat Photonics. 2012;6(5):283–292. [Google Scholar]
- 30.Katz O, Small E, Silberberg Y. Looking around corners and through thin turbid layers in real time with scattered incoherent light. Nat Photonics. 2012;6(8):549–553. [Google Scholar]
- 31.Lemoult F, Lerosey G, de Rosny J, Fink M. Manipulating spatiotemporal degrees of freedom of waves in random media. Phys Rev Lett. 2009;103(17):173902. doi: 10.1103/PhysRevLett.103.173902. [DOI] [PubMed] [Google Scholar]
- 32.Fink M, et al. Time-reversed acoustics. Rep Prog Phys. 2000;63(12):1933–1995. [Google Scholar]
- 33.Hunt J, et al. Metamaterial apertures for computational imaging. Science. 2013;339(6117):310–313. doi: 10.1126/science.1230054. [DOI] [PubMed] [Google Scholar]
- 34.Aster RC, Borchers B, Thurber CH. Parameter Estimation and Inverse Problems. Academic; Waltham, MA: 2013. [Google Scholar]
- 35.Duarte MF, et al. Single-pixel imaging via compressive sampling. IEEE Signal Process Mag. 2008;25(2):83–91. [Google Scholar]
- 36.Duarte-Carvajalino JM, Sapiro G. Learning to sense sparse signals: Simultaneous sensing matrix and sparsifying dictionary optimization. IEEE Trans Image Process. 2009;18(7):1395–1408. doi: 10.1109/TIP.2009.2022459. [DOI] [PubMed] [Google Scholar]
- 37.Bioucas-Dias JM, Figueiredo MA. A new twIst: Two-step iterative shrinkage/thresholding algorithms for image restoration. IEEE Trans Image Process. 2007;16(12):2992–3004. doi: 10.1109/tip.2007.909319. [DOI] [PubMed] [Google Scholar]
- 38.Carin L, Liu D, Guo B. In situ compressive sensing. Inverse Probl. 2008;24(1):015023. [Google Scholar]
- 39.Kinsler LE, Frey AR, Coppens AB, Sanders JV. Fundamentals of Acoustics. Wiley; New York: 1999. [Google Scholar]
- 40.Elad M. Optimized projections for compressed sensing. IEEE Trans Signal Process. 2007;55(12):5695–5702. [Google Scholar]
- 41.Derode A, Tourin A, Fink M. Random multiple scattering of ultrasound. II. Is time reversal a self-averaging process? Phys Rev E Stat Nonlin Soft Matter Phys. 2001;64(3):036606. doi: 10.1103/PhysRevE.64.036606. [DOI] [PubMed] [Google Scholar]
- 42.Lipworth G, et al. Metamaterial apertures for coherent computational imaging on the physical layer. J Opt Soc Am A Opt Image Sci Vis. 2013;30(8):1603–1612. doi: 10.1364/JOSAA.30.001603. [DOI] [PubMed] [Google Scholar]


