

High pancreatic fat content is related to older age, greater body mass index, and lower serum lipase activity but not to the endocrine function of the gland.
Abstract
Purpose
To determine the relationship between pancreatic fat content and type 2 diabetes and prediabetes.
Materials and Methods
From the prospective population-based Study of Health in Pomerania (SHIP), 1367 volunteers (563 men, 678 women; median age, 50 years) underwent whole-body magnetic resonance (MR) imaging at 1.5 T, which included multiecho chemical shift–encoded acquisition of the abdomen. SHIP was approved by the institutional review board, and written informed consent was obtained from all participants. The proton density fat fraction (PDFF) was calculated after correction for T1 bias, T2* bias, multipeak spectral complexity of fat, and noise bias. On the basis of oral glucose tolerance test results, participants were grouped into those with normal glucose tolerance (n = 740), those with prediabetes (n = 431), and those with confirmed type 2 diabetes but without medication (n = 70). PDFF was assessed in the pancreatic head, body, and tail. Multivariable regression analysis was conducted to investigate possible relationships of PDFF with demographic factors, behavioral factors, and laboratory data associated with the metabolic syndrome.
Results
In all subjects, the mean unadjusted pancreatic fat content was 4.4% (head, 4.6%; body, 4.9%; tail, 3.9%; being unequally distributed, P < .001). There was no significant difference in pancreatic PDFF among subjects with normal glucose tolerance, prediabetes, and type 2 diabetes (P = .980). Pancreatic PDFF showed a positive association with age and body mass index and a negative association with serum lipase activity (P < .001).
Conclusion
The presence of pancreatic fat is not related to prediabetes or diabetes, which suggests that it has little clinical relevance for an individual’s glycemic status.
© RSNA, 2015
Introduction
The metabolic syndrome is a common disorder characterized by obesity, hypertension, dyslipidemia, and insulin resistance (1,2). Insulin-resistant tissue fails to respond normally to the hormone insulin. This, in turn, induces β cells of the pancreas to increase insulin production further. In addition, insulin is a known inhibitor of lipolysis. Consequently, subjects with insulin resistance syndrome have impaired fat metabolism. This can lead to obesity and ectopic fat storage, particularly in the liver, pancreas, and visceral adipose tissue. Progressive disease can result in β cell failure and type 2 diabetes. There has been ongoing controversy as to whether β cell failure results from chronic hyperinsulinism due to β cell exhaustion or from pancreatic fat storage due to cytokine-related inflammation and lipotoxicity (3) in the context of nonalcoholic steatopancreatitis (4). At present, the relationship between pancreatic fat accumulation and abnormal glucose tolerance manifest as type 2 diabetes remains unclear.
Pancreatic steatosis (also known as pancreatic lipomatosis and nonalcoholic fatty pancreatic disease) is often detected incidentally in elderly patients at cross-sectional diagnostic imaging (5). Although pancreatic steatosis can be visualized with ultrasonography (US) and computed tomography (CT), reliable quantification of tissue fat content is not possible with these modalities. Magnetic resonance (MR) imaging, however, allows sensitive assessment of tissue fat content (6). One simple approach to quantifying tissue fat content is the chemical shift–based technique with measurement of the proton density fat fraction (PDFF) (7,8). Measurement of PDFF improves the reliability of fat quantification by correcting for confounders such as T2* decay, T1 bias, and noise bias and for the multispectral complexity of fat (7). The high accuracy of the PDFF-based technique for tissue fat quantification has been shown in various other organs in recent studies (6,9,10). Nevertheless, only a few cohort studies have dealt with the quantification of pancreatic fat content with MR imaging (11–14). To the best of our knowledge, only one group of investigators has calculated the PDFF by using chemical shift imaging to assess the pancreatic fat content in a small patient group (n = 43) (15). Studies in which the pancreatic PDFF was assessed in larger population-based cohorts to determine its clinical impact have not been reported.
Therefore, the purpose of this study was to determine the relationship between pancreatic fat content and type 2 diabetes and prediabetes.
Materials and Methods
Whole-body MR imaging in the Study of Health in Pomerania (SHIP) was supported by a grant from Siemens Healthcare (Erlangen, Germany). In addition, contrast material–enhanced MR imaging research is part of the entire whole-body MR imaging study in SHIP and was supported by Bayer Healthcare (Berlin, Germany). The authors had complete control of the data and the information submitted for publication.
This study was a subproject of SHIP. SHIP is a population-based epidemiologic study conducted in a defined region of the German Federal State of Mecklenburg–Western Pomerania (16). The general objective of SHIP was to estimate the prevalence and incidence of diseases and corresponding risk factors. One specific aim was to observe pathophysiologic processes associated with metabolic syndrome. A whole-body MR examination including a complex chemical shift–encoded sequence and an oral glucose tolerance test (OGTT) were performed in a subgroup of the participants of the SHIP-Trend baseline study (16).
SHIP was conducted as approved by the local institutional review board of Greifswald University Hospital. Written informed consent was obtained separately for study inclusion and MR imaging.
Study Population
Between 2008 and 2012, 4420 of 8826 invited subjects participated in the baseline SHIP-Trend. For a total of 1350 participants, data on pancreatic fat content determined with MR imaging, glycemic status assessed with an OGTT, or self-reported diabetes were available. The OGTT is a clinically established technique for diagnosing diabetes and assessing glucose tolerance status (17). Subjects who were undergoing medical treatment for known type 2 diabetes (n = 84) were excluded from data analysis, as were subjects with a history of type 1 diabetes (n = 5) or pancreatitis (n = 5). In addition, 15 subjects were excluded from statistical evaluation because of missing covariate data.
Thus, the study population available for analysis included 1241 volunteers consisting of 563 men and 678 women with a median age of 50 years. The characteristics of the study population, including demographics, behavioral factors, and laboratory data, are summarized in Table 1.
Table 1.
Characteristics of the Study Population according to Endocrine Functional Status of the Pancreas
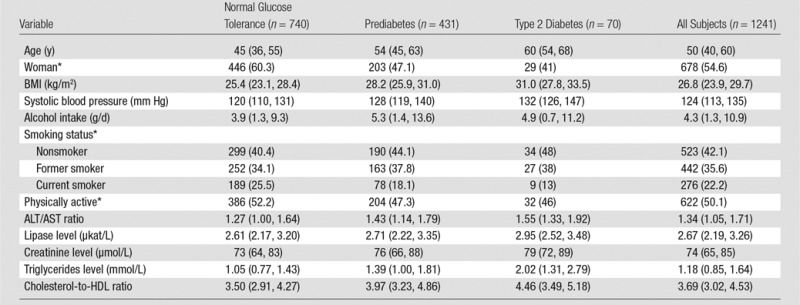
Note.—Except where indicated, data are medians, with the first and third quartiles in parentheses.
Data are numbers of patients, with percentages in parentheses.
Glycemic Status, Physical Examinations, and Laboratory Measurements
To determine the relationship between pancreatic fat and glycemic status, we defined three groups: normal glucose tolerance, prediabetes, and untreated type 2 diabetes. Subjects with a self-reported history of type 2 diabetes (but who were not undergoing any medical treatment) (n = 30) did not undergo an OGTT and were assigned to the group with diabetes. Those who self-reported taking antidiabetic medication were excluded because of the possible influence of medical treatment on pancreatic fat content. All others were grouped according to the results of the OGTT, as follows: Prediabetes was defined as a fasting blood glucose level of at least 5.6 mmol/L and less than 6.9 mmol/L or a stimulated blood glucose level (eg, 2 hours after intake of sugar solution) of at least 7.8 mmol/L and less than 11.1 mmol/L; type 2 diabetes was defined as a fasting blood glucose level of at least 7.0 mmol/L or a stimulated blood glucose level of at least 11.1 mmol/L; normal glucose tolerance was defined as a fasting blood glucose level of less than 5.6 mmol/L or a stimulated blood glucose level of less than 7.8 mmol/L (18). All subjects fasted at least 4 hours before fasting glucose and subsequent OGTT.
The following associated risk factors for prediabetes and diabetes were also assessed: age, sex, body mass index (BMI), systolic blood pressure, and serum triglycerides level. Furthermore, data about lifestyle habits, such as alcohol intake, smoking status, and physical activity, were obtained with an interview. Physical activity was defined as exercising more than 2 hours per week in summer or winter or both. Finally, the following serum laboratory values were obtained for correlation with pancreatic fat content: alanine aminotransferase (ALT)–to–aspartate aminotransferase (AST) ratio and creatinine as an indicator of possible kidney and liver abnormalities. In addition, lipase activity as a marker of pancreatic exocrine function was used for correlation.
MR Image Acquisition and Reconstruction
Whole-body MR imaging was performed with a commercially available 1.5-T unit (Magnetom Avanto, Siemens Healthcare). An investigational three-dimensional gradient-echo chemical shift–encoded pulse sequence with water and/or fat separation was included in the main protocol (19). The study sequence covered all upper abdominal organs, including the pancreas. Each excitation was followed by a readout of three echoes in the same repetition time: echo time (TE) 1 (TE1, opposed phase), TE2 (in phase), and TE3 (in phase) (20). Imaging parameters were as follows: 11/2.4/4.8/9.6 (repetition time msec/TE1 msec/TE2 msec/TE3 msec; 10° flip angle; one signal acquired; 1065 Hz per pixel bandwidth; 410 × 308-mm field of view; 224 × 168 × 64 matrix; and parallel imaging (generalized autocalibrating partially parallel acquisition) with an effective acceleration factor of 1.8. The three-dimensional data set was acquired in the axial plane during a single 19-second breath hold.
PDFF maps were reconstructed offline by using Matlab software (R2011a; Mathworks, Natick, Mass) (6). PDFF was corrected for all known confounders, including T1 bias (21), T2* decay (22), the multispectral complexity of fat (23), and noise bias (24) before measurement of PDFF from the reconstructed images. T1 recovery correction was performed by using T1 values from the literature (water: 586 msec; fat: 343 msec) (25). In addition, the water and/or fat swapping was resolved by using phase information of the complex images (26).
Phantom Validation
A phantom analysis was performed to investigate the reliability of PDFF and to show that the PDFF approach is an accurate technique with which to quantify tissue fat. A fat phantom was constructed by using 250 g veal liver and lard as described by Fischer et al (27). Liver and lard were blended to yield fat concentrations of 0%, 10%, 20%, 30%, 40%, 50%, 60%, 80%, and 100% and filled in 10 vials with a volume of 25 mL each. The vials were positioned in the MR unit, and a coronal pulse sequence was performed by using a body phased-array coil and the same parameters as for the examination of the human subjects. The PDFF was compared with the true phantom fat concentrations.
Image Analysis
All measurements were performed with analysis of PDFF in regions of interest by using software (Osirix, version 3.9.1, 64 bit; Pixmeo Sarl, Bernex, Switzerland).
A representative section of the phantom was chosen and one region of interest placed in each test tube. Measurements were performed twice by the same observer (J.P.K.), with an interval of 2 weeks between measurements.
In subjects, quantitative measurements were performed by a certified observer (F.B.) with at least 1 year of experience in abdominal MR imaging. Three regions of interest were placed in the head, body, and tail of the pancreas by using the magnitude image from the first in-phase echo. Region of interest size was adjusted to the largest size possible to match the size of the pancreas at each location. The regions of interest were placed in a manner that avoided artifacts, vessels, and adjacent visceral fat.
Statistical Analysis
In the phantom, PDFF and true fat content were compared by using linear regression analysis. Statistical differences in slope (different from 1) and intercept (different from 0) were calculated by using the Student t test.
All descriptive data obtained in the volunteers are presented as medians and quartiles. Differences in PDFF among the head, body, and tail of the pancreas were assessed by using a Friedman test.
We modeled pancreatic fat content (PDFF) as dependent variable with diabetes status as exposure, being categoric with three variable levels (normal glucose tolerance, prediabetes, type 2 diabetes). The model was adjusted for demographic (age, sex), behavioral (alcohol consumption, smoking status, physical activity), and cardiometabolic (systolic blood pressure, ALT/AST ratio, lipase activity, creatinine level, triglycerides level, cholesterol-to–high-density lipoprotein [HDL] ratio) factors. We applied ordinary linear regression with robust estimation of standard errors and/or confidence intervals (CIs). To allow for nonlinear relationships, fractional polynomials were used (28). The procedure implemented in the mfp command in the Stata software package (version 12.1; Stata, College Station, Tex) selects the multivariable fractional polynomial model that best predicts the outcome variable. It tests the powers of −2, −1, −0.5, 0, 0.5, 1, 2, and 3 and chooses the best fitting one in terms of significantly reducing the deviance of the model.
The significance level used in this study was defined as α < .05. In the linear regression, associations with single variables were tested with the Student t test; joint tests over categoric variables were performed by using a Wald test. All calculations were performed with software (version 12.1, Stata).
Results
The linear correlation between the fat content of the phantom and PDFF was excellent (r2 = 0.989). In addition, there was excellent agreement between the true fat content and the PDFF (Fig 1). No significant differences were observed in slope (1.04, P = .471) and intercept (−2.2%, P = .449).
Figure 1:

Phantom data. Graph shows excellent agreement between PDFF and phantom fat content, with no differences in slope and intercept. Correlation is also near perfect (r2 = 0.989). Results demonstrate high reliability and robustness of chemical shift–encoded PDFF for assessing tissue fat.
The unadjusted mean of the pancreatic fat content over all subjects was 4.6% (95% CI: 4.2%, 5.0%) in the head, 4.9% (95% CI: 4.5%, 5.3%) in the body, and 3.9% (95% CI: 3.5%, 4.3%) in the tail, indicating that pancreatic fat content differs slightly but significantly among these three parts of the pancreas (P < .001, Friedman test). Figure 2 shows examples illustrating different amounts of fat in the pancreatic gland. When adjusted for age, sex, and BMI, the mean PDFF was 4.5% (95% CI: 4.2%, 4.8%). Adjustment for all covariates yielded the same results.
Figure 2:

PDFF maps illustrate different amounts of pancreatic fat in pancreatic head (arrow) in subjects without diabetes. (a) Image shows a very small amount of fat in pancreatic head. (b) Image shows fatty replacement of pancreatic head with PDFF of 19%. (c) Image shows complete fatty replacement as a maximum variant of pancreatic steatosis.
Volunteers were grouped according to their glucose tolerance: 740 subjects had normal glucose tolerance, 431 had prediabetes, and 70 had confirmed untreated type 2 diabetes. The data about the relationships between PDFF and endocrine pancreatic function are summarized in Table 2. There was no significant association between glycemic status (normal, prediabetic, type 2 diabetic) and PDFF (P = .980 for all subjects, Table 3; P = .992 for men and P = .956 for women, Tables E1 and E2 [online]). When all covariates in the linear regression model were held constant at their means, the PDFF was 4.44%, 4.48%, and 4.62% for subjects with normal glucose tolerance, prediabetes, and type 2 diabetes, respectively.
Table 2.
Adjusted Means of PDFF of the Pancreas according to Group
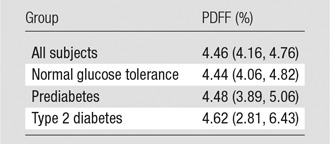
Note.—Data are mean PDFFs and were adjusted for age, sex, BMI, glycemic status, blood pressure, alcohol intake, smoking status, physical activity, ALT/AST ratio, lipase level, creatinine level, triglycerides level, and cholesterol-to-HDL ratio No significant differences between groups with different endocrine functional status of the pancreas (ie, glycemic status) were observed (Wald test, P = .980). Numbers in parentheses are 95% CIs.
Table 3.
Results of Linear Regression Analysis of Pancreatic PDFF according to Demographic and Behavioral Factors and Laboratory Data
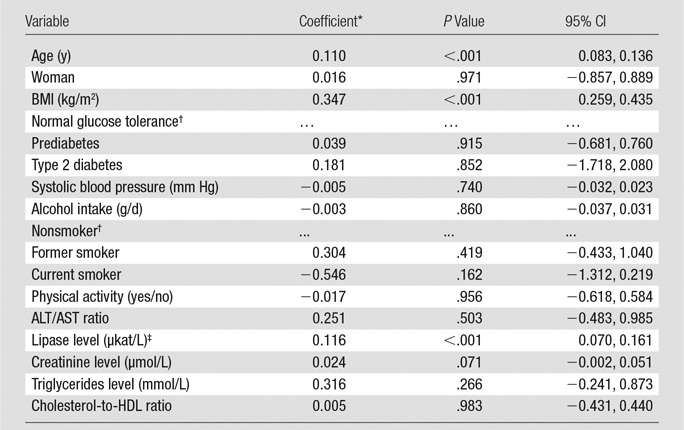
Note.—R2 = 0.216. The overall P value for diabetes was .980, and the overall P value for smoking was .118.
Coefficients are the change in PDFF (in percentage) per unit of each variable.
Reference category.
Polynome: (lipase/10)−2.
Results of regression analysis revealed that pancreatic fat content varied with demographic and metabolic factors (Table 3). Pancreatic fat increased with age (P < .001) and BMI (P < .001) and decreased exponentially with serum lipase activity (P < .001). No significant associations were found with systolic blood pressure, alcohol intake, smoking, physical activity, ALT/AST ratio, creatinine level, triglycerides levels, or cholesterol-to-HDL ratio.
To test for statistical interaction with sex, we ran a model with a multiplicative interaction term between BMI and sex and found a significant interaction (P = .019). To analyze differences between sexes further, separate models for men and women were calculated (Tables E1 and E2 [online]). The progression of pancreatic steatosis with age was more pronounced in women (28% higher coefficient), whereas the increase in pancreatic fat with BMI was stronger in men (75% higher coefficient). An overall effect of smoking was observed only in men (P = .014), with the PDFF being lower in current smokers and higher in former smokers when compared with that of nonsmokers.
To explore if there is an association between glycemic status and pancreatic fat in higher ranges of pancreatic fat content, we performed a sensitivity analysis using the same regression model with the uppermost quartile of pancreatic fat only (>6.1% fat, n = 311). The overall association with glycemic status remained nonsignificant (combined test: P = .177). The coefficients were 1.6 for prediabetes compared with normal glucose tolerance (P = .064, n = 131) and 0.9 for type 2 diabetes compared with normal glucose tolerance (P = .499, n = 36).
Discussion
In this population-based study, we investigated the relationship between pancreatic fat content, measured by using a confounder-corrected MR imaging technique, and glycemic status and other associated risk factors of metabolic syndrome.
Our findings confirm the previously reported excellent accuracy for confounder-corrected MR imaging in the assessment of tissue fat (29). The mean pancreatic fat content measured in our study was 4.6% (95% CI: 4.2%, 5.0%) over all subjects. This result is comparable with previously published data from MR spectroscopy studies (30). It is well established for the quantification of PDFF for liver fat that the accuracy of confounder-corrected chemical shift–encoded MR imaging is equivalent to that of MR spectroscopy for the quantification of liver fat content (9,31).
The clinical relevance of pancreatic fat content is currently under debate. Few groups have investigated the clinical impact of pancreatic fat content and how it is related to endocrine pancreatic function (32,33). Their findings were inconsistent. For example, Heni et al (32) demonstrated that pancreatic fat is negatively associated with insulin secretion. Van der Zijl et al (33) found no direct relationship between pancreatic fat and β cell function. Both published studies investigated small numbers of subjects and were not adjusted for confounders.
To the best of our knowledge, only two studies included a reasonable number of subjects to evaluate the broader clinical relevance of pancreatic steatosis (34,35). Ou et al (34) recently investigated 7464 subjects and found that subjects with type 2 diabetes were more likely to have pancreatic steatosis. However, an average fat content of 4%, as we found in our study, is not detectable with US. Therefore, the findings of Ou et al may be attributable to misclassification. In agreement with our findings, Saisho et al (35) found no association between pancreatic fat and type 2 diabetes in a postmortem analysis of 1886 adults.
Our analysis has revealed no relevant association between glycemic impairment and fatty degeneration of the pancreas, suggesting that pancreatic steatosis is of little relevance for the development of glucose intolerance and type 2 diabetes. The strengths of our study are the measurement of pancreatic fat content with MR imaging and a valid grouping into normal, prediabetic, and diabetic groups on the basis of OGTT results. Furthermore, covariates were included continuously to increase the power of the model compared with categorized variables. In this way, our approach also makes an allowance for the occurrence of nonlinear relationships. The very high P value for the association between glycemic impairment and fatty degeneration of the pancreas indicates that the significance of the association is not a matter of sample size. A posthoc power calculation revealed a power of 0.94 for an effect size of 0.01 (partial R2 = 0.01, α = .05, n = 1241, 13 predictor variables). Therefore, our data are sufficient to detect an association with the size of this study population.
In agreement with previous studies, age, BMI (32), and lower lipase activity demonstrated a significant association with pancreatic fat content (34,36). We assume that this result may be due to fatty degeneration of the pancreas with increasing age. A high BMI predisposes to metabolic syndrome, and it is well known that the amount of visceral fat increases with BMI. Recent studies revealed a similar association between pancreatic fat and BMI and explain this effect by an association of the pancreatic fat content connected with metabolic syndrome (37). Interestingly, lipase activity exponentially decreased with the amount of pancreatic fat. Therefore, pancreatic fat accumulation may be more relevant for exocrine pancreatic function, and this association could be clinically relevant. One explanation could be that during involution with age, fat cells replace acinar (exocrine) cells but not islet cells. At this time, we have no validated clinical or laboratory data in this volunteer study to confirm the hypothesis that pancreatic fat is associated with reduced pancreatic exocrine function.
In addition, we found no association between pancreatic fat content and triglycerides level, cholesterol-to-HDL ratio, ALT/AST ratio, and creatinine level. Furthermore, behavioral variables such as alcohol intake, smoking status, and physical activity were found to be unrelated to pancreatic fat content when male and female subjects were analyzed together.
In men, we found a significant association with smoking status, with former smokers having more and current smokers having less pancreatic fat than nonsmokers. Men also showed a stronger increase in pancreatic fat with age and BMI compared with women.
This study has several limitations. Radiologic imaging techniques may be limited in the differentiation between intracellular fat content and extracellular ectopic accumulation of fat in the pancreas. Therefore, changes in the pancreas, such as atrophy and lobulation, might confound measurements of intracellular PDFF. In our opinion, confounder-corrected chemical shift–encoded MR imaging is an excellent technique with which to validly assess pancreatic fat content, and our results are valid because the regions of interest could be placed to reliably avoid the pancreatic fronds between which visceral adipose tissue could intercalate. This assumption is also confirmed by the fact that several recent MR studies in which spectroscopy was used report comparable fat fractions of pancreatic tissue (30,33,38). A second limitation is the relatively small group of subjects with confirmed but untreated type 2 diabetes. However, subjects were deliberately grouped according to glycemic status as determined with the OGTT, which is the standard of reference for defining prediabetes and diabetes.
In conclusion, the results of this study shows that a high pancreatic fat content is related to an older age, greater BMI, and lower serum lipase activity but not to the endocrine function of the gland. The potential relevance of pancreatic fat with regard to exocrine function of the pancreas should be explored with further studies.
Advances in Knowledge
■ Pancreatic fat content is significantly associated with older age and greater body mass index (P < .001 for both).
■ Pancreatic fat content is significantly associated with lower serum lipase activity (P < .001).
■ Pancreatic fat content is not related to prediabetes or diabetes (P = .980).
Implication for Patient Care
■ Pancreatic fat is often detected as an incidental finding; per se it has no clinical implication with regard to endocrine function, but it might be connected to restricted exocrine secretion.
SUPPLEMENTAL FIGURE
Acknowledgments
Acknowledgments
The Community Medicine Research network of the University of Greifswald, Germany, covers several research projects that share data from the population-based Study of Health in Pomerania (http://ship.community-medicine.de). The contributions to data collection made by field workers, technicians, interviewers, and computer assistants are gratefully acknowledged.
Received March 11, 2014; revision requested April 30; revision received October 17; accepted November 19; final version accepted December 17.
Funding: S.B.R. is supported by the National Institutes of Health (grants R01 DK083380 and R01 DK088925).
SHIP is part of the Community Medicine Research Net of the University of Greifswald, Germany, which is funded by the Federal Ministry of Education and Research (grants 01ZZ9603, 01ZZ0103, 01ZZ0403, 01ZZ0701, 03ZIK012), the Ministry of Cultural Affairs as well as the Social Ministry of the Federal State of Mecklenburg–West Pomerania. Whole-body MR imaging was supported by a joint grant from Siemens Healthcare, Erlangen, Germany, and the Federal State of Mecklenburg–West Pomerania. The University of Greifswald is a member of the ‘Center of Knowledge Interchange’ program of Siemens. Contrast-enhanced MR imaging research is part of the entire whole-body MR imaging study and was supported by Bayer Healthcare.
Abbreviations:
- ALT
- alanine aminotransferase
- AST
- aspartate aminotransferase
- BMI
- body mass index
- CI
- confidence interval
- HDL
- high-density lipoprotein
- OGTT
- oral glucose tolerance test
- PDFF
- proton density fat fraction
- SHIP
- Study of Health in Pomerania
- TE
- echo time
Disclosures of Conflicts of Interest: J.P.K. disclosed no relevant relationships. F.B. disclosed no relevant relationships. J.M. disclosed no relevant relationships. H.V. Financial activities related to the present article: institution received a grant from Siemens, BMBF. Financial activities not related to the present article: disclosed no relevant relationships. Other relationships: disclosed no relevant relationships. S.B.R. Financial activities related to the present article: disclosed no relevant relationships. Financial activities not related to the present article: disclosed no relevant relationships. Other relationships: has patents issued. W.R. disclosed no relevant relationships. M.M.L. disclosed no relevant relationships. N.H. disclosed no relevant relationships. K.H. Financial activities related to the present article: received a grant from Bayer Healthcare and Siemens Healthcare. Financial activities not related to the present article: received a grant from Bayer Healthcare and XERA 3 Deutschland. Other relationships: disclosed no relevant relationships. P.J.M. disclosed no relevant relationships.
References
- 1.Reaven GM. Banting lecture 1988. Role of insulin resistance in human disease. Diabetes 1988;37(12):1595–1607. [DOI] [PubMed] [Google Scholar]
- 2.Alberti KG, Zimmet P, Shaw J. Metabolic syndrome: a new world-wide definition—a consensus statement from the International Diabetes Federation. Diabet Med 2006;23(5):469–480. [DOI] [PubMed] [Google Scholar]
- 3.van Raalte DH, van der Zijl NJ, Diamant M. Pancreatic steatosis in humans: cause or marker of lipotoxicity? Curr Opin Clin Nutr Metab Care 2010;13(4):478–485. [DOI] [PubMed] [Google Scholar]
- 4.Pitt HA. Hepato-pancreato-biliary fat: the good, the bad and the ugly. HPB (Oxford) 2007;9(2):92–97. [DOI] [PMC free article] [PubMed] [Google Scholar]
- 5.Katz DS, Hines J, Math KR, Nardi PM, Mindelzun RE, Lane MJ. Using CT to reveal fat-containing abnormalities of the pancreas. AJR Am J Roentgenol 1999;172(2):393–396. [DOI] [PubMed] [Google Scholar]
- 6.Kühn JP, Hernando D, Muñoz del Rio A, et al. Effect of multipeak spectral modeling of fat for liver iron and fat quantification: correlation of biopsy with MR imaging results. Radiology 2012;265(1):133–142. [DOI] [PMC free article] [PubMed] [Google Scholar]
- 7.Reeder SB, Hu HH, Sirlin CB. Proton density fat-fraction: a standardized MR-based biomarker of tissue fat concentration. J Magn Reson Imaging 2012;36(5):1011–1014. [DOI] [PMC free article] [PubMed] [Google Scholar]
- 8.Yu H, Shimakawa A, McKenzie CA, Brodsky E, Brittain JH, Reeder SB. Multiecho water-fat separation and simultaneous R2* estimation with multifrequency fat spectrum modeling. Magn Reson Med 2008;60(5):1122–1134. [DOI] [PMC free article] [PubMed] [Google Scholar]
- 9.Meisamy S, Hines CD, Hamilton G, et al. Quantification of hepatic steatosis with T1-independent, T2-corrected MR imaging with spectral modeling of fat: blinded comparison with MR spectroscopy. Radiology 2011;258(3):767–775. [DOI] [PMC free article] [PubMed] [Google Scholar]
- 10.Yokoo T, Shiehmorteza M, Hamilton G, et al. Estimation of hepatic proton-density fat fraction by using MR imaging at 3.0 T. Radiology 2011;258(3):749–759. [DOI] [PMC free article] [PubMed] [Google Scholar]
- 11.Hu HH, Kim HW, Nayak KS, Goran MI. Comparison of fat-water MRI and single-voxel MRS in the assessment of hepatic and pancreatic fat fractions in humans. Obesity (Silver Spring) 2010;18(4):841–847. [DOI] [PMC free article] [PubMed] [Google Scholar]
- 12.Lee SE, Jang JY, Lim CS, et al. Measurement of pancreatic fat by magnetic resonance imaging: predicting the occurrence of pancreatic fistula after pancreatoduodenectomy. Ann Surg 2010;251(5):932–936. [DOI] [PubMed] [Google Scholar]
- 13.Au WY, Lam WW, Chu W, et al. A T2* magnetic resonance imaging study of pancreatic iron overload in thalassemia major. Haematologica 2008;93(1):116–119. [DOI] [PubMed] [Google Scholar]
- 14.Noetzli LJ, Papudesi J, Coates TD, Wood JC. Pancreatic iron loading predicts cardiac iron loading in thalassemia major. Blood 2009;114(19):4021–4026. [DOI] [PMC free article] [PubMed] [Google Scholar]
- 15.Patel NS, Peterson MR, Brenner DA, Heba E, Sirlin C, Loomba R. Association between novel MRI-estimated pancreatic fat and liver histology-determined steatosis and fibrosis in non-alcoholic fatty liver disease. Aliment Pharmacol Ther 2013;37(6):630–639. [DOI] [PMC free article] [PubMed] [Google Scholar]
- 16.Völzke H, Alte D, Schmidt CO, et al. Cohort profile: the study of health in Pomerania. Int J Epidemiol 2011;40(2):294–307. [DOI] [PubMed] [Google Scholar]
- 17.WHO Expert Committee on Diabetes Mellitus: second report. World Health Organ Tech Rep Ser 1980;646:1–80. [PubMed] [Google Scholar]
- 18.Alberti KG, Zimmet PZ. Definition, diagnosis and classification of diabetes mellitus and its complications. I. Diagnosis and classification of diabetes mellitus provisional report of a WHO consultation. Diabet Med 1998;15(7):539–553. [DOI] [PubMed] [Google Scholar]
- 19.Hegenscheid K, Kühn JP, Völzke H, Biffar R, Hosten N, Puls R. Whole-body magnetic resonance imaging of healthy volunteers: pilot study results from the population-based SHIP study. Rofo 2009;181(8):748–759. [DOI] [PubMed] [Google Scholar]
- 20.Kühn JP, Evert M, Friedrich N, et al. Noninvasive quantification of hepatic fat content using three-echo dixon magnetic resonance imaging with correction for T2* relaxation effects. Invest Radiol 2011;46(12):783–789. [DOI] [PubMed] [Google Scholar]
- 21.Kühn JP, Jahn C, Hernando D, et al. T1 bias in chemical shift–encoded liver fat-fraction: role of the flip angle. J Magn Reson Imaging 2014;40(4):875–883. [DOI] [PMC free article] [PubMed] [Google Scholar]
- 22.Yu H, McKenzie CA, Shimakawa A, et al. Multiecho reconstruction for simultaneous water-fat decomposition and T2* estimation. J Magn Reson Imaging 2007;26(4):1153–1161. [DOI] [PubMed] [Google Scholar]
- 23.Reeder SB, Robson PM, Yu H, et al. Quantification of hepatic steatosis with MRI: the effects of accurate fat spectral modeling. J Magn Reson Imaging 2009;29(6):1332–1339. [DOI] [PMC free article] [PubMed] [Google Scholar]
- 24.Liu CY, McKenzie CA, Yu H, Brittain JH, Reeder SB. Fat quantification with IDEAL gradient echo imaging: correction of bias from T(1) and noise. Magn Reson Med 2007;58(2):354–364. [DOI] [PubMed] [Google Scholar]
- 25.de Bazelaire CMJ, Duhamel GD, Rofsky NM, Alsop DC. MR imaging relaxation times of abdominal and pelvic tissues measured in vivo at 3.0 T: preliminary results. Radiology 2004;230(3):652–659. [DOI] [PubMed] [Google Scholar]
- 26.Chang JS, Taouli B, Salibi N, Hecht EM, Chin DG, Lee VS. Opposed-phase MRI for fat quantification in fat-water phantoms with 1H MR spectroscopy to resolve ambiguity of fat or water dominance. AJR Am J Roentgenol 2006;187(1):W103–W106. [DOI] [PubMed] [Google Scholar]
- 27.Fischer MA, Gnannt R, Raptis D, et al. Quantification of liver fat in the presence of iron and iodine: an ex-vivo dual-energy CT study. Invest Radiol 2011;46(6):351–358. [DOI] [PubMed] [Google Scholar]
- 28.Sauerbrei W, Royston P. Building multivariable prognostic and diagnostic models: transformation of the predictors by using fractional polynomials. J R Stat Soc Ser A Stat Soc 2002;162(1):71–94. [Google Scholar]
- 29.Schwenzer NF, Machann J, Martirosian P, et al. Quantification of pancreatic lipomatosis and liver steatosis by MRI: comparison of in/opposed-phase and spectral-spatial excitation techniques. Invest Radiol 2008;43(5):330–337. [DOI] [PubMed] [Google Scholar]
- 30.Sijens PE, Edens MA, Bakker SJL, Stolk RP. MRI-determined fat content of human liver, pancreas and kidney. World J Gastroenterol 2010;16(16):1993–1998. [DOI] [PMC free article] [PubMed] [Google Scholar]
- 31.Zhong X, Nickel MD, Kannengiesser SA, Dale BM, Kiefer B, Bashir MR. Liver fat quantification using a multi-step adaptive fitting approach with multi-echo GRE imaging. Magn Reson Med 2014;72(5):1353–1365. [DOI] [PubMed] [Google Scholar]
- 32.Heni M, Machann J, Staiger H, et al. Pancreatic fat is negatively associated with insulin secretion in individuals with impaired fasting glucose and/or impaired glucose tolerance: a nuclear magnetic resonance study. Diabetes Metab Res Rev 2010;26(3):200–205. [DOI] [PubMed] [Google Scholar]
- 33.van der Zijl NJ, Goossens GH, Moors CCM, et al. Ectopic fat storage in the pancreas, liver, and abdominal fat depots: impact on β-cell function in individuals with impaired glucose metabolism. J Clin Endocrinol Metab 2011;96(2):459–467. [DOI] [PubMed] [Google Scholar]
- 34.Ou HY, Wang CY, Yang YC, Chen MF, Chang CJ. The association between nonalcoholic fatty pancreas disease and diabetes. PLoS ONE 2013;8(5):e62561. [DOI] [PMC free article] [PubMed] [Google Scholar]
- 35.Saisho Y, Butler AE, Meier JJ, et al. Pancreas volumes in humans from birth to age one hundred taking into account sex, obesity, and presence of type-2 diabetes. Clin Anat 2007;20(8):933–942. [DOI] [PMC free article] [PubMed] [Google Scholar]
- 36.Wu WC, Wang CY. Association between non-alcoholic fatty pancreatic disease (NAFPD) and the metabolic syndrome: case-control retrospective study. Cardiovasc Diabetol 2013;12:77. [DOI] [PMC free article] [PubMed] [Google Scholar]
- 37.Lee JS, Kim SH, Jun DW, et al. Clinical implications of fatty pancreas: correlations between fatty pancreas and metabolic syndrome. World J Gastroenterol 2009;15(15):1869–1875. [DOI] [PMC free article] [PubMed] [Google Scholar]
- 38.Yuan F, Song B, Tang HH, Chen GW, Li J, Xie Y. Quantification of pancreas fat by MRS and FATSAT with 3.0T MRI [in Chinese]. Sichuan Da Xue Xue Bao Yi Xue Ban 2010;41(1):145–147, 157. [PubMed] [Google Scholar]
Associated Data
This section collects any data citations, data availability statements, or supplementary materials included in this article.