

Abstract
Species of grasshopper have been divided into three diet classifications based on mandible morphology: forbivorous (specialist on forbs), graminivorous (specialist on grasses), and mixed feeding (broad-scale generalists). For example, Melanoplus bivittatus and Dissosteira carolina are presumed to be broad-scale generalists, Chortophaga viridifasciata is a specialist on grasses, and Melanoplus femurrubrum is a specialist on forbs. These classifications, however, have not been verified in the wild. Multiple specimens of these four species were collected, and diet analysis was performed using DNA metabarcoding of the gut contents. The rbcLa gene region was amplified and sequenced using Illumina MiSeq sequencing. Levins’ measure and the Shannon–Wiener measure of niche breadth were calculated using family-level identifications and Morisita’s measure of niche overlap was calculated using operational taxonomic units (OTUs). Gut contents confirm both D. carolina and M. bivittatus as generalists and C. viridifasciata as a specialist on grasses. For M. femurrubrum, a high niche breadth was observed and species of grasses were identified in the gut as well as forbs. Niche overlap values did not follow predicted patterns, however, the low values suggest low competition between these species.
Keywords: Diet analysis, Illumina MiSeq, niche overlap, plants, rbcLa
Introduction
Grasshoppers (Orthoptera) have a wide range of feeding habits, from being strict resource specialists to broad generalists. Understanding the feeding ecology of grasshoppers can provide important insight into the evolution of diet specialization (Otte and Joern 1976; Karpestam and Forsman 2013) and resource partitioning among sympatric species (Krzysik 1979; Behmer and Joern 2008; Masloski et al. 2014). Food choices have been shown to affect fitness traits in grasshoppers, including fecundity, development, and survival (Joern 1979; Ebeling et al. 2013; Harrison et al. 2014).
Subfamilies and species of short-horned grasshoppers (Acrididae) have been previously classified by presumed feeding habit. Joern (1979) designated species of Melanoplinae as specialists on forbs (angiosperms excluding Poaceae, Juncaceae, and Cyperaceae), species of Gomphocerinae as specialists on grasses (Poaceae), and species of Oedipodinae as generalists. Isely (1944) described the mandible morphology of over one hundred species of Acrididae and Tettigoniidae (Orthoptera) and classified them as forbivorous (specialist on forbs), graminivorous (specialist on grasses), or mixed feeding (broad-scale generalists). Four species of Acrididae found in southern Ontario were classified by Isely (1944) as follows: Melanoplus femurrubrum (Melanoplinae) is forbivorous, Chortophaga viridifasciata (Oedipodinae) is graminivorous, and Melanoplus bivitattus (Melanoplinae) and Dissosteira carolina (Oedipodinae) are mixed feeders. These species classifications follow the subfamily classifications of Joern (1979) for M. femurrubrum and D. carolina, but not for M. bivittatus and C. viridifasciata. More recent studies of diet specialization for these species are also conflicting. Loaiza et al. (2008) describe M. bivittatus as a generalist. Tuberville et al. (1996) describe C. viridifasciata as a generalist. Previous studies have mainly employed controlled laboratory-based or modified field-based experiments and not direct analysis of wild-caught grasshoppers (e.g., Jonas and Joern 2008).
Conventional methods of grasshopper diet analysis rely on direct observation of feeding behavior, microscopic analysis, and carbon isotope analysis of gut contents (Behmer and Joern 2008; Jonas and Joern 2008; Ibanez et al. 2013; Karpestam and Forsman 2013). DNA sequence analysis allows for the identification of gut contents, including partially digested plants, to the family, genus, or species level (Jurado-Rivera et al. 2009; Navarro et al. 2010; Pompanon et al. 2012; García-Robledo et al. 2013; Kishimoto-Yamada et al. 2013; Heise et al. 2015). Specifically, DNA barcoding uses a standardized region of DNA for species-level identification (Hebert et al. 2003). The DNA barcode region is amplified, sequenced, and identified through comparison to an online database. The introduction of next-generation sequencing technologies, such as the Illumina MiSeq, allows for analysis of bulk samples (e.g., gut contents) containing DNA from multiple individuals, to be characterized at once, broadening the application of these technologies (Shokralla et al. 2012). This DNA metabarcoding approach has shown great potential in the analysis of environmental samples with a wide range of ecological applications including diet analysis (Hajibabaei 2012). Although DNA in food gets degraded as it passes through the digestive tract, partially degraded DNA can still be recovered and identified. For example, Boyer et al. (2013) were able to detect degraded earthworm DNA in the feces of snails and Pegard et al. (2009) were able to detect plant species consumed by livestock from fecal samples. Previous studies have been successful at using DNA metabarcoding for diet analysis in beetles (Kajtoch 2014; Kajtoch and Mazur 2015) as well as grasshoppers (Ibanez et al. 2013).
Plant DNA barcoding typically relies on chloroplast genes, and a two-locus barcode (ribulose-bisphosphate carboxylase gene (rbcLa) and maturase K (matK)) has been proposed as a DNA barcode for plants (CBOL 2009). While both gene regions have been used previously in diet analysis, it has been noted that most PCR amplification primers for matK do not adequately amplify a broad range of plant taxa (Heise et al. 2015). Alternate plant barcode regions, including tRNALeu UAA (trnL) and the trnH-psbA intergenic spacer, have been used for diet analysis. Both of these markers, however, are hampered by highly variable length and limited public database coverage (Heise et al. 2015), making them particularly poorly suited to use with metabarcoding protocols. The rbcLa region is useful for family- and genus-level identification, but does not usually resolve sequences well at the species level (Bafeel et al. 2012; Heise et al. 2015). The analysis of operational taxonomic units (OTUs) can provide higher resolution of the sequence diversity present in the gut even if all OTUs are not identified (Blaxter 2004). This is useful for calculating niche overlap to determine the resource partitioning where species identification is not required.
Here, we use rbcLa DNA metabarcoding to determine the diet breadth of four species of grasshoppers in the family Acrididae. We hypothesize that M. bivittatus and D. carolina are broad-scale generalists while C. viridifasciata and M. femurrubrum are specialists on grasses and forbs, respectively. We predict that the niche overlap between generalist species is high, the niche overlap is low between specialists, and the niche overlap is intermediate between generalists and specialists. This will allow us to quantitate how resources are partitioned among coexisting grasshopper species.
Material and Methods
Field collection
Grasshopper specimens were collected in September 2013 at three locations near Guelph, Ontario, Canada (Little Tract 43° 26.775′ N, 80° 14.861′ W; Starkey Hill 43° 32.712′N, 80° 9.303′ W; University of Guelph Arboretum 43° 32.389′ N, 80° 12.887′W). At Little Tract (LT), four individuals of Melanoplus bivittata and three individuals of Chortophaga viridifasciata were collected. At Starkey Hill (SH), four individuals of Dissosteira carolina and four individuals of Melanoplus femurrubrum were collected. At University of Guelph Arboretum (Arb), three individuals of D. carolina and two individuals of C. viridifasciata were collected. Specimens were preserved in 100% ethanol and stored at −20°C until processing (approximately 4 months).
Grasshopper identification
A leg was pulled from each individual collected, and DNA was extracted using a Macherey–Nagel nucleospin tissue extraction kit. PCR amplification was performed following Hajibabaei et al. (2012) on the DNA extracts to amplify the cytochrome c oxidase subunit I (COI) gene region using primers described in Folmer et al. (1994). Amplicons were then subjected to standard Sanger sequencing in an Applied Biosystems 3730XL DNA sequencer. Sequences were identified to species through comparison with the BOLD database (Ratnasingham and Hebert 2007) at a minimum 98% similarity.
Plant identification
Grasshopper guts (including foregut, midgut, and hindgut) were dissected out of each individual. Samples were homogenized using an MP FastPrep-24, and DNA extractions were performed using a Macherey–Nagel nucleospin tissue extraction kit. PCR amplification was used to amplify the rbcLa region (∼550 bp) for plant identification in the gut using the following primers: rbcLa-F ATGTCACCACAAACAGAGACTAAAGC and rbcLa-R GTAAAATCAAGTCCACCRCG (Levin et al. 2003). The PCR solution consisted of 2 μL of DNA template, 17.5 μL of molecular biology grade water, 2.5 μL of 10× reaction buffer (200 mM Tris-HCl, 500 mM KCl, pH 8.4), 1 μL of MgCl2 (50 mM), 0.5 μL of dNTPs mix (10 mM), 0.5 μL of the forward primer (10 mM), 0.5 μL of the reverse primer (10 mM) and 0.5 μL of Invitrogen’s Platinum Taq polymerase (5 U/μL). The PCR conditions consisted of 4 min at 94°C, 35 cycles of 30 sec at 94°C, 30 sec at 55°C, and 1 min at 72°C, with a final extension of 10 min at 72°C and held at 4°C. PCR products were visualized on 1.5% agarose gels, and any samples that did have sufficient product were amplified again using the same primers and the same conditions with five extra amplification cycles. All samples showed sufficient PCR products following either the first or second PCR protocol. PCR products were then purified using a Qiagen MinElute PCR purification kit and eluted in 30 μL of molecular biology grade water. Following purification, Illumina sequencing adaptors were added to the rbcLa products as described in Wong et al. (2013). This second PCR solution was made following the same protocol as previously described. The PCR conditions consisted of 2 min at 94°C, 35 cycles of 1 min at 94°C, 30 sec at 48°C, and 1 min at 72°C, with a final extension of 5 min at 72°C and held at 4°C. Products were visualized on a 1.5% agarose gel. As before, if any samples did not amplify well, they were amplified again following the PCR protocol with five extra cycles The amplicons for each individual were then purified, quantified, and sequenced using the Illumina MiSeq.
The Illumina sequences were filtered for quality and trimmed using PRINSEQ v0.20.4 (Schmieder and Edwards 2011) with a minimum 20 phred quality score, a window of 10, and a step of 5. Due to the read length limitation, the rcbLa region was analyzed as two fragments whose ends were paired to create a 550-bp sequence and clustered at 98% similarity. Sequences were identified using the MEGABLAST algorithm (Zhang et al. 2000) against a reference library of all rbcLa sequences downloaded from the GenBank database (March 17, 2014) with a minimum E-value of 1e-20. Sequence matches for each cluster were summarized using MEGAN 5 (Huson et al. 2011). Previous studies (e.g., Bokulich et al. 2013) have shown that with Illumina MiSeq sequencing, it is advisable to discard extremely rare sequences from metabarcoding analyses. For this reason, any cluster with less than ten sequences within an individual was omitted from subsequent analysis. The results from this analysis were used for niche breadth calculations.
All Illumina sequences from all twenty specimens were also compiled and clustered into 97% similarity OTUs using UCLUST software (Edgar 2010). All clusters including at least 100 sequences were included in a sequence number per specimen by OTU matrix. This matrix was used to calculate niche overlap and also subjected to a nonmetric multidimensional scaling (nMDS) analysis using the vegan package in R (Oksanen et al. 2013). This analysis uses a square root transformation of the matrix to generate Bray–Curtis (i.e., rank-based abundance) dissimilarities between specimens. These dissimilarities are then plotted in two dimensions.
Data analysis
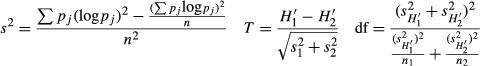
Species niche breadth was calculated using Levins’ measure (1968):
B = Levins’ measure of niche breadth
pj = fraction of items in the diet that are resource j
and the Shannon–Wiener measure (Shannon 1948):
H′ = Shannon–Wiener measure of niche breadth
pj = proportion of individuals using resource j
Levins’ measure emphasizes the most frequently used resources while the Shannon–Wiener measure emphasizes rarities in the diet (Krebs 1999). Both indices were used to compare niche breadth values with emphasis on rare and frequently used plants and to determine whether these different measures led to major differences in grasshopper species niche breadth. A t-test was used to compare Shannon–Wiener measures of niche breadth between species following Brower et al. (1997).
 |
pj = proportion of individuals using resource j
 ,
,  = Shannon–Wiener measure of niche breadth of species 1 and 2
 ,
,  = variance of
  and
and 
n = total number of resources used by all individuals
T = T statistic
df = degrees of freedom
These calculations were performed on sequences identified to the family level and the highest level of resolution where the majority of sequences were identified.
Species niche overlap was calculated using Morisita’s measure (1959):
 |
C = Morisita’s measure of niche overlap between species j and k
pij = proportion resource i is of the total resources used by species j
pik = proportion resource i is of the total resources used by species k
nij = number of individuals of species j that use resource category i
nik = number of individuals of species j that use resource category k
Nj, Nk = total number of each species in sample
Morisita’s measure has been suggested as the least biased measure of niche overlap (Krebs 1999). Niche overlap measures were calculated using unidentified OTUs.
Sequences that were identified to species were cross-referenced with the Plants of Canada Database (Canadian Food Inspection Agency 2013), and any plant species that was not found in the database was not reported here.
Results
The results of sequencing, filtering, clustering, and taxonomic identification are displayed in Table1. The majority of sequences were identified to family level; however, genus-level identification was variable, and species-level identification was achieved in <5% of the filtered sequences for most samples. Poaceae was detected in all species. Poaceae was the only major family identified from C. viridifasciata gut sequences. M. bivittatus, D. carolina and M. femurrubrum all had between three and seven major plant families present in the gut. Polygonaceae was the only family other than Poaceae that was found in all three of these species.
Table 1.
Summary of Illumina rbcLa sequence output, including quality filtering, 98% similarity clustering, and percentage identified to family level, genus level, and species level
| Individuals | Species | Total # of Seqs | # of Seqs filtered | # Clusters | % Seqs ID’d to family | % Seqs ID’d to genus | % Seqs ID’d to species |
|---|---|---|---|---|---|---|---|
| Arb 2I | C.v. | 117,233 | 47,419 | 18,183 | 97.91 | 4.94 | 1.67 |
| Arb 2J | C.v. | 67,050 | 32,029 | 8388 | 98.57 | 2.02 | 1.38 |
| Arb A | D.c. | 118,210 | 65,683 | 22,703 | 99.59 | 84.19 | 1.45 |
| Arb B | D.c. | 282,533 | 38,330 | 11,621 | 89.99 | 5.18 | 4.96 |
| Arb C | D.c. | 373,372 | 12,791 | 7494 | 63.43 | 51.88 | 1.00 |
| LT A | C.v. | 340,301 | 26,910 | 10,731 | 86.45 | 17.09 | 1.46 |
| LT B | C.v. | 302,982 | 30,459 | 9715 | 93.22 | 2.18 | 1.43 |
| LT C | C.v. | 101,816 | 50,890 | 14,378 | 96.10 | 3.22 | 1.10 |
| LT D | M.b. | 89,875 | 36,898 | 15,256 | 94.45 | 8.50 | 3.64 |
| LT F | M.b. | 102,254 | 65,156 | 21,351 | 98.95 | 87.22 | 0.68 |
| LT G | M.b. | 105,870 | 64,438 | 20,625 | 94.48 | 0.70 | 0.35 |
| LT H | M.b. | 253,502 | 38,223 | 13,000 | 93.70 | 9.63 | 2.03 |
| SH A | M.f. | 140,212 | 99,031 | 38,627 | 95.82 | 74.51 | 2.40 |
| SH B | M.f. | 593,645 | 31,878 | 12,803 | 81.23 | 2.98 | 2.05 |
| SH C | M.f. | 96,266 | 27,110 | 10,982 | 71.39 | 8.40 | 6.99 |
| SH D | M.f. | 118,638 | 51,475 | 14,609 | 96.17 | 1.94 | 1.43 |
| SH E | D.c. | 64,666 | 44,582 | 16,207 | 99.82 | 95.47 | 0.13 |
| SH F | D.c. | 305,822 | 37,731 | 16,186 | 91.16 | 71.41 | 1.82 |
| SH G | D.c. | 395,608 | 64,258 | 21,717 | 96.27 | 2.27 | 1.72 |
| SH H | D.c. | 162,668 | 45,754 | 22,269 | 88.64 | 76.62 | 36.50 |
M.f., Melanoplus femurrubrum; M.b., Melanoplus bivittata; D.c., Dissosteira Carolina; C.v., Chortophaga viridifasciata.
Family-level sequence identifications are displayed as a proportion of sequences identified to each plant family for each species of grasshopper in Figure1. These proportions were used to calculate Levins’ niche breadth. Figure2 displays family-level sequence identification as a proportion of individuals of each grasshopper species with that plant family identified in the gut. These proportions were used to calculate the Shannon–Wiener measure of niche breadth. Both Levins’ and Shannon–Wiener niche breadth measures are displayed in Table2 for each species. With both measures, C. viridifasciata had the lowest niche breadth. Results from t-tests performed on the Shannon–Wiener measure between all species are shown in Table3. There was a significant difference between the niche breadth of C. viridifasciata and all three other grasshopper species. There was also a significant difference between the niche breadth of M. femurrubrum and D. carolina. Morisita’s measure of niche overlap between all species at the OTU level is shown in Table4. The highest niche overlap was seen between M. femurrubrum and D. carolina, while the lowest niche overlap was seen between M. bivittatus and D. carolina. Melanoplus femurrubrum had consistently high niche overlap with all three other species.
Figure 1.

Proportion of quality trimmed and filtered rbcLa sequences from the gut contents of four species of grasshoppers identified to each plant family in all individuals combined.
Figure 2.
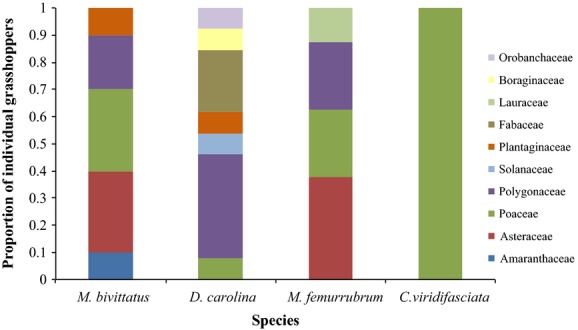
Proportion of individual grasshoppers in which each plant family was identified in the gut for four grasshopper species.
Table 2.
Levins’ and Shannon–Wiener (S-W) measures of niche breadth for four grasshopper species
| Levins’ | S-W | |
|---|---|---|
| M. bivittatus | 2.903 | 0.639 |
| M. femurrubrum | 2.854 | 0.545 |
| C. viridifasciata | 1 | 0 |
| D. carolina | 2.639 | 0.866 |
Table 3.
Results of t-test between Shannon–Wiener niche breadths at the family level in four grasshopper species
| M. femurrubrum | C. viridifasciata | D. carolina | |
|---|---|---|---|
| M. bivittatus | P > 0.05 | P < 0.05 | P > 0.05 |
| t = 0.79 | t = 7.79 | t = 1.77 | |
| df = 4 | df = 5 | df = 11 | |
| M. femurrubrum | P < 0.05 | P < 0.05 | |
| t = 6.33 | t = 2.45 | ||
| df = 4 | df = 4 | ||
| C. viridifasciata | P < 0.05 | ||
| t = 8.78 | |||
| df = 7 |
Significant differences are in bold.
Table 4.
Morisita’s measure of niche overlap between four grasshopper species at the operational taxonomic unit (OTU) level
| M. femurrubrum | C. viridifasciata | D. carolina | |
|---|---|---|---|
| M. bivittatus | 0.0427 | 0.0194 | 0.0108 |
| M. femurrubrum | 0.0721 | 0.172 | |
| C. viridifasciata | 0.0261 |
The nMDS plot of OTUs containing at least 100 sequences (n = 74) is shown in Figure3 (stress value −0.13). This nonmetric plot of community composition based on all recovered sequences recovers minimal overlap between species. There is no overlap at all between M. femurrubrum and D. carolina. There is some overlap of M. bivittatus with both M. femurrubrum and D. carolina. There is also some small overlap of C. viridifasciata with both M. femurrubrum and D. carolina.
Figure 3.
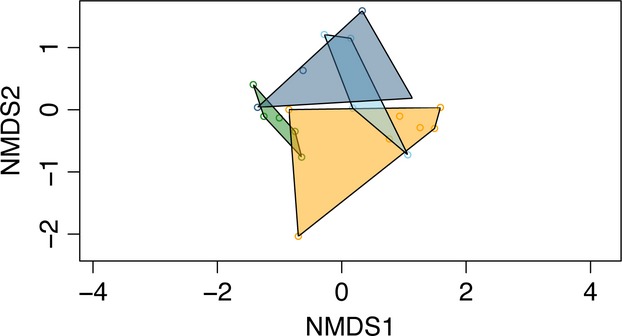
Nonmetric multidimensional scaling (nMDS) analysis of OTUs generated from all rbcL sequences recovered from the guts of all twenty grasshopper specimens. Polygons include all points corresponding to all specimens of each species. Green – C. viridifasciata; orange – D. carolina; light blue – M. bivittatus; dark blue – M. femurrubrum.
Measures of niche breadth and overlap consider all individuals in a consumer species together. Not all individuals of a grasshopper species had the same resource plant families or OTUs identified in the gut. C. viridifasciata was the only species in which all individuals had the same resource plant families in the gut since only a single family, Poaceae, was present. The other three grasshopper species had between four and seven plant families identified in the gut; however, each individual of these species had only one or two families identified in the gut. The majority of plant families were found in more than one individual of each grasshopper species. At the OTU level, there were also considerable differences between individuals (Table5). Most OTUs were found in only one or two individuals of each species. All individuals had between 3 and 37 OTUs present with an average 19.25 OTUs present in each individual. This suggests that the individual niche breadth is much smaller than the species niche breadth for each grasshopper species. Species-level identification represented only a small fraction of the total sequences (Table2). Plant species identified in the gut of each grasshopper species are found in the online supporting material. One species of introduced ornamental grass, Arrhenatherum elatius, was found in the gut of all four grasshopper species.
Table 5.
Heat map of rbcLa OTU recovery for the gut contents of four species of grasshopper

Discussion
Molecular analysis of gut contents provides a clear picture of the feeding habits of the four species studied. Dissosteira carolina, described as a generalist by both Joern (1979) and Isely (1944), had high niche breadth values and multiple plant families present in the gut, making it a generalist. Melanoplus bivittatus, described as a forb specialist by Joern (1979) and a generalist by Isely (1944) and Loaiza et al. (2008), also had high niche breadth values and multiple plant families present in the gut, making it a generalist. Chortophaga viridifasciata, described as a generalist by Joern (1979) and Tuberville et al. (1996) and a grass specialist by Isely (1944), had the smallest niche breadth, and Poaceae was the only family identified in the gut. Melanoplus femurrubrum, described as a forb specialist by Joern (1979) and Isely (1944), has a relatively high niche breadth (Shannon-Wiener: 0.545) and was much more similar to the two generalist species (S-W: 0.639 and 0.866) than to the specialist (S-W: 0). Furthermore, both forbs and grasses were identified from the gut contents of M. femurrubrum indicating that it does not feed exclusively on forbs. Our niche breadth predictions were true for three species: C. viridifasciata had a small niche breadth, and D. carolina and M. bivittatus had high niche breadths. M. femurrubrum had a higher niche breadth than predicted. Niche breadth values were similar to those found in diet analyses of other Orthoptera species using morphological identification of fecal contents (Capello et al. 2012).
A previous investigation of six species of Orthoptera diets (Capello et al. 2012) recovered niche overlap values much higher (range: 0.015–0.842) than those recovered here (range: 0.011–0.172). While these previous measures were calculated with Pianka’s (1974) overlap measure, this has been demonstrated to be comparable to the Morisita measure employed here (Goodyear 1992; Qi et al. 2009). Our lower values are likely due to the greater number of diet components included in analysis. Whereas previous experiments utilized only fourteen morphologically identifiable plant species, our analysis employed 74 genetically distinct OTUs. The lowest niche overlap was observed between the generalists M. bivittatus and D. carolina, suggesting reduced interspecific competition for resources. The highest niche overlaps were between M. femurrubrum and each of the other three species. The relatively low overlap values suggest low competition between species for local resources. The nMDS plot (Fig.3) is useful in demonstrating the low niche overlap we observed. The distinct areas occupied by the four species on the graph represent the distinct sets of plant resources used by these species. We also observed patterns of niche overlap that did not follow our predictions; however, the results suggest that among coexisting grasshoppers, there is resource partitioning to reduce competition.
Our estimates of niche breadth give important insight into the local feeding ecology and use of resources by these grasshoppers. Due to the small number of individuals processed here, they must be assumed, however, to be underestimates of the niche breadth of the species as a whole. Diet breadth may change with season as is seen in other generalist herbivores (Stolter et al. 2013). The diet may also be different across the range of these species as plant species availability and environmental conditions differ (Kajtoch 2014; Kajtoch and Mazur 2015). Changes in diet across a species’ range have been observed in other grasshopper species (Franzke et al. 2010). Additionally, DNA analysis of diet cannot reflect diet over a large temporal scale as it is limited by the transit time of food through the digestive tract of grasshoppers – estimated at 6 h (Chapco and Kelln 1994).
The rbcLa region is effective for family-level identification; however, it performs poorly at lower taxonomic levels, as observed in this study. Other studies have shown similar patterns of plant identification using rbcLa (CBOL 2009; Burgess et al. 2011; Wallace et al. 2012). Accurate taxonomic assignment using DNA barcodes is also linked to availability of reference sequences from identified species. While the reference library available for rbcLa is larger than many other plant markers, higher resolution in identifying gut contents could be accomplished by improving the reference library or using additional markers, such as matK (megakaryote-associated tyrosine kinase gene in the chloroplast) or ITS (ribosomal internal transcribed spacer) (Pompanon et al. 2012). The rbcLa gene region has previously been used in diet analysis studies of insects with successful family-level identifications (Kishimoto-Yamada et al. 2013). As a relatively long gene region (∼550 bp), rbcLa may not amplify well for degraded sample tissues. However, we have demonstrated the ability to use Illumina MiSeq sequencing to recover the full rbcLa region from gut contents of grasshoppers.
The number of sequences assigned to each taxon may not accurately reflect relative abundance of a plant in the gut due to biases during PCR amplification, quality filtering biases, and minimum read length (Deagle et al. 2013). In this study, we had very high depth of coverage and individuals had between one and three OTUs present at very high sequence numbers that would not have been generated purely by bias. However, calculating two values of niche breadth, one which used the number of sequences for each family and one which did not use the number of sequences, helped to account for any biases in the number of sequences. The Shannon–Wiener measure used the proportion of individuals the family was identified in and yielded similar, although slightly different, results to Levins’ measure which used the number of sequences.
In this study, we were able to draw preliminary conclusions regarding the feeding ecology of four grasshopper species. We provide evidence that three of these grasshopper species are feeding according to the generalist and specialist groups to which they have previously been classified. The fourth species, M. femurrubrum, previously classified as a specialist on forbs, would be better classified as a generalist. Furthermore, we were able to show that these three sympatric generalist grasshoppers are able to reduce competition by making use of different resources. We also provide some insight into the use of the full-length rbcLa region for future diet analysis.
Acknowledgments
Special thanks to G. Capretta for assistance with sample collection. J. F. Gibson was funded by an NSERC Postdoctoral Fellowship and an NSERC Visiting Fellowship in a Government Laboratory. This project was funded by the Government of Canada through Genome Canada and the Ontario Genomics Institute through the Biomonitoring 2.0 project (OGI-050) (to M. Hajibabaei). M. Hajibabaei is also funded by an NSERC Discovery Grant.
Conflict of Interest
None declared.
Data accessibility
DNA sequences generated in this study have been deposited to DRYAD and are accessible under accession number – doi:10.5061/dryad.r8c3b.
Supporting Information
Table S1. Plant species identified in the gut of each grasshopper species with number of sequences.
References
- Bafeel SO, Arif IA, Bakir MA, Al Homaidan AA, Al Farhan AH. Khan HA. DNA barcoding of arid wild plants using rbcLa gene sequences. Genet. Mol. Res. 2012;2:e508. doi: 10.4238/2012.July.19.12. [DOI] [PubMed] [Google Scholar]
- Behmer ST. Joern A. Coexisting generalist herbivores occupy unique nutritional feeding niches. Proc. Natl Acad. Sci. USA. 2008;105:1977–1982. doi: 10.1073/pnas.0711870105. [DOI] [PMC free article] [PubMed] [Google Scholar]
- Blaxter ML. The promise of a DNA taxonomy. Philos. Trans. R. Soc. Lond. B Biol. Sci. 2004;359:669–679. doi: 10.1098/rstb.2003.1447. [DOI] [PMC free article] [PubMed] [Google Scholar]
- Bokulich NA, Subramanian S, Faith JJ, Gevers D, Gordon JI, Knight R, et al. Quality-filtering vastly improves diversity estimates from Illumina amplicon sequencing. Nat. Methods. 2013;10:57–59. doi: 10.1038/nmeth.2276. [DOI] [PMC free article] [PubMed] [Google Scholar]
- Boyer S, Wratten SD, Holyoake A, Abdelkrim J. Cruickshank RH. Using next-generation sequencing to analyse the diet of a highly endangered land snail (Powelliphanta augusta) feeding on endemic earthworms. PLoS One. 2013;8:e75962. doi: 10.1371/journal.pone.0075962. [DOI] [PMC free article] [PubMed] [Google Scholar]
- Brower JE, Zar JH. von Ende C. Field and laboratory methods for general ecology. 4th ed. Boston, MA: WCB McGraw-Hill; 1997. [Google Scholar]
- Burgess KS, Fazekas AJ, Kesanakurti PR, Graham SW, Husband BC, Newmaster SG, et al. Discriminating plant species in a local temperate flora using the rbcLa +matK DNA barcode. Methods Ecol. Evol. 2011;2:333–340. [Google Scholar]
- Canadian Food Inspection Agency. 2013. Plants of Canada Database www.plantsofcanada.info.gc.ca. Modified 2013-12-11.
- Capello S, Marchese M. de Wysiecki ML. Feeding habits and trophic niche overlap of aquatic Orthoptera associated with macrophytes. Zool. Stud. 2012;51:51–58. [Google Scholar]
- CBOL. A DNA barcode for land plants. Proc. Natl Acad. Sci. USA. 2009;106:12794–12797. doi: 10.1073/pnas.0905845106. Plant Working Group. [DOI] [PMC free article] [PubMed] [Google Scholar]
- Chapco W. Kelln RA. Persistence of ingested bacteria in the grasshopper gut. J. Invertebr. Pathol. 1994;64:149–150. [Google Scholar]
- Deagle BE, Thomas AC, Shaffer AK, Trites AW. Jarman SN. Quantifying sequence proportions in a DNA-based diet study using Ion Torrent amplicon sequencing: which counts count? Mol. Ecol. Resour. 2013;13:620–633. doi: 10.1111/1755-0998.12103. [DOI] [PubMed] [Google Scholar]
- Ebeling A, Allan E, Heimann J, Köhler G, Scherer-Lorenzen M, Vogel A, et al. The impact of plant diversity and fertilization on fitness of a generalist grasshopper. Basic Appl. Ecol. 2013;14:246–254. [Google Scholar]
- Edgar RC. Search and clustering orders of magnitude faster than BLAST. Bioinformatics. 2010;26:2460–2461. doi: 10.1093/bioinformatics/btq461. [DOI] [PubMed] [Google Scholar]
- Folmer O, Black M, Hoeh W, Lutz R. Vrijnhoek R. DNA primers for amplification of mitochondrial cytochrome c oxidase subunit I from diverse metazoan invertebrates. Mol. Mar. Biol. Biotech. 1994;3:294–299. [PubMed] [Google Scholar]
- Franzke A, Unsicker SB, Specht J, Köhler G. Weisser WW. Being a generalist herbivore in a diverse world: how do diets from different grasslands influence food plant selection and fitness of the grasshopper Chorthippus parallelus. Ecol. Entomol. 2010;35:126–138. [Google Scholar]
- García-Robledo C, Erickson DL, Staines CL, Erwin TL. Kress WJ. Tropical plant-herbivore networks: reconstructing species interactions using DNA barcodes. PLoS One. 2013;8:e52967. doi: 10.1371/journal.pone.0052967. [DOI] [PMC free article] [PubMed] [Google Scholar]
- Goodyear NC. Spatial overlap and dietary selection of native rice rats and exotic rice rats. J. Mammal. 1992;73:186–200. [Google Scholar]
- Hajibabaei M. The golden age of DNA metasystematics. Trends Genet. 2012;28:535–537. doi: 10.1016/j.tig.2012.08.001. [DOI] [PubMed] [Google Scholar]
- Hajibabaei M, Spall JL, Shokralla S. van Konynenburg S. Assessing biodiversity of a freshwater benthic macroinvertebrate community through nondestructive environmental barcoding of DNA from preservative ethanol. BMC Ecol. 2012;12:28. doi: 10.1186/1472-6785-12-28. [DOI] [PMC free article] [PubMed] [Google Scholar]
- Harrison SJ, Raubenheimer D, Simpson SJ, Godin J-G. Bertram SM. Towards a synthesis of frameworks in nutritional ecology: interacting effects of protein, carbohydrate and phosphorus on field cricket fitness. Proc. R. Soc. B. 2014;281:20140539. doi: 10.1098/rspb.2014.0539. [DOI] [PMC free article] [PubMed] [Google Scholar]
- Hebert PDN, Cywinska A, Ball SL. deWaard JR. Biological identifications through DNA barcodes. Proc. R. Soc. B. 2003;270:313–321. doi: 10.1098/rspb.2002.2218. [DOI] [PMC free article] [PubMed] [Google Scholar]
- Heise W, Babik W, Kubisz D. Kajtoch Ł. A three-marker DNA barcoding approach for ecological studies of xerothermic plants and herbivorous insects from central Europe. Bot. J. Linn. Soc. 2015;177:576–592. [Google Scholar]
- Huson DH, Mitra S, Ruscheweyh H-J, Weber N. Schuster SC. Integrative analysis of environmental sequences using MEGAN4. Genome Res. 2011;21:1552–1560. doi: 10.1101/gr.120618.111. [DOI] [PMC free article] [PubMed] [Google Scholar]
- Ibanez S, Manneville O, Miquel C, Taberlet P, Valentini A, Aubert S, et al. Plant functional traits reveal the relative contribution of habitat and food preferences to the diet of grasshoppers. Oecologia. 2013;173:1459–1470. doi: 10.1007/s00442-013-2738-0. [DOI] [PubMed] [Google Scholar]
- Isely FB. Correlation between mandibular morphology and food specificity in grasshoppers. Ann. Entomol. Soc. Am. 1944;37:47–67. [Google Scholar]
- Joern A. Feeding patterns in grasshoppers (Orthoptera: Acrididae): factors influencing diet specialization. Oecologia. 1979;38:325–347. doi: 10.1007/BF00345192. [DOI] [PubMed] [Google Scholar]
- Jonas JL. Joern A. Host-plant quality alters grass/forb consumption by a mixed-feeding insect herbivore, Melanoplus bivittatus (Orthoptera: Acrididae) Ecol. Entomol. 2008;33:546–554. [Google Scholar]
- Jurado-Rivera JA, Vogler AP, Reid CAM, Petitpierre E. Gómez-Zurita J. DNA barcoding insect-host plant associations. Proc. R. Soc. B. 2009;276:639–648. doi: 10.1098/rspb.2008.1264. [DOI] [PMC free article] [PubMed] [Google Scholar]
- Kajtoch Ł. A DNA metabarcoding study of a polyphagous beetle dietary diversity: the utility of barcodes and sequencing techniques. Folia Biol. (Kraków) 2014;62:223–234. doi: 10.3409/fb62_3.223. [DOI] [PubMed] [Google Scholar]
- Kajtoch Ł. Mazur MA. The impact of environmental conditions on efficiency of host plant DNA barcoding for polyphagous beetles. Environ. Entomol. 2015;44:325–329. doi: 10.1093/ee/nvv019. [DOI] [PubMed] [Google Scholar]
- Karpestam E. Forsman A. Stable isotopes reveal dietary divergence between dispersal phenotypes in Tetrix subulata pygmy grasshoppers (Orthoptera: Tetrigidae) Eur. J. Entomol. 2013;110:65–70. [Google Scholar]
- Kishimoto-Yamada K, Kamiya K, Meleng P, Diway B, Kaliang H, Chong L, et al. Wide host ranges of herbivorous beetles? Insights from DNA bar coding. PLoS One. 2013;8:e74426. doi: 10.1371/journal.pone.0074426. [DOI] [PMC free article] [PubMed] [Google Scholar]
- Krebs CJ. Ecological methodology. 2nd ed. Menlo Park, CA: Benjamin/Cummings; 1999. [Google Scholar]
- Krzysik AJ. Resource allocation, coexistence, and the niche structure of a streambank salamander community. Ecol. Monogr. 1979;49:173–194. [Google Scholar]
- Levin RA, Wagner WL, Hoch PC, Nepokroeff M, Pires JC, Zimmer EA, et al. Family-level relationships of Onagraceae based on chloroplast rbcLa and ndhF data. Am. J. Bot. 2003;90:107–115. doi: 10.3732/ajb.90.1.107. [DOI] [PubMed] [Google Scholar]
- Levins R. Evolution in changing environments. Princeton, NJ: Princeton University Press; 1968. [Google Scholar]
- Loaiza V, Jonas JL. Joern A. Does dietary P affect feeding and performance in the mixed-feeding grasshopper (Acrididae) Melanoplus bivitattus. Physiol. Ecol. 2008;37:333–339. doi: 10.1603/0046-225x(2008)37[333:ddpafa]2.0.co;2. [DOI] [PubMed] [Google Scholar]
- Masloski K, Greenwood C, Reiskind M. Payton M. Evidence for diet-driven habitat partitioning of Melanoplinae and Gomphocerinae (Orthoptera: Acrididae) along a vegetation gradient in a western Oklahoma grassland. Environ. Entomol. 2014;43:1209–1214. doi: 10.1603/EN13349. [DOI] [PubMed] [Google Scholar]
- Morisita M. Measuring the dispersion of individuals and analysis of the distributional patterns. Mem. Faculty Sci. Kyushu Univ. Ser. E. 1959;2:215–235. (Biology) [Google Scholar]
- Navarro SP, Jurado-Rivera JA, Gómez-Zurita J, Lyal CHC. Vogler AP. DNA profiling of host-herbivore interactions in tropical forests. Ecol. Entomol. 2010;35:18–32. [Google Scholar]
- Oksanen J, Blanchet FG, Kindt R, Legendre P, Minchin PR, O’Hara RB, et al. 2013. ( vegan: Community Ecology Package. R package version 2.0-10.
- Otte D. Joern A. On feeding fatterns in desert grasshoppers and the evolution of specialized diets. Proc. Acad. Nat. Sci. Philadelphia. 1976;128:89–126. [Google Scholar]
- Pegard A, Miquel C, Valentini A, Coissac E, Bouvier F, Francois P, et al. Universal DNA-based methods for assessing the diet of grazing livestock and wildlife from feces. J. Agric. Food Chem. 2009;57:5700–5706. doi: 10.1021/jf803680c. [DOI] [PubMed] [Google Scholar]
- Pianka ER. Niche overlap and diffuse competition. Proc. Natl Acad. Sci. USA. 1974;71:2141–2145. doi: 10.1073/pnas.71.5.2141. [DOI] [PMC free article] [PubMed] [Google Scholar]
- Pompanon F, Deagle BE, Symondson WOC, Brown DS, Jarman SN. Taberlet P. Who is eating what: diet assessment using next generation sequencing. Mol. Ecol. 2012;21:1931–1950. doi: 10.1111/j.1365-294X.2011.05403.x. [DOI] [PubMed] [Google Scholar]
- Qi D, Hu Y, Gu X, Li M. Wei F. Ecological niche modeling of the sympatric giant and red pandas on a mountain-range scale. Biodivers. Conserv. 2009;18:2127–2141. [Google Scholar]
- Ratnasingham S. Hebert PDN. BOLD: the barcode of life data system. Mol. Ecol. Notes. 2007;7:355–364. doi: 10.1111/j.1471-8286.2007.01678.x. www.barcodinglife.org. [DOI] [PMC free article] [PubMed] [Google Scholar]
- Schmieder R. Edwards R. Quality control and preprocessing of metagenomic datasets. Bioinformatics. 2011;27:863–864. doi: 10.1093/bioinformatics/btr026. [DOI] [PMC free article] [PubMed] [Google Scholar]
- Shannon CE. A mathematical theory of communication. Bell Syst. Tech. J. 1948;27:379–423. 623–656. [Google Scholar]
- Shokralla S, Spall JL, Gibson JF. Hajibabaei M. Next-generation sequencing technologies for environmental DNA research. Mol. Ecol. 2012;21:1794–1805. doi: 10.1111/j.1365-294X.2012.05538.x. [DOI] [PubMed] [Google Scholar]
- Stolter C, Ball JP. Julkunen-Titto R. Seasonal differences in the relative importance of specific phenolics and twig morphology result in contrasting patterns of foraging by a generalist herbivore. Can. J. Zool. 2013;347:338–347. [Google Scholar]
- Tuberville TD, Dudley PG, Pollard AJ, Dudley PG, Joseph A. Ibberville TD. Responses of invertebrate herbivores to stinging trichomes of Urtica dioica and Laportea canadensis. Oikos. 1996;75:83–88. [Google Scholar]
- Wallace LJ, Boilard SMAL, Eagle SHC, Spall JL, Shokralla S. Hajibabaei M. DNA barcodes for everyday life: routine authentication of Natural Health Products. Food Res. Int. 2012;49:446–452. [Google Scholar]
- Wong KH, Jin Y. Moqtaderi Z. Mutiplex Illumina sequencing using DNA barcoding. Curr. Protoc. Mol. Biol. 2013;101:7.11.1–7.11.11. doi: 10.1002/0471142727.mb0711s101. [DOI] [PubMed] [Google Scholar]
- Zhang Z, Schwartz S, Wagner L. Miller W. A greedy algorithm for aligning DNA sequences. J. Comput. Biol. 2000;7:203–214. doi: 10.1089/10665270050081478. [DOI] [PubMed] [Google Scholar]
Associated Data
This section collects any data citations, data availability statements, or supplementary materials included in this article.
Supplementary Materials
Table S1. Plant species identified in the gut of each grasshopper species with number of sequences.
Data Availability Statement
DNA sequences generated in this study have been deposited to DRYAD and are accessible under accession number – doi:10.5061/dryad.r8c3b.