

Abstract
The T box riboswitch is an intriguing potential target for antibacterial drug discovery. Found primarily in Gram-positive bacteria, the riboswitch regulates gene expression by selectively responding to uncharged tRNA to control transcription readthrough. Polyamines and molecular crowding are known to specifically affect RNA function, but their effect on T box riboswitch efficacy and tRNA affinity have not been fully characterized. A fluorescence-monitored in vitro transcription assay was developed to readily quantify these molecular interactions and to provide a moderate-throughput functional assay for a comprehensive drug discovery screening cascade. The polyamine spermidine specifically enhanced T box riboswitch readthrough efficacy with an EC50 = 0.58 mM independent of tRNA binding. Molecular crowding, simulated by the addition of polyethylene glycol, had no effect on tRNA affinity for the riboswitch, but did reduce the efficacy of tRNA-induced readthrough. These results indicate that the T box riboswitch tRNA affinity and readthrough efficacy are intricately modulated by environmental factors.
Keywords: RNA, Drug discovery, T box riboswitch, Spermidine, Molecular crowding
Graphical abstract
1. Introduction
The T box riboswitch regulates transcription of many amino-acid related bacterial genes (e.g., aminoacyl-tRNA synthetases) and is a novel target for the development of antibacterial therapeutic agents [1]. Located in the 5′-leader region of the mRNA transcript, the riboswitch structurally responds to cognate, uncharged tRNA (an indicator of amino acid starvation) to control transcription readthrough [1-3]. The anticodon of the tRNA base pairs with a specifier sequence in Stem I of the riboswitch [4,5] and forms contacts with the Stem I apical loop [6,7], while the tRNA acceptor end base pairs with nucleotides in the 7-nt bulge of the highly conserved antiterminator element which enables transcription readthrough by stabilizing the antiterminator [8,9]. In the absence of uncharged tRNA, a more stable structural element (the terminator) forms preferentially resulting in premature termination of transcription [1].
Antibacterial drug resistance is a significant global health concern making it essential to identify new antibacterial agents, ideally ones with a novel mechanism of action [10-12]. Targeting other riboswitches and noncoding RNA is an active, but relatively new area of drug discovery [13-18]. The T box riboswitch is an attractive potential target since it often regulates essential genes, is frequently found in multiple genes within an organism and, its default state is “off” where no transcription occurs if a sufficient quantity of native ligand (cognate uncharged tRNA) is not present or is unable to bind [1].
As part of a comprehensive drug discovery effort, we have been investigating the highly conserved antiterminator element as a specific RNA target within the T box riboswitch [19-26]. Using a fluorescence-based binding assay we determined that T box antiterminator model RNA binds aminoglycosides in a structure-specific manner primarily through electrostatic interactions [27,28]. Synthetic 4,5-disubstituted oxazolidinones bind antiterminator model RNA with a structure-activity-relationship that involves hydrogen-bonding and other non-electrostatic interactions [29-31]. In a single-round in vitro transcription assay, the T box riboswitch function was also modulated by oxazolidinones [32]. The oxazolidinone analogs, 1,4-disubstituted 1,2,3-triazoles, bind antiterminator model RNA in a structure-specific manner [33-35] and inhibit tRNA binding to antiterminator model RNA [36].
The development of functionally relevant, medium-throughput primary and secondary screening assays has been essential to effectively identify ligands that bind T box antiterminator model RNA and disrupt its interaction with tRNA [37]. Follow-up functional studies using a single-round in vitro transcription assay have been used to asses select compounds [32], however, the multiple steps involved are not amenable to screening compound libraries, nor for readily screening multiple reaction conditions to precisely discern potentially subtle differences. Consequently, there is a significant need in the T box-targeted drug discovery cascade for a medium-throughput functional assay. In addition, the development of targeted therapeutic agents relies on a full understanding of the extent to which other factors affect the T box riboswitch mechanism. This work investigates the affinity and efficacy for tRNA-induced readthrough of the Bacillus subtilis glyQS T box riboswitch, using a fluorescence-monitored in vitro transcription assay (Figure 1), and the effect that molecular interactions have on these quantified descriptors in the presence of a co-factor, co-solutes and a 1,4-disubstituted 1,2,3-triazole potential inhibitor.
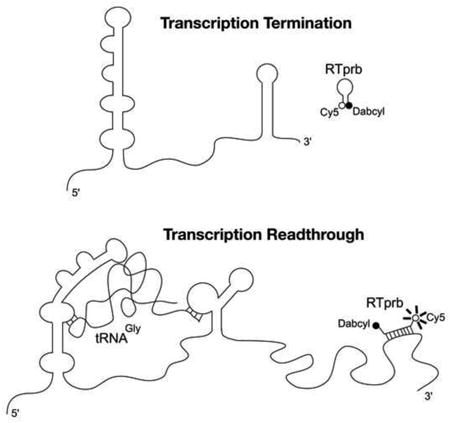
Figure 1. Schematic of glyQS T box riboswitch and fluorescence-monitored transcription readthrough.

a) In the absence of tRNAGly transcription terminates prior to the RNA sequence targeted by the fluorescent probe RTprb. The hairpin form of RTprb has minimal background fluorescence due to Cy5 fluorescence being quenched by Dabcyl. b) Transcription readthrough induced by tRNAGly produces the full-length transcript, including the target sequence of RTprb. RTprb binds the target sequence, unfolding the hairpin structure such that Dabcyl no longer quenches Cy5 and fluorescence increases.
2. Materials and Methods
2.1 Nucleic Acids
The fluorescently labeled readthrough probe (RTprb) was obtained from Trilink as 5′ Cy5-CGCAccuccacuuuucuuucauaaTGCG-Dabcyl 3′ where the upper case letters represent deoxyribonucleotides and lower case letters 2′-O-methyl ribonucleotides. The design of RTprb utilized a chimeric molecular beacon approach [38] and relied on the enhanced RNA binding of 2′-O-methyl nucleotides [39-41]. The Target Sequence RNA, used for testing the RTprb fluorescence response, was obtained from Trilink as 5′ UUAUGAAAGAAAAGUGGAGGUGC 3′.
The B. subtilis glyQS template dsDNA [2] was obtained from PCR amplification of a plasmid containing the template DNA using Pfu turbo DNA polymerase (Agilent Technologies) and purified by QIAquick PCR Purification Kit (Qiagen) following the manufacturer's instructions. The DNA templates for tRNAGly [42] and tRNATyr [19] and discriminator base variants were amplified from plasmids and purified in a similar manner. The tRNA was prepared as previously described [43] using an AmpliScribe T7-Flash transcription kit (Epicentre) and purified by denaturing polyacrylamide gel electrophoresis (20%, 19:1 acrylamide/bis-acrylamide) followed by electroelution, then concentration using an Amicon Ultra-4 centrifugal filter unit with Ultracel-10 membrane (Millipore, MA) and dialysis in 1 mM MOPS, pH 6.5.
The Transcription Control template strand DNA 5′-GGGTATTTAATTAAGCTTTTGCAAGGTTAGAATCATGTCTTGAATATGCCCTCCACTTTT CTTTCATAAGTATAGTAAATGATCATATAAAAAGATGGACCAAATGTCAACTTTTGTTTTCGC GCTTTGATTTTAAATACAATCCCGAATATTCTTCGTAATCTAGATTAAT-3′ and the complementary coding strand DNA were obtained from IDT and purified by denaturing polyacrylamide gel electrophoresis (20%, 19:1 acrylamide/bis-acrylamide) followed by electroelution. Together, the coding and template strands contain the glyQS promoter region and transcription start site (nt 91-141 in glyQS), primer binding sites for DNA replication (nt 1-51 and nt 206-452 in glyQS) and the DNA template for the RNA target sequence of RTprb (nt 373-396 in glyQS). Mixing the template and coding strands together in a 1:1 ratio created the dsDNA template for the Transcription Control reactions. The resulting dsDNA template was amplified by PCR and used in the Transcription Control in vitro transcription reactions as outlined below.
2.2 In vitro transcription
All transcription reaction mixtures (20 μL each) were set up in a 384-well microplate. For the T box riboswitch functional studies, each well contained a final concentration of 20 mM Tris-HCl, 40 mM KCl, 4 mM MgCl2, 1 mM DTT, 0.23 U/μL RiboGuard RNase inhibitor (Epicentre), 100 nM RTprb, 0.05 U/μL E. coli RNA polymerase Sigma-saturated holoenzyme (Epicentre), 10 nM dsDNA template (glyQS or Transcription Control template as specified). Stock solutions of ligands and co-solutes such as spermidine (125 mM in H2O), PEG-8000 (0.2 g/mL solution in H2O, 20% wt/v) and tRNA (10× final concentration) were added to a final concentration as specified then NTPs were added to a final concentration of 10 μM CTP, 10 μM GTP, 10 μM UTP, 400 μM ATP. This relative ratio of NTPs has been used previously for multiround T box transcription reactions [44] and balances the need for high concentrations of the initial nucleotide to facilitate transcription initiation [45] with the need for slower transcription elongation rates to minimize tRNA-independent readthrough [46]. A final concentration of 5 mM spermidine was used in all reactions except the spermidine dose-response experiments where the concentration of spermidine was varied as indicated. For all the tRNA functional studies, n = 3, except for the No NTP control reaction was n = 2 and the DMSO comparison studies were n = 4.
Prior to addition of the NTPs, the reaction mixture with all the rest of the ingredients was mixed well by carefully pipetting up and down several times. The NTPs were then added to initiate the transcription reaction before applying an optically-clear polyolefin film (VWR) to prevent evaporation. No mixing was performed after adding NTPs to enable immediate real-time monitoring of the fluorescence signal. Addition of NTPs was defined as the start time of the in vitro transcription reaction. The transcription reaction mixtures were incubated at 25°C for 3 h and a reading acquired every 5 minutes using a SpectraMax M5 microplate reader with excitation = 642 nm, emission = 672 nm and the cutoff filter = 665 nm. The averages of replicates and ranges of error noted by error bars (unless otherwise specified) were determined in all experiments.
2.3 Analysis of real-time in vitro transcription data
For the Readthroughrate determinations, the fluorescence readings from 30 to 60 minutes were fit to a linear equation using Prism (Graphpad) to determine the slope (ΔRFU30-60min/Δt). For the Readthroughmax determinations, the maximum change in fluorescence was determined from ΔRFU = RFU180- RFU5 where RFU5 is the initial fluorescence at 5 minutes and RFU180 is the fluorescence at 180 minutes. For the tRNAGly (n = 3) and spermidine dose-response studies (n = 2), the Readthroughrate transcription data were plotted against the log[tRNAGly] or log[spermidine] in Prism (Graphpad) and fit to a dose-responsive stimulation curve with variable slope to determine the EC50 values. The Readthroughrate was used for these dose-response studies since it minimized the effect of RTprb background fluorescence observed at higher concentrations of tRNAGly. When [tRNAGly] ≥ 1 μM (i.e., approximately two-orders of magnitude higher than the concentration used in the ligand screening assay) an initial non-specific enhancement in RTprb fluorescence was observed before transcription reaction initiation (i.e., before addition of NTPs), but this background fluorescence dissipated over the course of the transcription reaction. With the Readthroughrate approach, the slope (ΔRFU30-60min/Δt) was measured at time points where the non-specific enhancement had fully dissipated or was minimal for the range of tRNAGly concentrations used in the dose-response experiments (0-1.6 μM). Finally, for ease of visual comparison in the spermidine dose-response experiments, the data were plotted as Normalized Readthroughrate = Readthroughrate/Readthroughrate0 where Readthroughrate0 is the rate of readthrough in the absence of spermidine in the corresponding control reaction.
The Z′ factor for Readthroughmax was calculated using the equation Z′= 1-[3×(SDtRNA+SD0)/(Readthroughmax+tRNA - Readthroughmax0] where Readthroughmax+tRNA and SDtRNA are the Readthroughmax in the presence of tRNAGly and its corresponding standard deviation, while Readthroughmax0 and SD0 are in the absence of tRNAGly. The Z′ factor for Readthroughrate was calculated using Z′= 1-[3×(SDtRNA+SD0)/(Readthroughrate+tRNA - Readthroughrate0)] where Readthroughrate+tRNA and SDtRNA are the Readthroughrate in the presence of tRNAGly and its corresponding standard deviation, while Readthroughrate0 and SD0 are in the absence of tRNAGly.
2.4 Ligand Inhibition Assay
Triazole 1 was synthesized as previously described [33]. The in vitro transcription procedure described above was used to test for ligand-induced inhibition with the following changes: The final concentration of E. coli RNA polymerase holoenzyme (RNAP) was 0.02 U/μL. The concentration of tRNAGly was fixed at 15 nM and the ligand stock solution (in 50% v/v DMSO) was added prior to addition of NTPs to obtain the final ligand concentrations of 50 μM and a maximum of 5% v/v DMSO (n = 5). Control tRNA-induced glyQS transcription readthrough reactions without ligand (n = 8) also had a final concentration of 5% v/v DMSO as did the Transcription Control reaction with (n = 5) and without ligand (n =8). The averages of replicates and standard deviation noted by error bars were determined in all experiments and an unpaired t-test analysis was performed to determine statistical significance with two-tailed P values as indicated.
For the apparent IC50 determination, the inhibitor ligand screening assay was used and tested with [ligand] = 50 μM, 25 μM, 12.5 μM, 6.25 μM and 3.125 μM. The Readthroughmax with tRNA was determined at each ligand concentration (ΔRFUtRNA+L, n = 2) and then the percent of ligand-induced Readthroughmax inhibition was determined as % inhibition = [(ΔRFUtRNA+L - ΔRFUtRNA)/(ΔRFUtRNA - ΔRFU0] ×100 where ΔRFUtRNA and ΔRFU0 are the average Readthroughmax values in the absence of ligand for the control reactions with or without tRNAGly respectively (n = 10). The percent of Readthroughmax inhibition (average with range noted by error bars) was then plotted against the logarithm of the ligand concentration and fit to a non-linear dose-response inhibition model with variable slope using Prism (GraphPad).
3. Results
3.1 Functionally relevant fluorescence monitored transcription readthrough assay
The fluorophore-quencher labeled probe (RTprb) effectively monitored tRNA-induced transcription readthrough in a multi-round transcription assay of the B. subtilis glyQS T box riboswitch (Figure 2). In the absence of cognate tRNA, a basal level of transcription readthrough was observed. In contrast, addition of cognate tRNAGly (100 nM) resulted in a three-fold increase in transcription readthrough. This increase is cognate-tRNA specific since mismatched tRNA discriminator base (tRNAGly(U73A)), mismatched tRNA anticodon sequence (tRNATyr(A73U)), and, fully mismatched tRNA (tRNATyr) resulted in no enhancement over the basal level readthrough.
Figure 2. Multi-round assay for tRNAGly-specific induction of glyQS transcription readthrough.

a) Comparison of Readthroughmax of cognate tRNAGly (wt, acceptor end 5′-UCCA-3′) with tRNAGly(U73A), tRNATyr(A73U) and tRNATyr(wt, acceptor end 5′-ACCA-3′). For all reactions with tRNA, [tRNA] = 100 nM. b) Dose-response curve of tRNAGly readthrough induction.
The transcription readthrough can be monitored as either Readthroughmax (by measuring the maximal change in RTprb fluorescence ΔRFU = RFU180min − RFU5min) or Readthroughrate (by measuring the rate of RTprb fluorescence increase over a range of the experimental time course, ΔRFU30-60min/Δt). The same cognate tRNA-dependent induction of transcription readthrough was observed for both monitoring approaches (Figure 2 and Supplementary data). Control experiments to verify RTprb signal stability and establish calibration curves for RTprb signal vs. target sequence concentration were conducted (Supplementary data). No signal decrease due to photobleaching or RTprb degradation over time was observed and there was a linear correlation between the observed fluorescence of RTprb and Target Sequence concentration up to at least [Target] = 60 nM. The average ΔRFUmax observed at 3 h (∼80 RFU) for RTprb in the tRNAGly-induced glyQS transcription readthrough reaction indicates that approximately 28 nM of readthrough transcription product was produced (estimated from the calibration curve). This product concentration is almost three-fold larger than the concentration of DNA template used in the reaction (10 nM), consistent with a multi-round transcription reaction. Reagent limitation studies with the in vitro transcription readthrough indicate that complete consumption of NTPs is likely the primary limiting factor for the RTprb fluorescent probe signal reaching a maximum after 3 h in the glyQS transcription reactions (Supplementary data).
3.2 tRNAGly dose-response characteristic of ligand-receptor interaction
The tRNA-induced glyQS transcription readthrough was measured over a multi-log concentration range of cognate tRNAGly to determine a dose-response relationship (Figure 2b). The observed sigmoidal curve is characteristic of a ligand-receptor interaction and was analyzed accordingly. In a dose-response analysis, the efficacy is defined as the maximal response induced by the natural ligand (i.e., tRNAGly) and the affinity (EC50) is defined as the concentration of ligand that results in 50% of the maximal response [47]. With 0.05 U/μL RNAP, the observed tRNAGly affinity was EC50 = 30 nM (95% CI = 23-40 nM, R2= 0.97). With 0.02 U/μL RNAP the observed affinity was EC50 = 17 nM (95% CI = 11-26 nM, R2 = 0.95).
3.3 Fluorescence-monitored assay suitable for medium-throughput assays
While both the Readthroughmax and Readthroughrate monitoring approaches are potentially viable, the suitability of each monitoring method for medium-throughput screening was investigated. The screening window coefficient (Z′- factor) is a characteristic parameter used to quantify the quality of high throughput assays [48]. Negative Z′-factor values indicate an unacceptable assay and positive values approaching 1 indicate an excellent assay. For drug discovery studies, competitive inhibitor screening assays conditions ideally have the natural ligand (in this case tRNAGly) at a concentration that induces half the maximal response (the EC50 value) in order to effectively observe competitive inhibitor-induced disruption. The tRNAGly concentrations investigated were at or near the observed EC50 values. The effect of DMSO was also investigated because a small percentage of DMSO in the assay is unavoidable due to the limited water solubility of inhibitor candidates at high stock concentrations.
In the absence of DMSO, both Readthroughmax and Readthroughrate monitoring approaches had acceptable Z′-factor values (Table 1). In contrast, in the presence of 5% DMSO, only the Readthroughmax approach had an acceptable Z′-factor value when using 0.02 U/μL of RNAP per reaction and [tRNAGly] = 15 nM (i.e., near the EC50 value observed with 0.02 U/μL RNAP). In order to accommodate using DMSO stock solutions for less soluble ligands, some amount of DMSO in the transcription assay is unavoidable. Better Z′-factor values with 5% DMSO were observed for both Readthroughmax and Readthroughrate with 0.05 U/μL of RNAP per reaction and [tRNAGly] = 40 nM (i.e., near the EC50 value for 0.05 U/μL RNAP). However, the cumulative quantity of RNAP and tRNAGly required makes these assay conditions not optimal for a medium to high throughput screening in terms of cost and/or material preparation time. Consequently, the Readthroughmax monitoring approach with 0.02 U/μL RNAP and [tRNAGly] = 15 nM was used for the potential inhibitor study.
Table 1. Z′ factor analysis of fluorescence monitoring methods.
| Condition | Z′ factor | |||
|---|---|---|---|---|
|
| ||||
| [RNAP] | [tRNAGly] | [DMSO] (v/v) | Readthroughmax ΔRFU (180 min) | Readthroughrate ΔRFU30-60min/Δt |
| 0.02 U/μL | 15 nM | 5% | 0.10 | -0.69 |
| 0.02 U/μL | 15 nM | 0% | 0.24 | 0.14 |
| 0.05 U/μL | 40 nM | 5% | 0.26 | 0.12 |
| 0.05 U/μL | 100 nM | 0% | 0.59 | 0.57 |
3.4 Transcription readthrough sensitive to spermidine and co-solvents
In the single-round in vitro transcription assays, a halted transcription elongation complex is generated at low levels of Mg2+ (e.g., 2 mM [45]), but then after initiation, the T box riboswitch requires increased levels of Mg2+ (15 mM) in order to maximize the level of tRNA-induced transcription readthrough [3]. For the development of an efficient, medium-throughput functional screening assay, this multi-step approach needed to be avoided. Previously, spermidine was identified as an additive that facilitated tRNA-induced transcription in radioactively-monitored multi-round thrS T box transcription [44]. Consequently, the affinity and efficacy effects of spermidine as a co-factor on glyQS transcription readthrough in the fluorescence-monitored multi-round assay were investigated. As a control, the effect on overall transcription was also investigated using a Transcription Control DNA template, which contained the template for the same promoter region, first six 5′ nucleotides in the glyQS leader RNA and the sequence targeted by RTprb. Spermidine dose-response curves for the Transcription Control and glyQS transcription were compared (Figure 3). With 5 mM spermidine, a 40% increase in the maximum transcription of the target sequence was observed in the Transcription Control with a spermidine affinity of EC50 = 0.82 mM (95% CI = 0.74-0.91 mM, R2 = 0.95). At higher concentrations of spermidine (i.e., 10 mM) a significant decrease in transcription for all conditions was observed. This is consistent with the known denaturing effect of polyamines at high concentrations [49]. Consequently, the corresponding data points were excluded from the dose-response curve fitting.
Figure 3. Spermidine effect on efficacy of tRNAGly-induced glyQS readthrough.

a) Structure of spermidine. b) Spermidine dose-response effect on glyQS transcription readthrough. In the absence of tRNAGly (open circle), spermidine EC50 = 0.49 mM (95% CI = 0.41-0.59 mM, R2 = 0.96). In the presence of tRNAGly(filled circle), spermidine EC50 = 0.58 mM (95% CI = 0.49-0.68 mM, R2 = 0.98). The Transcription Control data (triangle) reflect the overall transcription reaction since the Transcription Control DNA template lacks the T box riboswitch. For the Transcription control, the spermidine EC50 = 0.82 mM (95% CI = 0.74-0.91 mM, R2 = 0.95). The data points at [spermidine] = 10 mM were excluded from EC50 calculations as discussed in Results.
The presence of spermidine significantly enhanced the efficacy of glyQS transcription readthrough, especially tRNAGly-induced readthrough. With 5 mM spermidine, the basal level readthrough (without tRNAGly) was enhanced by 270% and tRNAGly-induced readthrough (with [tRNAGly] = 100 nM) was enhanced by 650%. The spermidine affinity for the basal and tRNA-induced readthrough were similar, EC50 = 0.49 mM (95% CI = 0.41-0.59 mM, R2 = 0.96) and EC50 = 0.58 mM (95% CI = 0.49-0.68 mM, R2 = 0.98) respectively.
Since molecular crowding has been shown to affect the structure and function of RNA [50], the effect of molecular crowding on the T box riboswitch was investigated by the addition of 5% (wt/v) polyethylene glycol (PEG). PEG has been used previously to mimic molecular crowding in the investigation of other functional RNAs [51]. PEG had no significant effect on the linear region of the calibration curve (Supplementary data) indicating that PEG does not disrupt the RTprb binding to the target sequence. The presence of PEG reduced the Transcription Control rate significantly and reduced the Readthroughrate for glyQS transcription with tRNAGly (Figure 4). Interestingly, there was no significant effect on the basal level transcription. In addition, there was no significant difference in tRNAGly affinity (EC50) determined from the tRNAGly dose-response curve in the presence or absence of PEG. There was also no significant difference in spermidine affinity (EC50) in the presence of 5% PEG (Supplementary data). In contrast, the tRNAGly efficacy was 54% smaller in the presence of PEG (Figure 4).
Figure 4. Molecular crowding effect on tRNAGly-induced glyQS readthrough.

a) Transcription Control (striped bars), glyQS readthrough in the presence of 100 nM tRNAGly (shaded bars), and glyQS readthrough in the absence of tRNAGly (basal level transcription, unfilled bars) were performed in the presence or absence of 5% (wt/v) PEG-8000. The Transcription Control data reflect the overall transcription reaction since the Transcription Control DNA template lacks the T box riboswitch. b) Effect of molecular crowding on the affinity (EC50) of tRNAGly to induce glyQS readthrough. For tRNAGly EC50 = 30 nM in the absence of PEG (open circle, 95% CI = 22-39 nM, R2 = 0.97) and EC50 = 26 nM in the presence of 5% PEG (filled circle, 95% CI = 13-50 nM, R2 = 0.84).
3.5 Monitoring ligand-induced inhibition
To explore the utility of the moderate-throughput assay for drug discovery functional studies of potential inhibitors, the effect of 1,4-disubstituted 1,2,3-triazole 1, known to bind T box antiterminator RNA [34], was investigated (Figure 5). Initial control studies were done to investigate the effect of 5% DMSO as a co-solvent since a small amount of DMSO from potential inhibitor stock solutions is unavoidable (due to limited aqueous solubility at high ligand concentrations). DMSO had no significant effect on the linear region of the calibration curve indicating that DMSO does not disrupt the RTprb binding to the target sequence and while DMSO increased the observed transcription Readthroughrate it was a non-specific effect with no significant difference in tRNAGly affinity (EC50) determined from the tRNAGly dose-response curve in the presence or absence of DMSO (Supplementary data).
Figure 5. Effect of 1, 4-disubstutited 1, 2, 3-triazole on glyQS transcription readthrough.

a) Dose-response of compound 1 on glyQS transcription readthrough in the presence of 15 nM tRNAGly. Apparent IC50 = 8 μM (95% CI = 4-15 μM, R2 = 0.86). Inset: Structure of triazole 1. b) Readthroughmax without (open bars) and with 1 (50 μM, shaded bars) for glyQS basal level transcription, glyQS with tRNAGly (15 nM), and, the Transcription Control reaction. For each reaction condition, the percent of ligand-induced inhibition is indicated. The Transcription Control data reflect the effect of 1 on the overall transcription reaction since the Transcription Control DNA template lacks the T box riboswitch. Also shown is the effect of 1 on RTprb fluorescence in the presence of Target Sequence RNA (20 nM).
Triazole 1 resulted in significant inhibition of tRNA-induced glyQS readthrough (apparent IC50 = 8 μM) but also the basal-level glyQS readthrough and the Transcription Control (Figure 5, all P<0.0001). The triazole did not inhibit the fluorescence of RTprb in the presence of Target Sequence, indicating that the observed reduction in signal for the other reactions is indeed due to inhibition of production of the target sequence and not a nonspecific inhibition of the molecular beacon signal. Overall, 1 appears to be inhibiting transcription with no significant specific effect on the riboswitch.
4. Discussion
The T box riboswitch is an intriguing potential target for the development of novel antibacterial agents [1]. In order to facilitate detailed investigations of factors that modulate T box riboswitch function and screen for potential inhibitors, a functionally relevant, medium to high throughput assay method was needed. Single-round transcription readthrough assays have been used to monitor riboswitch function [2,45]. However, the ligand-screening throughput for this approach is limited due to the multiple handling steps and separation of transcripts by gel electrophoresis. A medium to high throughput assay amenable to the quantitative analysis was needed to fully characterize subtle yet meaningful molecular interactions.
Our approach was to utilize a fluorophore-quencher transcription readthrough probe (RTprb) targeting a sequence at the 3′ end of the readthrough transcript of B. subtilis glyQS [2] to monitor multi-round transcription of the T box riboswitch (Figure 1). We utilized a chimeric molecular beacon probe design strategy [38] where the region complementary to the target sequence is composed of 2′-O-methyl nucleotides which enhances target binding affinity and kinetics [39,40] while the stem region is composed of deoxyribonucleotides since a duplex of 2′-O-methyl nucleotides would be too stable [40]. Transcripts that terminate prior to the target sequence are not directly measured using the RTprb. Small molecule metabolite-sensing riboswitches have been monitored in a manner that simultaneously measured total transcription initiation and transcription readthrough using multiplex fluorescent probes [52]. However, for the T box riboswitch, the entire span of the leader region is involved in tRNA binding, and/or bridging tRNA binding regions [1]. Having a probe targeting the leader region before the termination site is not feasible with the native glyQS T box leader sequence since it could potentially perturb tRNA binding interactions. Consequently, the Transcription Control reaction, lacking the T box riboswitch, was used to monitor potential nonspecific effects on transcription.
The multi-round, fluorescence monitored T box transcription readthrough assay is functionally relevant and further facilitates investigation of molecular factors affecting the T Box riboswitch. Similar experimental buffer conditions have previously been used in a multi-round assay of the B. subtilis thrS T box riboswitch monitored using radiolabeled transcripts [44]. The cognate tRNA specificity observed (Figure 2) is consistent with that observed with single-round glyQS transcription readthrough assays [2]. In the absence of cognate tRNA, some basal level readthrough is observed, consistent with previously reported single-round [3] and 32P-monitored multiround assays [44]. The concentration of Mg2+ used in the assay (4 mM) is similar to the estimated value of free magnesium in bacteria [Mg2+]free ≤ 3 mM [53,54] and significantly less than that used in the single-round assays. The observed EC50 (affinity) for tRNAGly (30 nM with 0.05 U/μL RNAP) is consistent with the reported high affinity binding of tRNAGly to a truncated T box leader construct (Kd = 150 nM) as measured by isothermal titration calorimetry [7] and is also consistent with high affinity binding between tRNAGly and the full glyQS leader RNA monitored by a filter binding assay [3]. In addition, while the presence of trace amounts of DMSO (from ligand stock solutions) is known to have small effects on RNA structure [55], only nonspecific effects were observed with 5% DMSO in the assay. Overall, this fluorescence-monitored, multi-round T box riboswitch functional assay complements the previously developed antiterminator-specific 1° and 2° screening assays [37] to create a more comprehensive T box antiterminator-targeted drug discovery screening cascade.
Spermidine was used in the fluorescence-monitored in vitro transcription assay in order to avoid the lower-throughput, multi-step procedure of the single-round in vitro T box transcription assays. Spermidine is known to facilitate multi-round transcription of the T box riboswitch in vitro but is likely only a substitute for a specific protein co-factor needed for tRNA-dependent transcription readthrough in vivo [44]. Nevertheless, investigating the effect of spermidine on the T box riboswitch in vitro provides insight into possible co-factor function and facilitates optimization of the drug discovery functional assay conditions. The glyQS leader affinity for spermidine in the presence of 100 nM tRNAGly (EC50 = 0.58 mM) and in the absence of tRNAGly (EC50 = 0.49 mM) was within the 95% confidence interval range of one another (Figure 3) indicating that spermidine binding to the glyQS leader is likely independent of tRNA binding. In addition, this binding may be specific to the riboswitch leader RNA since the spermidine EC50 for the Transcription Control (lacking the riboswitch) was higher (EC50 = 0.82 mM) than the EC50 values for glyQS (both with or without tRNAGly). While the difference is not large, it is of significance since the respective 95% confidence intervals do not overlap. In addition, spermidine enhanced the overall efficacy of glyQS transcription (maximum readthrough) to a greater extent (650% with tRNAGly, 270% without tRNAGly) than it enhanced the transcription of the target sequence in the Transcription Control experiment (40%). Overall, these differences in spermidine affinity and riboswitch readthrough efficacy compared to those observed with the Transcription Control indicate there may be specific interactions between spermidine and the T box leader region that affect its function. Biogenic polyamines, such as spermidine, have been shown to have very specific structural and functionally relevant interactions with RNA [56,57].
Spermidine also appears to reduce the Mg2+ requirement for glyQS transcription readthrough. In the single-round transcription assay, tRNAGly bound the glyQS leader RNA equally well at 5 mM and 15 mM Mg2+, but no significant transcription readthrough was observed at 5 mM Mg2+ and maximal readthrough required 15 mM Mg2+ [3]. In contrast, in the glyQS multi-round transcription assay, significant tRNA-induced readthrough is observed at much lower levels of Mg2+ (4 mM Mg2+) with 5 mM spermidine present. Since spermidine is known to bind and stabilize bulged RNA [56], it is possible that spermidine may be binding to the bulge region of the T box antiterminator RNA and facilitating transcription readthrough.
Molecular crowding, mimicked with inert co-solutes like PEG, is known to enhance the function of other noncoding RNAs, reduce the Mg2+ requirement [51] and favor more compactly folded RNA structures [50], but its effect on the T box riboswitch has not been investigated. Addition of 5% PEG nonspecifically reduced the observed rate of production of the target sequence both in the Transcription Control and in the tRNAGly-induced glyQS readthrough (Figure 4). There also was no significant change in tRNAGly affinity (EC50). Interestingly, however, the tRNAGly efficacy for inducing readthrough was significantly decreased in the presence of PEG whereas there was little effect on the basal level readthrough (without tRNAGly). This indicates that molecular crowding may be facilitating basal level readthrough since the nonspecific transcription inhibition of PEG was not observed in the basal level readthrough reaction.
Previous T box riboswitch targeted drug discovery studies used a radiolabel-monitored single-round glyQS transcription readthrough assay for functional studies [32] but throughput constraints limited the number of experiments that could be run simultaneously. With the medium throughput fluorescence-monitored functional assay, multiple replicates of inhibition reactions and associated controls can be run simultaneously, thus facilitating the discernment of potentially subtle differences. The potential inhibitory effect of 1, 4-disubstutited 1, 2, 3-triazole 1, which is known to bind the T box antiterminator RNA element and disrupt its interaction with tRNA [34,36], was investigated. Triazole 1 inhibited overall transcription, but with no significant additional inhibitory effect on the T box riboswitch (Figure 5).
5. Conclusion
The results reported in this study indicate that molecular interactions with co-factors such as spermidine and molecular crowding can influence T box riboswitch efficacy in a manner that is not necessarily dependent on also affecting tRNA affinity. These findings have significant implications for the importance that molecular recognition can play in T box riboswitch function and for future drug discovery efforts targeting this unique regulatory mechanism. In addition, the assay developed provides a vital moderate-throughput functional assay for a comprehensive drug discovery screening cascade.
Supplementary Material
Acknowledgments
This work was supported by the National Institutes of Health (GM073188 to JH, and C06 RR-014575-01 to Ohio University for the research facility). We wish to thank Prof. T.M. Henkin for the glyQS and tRNAGly template DNA for the in vitro T box transcription studies and G. Aquaah-Harrison for compound synthesis.
Footnotes
Publisher's Disclaimer: This is a PDF file of an unedited manuscript that has been accepted for publication. As a service to our customers we are providing this early version of the manuscript. The manuscript will undergo copyediting, typesetting, and review of the resulting proof before it is published in its final citable form. Please note that during the production process errors may be discovered which could affect the content, and all legal disclaimers that apply to the journal pertain.
References
- 1.Henkin TM. The T box riboswitch: a novel regulatory RNA that utilizes tRNA as its ligand. BBA-Gene Reg Mech. 2014;1839:959–963. doi: 10.1016/j.bbagrm.2014.04.022. [DOI] [PMC free article] [PubMed] [Google Scholar]
- 2.Grundy FJ, Winkler WC, Henkin TM. tRNA-mediated transcription antitermination in vitro: codon-anticodon pairing independent of the ribosome. Proc Natl Acad Sci USA. 2002;99:11121–11126. doi: 10.1073/pnas.162366799. [DOI] [PMC free article] [PubMed] [Google Scholar]
- 3.Yousef MR, Grundy FJ, Henkin TM. Structural transitions induced by the interaction between tRNAGly and the Bacillus subtilis glyQS T box leader RNA. J Mol Biol. 2005;349:273–287. doi: 10.1016/j.jmb.2005.03.061. [DOI] [PubMed] [Google Scholar]
- 4.Grundy FJ, Henkin TM. tRNA as a positive regulator of transcription antitermination in B. subtilis. Cell. 1993;74:475–482. doi: 10.1016/0092-8674(93)80049-k. [DOI] [PubMed] [Google Scholar]
- 5.Saad NY, Stamatopoulou V, Brayé M, Drainas D, Stathopoulos C, Becker HD. Two-codon T-box riboswitch binding two tRNAs. Proc Natl Acad Sci. 2013;110:12756–12761. doi: 10.1073/pnas.1304307110. [DOI] [PMC free article] [PubMed] [Google Scholar]
- 6.Grigg JC, Chen Y, Grundy FJ, Henkin TM, Pollack L, Ke A. T box RNA decodes both the information content and geometry of tRNA to affect gene expression. PNAS. 2013;110:7240–7245. doi: 10.1073/pnas.1222214110. [DOI] [PMC free article] [PubMed] [Google Scholar]
- 7.Zhang J, Ferré-D'Amaré AR. Co-crystal structure of a T-box riboswitch stem I domain in complex with its cognate tRNA. Nature. 2013;500:363–366. doi: 10.1038/nature12440. [DOI] [PMC free article] [PubMed] [Google Scholar]
- 8.Grundy FJ, Henkin TM. Inducible amber suppressor for Bacillus subtilis. J Bacteriol. 1994;176:2108–2110. doi: 10.1128/jb.176.7.2108-2110.1994. [DOI] [PMC free article] [PubMed] [Google Scholar]
- 9.Grundy FJ, Moir TR, Haldeman MT, Henkin TM. Sequence requirements for terminators and antiterminators in the T box transcription antitermination system: disparity between conservation and functional requirements. Nucleic Acids Res. 2002;30:1646–1655. doi: 10.1093/nar/30.7.1646. [DOI] [PMC free article] [PubMed] [Google Scholar]
- 10.Boucher HW, Talbot GH, Bradley JS, Edwards JE, Gilbert D, Rice LB, Scheld M, Spelberg B, Bartlett J. Bad bugs, no drugs: no ESKAPE! An update from the infectious diseases society of America. Clin Infect Dis. 2009;48:1–12. doi: 10.1086/595011. [DOI] [PubMed] [Google Scholar]
- 11.CDC. Antibiotic Resistance Threats in the United States. U.S. Department of Health & Human Services, C. f. D. C. a. P; 2013. [Google Scholar]
- 12.WHO. Antimicrobial resistance: global report on surveillance. Press, W. H. O; 2014. [Google Scholar]
- 13.Chirayil S, Chirayil R, Luebke KJ. Discovering ligands for a microRNA precuror with peptoid microarrays. Nucleic Acids Res. 2009;37:5486–5497. doi: 10.1093/nar/gkp549. [DOI] [PMC free article] [PubMed] [Google Scholar]
- 14.Paulsen RB, Seth PP, Swayze EE, Griffey RH, Skalicky JJ, Cheatham TEI, Davis DR. Inhibitor-induced structural change in the HCV IRES domain IIa RNA. Proc Natl Acad Sci. 2010;107:7263–7268. doi: 10.1073/pnas.0911896107. [DOI] [PMC free article] [PubMed] [Google Scholar]
- 15.Diegan KE, Ferré-D'Amaré AR. Riboswitches: discovery of drugs that target bacterial gene-regulatory RNAs. Acc Chem Res. 2011;44:1329–1338. doi: 10.1021/ar200039b. [DOI] [PMC free article] [PubMed] [Google Scholar]
- 16.Davis DR, Seth PP. Therapeutic targeting of HCV internal ribosomal entry site RNA. Antivir Chem Chemother. 2011;21:117–128. doi: 10.3851/IMP1693. [DOI] [PubMed] [Google Scholar]
- 17.Lunse CE, Schuller A, Mayer G. The promise of riboswitches as potential antibacterial drug targets. Int J Med Microbiol. 2013;304:79–92. doi: 10.1016/j.ijmm.2013.09.002. [DOI] [PubMed] [Google Scholar]
- 18.Warner KD, Homan P, Weeks KM, Smith AG, Abell C, Ferré-D'Amaré AR. Validating fragment-based drug discovery for biological RNAs: lead fragments bind and remodel the TPP riboswitch specifically. Chem Biol. 2014;5:591–595. doi: 10.1016/j.chembiol.2014.03.007. [DOI] [PMC free article] [PubMed] [Google Scholar]
- 19.Gerdeman MS, Henkin TM, Hines JV. In vitro structure-function studies of the Bacillus subtilis tyrS mRNA antiterminator: Evidence for factor independent tRNA acceptor stem binding specificity. Nucleic Acids Res. 2002;30:1065–1072. doi: 10.1093/nar/30.4.1065. [DOI] [PMC free article] [PubMed] [Google Scholar]
- 20.Gerdeman MS, Henkin TM, Hines JV. Solution structure of the B. subtilis T box antiterminator RNA: Seven-nucleotide bulge characterized by stacking and flexibility. J Mol Biol. 2003;326:189–201. doi: 10.1016/s0022-2836(02)01339-6. [DOI] [PubMed] [Google Scholar]
- 21.Fauzi H, Jack KD, Hines JV. In vitro selection to identify determinants in tRNA for Bacillus subtilis tyrS T box antiterminator mRNA binding. Nucl Acids Res. 2005;8:2595–2602. doi: 10.1093/nar/gki546. [DOI] [PMC free article] [PubMed] [Google Scholar]
- 22.Means JA, Wolf S, Agyeman A, Burton JS, Simson CM, Hines JV. T box riboswitch antiterminator affinity modulated by tRNA structural elements. Chem Biol Drug Design. 2007;69:139–145. doi: 10.1111/j.1747-0285.2007.00476.x. [DOI] [PubMed] [Google Scholar]
- 23.Jack KD, Means JA, Hines JV. Characterizing riboswitch function: Identification of Mg2+ binding site in T box antiterminator RNA. Biochem Biophys Res Commun. 2008;370:306–310. doi: 10.1016/j.bbrc.2008.03.079. [DOI] [PMC free article] [PubMed] [Google Scholar]
- 24.Fauzi H, Agyeman A, Hines JV. T box transcription antitermination riboswitch: Influence of nucleotide sequence and orientation on tRNA binding by the antiterminator element. BBA-Gene Reg Mech. 2009;1789:185–191. doi: 10.1016/j.bbagrm.2008.12.004. [DOI] [PMC free article] [PubMed] [Google Scholar]
- 25.Means JA, Simson CM, Zhou S, Rachford AA, Rack J, Hines JV. Fluorescence probing of T box antiterminator RNA: Insights into riboswitch discernment of the tRNA discriminator base. Biochem Biophys Res Commun. 2009;389:616–621. doi: 10.1016/j.bbrc.2009.09.037. [DOI] [PMC free article] [PubMed] [Google Scholar]
- 26.Jentzsh F, Hines JV. Interfacing medicinal chemistry with structural bioinformatics: Implications for T box riboswitch RNA drug discovery. BMC Bioinformatics (GLBIO 2011 Special Issue) 2011;13:S5–S10. doi: 10.1186/1471-2105-13-S2-S5. [DOI] [PMC free article] [PubMed] [Google Scholar]
- 27.Means JA, Hines JV. Fluorescence resonance energy transfer studies of aminoglycoside binding to a T box antiterminator RNA. Bioorg Med Chem Lett. 2005;15:2169–2172. doi: 10.1016/j.bmcl.2005.02.007. [DOI] [PubMed] [Google Scholar]
- 28.Anupam R, Denapoli L, Muchenditsi AM, Hines JV. Identification of neomycin B binding site in T box antiterminator model RNA. Bioorg Med Chem. 2008;16:4466–4470. doi: 10.1016/j.bmc.2008.02.056. [DOI] [PMC free article] [PubMed] [Google Scholar]
- 29.Means JA, Katz SJ, Nayek A, Anupam R, Hines JV, Bergmeier SC. Structure activity studies of oxazolidinone analogs as RNA-binding agents. Bioorg Med Chem Lett. 2006;16:3600–3604. doi: 10.1016/j.bmcl.2006.03.068. [DOI] [PubMed] [Google Scholar]
- 30.Orac CM, Zhou S, Means JA, Boehme D, Bergmeier SC, Hines JV. Synthesis and stereospecificity of 4,5-disubstituted oxazolidinone ligands binding to T-box riboswitch RNA. J Med Chem. 2011;54:6786–6795. doi: 10.1021/jm2006904. [DOI] [PMC free article] [PubMed] [Google Scholar]
- 31.Maciagiewicz I, Zhou S, Bergmeier SC, Hines JV. Structure activity studies of RNA-binding oxazolidinone derivatives. Bioorg Med Chem Letters. 2011:4524–4527. doi: 10.1016/j.bmcl.2011.05.130. [DOI] [PMC free article] [PubMed] [Google Scholar]
- 32.Anupam R, Bergmeier SC, Green NJ, Grundy FJ, Henkin TM, Means JA, Nayek A, Hines JV. 4,5-Disubstituted Oxazolidinones: High affinity molecular effectors of RNA function. Bioorg Med Chem Lett. 2008;18:3541–3544. doi: 10.1016/j.bmcl.2008.05.015. [DOI] [PMC free article] [PubMed] [Google Scholar]
- 33.Acquaah-Harrison G, Zhou S, Hines JV, Bergmeier SC. Library of 1,4-disubstituted 1,2,3-triazole analogs of oxazolidinone RNA-binding agents. J Comb Chem. 2010;12:491–496. doi: 10.1021/cc100029y. [DOI] [PMC free article] [PubMed] [Google Scholar]
- 34.Zhou S, Means JA, Acquaah-Harrison G, Bergmeier SC, Hines JV. Characterization of a 1,4-disubstituted 1,2,3-triazole binding to T box antiterminator RNA. Bioorg Med Chem. 2011;20:1298–1302. doi: 10.1016/j.bmc.2011.12.017. [DOI] [PubMed] [Google Scholar]
- 35.Zhou S, Acquaah-Harrison G, Jack KD, Bergmeier SC, Hines JV. Ligand-induced changes in T box antiterminator RNA stability. Chem Biol Drug Design. 2011;79:202–208. doi: 10.1111/j.1747-0285.2011.01274.x. [DOI] [PMC free article] [PubMed] [Google Scholar]
- 36.Zhou S, Acquaah-Harrison G, Bergmeier SC, Hines JV. Anisotropy studies of tRNA - T box antiterminator RNA complex in the presence of 1,4-disubstituted 1,2,3-triazoles. Bioorg Med Chem Lett. 2011;21:7059–7063. doi: 10.1016/j.bmcl.2011.09.095. [DOI] [PMC free article] [PubMed] [Google Scholar]
- 37.Liu J, Zeng C, Zhou S, Means JA, Hines JV. Fluorescence assays for monitoring RNA-ligand interactions and riboswitch-targeted drug discovery screening. Methods Enzymol. 2015;550:363–383. doi: 10.1016/bs.mie.2014.10.040. [DOI] [PubMed] [Google Scholar]
- 38.Nitin N, Rhee WJ, Bao G. Translation inhibition reveals interaction of 2′-deoxy and 2′-O-methyl molecular beacons with mRNA targets in living cells. Nucleic Acids Res. 2009;37:4977–4986. doi: 10.1093/nar/gkp517. [DOI] [PMC free article] [PubMed] [Google Scholar]
- 39.Majlessi M, Nelson NC, Becker MM. Advantages of 2′-O-methyl oligoribonucleotide probes for detecting RNA targets. Nucleic Acids Res. 1998;26:2224–2229. doi: 10.1093/nar/26.9.2224. [DOI] [PMC free article] [PubMed] [Google Scholar]
- 40.Tsourkas A, Behlke MA, Boa G. Hybridization of 2′-O-methyl and 2′-deoxy molecular beacons to RNA and DNA targets. Nucleic Acids Res. 2002;30:5168–5174. [PMC free article] [PubMed] [Google Scholar]
- 41.Hou YM, Gamper HB. Inhibition of tRNA aminoacylation by 2′-O-methyl oligonucleotides. Biochemistry. 1996;35:15340–15348. doi: 10.1021/bi9621167. [DOI] [PubMed] [Google Scholar]
- 42.Yousef MR, Grundy FJ, Henkin TM. tRNA requirements for glyQS antitermination: A new twist on tRNA. RNA. 2003;9:1148–1156. doi: 10.1261/rna.5540203. [DOI] [PMC free article] [PubMed] [Google Scholar]
- 43.Zhou S. Fluorescence anisotropy: analysis of tRNA binding to the T box riboswitch antiterminator RNA. Methods in Mol Biol. 2015;1240:143–152. doi: 10.1007/978-1-4939-1896-6_11. [DOI] [PubMed] [Google Scholar]
- 44.Putzer H, Condon C, Brechemeier-Baey D, Brito R, Grunberg-Manago D. Transfer RNA-mediated antitermination in vitro. Nucleic Acids Res. 2002;30:3026–3033. doi: 10.1093/nar/gkf415. [DOI] [PMC free article] [PubMed] [Google Scholar]
- 45.Artsimovitch I, Henkin TM. In vitro approaches to analysis of transcription termination. Methods. 2008;47:37–43. doi: 10.1016/j.ymeth.2008.10.006. [DOI] [PMC free article] [PubMed] [Google Scholar]
- 46.Grundy FJ, Henkin TM. Kinetic analysis of tRNA-directed transcription antitermination of the Bacillus subtilis glyQS gene in vitro. J Bacteriol. 2004;186:5392–5399. doi: 10.1128/JB.186.16.5392-5399.2004. [DOI] [PMC free article] [PubMed] [Google Scholar]
- 47.Silverman RB. The Organic Chemistry of Drug Design and Drug Action. 2nd. Elsevier Inc; 2004. [Google Scholar]
- 48.Zhang JH, Chung TDY, Oldenburg KR. A simple statistical parameter for use in evaluation and validation of high throughput screening assays. J Biomol Screen. 1999;4:67–73. doi: 10.1177/108705719900400206. [DOI] [PubMed] [Google Scholar]
- 49.Ouameur AA, Bourassa P, Tajmir-Riahi HS. Probing tRNA interaction with biogenic polyamines. RNA. 2010;16:1968–1979. doi: 10.1261/rna.1994310. [DOI] [PMC free article] [PubMed] [Google Scholar]
- 50.Kilburn D, Ho Roh J, Guo L, Briber RM, Woodson SA. Molecular crowding stabilizes folded RNA structure by the excluded volume effect. J Am Chem Soc. 2010;132:8690–8696. doi: 10.1021/ja101500g. [DOI] [PMC free article] [PubMed] [Google Scholar]
- 51.Nakano S, Karimata HT, Kitagawa Y, Sugimoto N. Facilitation of RNA enzyme activity in the molecular crowding media of cosolutes. J Am Chem Soc. 2009;131:16881–16888. doi: 10.1021/ja9066628. [DOI] [PubMed] [Google Scholar]
- 52.Chinnappan R, Dubé A, Lemay JF, Lafontaine DA. Fluorescence monitoring of riboswitch transcription regulation using a dual molecular beacon assay. Nucleic Acids Res. 2013;41:e106. doi: 10.1093/nar/gkt190. [DOI] [PMC free article] [PubMed] [Google Scholar]
- 53.Alatossava T, Jütte H, Kuhn A, Kellenberger E. Manipulation of intracelluar magnesium content in polymyxin B nonapeptide-sensitized Escherichia coli by Ionophore A23187. J Bacteriol. 1985;162:413–419. doi: 10.1128/jb.162.1.413-419.1985. [DOI] [PMC free article] [PubMed] [Google Scholar]
- 54.Froschauer EM, Kolisek M, Dieterich F, Schweigel M, Schweyen RJ. Fluorescence measurements of free [Mg2+] by use of mag-fura 2 in Salmonella enterica. FEMS Microbiol Lett. 2004;237:49–55. doi: 10.1016/j.femsle.2004.06.013. [DOI] [PubMed] [Google Scholar]
- 55.Lee J, Vogt CE, McBrairty M, Al-Hashimi HM. Influence of Dimethylsulfoxide on RNA Structure and Ligand-Binding. Anal Chem. 2013;85:9692–9698. doi: 10.1021/ac402038t. [DOI] [PMC free article] [PubMed] [Google Scholar]
- 56.Higashi K, Terui Y, Suganami A, Tamura Y, Nishimura K, Kashiwagi K, Igarashi K. Selective structural change by spermidine in the bulged-out region of double-stranded RNA and its effect on RNA function. J Biol Chem. 2008;283:32989–32994. doi: 10.1074/jbc.M806027200. [DOI] [PubMed] [Google Scholar]
- 57.Ahmed A, Bourassa P, Tajmir-Riahi HA. Probing tRNA interaction with biogenic polyamines. RNA. 2010;16:1968–1979. doi: 10.1261/rna.1994310. [DOI] [PMC free article] [PubMed] [Google Scholar]
Associated Data
This section collects any data citations, data availability statements, or supplementary materials included in this article.