

Abstract
We have developed a novel plasma protein analysis platform with optimized sample preparation, chromatography, and MS analysis protocols. The workflow, which utilizes chemical isobaric mass tag labeling for relative quantification of plasma proteins, achieves far greater depth of proteome detection and quantification while simultaneously having increased sample throughput than prior methods. We applied the new workflow to a time series of plasma samples from patients undergoing a therapeutic, “planned” myocardial infarction for hypertrophic cardiomyopathy, a unique human model in which each person serves as their own biologic control. Over 5300 proteins were confidently identified in our experiments with an average of 4600 proteins identified per sample (with two or more distinct peptides identified per protein) using iTRAQ four-plex labeling. Nearly 3400 proteins were quantified in common across all 16 patient samples. Compared with a previously published label-free approach, the new method quantified almost fivefold more proteins/sample and provided a six- to nine-fold increase in sample analysis throughput. Moreover, this study provides the largest high-confidence plasma proteome dataset available to date. The reliability of relative quantification was also greatly improved relative to the label-free approach, with measured iTRAQ ratios and temporal trends correlating well with results from a 23-plex immunoMRM (iMRM) assay containing a subset of the candidate proteins applied to the same patient samples. The functional importance of improved detection and quantification was reflected in a markedly expanded list of significantly regulated proteins that provided many new candidate biomarker proteins. Preliminary evaluation of plasma sample labeling with TMT six-plex and ten-plex reagents suggests that even further increases in multiplexing of plasma analysis are practically achievable without significant losses in depth of detection relative to iTRAQ four-plex. These results obtained with our novel platform provide clear demonstration of the value of using isobaric mass tag reagents in plasma-based biomarker discovery experiments.
The goal of biomarker discovery studies in plasma or other biological matrices is to identify proteins that are truly differential in abundance between a population of cases and suitable controls, or before and after a relevant perturbation. The approach has generally been to use label-free methods to analyze individual samples from each class or condition, often few in number, and to employ a differential cutoff to discriminate real differences from technical artifacts or biological noise. These cutoffs are frequently arbitrarily determined, but may be informed by variables such as the observed CVs of measured peptides and the total number of samples included in the study.
To reconcile the vast dynamic range and complexity of plasma with the hypothesis that disease-specific markers are likely to be of relatively low abundance, plasma samples for biomarker discovery are often extensively processed before liquid chromatography tandem MS (LC-MS/MS)1 analysis. Typical approaches to improve depth of detection in plasma include immunoaffinity-based depletion of abundant proteins and offline chromatography at the protein or peptide level using approaches based on separation techniques that differ from the final RP-HPLC separation into the mass spectrometer (e.g. strong cation exchange chromatography (SCX), size exclusion chromatography, or reversed phase chromatography at basic pH). Increasing the fraction number in plasma discovery experiments has been shown to increase both the total number of peptides/proteins confidently identified and the relative enrichment of low abundance proteins, (1) with accumulating data supporting reversed phase at basic pH as a particularly effective fractionation strategy (1–3). Unfortunately, such intensive processing of individual samples improves depth of coverage at the dual cost of increased pre-analytical variability and decreased throughput. Pre-analytical variability in turn increases the technical CV and hence the minimum difference that can be reliably measured between samples. As an example of the merits and limitations of such a strategy, we have reported previously on plasma-based biomarker discovery for myocardial injury using a label-free workflow consisting of depletion of the most abundant plasma proteins followed by digestion and extensive fractionation of peptides by SCX chromatography prior to LC-MS/MS analysis (4). Detection of up to 900 proteins per sample time point was achieved by fractionation into 80 sub-samples and analyzing each using a 90 min effective gradient (150 min inject-to-inject). Such extensive fractionation markedly constrained the number of samples that could be analyzed, and the attendant pre-analytical variability contributed to the determination that only relatively large fold-changes in abundance (>5×) could be reliably distinguished by this label-free approach.
Though more quantitative and efficient approaches for biomarker discovery in plasma are clearly warranted, surprisingly few plasma studies have attempted to employ contemporary quantitative proteomic methods in deep profiling experiments. Until recently, the use of iTRAQ and similar labeling methods for plasma proteomics had succeeded in quantifying only a few hundred proteins. Somewhat better results are beginning to be reported. A recent interlaboratory study comparing the performance of several high resolution mass spectrometers with respect to detection and iTRAQ quantification identified 1200 to 1700 proteins in plasma in an iTRAQ four-plex format after two rounds of combined IgY14/Supermix (Sigma-Aldrich, St.Louis, MO) immunoaffinity depletion of samples and partitioning of peptides by isoelectric focusing into 30 fractions (5). In a very large-scale study using immunoaffinity depletion of the six most abundant plasma proteins, 8-plex iTRAQ labeling of peptides and LC-MS/MS analysis of 24 SCX peptide fractions, Cole et al. identified and quantified a core set of 982 proteins in at least 50 out of 500 plasma samples allowing for protein identification using a single peptide (6). The total aggregate number of proteins quantified using two or more peptides across all 72 iTRAQ experiments in these experiments was ca. 900, whereas the average number of proteins quantified by two or more peptides per iTRAQ experiment was ca. 300 (personal communication with the author).
We reasoned that the combination of optimized plasma processing protocols, improved chromatography and latest-generation MS systems could further enhance biomarker discovery, enabling practical use of iTRAQ and similar labeling approaches such as TMT (7, 8) for plasma proteomics without sacrificing depth of proteome detection. We deployed and tested these process improvements in the context of ongoing discovery and verification of plasma biomarkers of acute myocardial injury, using the planned myocardial infarction model described previously (4).
EXPERIMENTAL PROCEDURES
Patient Sample Collection
Four patients undergoing planned myocardial infarction (PMI) with alcohol ablation for the treatment of hypertrophic obstructive cardiomyopathy (HOCM) were included in this study (4, 9). All protocols for blood collection were approved by the Massachusetts General Hospital Institutional Review Board, and all subjects gave written informed consent.
Peripheral plasma at baseline, as well as 10, 60, and 240 min post-injury for each patient were included in the study.
Sample Preparation for Discovery Proteomics Study in PMI Patient Samples
Plasma Depletion and Enzymatic Digestion
Four hundred microliters peripheral plasma from four patients collected at baseline and 10, 60, and 240 min postalcohol ablation was immunoaffinity depleted of 14 most abundant proteins followed by the next ∼50 moderately abundant proteins using IgY14 LC20 and Supermix LC10 columns (Sigma-Aldrich, St.Louis, MO). Tandem depletion was performed on Agilent 1100 HPLC (Agilent, Santa Clara, CA) system using Dilution, Stripping, and Neutralization buffers provided by the manufacturer and following manufacturer's instructions (Sigma-Aldrich). Flow through of the Supermix column representing depleted plasma was concentrated and buffer exchanged to 50 mm Ammonium Bicarbonate to the original volume (400 μl) using Amicon 3K concentrators (Millipore, Billerica, MA). Protein concentrations of depleted plasma were determined by BCA protein assay (Thermo Fisher Scientific, Waltham, MA).
Four hundred microliters of IgY14/Supermix depleted peripheral plasma per time point and patient was denatured with 6 m Urea, reduced with 20 mm dithiothreitol at 37 °C for 30 min, and alkylated with 50 mm iodoacetamide at room temperature in the dark for 30 min. Urea concentration was diluted to 2 m with 50 mm ammonium bicarbonate prior to Lys-C digestion (Wako, Richmond, VA) at 1:50 (w:w) enzyme to substrate ratio at 30 °C for 2 h with mixing on the shaker at 850 rpm. Urea was further diluted to less than 1 m prior to overnight digestion with trypsin (Promega, Madison, WI) with 1:50 (w:w) enzyme to substrate ratio at 37 °C with shaking at 850 rpm. Digestion was terminated with formic acid to a final concentration of 1%. The digests were desalted using Oasis HLB 1cc (30 mg) reversed phase cartridges (Waters, Milford, MA) with 0.1% Formic acid and 0.1% Formic acid/80% Acetonitrile as buffers A and B, respectively, using a vacuum manifold. Cartridges were conditioned with 3 × 500 μl buffer B followed by equilibration with 4 × 500 μl buffer A. After loading the digests at a reduced flow rate, they were washed with 3 × 750 μl buffer A and eluted with 3 × 500 μl buffer B. Eluates were frozen and dried by vacuum centrifugation. Digests were reconstituted in 400 μl of 0.1% formic acid and post-digestion concentrations were determined by BCA. Based on the post-digestion concentration, 80 μg aliquots were prepared, frozen, dried to dryness by vacuum centrifugation and stored at −80 °C.
Spiking in Synthetic Peptide Mixture
Mixture of 97 heavy labeled synthetic peptides was used for spiking into the different time point samples of three out of the four PMI patient samples. Peptide mixture was spiked in at the time of reconstitution of samples for iTRAQ labeling at the ratio of 1:2:5:10 in the four different channels of iTRAQ four-plex. Total amounts spiked into the samples were as follows: baseline - 1 pmol; 10 min - 2 pmol; 1 h - 5 pmol; 4 h - 10 pmol.
iTRAQ Labeling of Plasma Samples
Eighty micrograms dried aliquots of the four time points (baseline, 10, 60 and 240 min post-injury) for each PMI patient were labeled with iTRAQ four-plex reagent following manufacturer's instructions for labeling plasma (AB Sciex, Framingham, MA), which calls for use of two-fold more reagent for plasma than other samples (cell lysates, tissues, etc). In an effort to eliminate bias toward any iTRAQ channel, different iTRAQ channel layout was used for the different time points of the four PMI patient samples. After reconstituting samples in 30 μl 1 m triethylammoniumbicarbonate (TEAB) 100 μl ethanol was added to each sample. Pooled iTRAQ reagent from two vials was added to each sample, mixed and incubated at room temperature for 1 h. Three microliters of each sample was used to check label incorporation by LC-MS/MS prior to quenching the reaction. Once satisfied with labeling efficiency (> 95% label incorporation) the reactions were quenched by adding Tris pH 8 for a final concentration of 100 mm and incubating at room temperature for 15 min. Labeled samples representing four different time points of a PMI patient were mixed together, dried down and desalted using Oasis HLB 1cc (30 mg) reversed phase cartridges as described above. Eluates were frozen, dried to dryness, and stored at −80 °C.
Evaluation of TMT6 and TMT10 Reagents for Labeling Plasma
For the evaluation of TMT six-plex, and TMT ten-plex reagents (Thermo Fisher Scientific) as well as direct comparison with iTRAQ four-plex reagent pooled normal plasma from commercial sources was used (BioreclamationIVT, Baltimore, MD). Plasma was depleted using IgY14/Supermix immunodepletion strategy and digested as described above. Following digestion and desalting, aliquots of 4 × 80 μg, 6 × 53.3 μg, and 10 × 32 μg aliquots were made for iTRAQ four-plex, TMT six-plex, and TMT ten-plex labeling, respectively. Mixture of the same 97 heavy labeled synthetic peptides was spiked in prior to labeling at the following ratios: for iTRAQ four-plex at 10:5:1:2 ratios corresponding to 114:115:116:117 channels, for TMT six-plex at 10:5:1:1:2:0.5 corresponding to 126:127:128:129:130:131 channels, and for TMT ten-plex at 10:5:0.5:2:1:1:2:3:5:0.5 corresponding to 126:127N:127C:128N:128C:129N:129C:130N:130C:131 channels. iTRAQ labeling of plasma was done as described above. For TMT, labeling samples were reconstituted in 100 mm TEAB for a final concentration of 1 μg/μl protein (53 μl for TMT six-plex, and 32 μl for TMT ten-plex). 21 μl and 12 μl of each of the TMT six-plex or TMT ten-plex reagent was added to the plasma aliquots, mixed and incubated at room temperature with shaking for 1 h. Three microliters of each sample was used to check label incorporation by LC-MS/MS prior to quenching the reactions. Reactions were quenched by adding 5% hydroxylamine at a 0.08 μl/μg concentration, dried down and desalted using Oasis HLB 1cc (30 mg) cartridges. Further processing of these samples was done as described below.
Fractionation of Peptides by Reversed Phase Chromatography at High pH (Basic pH RP)
Digested and iTRAQ labeled plasma sample for each patient was reconstituted in 540 μl of 20 mm ammonium formate/2% acetonitrile pH 10, loaded on a Zorbax 300 Extend 2.1 × 150 mm column (Agilent Technologies, Santa Clara, CA), and fractionated on an Agilent 1100 Series HPLC instrument by basic reversed-phase chromatography at a flow rate of 200 μl/min. Mobile phase consisted of 20 mm ammonium formate/2% acetonitrile pH 10 (buffer A) and 20 mm ammonium formate 90% acetonitrile pH 10 (buffer B). After loading 500 μl of sample (300 μg) onto the column, the peptides were separated using the following gradient: 5 min isocratic hold at 0% B, 0 to 15% solvent B in 8 min; 15 to 28.5% solvent B in 33 min; 28.5 to 34% solvent B in 5.5 min; 34 to 60% solvent B in 13 min, for a total gradient time of 64.5 min. Using 96 × 2 ml well plates, fractions were collected every 0.6 min for a total of 84 fractions through the main elution profile of the separation. In addition, the extreme early and late portions of the gradient were collected into two additional larger volume fractions. All fractions were acidified to a final concentration of 1% formic acid and the internal 84 fractions were then recombined by pooling early, mid and late fractions together resulting in a total of 28 fractions using concatenation strategy (3). These 28 fractions along with the additional 2 fractions representing early and late eluting peptides constructed a total of 30 fractions to be analyzed by LC-MS/MS. All fractions were dried to dryness by vacuum centrifugation and stored at −80 C until mass spectrometric analysis.
NanoLC-MS/MS analysis
For plasma samples from individual patients each of the 30 fractions was reconstituted in 16 μl of 5% formic acid/3% Acetonitrile and 2 μl were analyzed on Q Exactive mass spectrometer (Thermo Fisher Scientific) equipped with a nanoflow ionization source (James A. Hill Instrument Services, Arlington, MA) and coupled to an EASY-nLC 1000 UHPLC system (Thermo Fisher Scientific). Chromatography was performed on a 75 μm ID picofrit column (New Objective, Woburn, MA) packed in house with Reprosil-Pur C18 AQ 1.9 μm beads (Dr. Maisch, GmbH, Entringen, Germany) to a length of 20 cm. Columns were heated to 50°C using column heater sleeves (Phoenix-ST, Chester, PA) to prevent overpressuring of columns during UHPLC separation. The LC system, column, and platinum wire to deliver electrospray source voltage were connected via a stainless-steel cross (360 μm, IDEX Health & Science, UH-906x). Mobile phases consisted of 0.1% formic acid/3% acetonitrile as solvent A, and 0.1% formic acid/90% acetonitrile as solvent B. Peptides were eluted at 200 nL/min with a gradient of 6 to 35% B in 150 min, 35 to 60% B in 8 min, 60 to 90% B in 3 min, hold at 90% B for 10 min, 90% B to 50% B in 1 min, followed by isocratic conditions at 50% B for 10 min. A single Orbitrap MS scan from 300 to 1800 m/z at a resolution of 70,000 with AGC set at 3e6 was followed by up to 12 ms/ms scans at a resolution of 17,500 with AGC set at 5e4. MS/MS spectra were collected with normalized collision energy of 27 and isolation width of 2.5 amu. Dynamic exclusion was set to 20s, and peptide match was set to on.
For samples of plasma pooled from multiple patients and used in the iTRAQ/TMT comparison some of the above parameters were revised. Analyses were performed on a Q Exactive Plus mass spectrometer (Thermo Fisher Scientific) with an isolation width of 2.0 amu. For TMT labeled peptides the normalized collision energy was decreased to 26. For TMT-10 labeled peptides MS/MS spectra were collected at a resolution of 35,000.
Data Analysis
Data analysis was done using the Spectrum Mill MS Proteomics Workbench software package v 4.2 beta (Agilent Technologies). Similar MS/MS spectra acquired on the same precursor m/z within ± 60 s were merged. MS/MS spectra were excluded from searching if they failed the quality filter by not having a sequence tag length > 0 (i.e. minimum of two masses separated by the in-chain mass of an amino acid) or did not have a precursor MH+ in the range of 750–4000. All extracted spectra were searched against a UniProt database containing human reference proteome sequences (including isoforms and excluding fragments), 58,929 entries. The sequences were downloaded from the UniProt web site on October 17, 2014, redundant sequences removed, and a set of common laboratory contaminant proteins (150 sequences) appended. Search parameters included: ESI-QEXACTIVE-HCD-v2 scoring, parent and fragment mass tolerance of 20 ppm, 40% minimum matched peak intensity, trypsin allow P enzyme specificity with up to four missed cleavages, and calculate reversed database scores enabled. Fixed modifications were carbamidomethylation at cysteine. iTRAQ/TMT labeling was required at lysine, but peptide N termini were allowed to be either labeled or unlabeled. Allowed variable modifications were acetylation of protein N termini, oxidized methionine, deamidation of asparagine, pyro-glutamic acid at peptide N-terminal glutamine, and pyro-carbamidomethylation at peptide N-terminal cysteine with a precursor MH+ shift range of −18 to 70 Da. Database matches were autovalidated at the peptide and protein level in a two-step process with identification FDR estimated by target-decoy-based searches using reversed sequences. Peptide autovalidation was done first and separately for each patient directory of 30 LC-MS/MS files using an auto thresholds strategy with a minimum sequence length of six, automatic variable range precursor mass filtering, and score and delta Rank1 - Rank2 score thresholds optimized to yield a spectral level FDR estimate for precursor charges 2 thru 4 of <0.8% for each precursor charge state in each LC-MS/MS run. For precursor charge 5, thresholds were optimized to yield a spectral level FDR estimate of <0.4% across all runs per patient (instead of each run), to achieve reasonable statistics because many fewer spectra are generated for the higher charge state.
Protein polishing autovalidation, a feature of Spectrum Mill, was then applied using an auto thresholding strategy. Protein polishing determines the maximum protein level score of a protein group that consists entirely of distinct peptides estimated to be false-positive identifications (PSM's with negative delta forward-reverse scores). Then all PSM's contributing to protein groups with a score at or below this protein score threshold, or derived from only a single patient, are removed from the set of PSM's obtained in the initial peptide-level autovalidation step. This step further filters all the peptide-level validated spectra with the primary goal of eliminating peptides identified with low scoring peptide spectrum matches (PSM's) that represent proteins identified by a single peptide from a single patient, so-called one-hit wonders. Proteins were grouped together across the four patient directories with minimum number of directories set to 2; minimum protein score of 13 and maximum protein level FDR estimate of 0%. The protein polishing step filtered the results so that each identified protein is detected in more than one patient and is comprised of multiple peptides unless a single excellent scoring peptide was the sole match. As shown in Fig. 2, these settings yielded a spectrum level FDR estimate of <0.5% and a peptide level FDR estimate of <1.5% for each patient. In aggregate across all 4 patients the estimated FDR's are spectrum level: 0.45%, peptide level: 2.36%, and protein level: <0.02% (1/5304). Because the protein level FDR estimate neither explicitly requires a minimum number of distinct peptides per protein nor adjusts for the number of possible tryptic peptides per protein, it may underestimate false positive protein identifications for large proteins observed only on the basis of multiple low scoring PSM's.
Fig. 2.

Identification summary statistics in the four PMI patient samples. Table enumerates the number of spectra collected, distinct peptides and proteins identified along with the FDR values achieved in four PMI patient samples as reported by Spectrum Mill (see “Methods” for details). Venn diagram shows the overlap of proteins quantified in four PMI patient samples. aProteins identified in at least two patients with two or more peptides. bSubset of identified proteins with two or more distinct peptides observed in at least one patient. cProtein subgroups (groups); that is, 5304 distinct protein subgroups were identified within 4555 protein groups. Proteins that share a detected distinct peptide (length >8) are combined into a group. A protein group is parsimoniously expanded to one or more subgroups to distinguish proteins that also have one or more distinct peptides that are not shared with the rest of the group, typically isoforms and family members.
In calculating scores at the protein level and reporting the identified proteins, redundancy is addressed in the following manner: the protein score is the sum of the scores of distinct peptides. A distinct peptide is the single highest scoring instance of a peptide detected through an MS/MS spectrum. MS/MS spectra for a particular peptide may have been recorded multiple times, (i.e. as different precursor charge states, in adjacent bRP fractions, or different modification states) but are still counted as a single distinct peptide. When a peptide sequence >8 residues long is contained in multiple protein entries in the sequence database, the proteins are grouped together and the highest scoring one and its accession number are reported. In some cases when the protein sequences are grouped in this manner there are distinct peptides which uniquely represent a lower scoring member of the group (isoforms, family members, or different species). Each of these instances spawns a subgroup and multiple subgroups are reported and counted toward the total number of proteins. Peptides shared between subgroups were counted toward each subgroup's count of distinct peptides and protein level iTRAQ/TMT quantitation. As listed in supplemental Table S2, assembly of confidently identified PSM's from all four patients into proteins yields 5340 total protein subgroups from 4591 protein groups. For further analyses in this study relying solely on identification the list was filtered to include only the 5304 protein subgroups identified by two or more peptides across all four patient samples. For quantitative analyses the list was filtered to include only the 4819 protein subgroups identified by two or more peptides in at least one patient sample.
Protein quantitation was done using iTRAQ/TMT ratios representing 10 min versus baseline, 1 h versus baseline, and 4 h versus baseline for each protein or different channels in iTRAQ/TMT comparison experiment. Spectrum Mill used the reporter ion intensities to calculate the iTRAQ/TMT ratios for each PSM. A protein level iTRAQ/TMT ratio was calculated as the median of all PSM level ratios contributing to the protein remaining after excluding those PSM's lacking an iTRAQ/TMT label, having a negative delta forward-reverse score (half of all false-positive identifications), or having a precursor ion purity <50% (MS/MS has significant precursor isolation contamination from co-eluting peptides).
Data Analysis of Spiked-in Peptides
After the first search and validation, unmatched spectra were searched against a Uniprot subset database containing only the proteins from which the unlabeled versions of the heavy labeled synthetic peptides would derive. Fixed modifications used for the search were iTRAQ, TMT6, or TMT10 labels at peptide N termini. Variable modifications were C13N15 Arginine, and iTRAQ, TMT6 or TMT10 labeled C13N15 Lysine at the C termini. iTRAQ and TMT ratios for the synthetic peptides were exported from Spectrum Mill and used for further analysis of iTRAQ, TMT6 and TMT10 spiked-in data.
Statistical Analysis
The moderated F-test was used to assess statistically significant changes over the time course in four PMI patient samples. The F-test was used to compare log2 transformed iTRAQ protein ratios from each of the three groups representing the 10 min versus baseline, 1 h versus baseline, and 4 h versus baseline comparisons to determine if any of the proteins in the groups have ratios statistically different from zero. Use of the F-test enables detection of arbitrary temporal patterns, and the moderated version of the test borrows information from all the observed proteins to assess variation of the ratios in a more robust manner. The moderated F-test is implemented in R (10) using the limma (11) library. Nominal p values determined by the test are corrected for multiple testing using the false discovery rate [FDR, (12)].
Scatter plots (Fig. 3) were generated to show iTRAQ ratios of each protein across pairs of patient samples, and time points. Statistically significant proteins (common across all scatter plots because they are determined using all patients and time points) are plotted in red.
Fig. 3.

Scatter plots of protein iTRAQ ratios. Protein iTRAQ ratios are plotted for a representative set of two patients for 10 min versus baseline (A), 1 h versus baseline (B), and 4 h versus baseline (C). Red dots indicate statistically significant proteins using moderated F-test with Benjamini-Hochberg corrected p value < 0.05 and these proteins are common across all scatter plots because they are determined using all patients and time points.
The set of statistically significantly regulated proteins are grouped based on their temporal profile using fuzzy c-means clustering (Fig. 4) (13). The number of clusters is chosen based on visual inspection of cluster coherence and uniqueness of temporal profiles.
Fig. 4.

Cluster analysis of 333 regulated proteins. 323 out of the 333 regulated proteins (p-Value < 0.05) in iTRAQ discovery study are grouped in 5 distinct clusters using fuzzy C-means clustering (13). Each line represents temporal behavior of a protein over the time course. X-axis represents the time points (baseline, 10 min, 1 h, and 4 h), and Y-axis represents normalized protein abundance. Proteins were assigned to a cluster based on the membership value of > 0.7. Proteins with membership value in between 0.5 and 0.7 were not assigned to any cluster. Bar graph on the lower right corner shows the number of proteins in each cluster.
Sample Preparation for Verification Study Using ImmunoMRM (iMRM) Assay
Plasma Digestion
Three out of the four PMI patients were included in the 23-plex immunoMRM assay. Thirty microliters plasma from baseline, 10, 60, and 240 min post-injury were digested in 3 process replicates on a Bravo Automated Liquid Handling Platform (Agilent Technologies). Briefly, plasma samples were added to a 96-well, 2 ml capacity plate and digested using the same protocol design as described earlier (14). To reduce evaporation, the plate was covered during the overnight period. The reactions were quenched by addition of formic acid to a final concentration of 1%. Prior to desalting, 100 fmol of isotopically labeled synthetic peptide standards were added to each well. Samples were then desalted using Oasis HLB 30 mg plate (Waters) on a Positive Pressure-96 Processor with the standard protocol as described previously. Samples were eluted in 80% acetonitrile/0.1% formic acid (3 × 500 μl) into a 2 ml capacity 96-well plate, frozen, vacuum centrifuged to dryness and stored at −80 °C.
Antibody Preparation
Anti-peptide antibodies were prepared as rabbit polyclonals by either Epitomics (Burlingame, CA) or New England Peptide (Gardner, MA) except for antibody against peptide TDPGVFIGVK (IL-33) which was prepared as a rabbit monoclonal. Antibodies incubated individually to 1 μm Dynabeads® Protein G (Life Technologies, Grand Island, NY) in batch mode mixing at 4 °C overnight. Beads were then transferred to wells in a KingFisher 96 Deepwell plate following protocol performed on the KingFisher 96 magnetic bead processor (Thermo Fisher Scientific Inc.): 30 min incubation with freshly made 20 mm dimethyl pimelimidate200 mm triethanolamine pH 8.5 followed by 30 min quenching step in 150 mm ethanolamine. Antibody Protein G conjugated beads were then washed twice for 5 min with 5% acetic acid/0.03% CHAPS followed by 5 min re-equilibation with 1X PBS/0.03% CHAPS. Antibody beads were finally resuspended in 1× PBS/0.03% CHAPS/0.1% NaN3 to 0.5 mg/ml and stored at 4 °C until use.
Peptide Immunoaffinity Enrichment
Each digested sample was resuspended in 210 μl of 1× PBS 0.01% CHAPS 100 mm Tris pH 8.0 and transferred to a 250 μl capacity 96-well plate. A mixture of 23 antipeptide antibodies cross-linked to beads was prepared and added to each well resulting in 1 μg of each conjugated antibody except for TPM.SID, FGL2.ELE and ITGB.GEV which were only 0.5 μg because of a limited supply. Samples were tumble-mixed overnight by tumble action at 4 °C. The next day, plates were transferred onto a KingFisher 96 magnetic particle processor and processed as described previously (15). Briefly, after mixing for 5 min on the KingFisher, the beads were washed twice with 1× PBS/0.0.3% CHAPS for 90 s followed by a third wash with 0.11× PBS/0.03% CHAPS for 90 s. Peptides were eluted from the antibody beads by mixing on KingFisher with 30 μl of 5% acetic acid/3% acetonitrile for 5 min. To eliminate possible bead transfer to the next phase of analysis (LC-MRM-MS), the elution plate (Bio-Rad Laboratories, Waltham, MA) was placed on a magnetic plate holder on wet ice and the contents of each well were transferred to a fresh plate, sealed with aluminum foil seal mat and stored at −80 °C until analysis.
LC-MRM-MS Analysis
Samples were reconstituted in 30 μl 0.1% formic acid/3% acetonitrile and 10 μl was analyzed on a 4000 Q Trap hybrid triple quadrupole, linear ion trap mass spectrometer equipped with Advanced Captive Spray MS source (Bruker, Auburn, CA) and coupled with an Eksigent Nano LC 2D Plus HPLC system (AB Sciex, Framingham, MA). Liquid chromatography conditions were described previously (15). Samples were analyzed on a 75 μm ID IntegraFrit column packed in-house to 10 cm with Reprosil-Pur C18 AQ 3 μm beads (Dr. Maisch, GmbH, Entringen, Germany) and connected to the spray tip of Captive Spray source. MS source parameters included source voltage of 1300, curtain and nebulizer gases of 0, interface heater temperature of 110 °C and collision gas set to medium. Three transitions per precursor were monitored with unit resolution for both Q1 and Q3. Declustering potential and collision energy were calculated for each precursor using the equations for 4000 Q Trap. Scheduled MRM method was used with 2 min retention time window and target cycle time of 0.9 s.
Data Analysis
Analysis of the data was done using Skyline open source software package (16). For each peptide light/heavy peak area ratio was used for further evaluation of results using QuaSAR (http://genepattern.broadinstitute.org/gp/pages/index.jsf?lsid = QuaSAR). Corresponding protein concentrations were calculated as described previously (15). Ten minutes versus baseline, 1 h versus baseline, and 4 h versus baseline protein concentration ratios were plotted to compare similar ratios calculated for iTRAQ reporter ions.
RESULTS
Improved Workflow Provides Faster, Deeper Discovery With More Precise Quantitation
To evaluate our plasma proteomic analysis workflow in the context of relevant biomarker discovery, four patients undergoing a therapeutic, PMI for hypertrophic cardiomyopathy were included in this study. Briefly, this planned injury model to ameliorate excess cardiac muscle in the interventricular septum recapitulates important features of spontaneous myocardial infarction, including the release of standard biomarkers (cardiac troponins) with the expected kinetics. The clinical characteristics of the patients are summarized in supplemental Table S1. Peripheral blood was collected from the patients at baseline (after catheter placement but before administration of alcohol into the coronary sinus) as well as at 10 min, 1 h, and 4 h after the induction of injury. The 16 total patient plasma samples were processed using the strategy shown in Fig. 1. The comprehensively revised workflow included numerous changes relative to our previous label-free approach (4), including changes to depletion, fractionation, on-line reversed phase chromatography, and MS instrumentation, in addition to the incorporation of iTRAQ labeling. In order to increase depth of detection in plasma, immunoaffinity depletion of abundant proteins is commonly employed (17–19). Here we used the IgY14/Supermix tandem depletion system (Sigma-Aldrich) prior to digestion and iTRAQ labeling of patient samples. The IgY14 antibody column removes the 14 most abundant plasma proteins including albumin, immunoglobulins G, A, and M, transferrin and others. The column flow-through is passed through the Supermix column, targeting 99% depletion of 50 moderate abundance proteins (though a larger number of proteins are captured at lower depletion efficiencies). Together these columns remove 96 to 99% of the total protein mass of plasma, promoting detection of low abundance proteins and allowing sampling of proteins present in plasma at low to sub-ng/ml levels (20, 21).
Fig. 1.
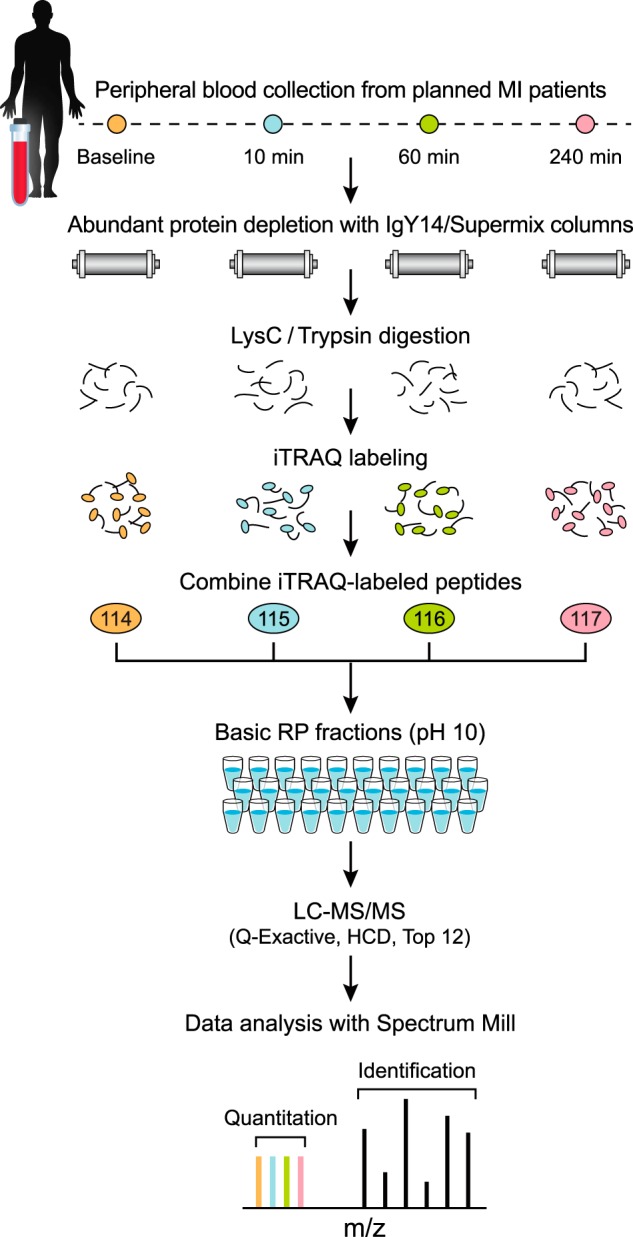
Diagram of improved workflow for discovery proteomics in plasma. Samples from four different time points of planned MI (PMI) patients were depleted from abundant proteins, reduced, alkylated and digested by LysC/Trypsin. Following desalting, samples were labeled by four-plex iTRAQ reagent, and mixed after evaluating label incorporation. Sample was then fractionated using reversed phase chromatography at high pH into 30 pooled, concatenated fractions. Fractions were analyzed by data dependent analysis on a Q Exactive mass spectrometer using 75 μm picofrit columns packed in-house with 1.9 μm beads to 20 cm length. See Methods for details.
After abundant protein depletion and digestion, the samples were digested to peptides and labeled by iTRAQ four-plex reagent using a protocol optimized for plasma (see Methods). This chemical labeling strategy covalently modifies the primary amines of the N termini and Lysine side-chains of peptides (22). When iTRAQ-labeled peptides fragment in the mass spectrometer, distinct low m/z reporter ions are generated for each of the four different labels; relative quantification is based on ratios of these low m/z reporter ions. Incorporating iTRAQ labeling into the workflow allows mixing of four samples after the digestion step, reducing both pre-analytical and analytical variability and thereby providing more precise relative quantification of proteins compared with label-free methods (23, 24). iTRAQ-labeled peptides were fractionated offline using high pH reversed phase chromatography (“basic RP”). To improve orthogonality to the final on-line low pH RP separation, early, middle and late fractions were combined prior to LC-MS/MS analysis (2, 3). Basic reversed phase chromatography with concatenation of fractions has been shown to provide better resolution of iTRAQ-labeled peptides and phosphopeptides than SCX (25, 26). Thirty total fractions were analyzed by LC-MS/MS on 75 μm ID columns packed with sub-2 μm beads using a 150 min gradient (210 min inject-to-inject) and a latest generation Q Exactive mass spectrometer (Thermo Fisher Scientific). The combination of parallel time point analysis using iTRAQ and reduction of fraction number from 80 (SCX) to 30 (basic RP) more than offset the increase in effective gradient length (90 to 150 min), leading to more than a six-fold improvement in sample analysis speed and sample throughout compared with prior work (4).
Data were extracted and searched against the Uniprot Human database using Spectrum Mill software (Agilent). Up to 37,918 distinct peptides from an average of 4641 proteins (range 4280 - 4836) were identified in individual patient samples with a maximum peptide FDR estimate of <1.5% per patient (Fig. 2; see “Methods” for details). An aggregate total of 5,304 proteins were identified from at least two patients with at least two distinct peptides across the four patient samples with a protein FDR estimate of <0.02% (1/5304). An aggregate of 4819 proteins were further quantified by two or more peptides in at least one of the patient samples. supplemental Table S2 summarizes all proteins identified and quantified in the study. The list of identified peptides from all the proteins is presented in supplemental Table S3. Sixty four percent of the proteins (a total of 3390) were identified and quantified in all 16 samples from the four patients (Fig. 2). This represents nearly a five-fold increase in the depth of coverage of plasma proteome relative to our earlier label-free study (4), (supplemental Fig. S1). Importantly, the vast majority (ca. 85%) of proteins detected in our previous study were re-discovered in the present study.
To assess the improvement in depth of coverage that was specifically attributable to the additional depletion of moderately abundant plasma proteins by Supermix, we compared IgY14 depletion to IgY14/Supermix tandem depletion for a subset of 12 samples from three patients. Approximately 2800 total proteins were identified and quantified (with two or more distinct peptides/protein) in aggregate across the twelve samples using IgY14 depletion alone. In contrast, nearly 5100 proteins were detected and quantified in the same twelve samples using IgY14/Supermix depletion (supplemental Table S4, supplemental Fig. S1B). Therefore, the additional depletion of moderately abundant plasma proteins alone increases global proteome coverage by 82%. Further depletion does not however create a strict superset: 402 proteins most of which were identified and quantified by two–eight distinct peptides in at least one patient sample after IgY14 depletion alone were not detected after tandem IgY14/Supermix depletion (supplemental Table S5). Forty-six out of the 402 proteins were detected in the Supermix bound fraction of the same three patient samples.
The normalized mean intensities of proteins observed and quantified across the 16 plasma samples after IgY14/Supermix depletion span nine orders of magnitude (supplemental Figs. S2 and S3 and supplemental Table S6). It is noteworthy that cardiac troponins I and T, which are known to be at low abundance in plasma at early time points after myocardial injury (typically picogram/mL), are robustly detected and quantified in all patient samples with up to 6–8 peptides observed for each troponin (supplemental Table S7). In contrast, cardiac Troponin T was observed only sporadically and with only a single peptide in our prior label-free study (4), whereas Troponin I was not observed at all. Of note, no peptides from cardiac troponins were detected by the current workflow in samples depleted with IgY14 alone (data not shown).
iTRAQ Detects Novel Candidate Biomarkers of MI
In our experimental design, patients served as their own controls, with data reported as iTRAQ ratios between the 10 min, 1 h and 4 h post-injury timepoints versus the pre-injury baseline. Quantification was based on the median ratio of all peptides quantified for each protein, as reported by Spectrum Mill (see “Methods”). To facilitate comparison, data for each iTRAQ channel (representing a specific patient and time point) were median centered, that is, ratios for all proteins were normalized to the median ratio for that channel. A moderated F-test was used to assess statistically significant changes in abundance of the 4819 proteins detected and quantified with two or more peptides in at least one of the patient samples (see Methods). Selected examples of the resulting scatter plots are shown in Fig. 3. A total of 333 proteins were significantly regulated over the time course (meaning relative protein abundance differed significantly from baseline at least in one post-injury time point) with a Benjamini-Hochberg corrected p value of less than 0.05 (Table I). The number of confidently regulated proteins is six times larger than in our previous study (4). Levels for 90% of the 333 regulated proteins increased as a result of cardiac injury, whereas the levels for only 38 proteins decreased following the injury. Established markers of myocardial injury including myoglobin (MB), creatine kinase B (CKB), creatine kinase M (CKM), fatty acid binding protein (FABP) and all Troponins (TNNT2, TNNI3, TNNC1, and TNNC2) were in the up-regulated list and showed consistent behavior across the different patients (27).
Table I. List of 333 regulated proteins in 4 PMI patient samples using iTRAQ workflow.
| Uniprot accession number | Gene symbol | Protein name | Log2 iTRAQ ratio (average of 4 PMI patients) |
Moderated F-test p valuea | Clusterb | ||
|---|---|---|---|---|---|---|---|
| 10min vs. BL | 1hr vs. BL | 4hr vs. BL | |||||
| Q9UPZ6 | THSD7A | Thrombospondin type-1 domain-containing protein 7A | 0.907 | 0.755 | 0.022 | 2.06E-05 | 1 |
| Q9C0I4 | THSD7B | Thrombospondin type-1 domain-containing protein 7B | 0.669 | 0.574 | 0.040 | 8.12E-03 | 1 |
| Q8IUX7 | AEBP1 | Adipocyte enhancer-binding protein 1 | 1.215 | 0.868 | −0.082 | 1.17E-03 | 1 |
| Q8N436 | CPXM2 | Inactive carboxypeptidase-like protein X2 | 1.986 | 1.447 | −0.234 | 2.28E-02 | 1 |
| Q02818 | NUCB1 | Nucleobindin-1 | 0.713 | 0.571 | −0.050 | 1.09E-02 | 1 |
| P05164–3 | MPO | Isoform H7 of Myeloperoxidase | 0.924 | 0.760 | 0.116 | 1.21E-04 | 1 |
| P19801–2 | AOC1 | Isoform 2 of Amiloride-sensitive amine oxidase [copper-containing] | 1.383 | 1.298 | 0.155 | 2.06E-05 | 1 |
| P02549 | SPTA1 | Spectrin alpha chain, erythrocytic 1 | 0.408 | 0.405 | 0.209 | 6.68E-03 | 1 |
| Q12906–7 | ILF3 | Isoform 7 of Interleukin enhancer-binding factor 3 | 0.180 | 0.169 | 0.054 | 4.45E-02 | 1 |
| P11150 | LIPC | Hepatic triacylglycerol lipase | 1.186 | 1.347 | 0.150 | 5.93E-05 | 1 |
| P19883 | FST | Follistatin | 1.187 | 0.944 | 0.019 | 3.59E-05 | 1 |
| P08294 | SOD3 | Extracellular superoxide dismutase [Cu-Zn] | 0.702 | 0.579 | 0.011 | 5.07E-03 | 1 |
| Q8N474 | SFRP1 | Secreted frizzled-related protein 1 | 1.372 | 0.901 | 0.081 | 8.71E-05 | 1 |
| P80303–2 | NUCB2 | Isoform 2 of Nucleobindin-2 | 0.518 | 0.448 | 0.133 | 1.02E-02 | 1 |
| P21741 | MDK | Midkine | 2.341 | 1.655 | 0.208 | 1.21E-04 | 1 |
| P10646 | TFPI | Tissue factor pathway inhibitor | 0.474 | 0.523 | −0.025 | 4.28E-02 | 1 |
| O95631 | NTN1 | Netrin-1 | 0.799 | 0.641 | 0.121 | 8.03E-04 | 1 |
| P25940 | COL5A3 | Collagen alpha-3(V) chain | 0.547 | 0.365 | 0.019 | 3.96E-02 | 1 |
| P21246 | PTN | Pleiotrophin | 2.209 | 1.906 | 0.338 | 1.11E-04 | 1 |
| P02776 | PF4 | Platelet factor 4 | 1.308 | 1.251 | 0.413 | 2.81E-02 | 1 |
| P10720 | PF4V1 | Platelet factor 4 variant | 1.261 | 1.149 | 0.415 | 2.09E-02 | 1 |
| P20827 | EFNA1 | Ephrin-A1 | 0.360 | 0.355 | 0.045 | 1.83E-02 | 1 |
| Q9BY76 | ANGPTL4 | Angiopoietin-related protein 4 | 0.609 | 0.397 | 0.229 | 2.50E-02 | 1 |
| Q15109–3 | AGER | Isoform 3 of Advanced glycosylation end product-specific receptor | 0.553 | 0.366 | −0.040 | 2.97E-02 | 1 |
| O43508 | TNFSF12 | Tumor necrosis factor ligand superfamily member 12 | 0.714 | 0.467 | −0.064 | 4.95E-02 | 1 |
| P02788 | LTF | Lactotransferrin | 0.329 | 0.210 | 0.140 | 2.09E-02 | 1 |
| Q99584 | S100A13 | Protein S100-A13 | 1.131 | 1.003 | 0.126 | 9.07E-03 | 1 |
| P18827 | SDC1 | Syndecan-1 | 0.312 | 0.297 | 0.175 | 5.58E-03 | 1 |
| O95969 | SCGB1D2 | Secretoglobin family 1D member 2 | 1.302 | 0.359 | 0.369 | 3.40E-02 | 1 |
| E7EN11 | CACNB4 | Voltage-dependent l-type calcium channel subunit beta-4 | 0.497 | 0.377 | 0.333 | 2.65E-02 | 1 |
| P04040 | CAT | Catalase | 0.090 | 0.312 | 0.360 | 3.96E-02 | 2 |
| Q13228–4 | SELENBP1 | Isoform 4 of Selenium-binding protein 1 | 0.050 | 0.246 | 0.294 | 4.76E-02 | 2 |
| P00558 | PGK1 | Phosphoglycerate kinase 1 | 0.172 | 0.643 | 0.709 | 4.54E-04 | 2 |
| P48147 | PREP | Prolyl endopeptidase | 0.113 | 0.394 | 0.408 | 2.75E-03 | 2 |
| P07951–2 | TPM2 | Isoform 2 of Tropomyosin beta chain | 0.338 | 0.549 | 0.517 | 6.83E-03 | 2 |
| P07951 | TPM2 | Tropomyosin beta chain | 0.316 | 0.510 | 0.462 | 2.70E-02 | 2 |
| P06733 | ENO1 | Alpha-enolase | 0.112 | 0.262 | 0.340 | 1.81E-02 | 2 |
| P02144 | MB | Myoglobin | 0.790 | 1.939 | 1.506 | 2.03E-04 | 2 |
| P68082 | MB | Myoglobin | 0.710 | 1.970 | 1.533 | 5.12E-04 | 2 |
| P04406 | GAPDH | Glyceraldehyde-3-phosphate dehydrogenase | 0.141 | 0.729 | 0.729 | 2.22E-02 | 2 |
| P60174 | TPI1 | Triosephosphate isomerase | 0.345 | 1.067 | 0.893 | 8.03E-04 | 2 |
| P60174–4 | TPI1 | Isoform 4 of Triosephosphate isomerase | 0.327 | 1.110 | 0.923 | 1.17E-03 | 2 |
| P63104 | YWHAZ | 14–3-3 protein zeta/delta | 0.241 | 0.433 | 0.458 | 8.41E-03 | 2 |
| P31946–2 | YWHAB | Isoform Short of 14–3-3 protein beta/alpha | 0.157 | 0.388 | 0.313 | 3.94E-03 | 2 |
| Q04917 | YWHAH | 14–3-3 protein eta | 0.195 | 0.422 | 0.483 | 1.52E-03 | 2 |
| P27348 | YWHAQ | 14–3-3 protein theta | 0.156 | 0.368 | 0.394 | 9.83E-04 | 2 |
| P31947 | SFN | 14–3-3 protein sigma | 0.191 | 0.427 | 0.542 | 3.55E-04 | 2 |
| P28838 | LAP3 | Cytosol aminopeptidase | 0.166 | 0.562 | 0.633 | 2.12E-02 | 2 |
| E7EQ12 | CAST | Calpastatin | 0.153 | 0.434 | 0.554 | 2.26E-03 | 2 |
| P15259 | PGAM2 | Phosphoglycerate mutase 2 | 0.294 | 1.157 | 1.388 | 2.08E-04 | 2 |
| P61158 | ACTR3 | Actin-related protein 3 | 0.154 | 0.248 | 0.255 | 1.66E-02 | 2 |
| P05413 | FABP3 | Fatty acid-binding protein, heart | 0.615 | 1.831 | 1.851 | 1.13E-04 | 2 |
| P40926 | MDH2 | Malate dehydrogenase, mitochondrial | 0.747 | 1.976 | 1.374 | 1.21E-04 | 2 |
| Q5JRA6 | MIA3 | Melanoma inhibitory activity protein 3 | 0.308 | 0.506 | 0.443 | 6.73E-04 | 2 |
| P23526 | AHCY | Adenosylhomocysteinase | 0.182 | 0.477 | 0.435 | 1.93E-03 | 2 |
| P15121 | AKR1B1 | Aldose reductase | 0.276 | 1.009 | 0.778 | 8.03E-04 | 2 |
| P35237 | SERPINB6 | Serpin B6 | 0.050 | 0.225 | 0.204 | 1.08E-02 | 2 |
| Q5T4U5 | ACADM | Acyl-Coenzyme A dehydrogenase, C-4 to C-12 straight chain, isoform CRA a | 0.452 | 1.138 | 1.259 | 1.17E-03 | 2 |
| O15143 | ARPC1B | Actin-related protein 2/3 complex subunit 1B | 0.145 | 0.291 | 0.262 | 3.00E-02 | 2 |
| P07738 | BPGM | Bisphosphoglycerate mutase | 0.136 | 0.337 | 0.327 | 2.26E-02 | 2 |
| Q9HC38–2 | GLOD4 | Isoform 2 of Glyoxalase domain-containing protein 4 | 0.059 | 0.323 | 0.342 | 2.86E-02 | 2 |
| Q9HC38 | GLOD4 | Glyoxalase domain-containing protein 4 | 0.059 | 0.337 | 0.342 | 3.19E-02 | 2 |
| B7Z403 | GLOD4 | Glyoxalase domain-containing protein 4 | 0.066 | 0.324 | 0.329 | 3.00E-02 | 2 |
| P61160 | ACTR2 | Actin-related protein 2 | 0.149 | 0.248 | 0.276 | 2.15E-02 | 2 |
| P10768 | ESD | S-formylglutathione hydrolase | 0.141 | 0.550 | 0.610 | 1.23E-03 | 2 |
| Q8N142 | ADSSL1 | Adenylosuccinate synthetase isozyme 1 | 0.125 | 1.054 | 1.038 | 1.72E-02 | 2 |
| Q9UJ70 | NAGK | N-acetyl-d-glucosamine kinase | 0.048 | 0.261 | 0.202 | 2.65E-02 | 2 |
| P54727 | RAD23B | UV excision repair protein RAD23 homolog B | 0.102 | 0.299 | 0.389 | 2.26E-03 | 2 |
| P30086 | PEBP1 | Phosphatidylethanolamine-binding protein 1 | 0.256 | 0.877 | 0.553 | 5.07E-03 | 2 |
| Q99497 | PARK7 | Protein DJ-1 | 0.059 | 0.439 | 0.511 | 4.01E-03 | 2 |
| Q13011 | ECH1 | Delta(3,5)-Delta(2,4)-dienoyl-CoA isomerase, mitochondrial | 0.300 | 1.433 | 1.186 | 1.99E-03 | 2 |
| P00492 | HPRT1 | Hypoxanthine-guanine phosphoribosyltransferase | 0.123 | 0.355 | 0.365 | 1.06E-03 | 2 |
| Q32Q12 | NME1-NME2 | Nucleoside diphosphate kinase | 0.112 | 0.447 | 0.305 | 2.81E-03 | 2 |
| P15531–2 | NME1 | Isoform 2 of Nucleoside diphosphate kinase A | 0.114 | 0.430 | 0.359 | 2.75E-03 | 2 |
| F6XY72 | NME1-NME2 | Protein NME1-NME2 | 0.078 | 0.456 | 0.269 | 1.53E-03 | 2 |
| Q9UL46 | PSME2 | Proteasome activator complex subunit 2 | 0.106 | 0.316 | 0.342 | 4.57E-02 | 2 |
| Q16836–2 | HADH | Isoform 2 of Hydroxyacyl-coenzyme A dehydrogenase, mitochondrial | 0.542 | 1.898 | 1.485 | 2.03E-04 | 2 |
| Q13642–4 | FHL1 | Isoform 4 of Four and a half LIM domains protein 1 | 0.235 | 0.841 | 0.642 | 1.98E-04 | 2 |
| P62805 | HIST1H4A | Histone H4 | 0.631 | 1.166 | 1.441 | 7.14E-05 | 2 |
| Q8TDQ7 | GNPDA2 | Glucosamine-6-phosphate isomerase 2 | 0.097 | 0.234 | 0.291 | 1.57E-02 | 2 |
| P46926 | GNPDA1 | Glucosamine-6-phosphate isomerase 1 | 0.154 | 0.417 | 0.445 | 4.17E-03 | 2 |
| Q96DG6 | CMBL | Carboxymethylenebutenolidase homolog | 0.160 | 0.833 | 0.749 | 2.21E-02 | 2 |
| P59998 | ARPC4 | Actin-related protein 2/3 complex subunit 4 | 0.175 | 0.415 | 0.350 | 2.12E-02 | 2 |
| P00441 | SOD1 | Superoxide dismutase [Cu-Zn] | 0.168 | 0.629 | 0.448 | 2.12E-02 | 2 |
| P49247 | RPIA | Ribose-5-phosphate isomerase | 0.071 | 0.215 | 0.200 | 2.04E-02 | 2 |
| P02689 | PMP2 | Myelin P2 protein | 0.296 | 0.822 | 0.824 | 1.98E-02 | 2 |
| Q96C23 | GALM | Aldose 1-epimerase | 0.047 | 0.381 | 0.472 | 4.08E-02 | 2 |
| P29218 | IMPA1 | Inositol monophosphatase 1 | 0.174 | 0.679 | 0.874 | 8.74E-04 | 2 |
| P30042 | C21orf33 | ES1 protein homolog, mitochondrial | 0.409 | 1.330 | 1.248 | 1.11E-03 | 2 |
| Q15631 | TSN | Translin | 0.164 | 0.334 | 0.367 | 5.07E-03 | 2 |
| O00764 | PDXK | Pyridoxal kinase | 0.113 | 0.800 | 0.780 | 2.49E-02 | 2 |
| P63208 | SKP1 | S-phase kinase-associated protein 1 | 0.095 | 0.434 | 0.352 | 2.38E-02 | 2 |
| O15145 | ARPC3 | Actin-related protein 2/3 complex subunit 3 | 0.160 | 0.350 | 0.326 | 2.36E-02 | 2 |
| Q04760 | GLO1 | Lactoylglutathione lyase | 0.287 | 0.742 | 0.523 | 2.29E-03 | 2 |
| P06734 | FCER2 | Low affinity immunoglobulin epsilon Fc receptor | 0.130 | 0.184 | 0.188 | 4.45E-02 | 2 |
| P07108 | DBI | Acyl-CoA-binding protein | 0.221 | 0.688 | 0.523 | 1.18E-02 | 2 |
| P50461 | CSRP3 | Cysteine and glycine-rich protein 3 | 0.359 | 1.504 | 1.617 | 5.93E-05 | 2 |
| U3KQK0 | HIST1H2BN | Histone H2B | 0.522 | 1.251 | 1.556 | 2.06E-05 | 2 |
| P33778 | HIST1H2BB | Histone H2B type 1-B | 0.582 | 1.259 | 1.606 | 4.41E-05 | 2 |
| Q99880 | HIST1H2BL | Histone H2B type 1-L | 0.536 | 1.269 | 1.573 | 2.06E-05 | 2 |
| P30048 | PRDX3 | Thioredoxin-dependent peroxide reductase, mitochondrial | 0.085 | 0.882 | 1.013 | 7.43E-03 | 2 |
| O95861–2 | BPNT1 | Isoform 2 of 3′(2′),5′-bisphosphate nucleotidase 1 | 0.092 | 0.478 | 0.458 | 1.41E-03 | 2 |
| O75347 | TBCA | Tubulin-specific chaperone A | 0.020 | 0.296 | 0.261 | 4.86E-02 | 2 |
| P84243 | H3F3A | Histone H3.3 | 0.584 | 1.241 | 1.502 | 2.03E-04 | 2 |
| P68431 | HIST1H3A | Histone H3.1 | 0.570 | 1.181 | 1.411 | 5.93E-05 | 2 |
| Q71DI3 | HIST2H3A | Histone H3.2 | 0.648 | 1.256 | 1.506 | 2.08E-04 | 2 |
| Q5TEC6 | HIST2H3PS2 | Histone H3 | 0.467 | 1.084 | 1.322 | 7.20E-04 | 2 |
| P10644 | PRKAR1A | cAMP-dependent protein kinase type I-alpha regulatory subunit | 0.105 | 0.311 | 0.321 | 2.12E-02 | 2 |
| Q9NR45 | NANS | Sialic acid synthase | 0.106 | 0.312 | 0.388 | 1.61E-02 | 2 |
| Q9H0R4 | HDHD2 | Haloacid dehalogenase-like hydrolase domain-containing protein 2 | 0.179 | 0.619 | 0.773 | 5.11E-03 | 2 |
| P61970 | NUTF2 | Nuclear transport factor 2 | 0.044 | 0.343 | 0.218 | 3.53E-02 | 2 |
| Q9NVS9 | PNPO | Pyridoxine-5′-phosphate oxidase | 0.182 | 0.407 | 0.419 | 3.45E-02 | 2 |
| Q12765–2 | SCRN1 | Isoform 2 of Secernin-1 | 0.092 | 0.234 | 0.282 | 2.63E-02 | 2 |
| Q6FI13 | HIST2H2AA3 | Histone H2A type 2-A | 0.665 | 1.483 | 1.843 | 3.17E-04 | 2 |
| Q7L7L0 | HIST3H2A | Histone H2A type 3 | 0.667 | 1.497 | 1.843 | 2.99E-04 | 2 |
| P0C0S5 | H2AFZ | Histone H2A.Z | 0.799 | 1.522 | 1.934 | 2.79E-03 | 2 |
| P23297 | S100A1 | Protein S100-A1 | 0.977 | 1.678 | 1.967 | 6.15E-04 | 2 |
| O15511 | ARPC5 | Actin-related protein 2/3 complex subunit 5 | 0.209 | 0.283 | 0.324 | 2.76E-02 | 2 |
| P35754 | GLRX | Glutaredoxin-1 | 0.040 | 0.316 | 0.279 | 2.24E-03 | 2 |
| Q9NRX4 | PHPT1 | 14 kDa phosphohistidine phosphatase | 0.144 | 0.450 | 0.296 | 1.66E-02 | 2 |
| Q99729 | HNRNPAB | Heterogeneous nuclear ribonucleoprotein A/B | 0.117 | 0.240 | 0.264 | 3.18E-02 | 2 |
| Q14061 | COX17 | Cytochrome c oxidase copper chaperone | 0.858 | 1.712 | 1.342 | 2.08E-04 | 2 |
| Q7Z4H3 | HDDC2 | HD domain-containing protein 2 | 0.089 | 0.569 | 0.518 | 2.51E-03 | 2 |
| Q99471 | PFDN5 | Prefoldin subunit 5 | 0.265 | 0.605 | 0.500 | 4.92E-03 | 2 |
| P14621 | ACYP2 | Acylphosphatase-2 | 0.198 | 0.696 | 0.607 | 8.97E-03 | 2 |
| U3KQL2 | ACYP2 | Acylphosphatase-2 | 0.212 | 0.570 | 0.520 | 7.64E-03 | 2 |
| Q07507 | DPT | Dermatopontin | 0.454 | 0.749 | 0.654 | 2.27E-02 | 2 |
| B7Z4W5 | CCBL1 | Cysteine conjugate-beta lyase cytoplasmic (Glutamine transaminase K, kyneurenine aminotransferase), isoform CRA b | −0.037 | 0.687 | 0.810 | 3.24E-02 | 2 |
| Q9UHP9 | SMPX | Small muscular protein | 0.464 | 0.643 | 0.659 | 9.28E-03 | 2 |
| P07919 | UQCRH | Cytochrome b-c1 complex subunit 6, mitochondrial | 0.674 | 1.897 | 1.652 | 9.22E-03 | 2 |
| P49789 | FHIT | Bis(5′-adenosyl)-triphosphatase | 0.050 | 1.026 | 0.608 | 2.49E-02 | 2 |
| Q0VDG4 | SCRN3 | Secernin-3 | 0.246 | 0.433 | 0.566 | 2.79E-03 | 2 |
| Q86YS3 | RAB11FIP4 | Rab11 family-interacting protein 4 | 0.208 | 0.811 | 0.652 | 9.67E-03 | 2 |
| Q9ULP9 | TBC1D24 | TBC1 domain family member 24 | 0.060 | 0.602 | 0.722 | 5.95E-03 | 2 |
| Q9BPX5 | ARPC5L | Actin-related protein 2/3 complex subunit 5-like protein | 0.185 | 0.559 | 0.555 | 2.22E-02 | 2 |
| O14561 | NDUFAB1 | Acyl carrier protein, mitochondrial | 0.298 | 1.098 | 1.348 | 3.93E-03 | 2 |
| O75369–8 | FLNB | Isoform 8 of Filamin-B | 0.227 | 0.328 | 0.285 | 1.01E-03 | 3 |
| Q00610 | CLTC | Clathrin heavy chain 1 | 0.308 | 0.441 | 0.228 | 4.08E-02 | 3 |
| J3KN67 | TPM3 | Tropomyosin alpha-3 chain | 0.457 | 0.520 | 0.322 | 4.52E-02 | 3 |
| P06753–6 | TPM3 | Isoform 6 of Tropomyosin alpha-3 chain | 0.469 | 0.524 | 0.313 | 3.96E-02 | 3 |
| P06753–5 | TPM3 | Isoform 5 of Tropomyosin alpha-3 chain | 0.472 | 0.526 | 0.306 | 4.24E-02 | 3 |
| P48735 | IDH2 | Isocitrate dehydrogenase [NADP], mitochondrial | 0.874 | 2.055 | 0.978 | 2.16E-04 | 3 |
| P08670 | VIM | Vimentin | 0.261 | 0.356 | 0.236 | 4.92E-03 | 3 |
| P07196 | NEFL | Neurofilament light polypeptide | 0.203 | 0.324 | 0.246 | 2.50E-02 | 3 |
| Q96G03 | PGM2 | Phosphoglucomutase-2 | 0.121 | 0.358 | 0.078 | 3.00E-02 | 3 |
| Q06830 | PRDX1 | Peroxiredoxin-1 | 0.145 | 0.420 | 0.258 | 4.56E-02 | 3 |
| B1AVU8 | PSAP | Saposin-D | 0.162 | 0.191 | 0.094 | 5.99E-03 | 3 |
| P07602–3 | PSAP | Isoform Sap-mu-9 of Prosaposin | 0.164 | 0.212 | 0.095 | 5.11E-03 | 3 |
| P21709 | EPHA1 | Ephrin type-A receptor 1 | 0.182 | 0.277 | 0.121 | 4.30E-02 | 3 |
| Q16555 | DPYSL2 | Dihydropyrimidinase-related protein 2 | 0.104 | 0.181 | 0.075 | 4.27E-02 | 3 |
| Q14194–2 | CRMP1 | Isoform LCRMP-1 of Dihydropyrimidinase-related protein 1 | 0.151 | 0.277 | 0.125 | 3.45E-02 | 3 |
| P23284 | PPIB | Peptidyl-prolyl cis-trans isomerase B | 0.165 | 0.270 | 0.147 | 3.14E-02 | 3 |
| P08590 | MYL3 | Myosin light chain 3 | 1.198 | 1.510 | 0.843 | 1.81E-04 | 3 |
| P12829 | MYL4 | Myosin light chain 4 | 1.062 | 1.285 | 0.533 | 7.30E-03 | 3 |
| P07585 | DCN | Decorin | 0.556 | 0.760 | 0.456 | 2.03E-04 | 3 |
| P62937 | PPIA | Peptidyl-prolyl cis-trans isomerase A | 0.103 | 0.361 | 0.167 | 3.55E-03 | 3 |
| P62937–2 | PPIA | Isoform 2 of Peptidyl-prolyl cis-trans isomerase A | 0.089 | 0.344 | 0.145 | 7.81E-03 | 3 |
| Q9Y625 | GPC6 | Glypican-6 | 0.217 | 0.365 | 0.210 | 7.29E-03 | 3 |
| P21810 | BGN | Biglycan | 0.715 | 0.887 | 0.458 | 2.16E-04 | 3 |
| P62158 | CALM1 | Calmodulin | 0.231 | 0.435 | 0.161 | 7.64E-03 | 3 |
| P09211 | GSTP1 | Glutathione S-transferase P | 0.089 | 0.363 | 0.169 | 1.58E-02 | 3 |
| P19338 | NCL | Nucleolin | 0.281 | 0.481 | 0.380 | 2.21E-02 | 3 |
| Q9BRF8 | CPPED1 | Serine/threonine-protein phosphatase CPPED1 | 0.215 | 0.518 | 0.305 | 7.44E-03 | 3 |
| P03950 | ANG | Angiogenin | 0.166 | 0.318 | 0.166 | 3.53E-02 | 3 |
| Q9UBQ0 | VPS29 | Vacuolar protein sorting-associated protein 29 | 0.203 | 0.503 | 0.243 | 2.67E-02 | 3 |
| P12104 | FABP2 | Fatty acid-binding protein, intestinal | 0.265 | 0.438 | 0.092 | 9.69E-03 | 3 |
| Q9NQ30 | ESM1 | Endothelial cell-specific molecule 1 | 0.705 | 0.956 | 0.747 | 2.08E-04 | 3 |
| P50897 | PPT1 | Palmitoyl-protein thioesterase 1 | 0.153 | 0.373 | 0.088 | 4.45E-03 | 3 |
| P36543 | ATP6V1E1 | V-type proton ATPase subunit E 1 | 0.224 | 0.269 | 0.245 | 2.71E-02 | 3 |
| P30405 | PPIF | Peptidyl-prolyl cis-trans isomerase F, mitochondrial | 0.644 | 1.610 | 0.612 | 4.01E-03 | 3 |
| P20674 | COX5A | Cytochrome c oxidase subunit 5A, mitochondrial | 1.036 | 1.534 | 0.594 | 1.11E-02 | 3 |
| Q09028 | RBBP4 | Histone-binding protein RBBP4 | 0.317 | 0.671 | 0.315 | 4.27E-02 | 3 |
| P02585 | TNNC2 | Troponin C, skeletal muscle | 0.519 | 0.607 | 0.274 | 2.12E-02 | 3 |
| O43447 | PPIH | Peptidyl-prolyl cis-trans isomerase H | 0.125 | 0.359 | 0.195 | 2.12E-02 | 3 |
| Q96G01 | BICD1 | Protein bicaudal D homolog 1 | 0.332 | 0.427 | 0.331 | 2.65E-02 | 3 |
| O75380 | NDUFS6 | NADH dehydrogenase [ubiquinone] iron-sulfur protein 6, mitochondrial | 0.377 | 1.066 | 0.656 | 2.12E-02 | 3 |
| P18206 | VCL | Vinculin | 0.102 | 0.211 | 0.438 | 1.88E-03 | 4 |
| P26038 | MSN | Moesin | 0.065 | 0.168 | 0.264 | 1.26E-02 | 4 |
| P15311 | EZR | Ezrin | 0.026 | 0.203 | 0.443 | 1.11E-02 | 4 |
| P35241–5 | RDX | Isoform 5 of Radixin | 0.070 | 0.253 | 0.419 | 7.64E-03 | 4 |
| P11216 | PYGB | Glycogen phosphorylase, brain form | 0.133 | 0.469 | 0.791 | 4.01E-03 | 4 |
| P34932 | HSPA4 | Heat shock 70 kDa protein 4 | 0.039 | 0.126 | 0.297 | 1.02E-02 | 4 |
| P11142 | HSPA8 | Heat shock cognate 71 kDa protein | 0.111 | 0.419 | 0.729 | 2.58E-04 | 4 |
| P08107 | HSPA1A | Heat shock 70 kDa protein 1A/1B | 0.095 | 0.444 | 0.760 | 6.71E-04 | 4 |
| P17066 | HSPA6 | Heat shock 70 kDa protein 6 | 0.138 | 0.559 | 0.885 | 2.45E-04 | 4 |
| P14618–2 | PKM | Isoform M1 of Pyruvate kinase PKM | 0.075 | 0.401 | 0.910 | 2.03E-04 | 4 |
| P14618 | PKM | Pyruvate kinase PKM | 0.077 | 0.381 | 0.880 | 2.32E-04 | 4 |
| P06732 | CKM | Creatine kinase M-type | 0.260 | 1.108 | 1.827 | 5.93E-05 | 4 |
| P12277 | CKB | Creatine kinase B-type | 0.273 | 1.113 | 1.760 | 5.93E-05 | 4 |
| P31150 | GDI1 | Rab GDP dissociation inhibitor alpha | 0.065 | 0.159 | 0.257 | 7.26E-03 | 4 |
| P04075–2 | ALDOA | Isoform 2 of Fructose-bisphosphate aldolase A | −0.015 | 0.204 | 0.547 | 4.89E-04 | 4 |
| P09972 | ALDOC | Fructose-bisphosphate aldolase C | −0.019 | 0.128 | 0.527 | 5.42E-03 | 4 |
| P36871 | PGM1 | Phosphoglucomutase-1 | 0.086 | 0.581 | 1.139 | 8.28E-04 | 4 |
| P06744 | GPI | Glucose-6-phosphate isomerase | 0.221 | 0.859 | 1.331 | 4.88E-04 | 4 |
| P00338 | LDHA | l-lactate dehydrogenase A chain | 0.075 | 0.192 | 0.383 | 2.21E-02 | 4 |
| P07195 | LDHB | l-lactate dehydrogenase B chain | 0.051 | 0.243 | 0.694 | 7.48E-04 | 4 |
| P07864 | LDHC | l-lactate dehydrogenase C chain | 0.087 | 0.299 | 0.639 | 1.60E-03 | 4 |
| P52209 | PGD | 6-phosphogluconate dehydrogenase, decarboxylating | 0.083 | 0.269 | 0.385 | 1.78E-02 | 4 |
| Q6ZN40 | TPM1 | Tropomyosin 1 (Alpha), isoform CRA f | 0.321 | 0.642 | 0.940 | 2.57E-04 | 4 |
| H0YK48 | TPM1 | Tropomyosin alpha-1 chain | 0.325 | 0.614 | 0.892 | 1.93E-03 | 4 |
| P09493–4 | TPM1 | Isoform 4 of Tropomyosin alpha-1 chain | 0.313 | 0.616 | 0.894 | 1.78E-03 | 4 |
| P55786 | NPEPPS | Puromycin-sensitive aminopeptidase | 0.109 | 0.281 | 0.553 | 2.08E-04 | 4 |
| P55786–2 | NPEPPS | Isoform 2 of Puromycin-sensitive aminopeptidase | 0.107 | 0.278 | 0.557 | 2.16E-04 | 4 |
| A2A274 | ACO2 | Aconitate hydratase, mitochondrial | 0.021 | 0.497 | 1.364 | 2.79E-03 | 4 |
| P13929 | ENO3 | Beta-enolase | 0.173 | 0.641 | 0.974 | 2.43E-03 | 4 |
| P09104 | ENO2 | Gamma-enolase | 0.111 | 0.300 | 0.502 | 6.15E-04 | 4 |
| P17174 | GOT1 | Aspartate aminotransferase, cytoplasmic | −0.012 | 0.559 | 1.330 | 5.12E-04 | 4 |
| P02545 | LMNA | Prelamin-A/C | 0.096 | 0.254 | 0.410 | 3.43E-02 | 4 |
| P62258 | YWHAE | 14–3-3 protein epsilon | 0.183 | 0.504 | 0.751 | 5.12E-04 | 4 |
| P61981 | YWHAG | 14–3-3 protein gamma | 0.161 | 0.455 | 0.722 | 2.16E-04 | 4 |
| P40925–3 | MDH1 | Isoform 3 of Malate dehydrogenase, cytoplasmic | 0.101 | 1.045 | 1.823 | 1.14E-04 | 4 |
| P78417 | GSTO1 | Glutathione S-transferase omega-1 | 0.071 | 0.276 | 0.510 | 1.09E-02 | 4 |
| P20810–6 | CAST | Isoform 6 of Calpastatin | 0.123 | 0.401 | 0.550 | 3.24E-03 | 4 |
| P09622 | DLD | Dihydrolipoyl dehydrogenase, mitochondrial | 0.108 | 0.552 | 0.919 | 7.57E-03 | 4 |
| P42765 | ACAA2 | 3-ketoacyl-CoA thiolase, mitochondrial | 0.062 | 0.517 | 0.938 | 2.88E-02 | 4 |
| P18669 | PGAM1 | Phosphoglycerate mutase 1 | 0.162 | 0.710 | 1.002 | 1.27E-03 | 4 |
| P17540 | CKMT2 | Creatine kinase S-type, mitochondrial | 0.366 | 1.105 | 1.568 | 1.11E-04 | 4 |
| Q16881–5 | TXNRD1 | Isoform 5 of Thioredoxin reductase 1, cytoplasmic | 0.039 | 0.163 | 0.280 | 1.33E-02 | 4 |
| Q16881–3 | TXNRD1 | Isoform 3 of Thioredoxin reductase 1, cytoplasmic | 0.039 | 0.164 | 0.278 | 1.20E-02 | 4 |
| P99999 | CYCS | Cytochrome c | 0.058 | 0.964 | 1.780 | 2.16E-04 | 4 |
| Q15124 | PGM5 | Phosphoglucomutase-like protein 5 | 0.251 | 0.908 | 1.369 | 1.11E-04 | 4 |
| P31153 | MAT2A | S-adenosylmethionine synthase isoform type-2 | 0.055 | 0.188 | 0.460 | 3.64E-02 | 4 |
| P11766 | ADH5 | Alcohol dehydrogenase class-3 | 0.080 | 0.666 | 1.127 | 2.08E-04 | 4 |
| P25786–2 | PSMA1 | Isoform Long of Proteasome subunit alpha type-1 | 0.056 | 0.260 | 0.450 | 3.91E-02 | 4 |
| P16083 | NQO2 | Ribosyldihydronicotinamide dehydrogenase [quinone] | 0.051 | 0.229 | 0.459 | 3.35E-02 | 4 |
| O14818 | PSMA7 | Proteasome subunit alpha type-7 | 0.105 | 0.197 | 0.400 | 3.19E-02 | 4 |
| P21266 | GSTM3 | Glutathione S-transferase Mu 3 | 0.120 | 0.355 | 0.617 | 3.32E-04 | 4 |
| P28161 | GSTM2 | Glutathione S-transferase Mu 2 | 0.084 | 0.419 | 0.734 | 4.47E-03 | 4 |
| E9PHN7 | GSTM2 | Glutathione S-transferase Mu 2 | 0.094 | 0.404 | 0.736 | 5.74E-03 | 4 |
| P09488 | GSTM1 | Glutathione S-transferase Mu 1 | 0.126 | 0.335 | 0.679 | 1.01E-02 | 4 |
| Q03013 | GSTM4 | Glutathione S-transferase Mu 4 | 0.112 | 0.328 | 0.668 | 1.06E-02 | 4 |
| Q96CN7 | ISOC1 | Isochorismatase domain-containing protein 1 | 0.026 | 0.250 | 0.717 | 8.16E-03 | 4 |
| Q9NQW7–3 | XPNPEP1 | Isoform 3 of Xaa-Pro aminopeptidase 1 | 0.042 | 0.166 | 0.390 | 3.62E-03 | 4 |
| P49721 | PSMB2 | Proteasome subunit beta type-2 | 0.070 | 0.263 | 0.403 | 2.43E-02 | 4 |
| P46940 | IQGAP1 | Ras GTPase-activating-like protein IQGAP1 | 0.068 | 0.048 | 0.323 | 3.37E-02 | 4 |
| P25789 | PSMA4 | Proteasome subunit alpha type-4 | 0.084 | 0.265 | 0.508 | 3.49E-02 | 4 |
| H0YLC2 | PSMA4 | Proteasome subunit alpha type | 0.080 | 0.270 | 0.505 | 4.04E-02 | 4 |
| P62140 | PPP1CB | Serine/threonine-protein phosphatase PP1-beta catalytic subunit | 0.096 | 0.227 | 0.335 | 3.31E-03 | 4 |
| P62136 | PPP1CA | Serine/threonine-protein phosphatase PP1-alpha catalytic subunit | 0.089 | 0.188 | 0.311 | 1.12E-02 | 4 |
| P36873–2 | PPP1CC | Isoform Gamma-2 of Serine/threonine-protein phosphatase PP1-gamma catalytic subunit | 0.085 | 0.204 | 0.310 | 8.50E-03 | 4 |
| P55809 | OXCT1 | Succinyl-CoA:3-ketoacid coenzyme A transferase 1, mitochondrial | 0.023 | 0.106 | 0.812 | 2.61E-03 | 4 |
| P09417 | QDPR | Dihydropteridine reductase | 0.040 | 0.311 | 0.631 | 1.57E-02 | 4 |
| Q9ULA0 | DNPEP | Aspartyl aminopeptidase | 0.072 | 0.308 | 0.562 | 3.17E-04 | 4 |
| E7ETB3 | DNPEP | Aspartyl aminopeptidase | 0.066 | 0.311 | 0.577 | 3.89E-04 | 4 |
| P28074 | PSMB5 | Proteasome subunit beta type-5 | −0.031 | 0.157 | 0.372 | 4.54E-02 | 4 |
| Q9NZL9 | MAT2B | Methionine adenosyltransferase 2 subunit beta | 0.067 | 0.114 | 0.386 | 2.88E-02 | 4 |
| P41250 | GARS | Glycine–tRNA ligase | 0.053 | 0.179 | 0.302 | 2.49E-02 | 4 |
| P55083–2 | MFAP4 | Isoform 2 of Microfibril-associated glycoprotein 4 | 0.111 | 0.215 | 0.350 | 1.56E-02 | 4 |
| Q5JSH3 | WDR44 | WD repeat-containing protein 44 | 0.062 | 0.151 | 0.284 | 3.70E-02 | 4 |
| Q8NCW5 | APOA1BP | NAD(P)H-hydrate epimerase | 0.044 | 0.290 | 0.642 | 1.56E-03 | 4 |
| Q9Y3B8–3 | REXO2 | Isoform 3 of Oligoribonuclease, mitochondrial | 0.046 | 0.700 | 0.940 | 2.42E-03 | 4 |
| P30046 | DDT | d-dopachrome decarboxylase | 0.074 | 0.426 | 0.695 | 4.26E-02 | 4 |
| Q8IW45 | CARKD | ATP-dependent (S)-NAD(P)H-hydrate dehydratase | 0.030 | 0.340 | 0.645 | 3.78E-02 | 4 |
| P53041 | PPP5C | Serine/threonine-protein phosphatase 5 | 0.116 | 0.323 | 0.673 | 1.97E-03 | 4 |
| P26022 | PTX3 | Pentraxin-related protein PTX3 | 0.122 | 0.501 | 0.762 | 4.79E-04 | 4 |
| P34949 | MPI | Mannose-6-phosphate isomerase | 0.188 | 0.345 | 0.662 | 5.52E-04 | 4 |
| Q06124 | PTPN11 | Tyrosine-protein phosphatase non-receptor type 11 | −0.047 | 0.143 | 0.297 | 3.00E-02 | 4 |
| Q96HC4–6 | PDLIM5 | Isoform 6 of PDZ and LIM domain protein 5 | 0.090 | 0.340 | 0.518 | 2.65E-02 | 4 |
| Q96HC4 | PDLIM5 | PDZ and LIM domain protein 5 | 0.116 | 0.245 | 0.419 | 4.08E-02 | 4 |
| O75390 | CS | Citrate synthase, mitochondrial | 0.004 | 0.325 | 1.456 | 5.12E-04 | 4 |
| P61457 | PCBD1 | Pterin-4-alpha-carbinolamine dehydratase | 0.156 | 0.408 | 1.044 | 1.71E-02 | 4 |
| P28070 | PSMB4 | Proteasome subunit beta type-4 | 0.138 | 0.213 | 0.364 | 6.68E-03 | 4 |
| J3QL71 | SCRN2 | Secernin-2 | 0.036 | 0.146 | 0.327 | 1.66E-02 | 4 |
| O95817 | BAG3 | BAG family molecular chaperone regulator 3 | 0.118 | 0.346 | 0.513 | 1.45E-02 | 4 |
| P45379 | TNNT2 | Troponin T, cardiac muscle | −0.067 | 0.432 | 1.743 | 5.07E-03 | 4 |
| K7ER74 | APOC4-APOC2 | Protein APOC4-APOC2 | −0.879 | −0.574 | 0.495 | 1.56E-03 | 4 |
| P55056 | APOC4 | Apolipoprotein C-IV | −0.517 | −0.231 | 0.336 | 4.73E-02 | 4 |
| P61601 | NCALD | Neurocalcin-delta | 0.028 | 0.181 | 0.241 | 3.17E-02 | 4 |
| P63316 | TNNC1 | Troponin C, slow skeletal and cardiac muscles | 0.320 | 0.370 | 1.313 | 2.19E-03 | 4 |
| Q6ICJ4 | Em:AP000351.3 | Em:AP000351.3 protein | −0.062 | 0.398 | 0.893 | 4.61E-02 | 4 |
| O75367 | H2AFY | Core histone macro-H2A.1 | 0.220 | 0.354 | 0.711 | 3.44E-02 | 4 |
| O75112 | LDB3 | LIM domain-binding protein 3 | 0.035 | 0.269 | 0.616 | 1.94E-02 | 4 |
| Q96GD0 | PDXP | Pyridoxal phosphate phosphatase | 0.144 | 0.171 | 0.363 | 2.81E-02 | 4 |
| Q99598 | TSNAX | Translin-associated protein X | 0.129 | 0.200 | 0.362 | 4.27E-02 | 4 |
| P46976 | GYG1 | Glycogenin-1 | −0.036 | 0.440 | 0.724 | 2.42E-02 | 4 |
| Q8WZA9 | IRGQ | Immunity-related GTPase family Q protein | 0.101 | 0.187 | 0.540 | 3.00E-02 | 4 |
| P49748–3 | ACADVL | Isoform 3 of Very long-chain specific acyl-CoA dehydrogenase, mitochondrial | −0.156 | 0.874 | 2.159 | 1.69E-02 | 4 |
| Q14896 | MYBPC3 | Myosin-binding protein C, cardiac-type | −0.092 | 0.140 | 0.719 | 4.59E-02 | 4 |
| P38646 | HSPA9 | Stress-70 protein, mitochondrial | 0.109 | 0.507 | 0.821 | 6.15E-04 | 4 |
| P19429 | TNNI3 | Troponin I, cardiac muscle | −0.189 | 0.265 | 1.725 | 2.19E-02 | 4 |
| P22888 | LHCGR | Lutropin-choriogonadotropic hormone receptor | 0.077 | 0.642 | 1.124 | 1.21E-02 | 4 |
| Q5TZA2 | CROCC | Rootletin | −0.022 | 0.159 | 0.623 | 1.67E-02 | 4 |
| Q5TZA2–2 | CROCC | Isoform 2 of Rootletin | −0.048 | 0.170 | 0.634 | 1.12E-02 | 4 |
| Q13356–2 | PPIL2 | Isoform 2 of Peptidyl-prolyl cis-trans isomerase-like 2 | 0.037 | 0.114 | 0.556 | 3.72E-02 | 4 |
| Q9H7B2 | RPF2 | Ribosome production factor 2 homolog | 0.500 | 0.247 | 1.091 | 3.19E-02 | 4 |
| Q07954 | LRP1 | Prolow-density lipoprotein receptor-related protein 1 | −0.120 | −0.155 | −0.161 | 3.00E-02 | 5 |
| P04114 | APOB | Apolipoprotein B-100 | −0.537 | −0.583 | −0.071 | 2.35E-02 | 5 |
| P01009 | SERPINA1 | Alpha-1-antitrypsin | −0.583 | −0.591 | −0.193 | 4.61E-02 | 5 |
| P49747 | COMP | Cartilage oligomeric matrix protein | −0.084 | −0.101 | −0.181 | 4.57E-02 | 5 |
| P03952 | KLKB1 | Plasma kallikrein | −0.555 | −0.618 | −0.660 | 3.29E-02 | 5 |
| P01871 | IGHM | Ig mu chain C region | −0.185 | −0.195 | −0.062 | 2.34E-02 | 5 |
| P04220 | Ig mu heavy chain disease protein | −0.181 | −0.177 | −0.059 | 1.72E-02 | 5 | |
| Q12805 | EFEMP1 | EGF-containing fibulin-like extracellular matrix protein 1 | −0.410 | −0.393 | −0.457 | 1.39E-02 | 5 |
| Q12805–5 | EFEMP1 | Isoform 5 of EGF-containing fibulin-like extracellular matrix protein 1 | −0.416 | −0.415 | −0.460 | 1.63E-02 | 5 |
| O75197 | LRP5 | Low-density lipoprotein receptor-related protein 5 | −0.157 | −0.231 | −0.204 | 3.91E-02 | 5 |
| P04083 | ANXA1 | Annexin A1 | −0.349 | −0.348 | −0.335 | 1.11E-03 | 5 |
| Q86U17 | SERPINA11 | Serpin A11 | −0.215 | −0.160 | −0.350 | 2.28E-02 | 5 |
| P18428 | LBP | Lipopolysaccharide-binding protein | −0.348 | −0.504 | −0.476 | 3.13E-02 | 5 |
| Q96CX2 | KCTD12 | BTB/POZ domain-containing protein KCTD12 | −0.076 | −0.116 | −0.274 | 3.18E-02 | 5 |
| Q9BXD5 | NPL | N-acetylneuraminate lyase | −0.144 | −0.286 | −0.279 | 1.37E-02 | 5 |
| Q6V0I7 | FAT4 | Protocadherin Fat 4 | −0.106 | −0.231 | −0.236 | 4.32E-02 | 5 |
| P14222 | PRF1 | Perforin-1 | −0.130 | −0.182 | −0.248 | 1.88E-03 | 5 |
| O15240 | VGF | Neurosecretory protein VGF | −0.119 | −0.325 | −0.174 | 4.45E-02 | 5 |
| Q96MU8–2 | KREMEN1 | Isoform 2 of Kremen protein 1 | −0.209 | −0.246 | −0.193 | 7.30E-03 | 5 |
| P09525 | ANXA4 | Annexin A4 | −0.330 | −0.442 | −0.094 | 1.02E-02 | 5 |
| P08236 | GUSB | Beta-glucuronidase | −0.421 | −0.437 | −0.199 | 1.86E-02 | 5 |
| B0YIW2 | APOC3 | Apolipoprotein C-III | −1.089 | −1.115 | −0.405 | 1.74E-02 | 5 |
| Q5SPY9 | NPDC1 | Neural proliferation differentiation and control protein 1 | −0.111 | −0.263 | −0.298 | 5.67E-03 | 5 |
| P04211 | Ig lambda chain V region 4A | −1.026 | −0.813 | −0.730 | 1.71E-02 | 5 | |
| Q92794 | KAT6A | Histone acetyltransferase KAT6A | −0.490 | −0.595 | −0.047 | 3.68E-02 | 5 |
| Q8N201 | INTS1 | Integrator complex subunit 1 | −0.254 | −0.328 | −0.314 | 1.02E-02 | 5 |
| Q2WGJ9 | FER1L6 | Fer-1-like protein 6 | −0.474 | −0.314 | −0.124 | 2.65E-02 | 5 |
| P54707–2 | ATP12A | Isoform 2 of Potassium-transporting ATPase alpha chain 2 | −0.253 | −0.424 | −0.252 | 8.50E-03 | 5 |
| Q5VT52 | RPRD2 | Regulation of nuclear pre-mRNA domain-containing protein 2 | −0.430 | −0.601 | −0.434 | 1.76E-03 | 5 |
| Q9UNN5 | FAF1 | FAS-associated factor 1 | −0.882 | −0.640 | −0.230 | 1.21E-02 | 5 |
| Q8TE49–2 | OTUD7A | Isoform 2 of OTU domain-containing protein 7A | −1.744 | −1.530 | −1.217 | 3.78E-03 | 5 |
| O15072 | ADAMTS3 | A disintegrin and metalloproteinase with thrombospondin motifs 3 | −0.110 | −0.098 | −0.487 | 2.04E-02 | 5 |
| Q6B0I6 | KDM4D | Lysine-specific demethylase 4D | −1.120 | −0.693 | −0.551 | 4.60E-02 | 5 |
| Q9NUL3 | STAU2 | Double-stranded RNA-binding protein Staufen homolog 2 | −0.232 | −0.548 | −0.574 | 2.08E-02 | 5 |
| J3KPX5 | DNA2 | DNA replication ATP-dependent helicase/nuclease DNA2 | −0.266 | −0.167 | −0.109 | 4.91E-02 | 5 |
| Q6P2E9 | EDC4 | Enhancer of mRNA-decapping protein 4 | −0.318 | −0.410 | −0.065 | 3.64E-02 | 5 |
| Q15761 | NPY5R | Neuropeptide Y receptor type 5 | −0.191 | −0.544 | −0.531 | 4.66E-02 | 5 |
| Q9Y6Y0 | IVNS1ABP | Influenza virus NS1A-binding protein | −0.116 | −0.356 | −0.104 | 4.48E-02 | 5 |
| P09493–6 | TPM1 | Isoform 6 of Tropomyosin alpha-1 chain | 0.335 | 0.635 | 0.906 | 6.15E-04 | NA |
| E7EVY3 | CAST | Calpastatin | 0.129 | 0.405 | 0.536 | 4.11E-03 | NA |
| Q99983 | OMD | Osteomodulin | 0.067 | 0.139 | 0.196 | 1.15E-02 | NA |
| Q9Y5Z4 | HEBP2 | Heme-binding protein 2 | 0.110 | 0.481 | 0.277 | 4.26E-02 | NA |
| P49354 | FNTA | Protein farnesyltransferase/geranylgeranyltransferase type-1 subunit alpha | 0.044 | 0.255 | 0.330 | 2.71E-02 | NA |
| P31040 | SDHA | Succinate dehydrogenase [ubiquinone] flavoprotein subunit, mitochondrial | 0.093 | 1.056 | 1.311 | 9.41E-03 | NA |
| P61224 | RAP1B | Ras-related protein Rap-1b | 0.294 | 0.361 | 0.363 | 2.96E-02 | NA |
| P14174 | MIF | Macrophage migration inhibitory factor | 0.265 | 0.779 | 0.499 | 3.94E-03 | NA |
| Q15843 | NEDD8 | NEDD8 | 0.039 | 0.200 | 0.258 | 2.79E-03 | NA |
| O94913 | PCF11 | Pre-mRNA cleavage complex 2 protein Pcf11 | 0.209 | 0.141 | 0.210 | 2.61E-03 | NA |
a Benjamini-Hochberg corrected p values are reported.
b 323 out of 333 regulated proteins were clustered into 5 distinct clusters using Fuzzy C-means clustering. Proteins were assigned into clusters using membership value of > 0.7. Proteins with a membership value in between 0.5 and 0.7 weren't assigned to any cluster and marked as NA.
Fuzzy c-means clustering of the 333 regulated proteins revealed five distinct clusters comprised of 323 of the proteins (Fig. 4, Table I). Cluster 1 represents those proteins that peak at 10 min post-injury. Cluster 2 consists of proteins that continue to increase from 10 min to 1 h and then plateau, whereas cluster 3 consists of those proteins that begin to decline after 1 h. Proteins that rise continuously throughout the time course comprise cluster 4, and those proteins that decline after injury are represented by cluster 5. Clustering in the present study recapitulates the temporal behavior of regulated proteins observed in our previous study (4), such as ACLP1 and PF4V1 peaking at 10 min (cluster 1), and FHL1 and MYL3 rising more slowly (clusters 2 and 3). Troponins showed the expected temporal profiles, with TNNT2, TNNI3, and TNNC1 belonging to cluster 4 and showing continuously increasing levels up to the 4 h time point. The vast majority of differential regulated proteins identified are candidate markers for early myocardial injury, showing elevation at 10 min that persists until at least 60 min after injury. Using the list of regulated proteins sorted by the cluster number we generated a heat map to investigate protein changes at individual patient level (supplemental Fig. S4). Importantly, consistent changes are observed for most of the proteins across the different time points and patients, suggesting (despite small sample numbers) that candidate markers may be uniform across the population.
iTRAQ Can Provide Highly Reproducible Quantification in Plasma Despite Ratio Compression
To assess the reproducibility of iTRAQ quantification as well as the extent of ratio compression we spiked heavy-labeled synthetic peptides at different concentrations into 4 iTRAQ channels corresponding to the four time point samples of PMI patients prior to iTRAQ labeling. An amount predicted to be at the detection threshold was spiked into the first channel, with the remaining channels were spiked with relative ratios of 2:1, 5:1, and 10:1. Results from 97 synthetic peptides are summarized in supplemental Fig. S5. Median iTRAQ ratios were compressed up to 50% in depleted plasma versus theoretical values, with compression being nonlinear; there was increased relative compression at higher relative ratios, consistent with prior studies in cell lysates (28, 29). We also assessed the reproducibility of quantification incorporating iTRAQ labeling using the data from 97 peptides. This was accomplished by performing the 4-channel spike-in experiment (described above) in replicate using the four different time point samples from each of 3 different patients. The median CVs ranged from 16 to 24% for the 3 different peptide spike level ratios tested.
Further Increases in Multiplexing of Plasma Analysis can be Successfully Achieved Using TMT-Labeling
Next, we tested whether TMT isobaric labeling reagents could further enhance throughput for discovery proteomics in plasma. Pooled normal plasma from a commercial source (BioreclamationIVT, Baltimore, MD) was depleted and digested as described. The total amount of digested plasma protein used in each labeling plex was kept constant at 360 μg; that amount was divided by 4, 6, or 10 (i.e. 80 μg, 53.3 μg, and 32 μg) for each labeling channel of iTRAQ four-plex, TMT six-plex and TMT ten-plex, respectively. All reporter ion channels contained equal amounts of the same plasma sample within an experiment to allow an unbiased assessment of total protein and peptide level coverage. The number of distinct peptides decreased by ∼17% in both TMT six-plex and ten-plex experiments relative to the iTRAQ four-plex experiment (supplemental Fig. S6). Only 9% fewer proteins were detected in the TMT six-plex study and 17% fewer were detected in theTMT ten-plex experiment as compared with the iTRAQ four-plex experiment. These results indicate that even ten-plex analyses can be leveraged for higher throughput for biomarker discovery studies in plasma without significant loss in sensitivity. Furthermore, results from spiked in heavy labeled synthetic peptides indicate that ratio compression of TMT is similar to that of iTRAQ (supplemental Fig. S7).
iTRAQ-based Quantification of Proteins Correlates Well With MRM-MS Results
We developed a 23-plex immunoMRM (iMRM) assay (see “Methods”) to quantify both known biomarkers of cardiac disease such as TNNI3 and novel candidate proteins that were prioritized for verification based on results from our earlier study (4) (Table II). Although most of these novel candidate proteins were in the up-regulated list from the current iTRAQ-based discovery study, some did not appear to be regulated based on iTRAQ quantification. To verify the discovery results and determine the correlation of iTRAQ quantification with a “gold standard” targeted approach, we applied the iMRM assay to 12 plasma samples from three patient time series experiments used in iTRAQ discovery. Each of the baseline, 10min, 1 h, and 4 h time point samples was analyzed in full process triplicate for all three patients (i.e. 36 samples, total). Fig. 5 shows the temporal trends observed in iTRAQ and iMRM experiments for selected proteins. The observed trends in abundance over the time course are the same by both quantification strategies for all three patients analyzed, although, as expected, the measured ratios are compressed in iTRAQ relative to iMRM. For example, levels for ACLP1 rise sharply at the 10min time point and decline thereafter with both the iTRAQ and iMRM workflows (Fig. 5A) whereas levels of FHL1 protein increase steadily to the 1 h time point and despite some decline remain elevated above baseline at the 4 h time point (Fig. 5B). FSTL1 (Fig. 5C) is an example of a protein thought to be regulated based on our earlier label free discovery experiments, but appears to be invariant over time after injury based on both iTRAQ and iMRM. supplemental Table S8 shows iMRM results for all of the proteins across the three patients analyzed.
Table II. List of proteins and peptides in the 23-plex immunoMRM assay.
| Gene name | Protein name | Peptides |
|---|---|---|
| TNNI3 | Troponin I | NITEIADLTQK |
| IL 33 | Interleukin-33 | TDPGVFIGVK |
| VLLSYYESQHPSNESGDGVDGK | ||
| ACLP | Aortic carboxypeptidase-like protein 1 | ILNPGEYR |
| DTPVLSELPEPVVAR | ||
| FHL1 | Four and a half LIM domains 1 isoform 5 | AIVAGDQNVEYK |
| NPITGFGK | ||
| MYL3 | Myosin light chain 3 | AAPAPAPPPEPERPK |
| ALGQNPTQAEVLR | ||
| HVLATLGER | ||
| TPM1 | Isoform 4 of Tropomyosin alpha-1 chain | SIDDLEDELYAQK |
| LVIIESDLER | ||
| HIAEDADR | ||
| ITGB1 | Isoform Beta-1C of Integrin beta-1 | GEVFNELVGK |
| TAGLN2 | Transgelin-2 | ENFQNWLK |
| TAGLN1 | Transgelin-1 | AAEDYGVIK |
| FGL2 | Fibroleukin | ELESEVNK |
| EEINVLHGR | ||
| SCUBE2 | Signal peptide, CUB and EGF-like domain-containing protein 2 | GSVACECRPGFELAK |
| FSTL1 | Follistatin-related protein 1 | IQVDYDGHCK |
| LDSSEFLK | ||
| SPON1 | Spondin-1 | VEGDPDFYKPGTSYR |
| AQWPAWQPLNVR |
Fig. 5.
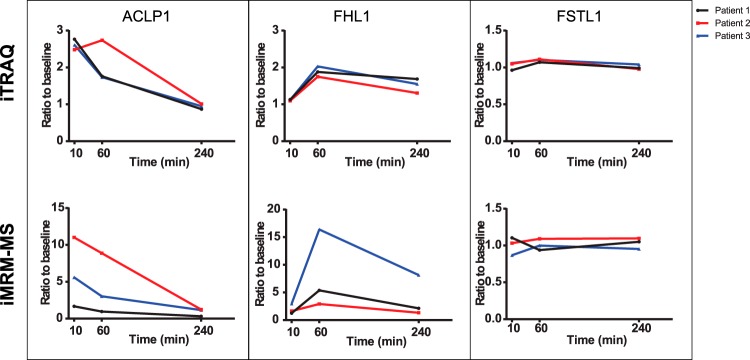
Correlation of iTRAQ discovery results with verification by iMRM. Line plots show change over the time course for ACLP1 (A), FHL1 (B) and FSTL1 (C) as observed in iTRAQ discovery (top panel) and in iMRM verification (bottom panel) experiments for 3 out of the 4 PMI patients shown in black, red, and blue colors. For iTRAQ plots used normalized median protein ratio at 10min/BL, 1 h/BL and 4 h/BL for ACLP1, FHL1 and FSTL1. For iMRM plots ratios were obtained using peptide concentrations calculated for baseline, 10min, 1 h, and 4 h based on light to heavy peptide ratios observed for DTPVLSELPEPVVAR (ACLP1), AIVAGDQNVEYK (FHL1), and IQVDYDGHCK (FSTL1) peptides.
DISCUSSION
Biomarker discovery approaches using MS-based proteomics have suffered from a lack of throughput, detection sensitivity, and quantitative precision that contributes to both false positive and false negative results. Particularly in plasma proteomics, where the objective of deep profiling for candidate discovery is challenged by the dynamic range and complexity of the matrix, extensive sample fractionation has also increased noise and decreased throughput. We have developed a comprehensive workflow for discovery proteomics in plasma that leverages isobaric labeling strategies, intensive depletion of abundant plasma proteins, optimized fractionation methods, improved reversed-phase column characteristics, and latest generation MS instrumentation to address these collective shortcomings.
The ability to increase sample analysis throughput is critically important for biomarker discovery experiments. In even the most carefully designed experimental and sample-selection strategies, biological variability because of both human and disease heterogeneity introduces noise that has a deleterious impact on candidate discovery. This contributes to lists of differential proteins that do not generalize, hence biomarker candidates that cannot be verified. This is made worse by the mismatch between high data dimensionality and low sample number that is characteristic of most transcriptome- and proteome-scale experiments and increases rates of false positive discovery. These problems are most directly addressed by increasing the number of samples analyzed, a strategy impeded by limitations in cost and throughput. Relative to transcriptional profiling, proteomics is further complicated by the need for sample enrichment and fractionation (often extensive) to enable sensitive detection of lower abundance proteins, which, in turn, further decreases throughput. The improvement in throughput we have achieved relative to “conventional” label-free approaches to deep discovery in plasma is dramatic. The six- to nine-fold improvement in throughput we have demonstrated using iTRAQ four-plex, while not a complete solution, represents substantial progress toward ameliorating the problem. In addition, our preliminary results using six-plex and ten-plex TMT reagents for labeling of plasma demonstrates that even further increases in analysis throughput are possible through higher multiplexing. These improvements in throughput derive from parallel downstream processing of a multiplexed samples, use of offline basic RP chromatography with concatenation of fractions prior to LC-MS/MS and use of nano-columns packed with sub-2 μm particle packing for online LC-MS/MS. Relative to our prior, label-free study (4), we estimate that 60% of the improvement in efficiency is because of the use of iTRAQ four-plex labeling which reduced on-instrument time by 75%. The remaining 40% of improvement derives from combined use of optimized off-line, basic reversed phase fractionation at high pH, optimized on-line nano-flow chromatography with heated columns packed with sub-2 μm packing, and much faster instrumentation (Q-Exactive). These factors together enabled reduction of the number of fractions requiring analysis from 80 to just 30. As a result, analyses that previously took one month with dedicated instrumentation are now being completed in 5 days using the four-plex reagent, and will be further reduced using the higher-plex reagents.
The chief cost drivers in most deep proteomics experiments employing fractionation prior to LC-MS/MS is instrument time and human labor for sample processing and data analysis. Although elements of our revised protocol (such as the use of isobaric labels and conversion to a tandem depletion strategy) add incremental cost to sample preparation, we estimate that total per-sample analysis cost was actually reduced by ∼three-fold because of decreases in all four of the cost drivers identified above. Although label-free quantification methods continue to evolve and improve as a result of faster instrumentation and improved analysis algorithms (for example, see (30)), these experiments have higher cost because individual samples/fractions need to be analyzed in multiple replicate to ensure adequate statistical power. A disadvantage of the isobaric labeling approaches is that it is more difficult to derive a semi-quantitative estimate of absolute abundance in the sample. However, as the main objective of most proteomics discovery experiments is to assess relative changes in abundance across samples, we think that the positive attributes obtained with isobaric labeling outweigh this factor.
Increased throughput in proteomics experiments often comes at the cost of decreased sensitivity. However, as demonstrated, our approach couples substantial improvements in throughput with almost five-fold improvement in coverage of the plasma proteome compared with our prior workflow. The methods we used in our prior cardiovascular discovery (4), consistent with the state of the art at the time, yielded 900 or fewer confident protein identifications per sample (requiring two peptides/protein for identification). The iTRAQ four-plex workflow described here identified an average of 4641 proteins in each of 16 plasma samples with two or more distinct peptides per protein. Nearly 3400 proteins were detected and quantified in all patient samples. This comparison used the same type of samples collected by the same institutions using a similar experimental and sample processing paradigm, as well as from head-to-head comparisons using a subset of identical samples.
Recently, Farrah and colleagues reported a set of 3553 high confidence plasma proteins (31) compiled after reanalysis of multiple high quality plasma proteomic datasets from multiple published sources using their centralized data processing workflow. In their analysis, 2568 of those 3553 proteins were detected by two or more peptide. We compared our list of 5304 proteins identified with two or more peptides with their list of proteins meeting the same criterion (supplemental Table S6, supplemental Fig. S1C). More than 85% of the proteins on their list were detected and quantified in our study. Moreover, half of the additional 982 proteins they included based on detection of only a single peptide were observed and quantified in our study by two or more peptides. Importantly, over half of the 5304 proteins confidently identified in our experiments are not included in the set published by Farrah and colleagues. Thus in four four-plex experiments we recapitulated and substantially surpassed the plasma proteomic characterization achieved by the union of multiple published plasma proteomes (31), or in any individual study published to date (for a recent review, see (32)). Proteins robustly identified in the Farrah dataset but not in ours included a few immunoglobulins and keratins that were either purposefully removed from our samples by immunoaffinity depletion or were not present in the database we used for searching.
Given the general perception that disease-specific markers, shed, secreted or leaked from affected tissue and massively diluted into the systemic circulation, are likely to be at low abundance in plasma (33), such increases in coverage seem very likely to be advantageous in biomarker discovery. Importantly, although in many discovery contexts the specific functional importance of improved depth of detection remains conjectural, here the proteins detected and quantified at the lower abundance levels include cardiac troponins I and T, established markers of myocardial injury of preeminent importance in the diagnosis and management of myocardial injury (34). Robust identification and measurement of these critical plasma biomarkers was barely evident in our earlier analyses; the new data provides a concrete demonstration of the utility of deep coverage.
Multiple components of our revised workflow contribute to improved detection and quantification of low abundance plasma proteins. For example, troponins were not identified until a second stage of depletion using Supermix was employed. The impact of tandem depletion was readily apparent in our global proteomic results. Total proteins we identified and quantified across three out of four iTRAQ experiments using IgY14/Supermix depletion represent a two-fold increase over the number of proteins quantified with a workflow identical except for use of IgY14 depletion alone. This augmentation of protein coverage by Supermix depletion exceeds that reported in the literature (21), likely because of the advantages of faster instrumentation and a globally more sensitive workflow. Analyzing the “depletate” from both depletion methods, although not currently practical given the added cost and time, is likely to further increase the number of proteins detected.
The present study also resulted in the identification of 333 regulated proteins across the four PMI patient samples. The majority of these candidate markers were elevated at 10 min post-ablation, and persisted for at least 60 min following injury. Sixty five percent of the candidates rise early and persist up to at least 4 h (clusters 2 and 4). This temporal profile is desirable for markers of myocardial injury. The new list of candidate biomarker proteins we identified to be regulated using iTRAQ includes 32 of the 52 proteins verified in our prior label-free study (4), as well as over 300 new candidates. Fifteen out of the remaining 20 proteins were detected and quantified in the current study, but were not observed to be regulated. Two of those proteins (FSTL1, SCUBE1) were analyzed by iMRM in the present study and shown to not be regulated, consistent with the iTRAQ results.
A central reason for our incorporation of isobaric labeling into the workflow was the potential to improve the precision of relative quantification in biomarker discovery relative to label-free approaches. Here we demonstrated that the reproducibility of quantification using iTRAQ, including all sources of variability introduced by the multidimensional sample processing strategy illustrated in Fig. 1, ranged from 16 to 24% (median CV). This level of reproducibility is only slightly lower than that routinely achieved in MRM-MS and iMRM-MS candidate biomarker verification studies (see (35, 36) and references therein). Although ultimately the most important measure of the utility of isobaric labeling will be demonstration of improved ability to identify functional biomarkers, a relevant surrogate is demonstration that results consistently reflect differential trends established by a “gold standard” quantification method. In MS-based proteomics, stable isotope dilution multiple reaction monitoring MS has emerged as the preferred method for targeted, quantitatively precise measurement of analytes in complex matrices (36). The 23 proteins quantified by iTRAQ in the context of the full discovery datasets exhibited good correlation with the iMRM-MS data that was obtained using stable isotope labeled peptides for quantification. Importantly, a subset of the proteins that we had observed to change in abundance in prior label-free experiments in a parallel set of patient samples were not observed to change using either iTRAQ or iMRM. These results further support that the quantitative precision obtainable using isobaric labeling in a discovery setting reflect real differences in the samples analyzed and form a more reliable basis on which to decide whether to configure more quantitative assays for, be they MS-based or Ab-based.
Compression of ratios is a well-known phenomenon with isobaric labeling (29, 37, 38). It is caused by co-isolation and fragmentation of iTRAQ-labeled peptide precursors, resulting in mass-tag ions from unrelated peptides merging and the respective sources being indistinguishable. In the discovery experiments, the iTRAQ ratios for spiked heavy peptides were compressed up to two-fold in depleted plasma versus theoretical. Interestingly, the larger the actual fold difference the larger the extent of compression observed. This effect was also observed in the iMRM versus iTRAQ ratio comparisons where, for the most extreme case (Fig. 5, FHLI, patient 3), a ca. sixfold change in abundance measured by iMRM was observed as only a twofold change by iTRAQ. The smallest known differentials evaluated in the present study were two-fold differences for all of the 97 spiked heavy peptides. The median observed difference in the iTRAQ data for this set of peptides was 1.67, close to theoretical. Although false negatives could occur in isobaric labeling experiments, especially for proteins undergoing small changes in abundance, we have no evidence for them in the present study.
The results presented here provide clear demonstration of the value of using isobaric mass tag reagents in plasma-based biomarker discovery experiments to increase sample analysis throughput while providing very high sensitivity of analysis, and to derive high confidence lists of regulated proteins. We have leveraged human “perturbational” experiments in which each person serves as their own biologic control across a series of time points. This experimental paradigm enhances our statistical power to look for quantitative differences from baseline. We acknowledge, however, that observed differences between individuals (both biologic and technical) may also be considerable. Ultimately, any biomarker that emerges from our discovery work must then be tested across large heterogeneous groups of individuals (cases, controls, “at risk” individuals, etc.) using more high throughput methodologies.
The raw mass spectrometry data and the sequence database used for searches may be downloaded from MassIVE (http://massive.ucsd.edu) using the identifier: MSV000079033. Download this dataset directly from ftp://MSV000079033:a@massive.ucsd.edu.
Supplementary Material
Acknowledgments
We thank Dr. Robert Cole, Director of Mass Spectrometry and Proteomics Facility, Johns Hopkins School of Medicine for re-analysis of his iTRAQ proteomic data and for useful discussions.
Footnotes
Author contributions: H.K., M.A.G., P.M., E.W.K., R.E.G., and S.A.C. designed research; H.K. and M.W.B. performed research; L.A.F. contributed new reagents or analytic tools; H.K., M.W.B., P.M., K.R.C., and D.M. analyzed data; H.K., M.A.G., K.R.C., R.E.G., and S.A.C. wrote the paper.
* This work was supported in part by grants from National Institutes of Health: HHSN268201000033C and R01HL096738 from NHLBI (to REG and SAC) and Grants U24CA160034 from NCI Clinical Proteomics Tumor Analysis Consortium initiative and 5U01CA152990-05 from the NCI Early Detection Research Network program (to SAC).
 This article contains supplemental Figs. S1 to S7 and Tables S1 to S8.
1 The abbreviations used are:
- LC-MS/MS
- Liquid chromatography- mass spectrometry/mass spectrometry
- SCX
- strong cation exchange
- iTRAQ
- Isobaric tags for absolute and relative quantitation
- TMT
- Tandem mass tags
- iMRM
- Immuno multiple reaction monitoring
- RP-HPLC
- Reversed phase- high performance liquid chromatography
- HOCM
- Hypertrophic obstructive cardiomyopathy
- PMI
- Planned myocardial infaction
- UPLC
- Ultrahigh pressure liquid chromatography
- FDR
- False discovery rate
- PSM
- Peptide spectrum match
- Basic RP
- high pH reversed phase chromatography
- LC-MRM-MS
- Liquid chromatography- multiple reaction monitoring – mass spectrometry
- MB
- Myoglobin
- CKB
- Creatine kinase B
- CKM
- Creatine kinase M
- FABP
- Fatty acid binding protein
- TNNT2
- Troponin T, cardiac muscle
- TNNI3
- Troponin I, cardiac muscle
- TNNC1
- Troponin C, slow skeletal and cardiac muscles
- TNNC2
- Troponin C, skeletal muscle
- ACLP1
- Aortic carboxypeptidase 1
- FHL1
- Four and a half lim domain protein 1
- MYL3
- Myosin light chain 3
- PF4V1
- Platelet factor 4 variant.
REFERENCES
- 1. Cao Z. J., Tang H. Y., Wang H., Liu Q., Speicher D. W. (2012) Systematic comparison of fractionation methods for in-depth analysis of plasma proteomes. J. Proteome Res. 11, 3090–3100 [DOI] [PMC free article] [PubMed] [Google Scholar]
- 2. Song C. X., Ye M. L., Han G. H., Jiang X. N., Wang F. J., Yu Z. Y., Chen R., Zou H. F. (2010) Reversed-phase-reversed-phase liquid chromatography approach with high orthogonality for multidimensional separation of phosphopeptides. Anal. Chem. 82, 53–56 [DOI] [PubMed] [Google Scholar]
- 3. Wang Y. X., Yang F., Gritsenko M. A., Wang Y. C., Clauss T., Liu T., Shen Y. F., Monroe M. E., Lopez-Ferrer D., Reno T., Moore R. J., Klemke R. L., Camp D. G., Smith R. D. (2011) Reversed-phase chromatography with multiple fraction concatenation strategy for proteome profiling of human MCF10A cells. Proteomics 11, 2019–2026 [DOI] [PMC free article] [PubMed] [Google Scholar]
- 4. Addona T. A., Shi X., Keshishian H., Mani D. R., Burgess M., Gillette M. A., Clauser K. R., Shen D. X., Lewis G. D., Farrell L. A., Fifer M. A., Sabatine M. S., Gerszten R. E., Carr S. A. (2011) A pipeline that integrates the discovery and verification of plasma protein biomarkers reveals candidate markers for cardiovascular disease. Nat. Biotechnol. 29, 635–U119 [DOI] [PMC free article] [PubMed] [Google Scholar]
- 5. Jones K. A., Kim P. D., Patel B. B., Kelsen S. G., Braverman A., Swinton D. J., Gafken P. R., Jones L. A., Lane W. S., Neveu J. M., Leung H. C., Shaffer S. A., Leszyk J. D., Stanley B. A., Fox T. E., Stanley A., Hall M. J., Hampel H., South C. D., de la Chapelle A., Burt R. W., Jones D. A., Kopelovich L., Yeung A. T. (2013) Immunodepletion plasma proteomics by tripleTOF 5600 and Orbitrap elite/LTQ-Orbitrap Velos/Q exactive mass spectrometers. J. Proteome Res. 12, 4351–4365 [DOI] [PMC free article] [PubMed] [Google Scholar]
- 6. Cole R. N., Ruczinski I., Schulze K., Christian P., Herbrich S., Wu L., DeVine L. R., O'Meally R. N., Shrestha S., Boronina T. N., Yager J. D., Groopman J., West K. P. (2013) The plasma proteome identifies expected and novel proteins correlated with micronutrient status in undernourished Nepalese children. J. Nutr. 143, 1540–1548 [DOI] [PMC free article] [PubMed] [Google Scholar]
- 7. Pichler P., Kocher T., Holzmann J., Mazanek M., Taus T., Ammerer G., Mechtler K. (2010) Peptide labeling with isobaric tags yields higher identification rates using iTRAQ four-plex compared to TMT six-plex and iTRAQ 8-Plex on LTQ orbitrap. Anal. Chem. 82, 6549–6558 [DOI] [PMC free article] [PubMed] [Google Scholar]
- 8. Sinclair J., Timms J. F. (2011) Quantitative profiling of serum samples using TMT protein labelling, fractionation and LC-MS/MS. Methods 54, 361–369 [DOI] [PubMed] [Google Scholar]
- 9. Lewis G. D., Wei R., Liu E., Yang E., Shi X., Martinovic M., Farrell L., Asnani A., Cyrille M., Ramanathan A., Shaham O., Berriz G., Lowry P. A., Palacios I. F., Tasan M., Roth F. P., Min J. Y., Baumgartner C., Keshishian H., Addona T., Mootha V. K., Rosenzweig A., Carr S. A., Fifer M. A., Sabatine M. S., Gerszten R. E. (2008) Metabolite profiling of blood from individuals undergoing planned myocardial infarction reveals early markers of myocardial injury. J. Clin. Invest. 118, 3503–3512 [DOI] [PMC free article] [PubMed] [Google Scholar]
- 10. (2011) R Development Core Team. R: a language and environment for statistical computing, R Foundation for Statistical Computing, Vienna, Austria [Google Scholar]
- 11. Smyth G. K. (2004) Linear models and empirical bayes methods for assessing differential expression in microarray experiments. Statistical applications in genetics and molecular biology 3, Article3 [DOI] [PubMed] [Google Scholar]
- 12. Benjamini Y., Hochberg Y. (1995) Controlling the false discovery rate: A practical and powerful approach to multiple testing. J. Roy. Statist. Soc. 57, 289–300 [Google Scholar]
- 13. Futschik M. (2012) Mfuzz: Soft clustering of time series gene expression data. R package version 2.18.0. http://itb.biologie.hu-berlin.de/∼futschik/software/R/Mfuzz/.
- 14. Fagbami L., Kuhn E., Abbatiello S. E., Carr S. A. (2013) Automated plasma processing for quantitative, targeted LC/MS analysis of proteins. Agilent Technologies, Inc. [Google Scholar]
- 15. Kuhn E., Whiteaker J. R., Mani D. R., Jackson A. M., Zhao L., Pope M. E., Smith D., Rivera K. D., Anderson N. L., Skates S. J., Pearson T. W., Paulovich A. G., Carr S. A. (2012) Interlaboratory evaluation of automated, multiplexed peptide immunoaffinity enrichment coupled to multiple reaction monitoring mass spectrometry for quantifying proteins in plasma. Mol. Cell. Proteomics 11, M111 013854 [DOI] [PMC free article] [PubMed] [Google Scholar]
- 16. MacLean B., Tomazela D. M., Shulman N., Chambers M., Finney G. L., Frewen B., Kern R., Tabb D. L., Liebler D. C., MacCoss M. J. (2010) Skyline: an open source document editor for creating and analyzing targeted proteomics experiments. Bioinformatics 26, 966–968 [DOI] [PMC free article] [PubMed] [Google Scholar]
- 17. Echan L. A., Tang H. Y., Ali-Khan N., Lee K., Speicher D. W. (2005) Depletion of multiple high-abundance proteins improves protein profiling capacities of human serum and plasma. Proteomics 5, 3292–3303 [DOI] [PubMed] [Google Scholar]
- 18. Liu T., Qian W. J., Mottaz H. M., Gritsenko M. A., Norbeck A. D., Moore R. J., Purvine S. O., Camp D. G., 2nd, Smith R. D. (2006) Evaluation of multiprotein immunoaffinity subtraction for plasma proteomics and candidate biomarker discovery using mass spectrometry. Mol. Cell. Proteomics 5, 2167–2174 [DOI] [PMC free article] [PubMed] [Google Scholar]
- 19. Pieper R., Su Q., Gatlin C. L., Huang S. T., Anderson N. L., Steiner S. (2003) Multi-component immunoaffinity subtraction chromatography: An innovative step towards a comprehensive survey of the human plasma proteome. Proteomics 3, 422–432 [DOI] [PubMed] [Google Scholar]
- 20. Patel B. B., Barrero C. A., Braverman A., Kim P. D., Jones K. A., Chen D. E., Bowler R. P., Merali S., Kelsen S. G., Yeung A. T. (2012) Assessment of two immunodepletion methods: Off-target effects and variations in immunodepletion efficiency may confound plasma proteomics. J. Proteome Res. 11, 5947–5958 [DOI] [PMC free article] [PubMed] [Google Scholar]
- 21. Qian W. J., Kaleta D. T., Petritis B. O., Jiang H. L., Liu T., Zhang X., Mottaz H. M., Varnum S. M., Camp D. G., Huang L., Fang X. M., Zhang W. W., Smith R. D. (2008) Enhanced detection of low abundance human plasma proteins using a tandem IgY12-SuperMix immunoaffinity separation strategy. Mol. Cell. Proteomics 7, 1963–1973 [DOI] [PMC free article] [PubMed] [Google Scholar]
- 22. Ross P. L., Huang Y. L. N., Marchese J. N., Williamson B., Parker K., Hattan S., Khainovski N., Pillai S., Dey S., Daniels S., Purkayastha S., Juhasz P., Martin S., Bartlet-Jones M., He F., Jacobson A., Pappin D. J. (2004) Multiplexed protein quantitation in Saccharomyces cerevisiae using amine-reactive isobaric tagging reagents. Mol. Cell. Proteomics 3, 1154–1169 [DOI] [PubMed] [Google Scholar]
- 23. Li Z., Adams R. M., Chourey K., Hurst G. B., Hettich R. L., Pan C. L. (2012) Systematic comparison of label-free, metabolic labeling, and isobaric chemical labeling for quantitative proteomics on LTQ orbitrap Velos. J. Proteome Res. 11, 1582–1590 [DOI] [PubMed] [Google Scholar]
- 24. Usaite R., Wohlschlegel J., Venable J. D., Park S. K., Nielsen J., Olsson L., Yates J. R. (2008) Characterization of global yeast quantitative proteome data generated from the wild-type and glucose repression Saccharomyces cerevisiae strains: The comparison of two quantitative methods. J. Proteome Res. 7, 266–275 [DOI] [PMC free article] [PubMed] [Google Scholar]
- 25. Mertins P., Qiao J. W., Patel J., Udeshi N. D., Clauser K. R., Mani D. R., Burgess M. W., Gillette M. A., Jaffe J. D., Carr S. A. (2013) Integrated proteomic analysis of post-translational modifications by serial enrichment. Nat. Methods 10, 634–637 [DOI] [PMC free article] [PubMed] [Google Scholar]
- 26. Mertins P., Yang F., Liu T., Mani D. R., Petyuk V. A., Gillette M. A., Clauser K. R., Qiao J. W., Gritsenko M. A., Moore R. J., Levine D. A., Townsend R., Erdmann-Gilmore P., Snider J. E., Davies S. R., Ruggles K. V., Fenyo D., Kitchens R. T., Li S., Olvera N., Dao F., Rodriguez H., Chan D. W., Liebler D., White F., Rodland K. D., Mills G. B., Smith R. D., Paulovich A. G., Ellis M., Carr S. A. (2014) Ischemia in tumors induces early and sustained phosphorylation changes in stress kinase pathways but does not affect global protein levels. Mol. Cell. Proteomics 13, 1690–1704 [DOI] [PMC free article] [PubMed] [Google Scholar]
- 27. O'Donoghue M., de Lemos J. A., Morrow D. A., Murphy S. A., Buros J. L., Cannon C. P., Sabatine M. S. (2006) Prognostic utility of heart-type fatty acid binding protein in patients with acute coronary syndromes. Circulation 114, 550–557 [DOI] [PubMed] [Google Scholar]
- 28. Ow S. Y., Salim M., Noirel J., Evans C., Rehman I., Wright P. C. (2009) iTRAQ underestimation in simple and complex mixtures: “the good, the bad and the ugly”. J. Proteome Res. 8, 5347–5355 [DOI] [PubMed] [Google Scholar]
- 29. Mertins P., Udeshi N. D., Clauser K. R., Mani D. R., Patel J., Ong S. E., Jaffe J. D., Carr S. A. (2012) iTRAQ labeling is superior to mTRAQ for quantitative global proteomics and phosphoproteomics. Mol. Cell. Proteomics 11, M111 014423 [DOI] [PMC free article] [PubMed] [Google Scholar]
- 30. Cox J., Hein M. Y., Luber C. A., Paron I., Nagaraj N., Mann M. (2014) Accurate proteome-wide label-free quantification by delayed normalization and maximal peptide ratio extraction, termed MaxLFQ. Mol. Cell. Proteomics 13, 2513–2526 [DOI] [PMC free article] [PubMed] [Google Scholar]
- 31. Farrah T., Deutsch E. W., Omenn G. S., Sun Z., Watts J. D., Yamamoto T., Shteynberg D., Harris M. M., Moritz R. L. (2014) State of the human proteome in 2013 as viewed through PeptideAtlas: Comparing the kidney, urine, and plasma proteomes for the biology- and disease-driven human proteome project. J. Proteome Res. 13, 60–75 [DOI] [PMC free article] [PubMed] [Google Scholar]
- 32. Pernemalm M., Lehtio J. (2014) Mass spectrometry-based plasma proteomics: state of the art and future outlook. Expert Rev. Proteomic 11, 431–448 [DOI] [PubMed] [Google Scholar]
- 33. Rifai N., Gillette M. A., Carr S. A. (2006) Protein biomarker discovery and validation: the long and uncertain path to clinical utility. Nat. Biotechnol. 24, 971–983 [DOI] [PubMed] [Google Scholar]
- 34. Antman E. M., Tanasijevic M. J., Thompson B., Schactman M., McCabe C. H., Cannon C. P., Fischer G. A., Fung A. Y., Thompson C., Wybenga D., Braunwald E. (1996) Cardiac-specific troponin I levels to predict the risk of mortality in patients with acute coronary syndromes. N. Engl. J. Med. 335, 1342–1349 [DOI] [PubMed] [Google Scholar]
- 35. Carr S. A., Abbatiello S. E., Ackermann B. L., Borchers C., Domon B., Deutsch E. W., Grant R. P., Hoofnagle A. N., Huttenhain R., Koomen J. M., Liebler D. C., Liu T., MacLean B., Mani D., Mansfield E., Neubert H., Paulovich A. G., Reiter L., Vitek O., Aebersold R., Anderson L., Bethem R., Blonder J., Boja E., Botelho J., Boyne M., Bradshaw R. A., Burlingame A. L., Chan D., Keshishian H., Kuhn E., Kinsinger C., Lee J. S. H., Lee S. W., Moritz R., Oses-Prieto J., Rifai N., Ritchie J., Rodriguez H., Srinivas P. R., Townsend R. R., Van Eyk J., Whiteley G., Wiita A., Weintraub S. (2014) Targeted peptide measurements in biology and medicine: Best practices for mass spectrometry- based assay development using a fit- for- purpose approach. Mol. Cell. Proteomics 13, 907–917 [DOI] [PMC free article] [PubMed] [Google Scholar]
- 36. Gillette M. A., Carr S. A. (2013) METHOD OF THE YEAR Quantitative analysis of peptides and proteins in biomedicine by targeted mass spectrometry. Nat. Methods 10, 28–34 [DOI] [PMC free article] [PubMed] [Google Scholar]
- 37. Karp N. A., Huber W., Sadowski P. G., Charles P. D., Hester S. V., Lilley K. S. (2010) Addressing accuracy and precision issues in iTRAQ quantitation. Mol. Cell. Proteomics 9, 1885–1897 [DOI] [PMC free article] [PubMed] [Google Scholar]
- 38. Savitski M. M., Mathieson T., Zinn N., Sweetman G., Doce C., Becher I., Pachl F., Kuster B., Bantscheff M. (2013) Measuring and managing ratio compression for accurate iTRAQ/TMT quantification. J. Proteome Res. 12, 3586–3598 [DOI] [PubMed] [Google Scholar]
Associated Data
This section collects any data citations, data availability statements, or supplementary materials included in this article.