

Abstract
Introduction of antibodies specific for acetylated lysine has significantly improved the detection of endogenous acetylation sites by mass spectrometry. Here, we describe a new, commercially available mixture of anti-lysine acetylation (Kac) antibodies and show its utility for in-depth profiling of the acetylome. Specifically, seven complementary monoclones with high specificity for Kac were combined into a final anti-Kac reagent which results in at least a twofold increase in identification of Kac peptides over a commonly used Kac antibody. We outline optimal antibody usage conditions, effective offline basic reversed phase separation, and use of state-of-the-art LC-MS technology for achieving unprecedented coverage of the acetylome. The methods were applied to quantify acetylation sites in suberoylanilide hydroxamic acid-treated Jurkat cells. Over 10,000 Kac peptides from over 3000 Kac proteins were quantified from a single stable isotope labeling by amino acids in cell culture labeled sample using 7.5 mg of peptide input per state. This constitutes the deepest coverage of acetylation sites in quantitative experiments obtained to-date. The approach was also applied to breast tumor xenograft samples using isobaric mass tag labeling of peptides (iTRAQ4, TMT6 and TMT10-plex reagents) for quantification. Greater than 6700 Kac peptides from over 2300 Kac proteins were quantified using 1 mg of tumor protein per iTRAQ 4-plex channel. The novel reagents and methods we describe here enable quantitative, global acetylome analyses with depth and sensitivity approaching that obtained for other well-studied post-translational modifications such as phosphorylation and ubiquitylation, and should have widespread application in biological and clinical studies employing mass spectrometry-based proteomics.
Lysine acetylation (Kac)1 is a well conserved, reversible post-translational modification (PTM) involved in multiple cellular processes (1). Acetylation is regulated by two classes of enzymes: lysine acetyltransferases (KATs) and histone deacetylases (HDACs) (2–4). This modification was originally identified as a nuclear event on histone proteins and has been long appreciated for its role in epigenetic and DNA-dependent processes. With the help of a growing number of large-scale acetylation studies, it has become evident that lysine acetylation is ubiquitous, also occurring on cytoplasmic and mitochondrial proteins and has a role in signaling, metabolism, and immunity (1, 4–6). Therefore, the examination of lysine acetylation on nonhistone proteins has gained a prominent role in PTM analysis.
To date, the identification of large numbers of acetylation sites has been challenging because of the substoichiometric nature of this modification (7, 8). Additionally, global acetylation is generally less abundant than phosphorylation and ubiquitylation (1). The introduction of antibodies specific for lysine acetylation has significantly improved the ability to enrich and identify thousands of sites (9–14). A landmark study by Choudhary et al. used anti-Kac antibodies to globally map 3600 lysine acetylation sites on 1750 proteins, thereby demonstrating the feasibility of profiling the acetylome (10). A more recent study by Lundby et al. investigated the function and distribution of acetylation sites in 16 different rat tissues, and identified, in aggregate, 15,474 acetylation sites from 4541 proteins (12).
Although anti-acetyl lysine antibodies have been a breakthrough for globally mapping acetylation sites (9–12), it remains a challenge to identify large numbers of lysine acetylation sites from a single sample, as is now routinely possible for phosphorylation and ubiquitylation (13, 15–18). To improve the depth-of-coverage in acetylation profiling experiments there is a clear need for (1) alternative anti-acetyl lysine antibodies with higher specificity, (2) optimized antibody usage parameters, and (3) robust proteomic workflows that permit low to moderate protein input. In this study, we describe a newly commercialized mixture of anti-Kac antibodies and detail a complete proteomic workflow for achieving unprecedented coverage of the acetylome from a single stable isotope labeling by amino acids in cell culture (SILAC) labeled sample as well as isobaric tags for relative and absolute quantitation (iTRAQ)- and tandem mass tag (TMT)-labeled samples.
EXPERIMENTAL PROCEDURES
Anti-Acetyl Lysine Antibody Development and ELISA Analysis
Two degenerate peptide libraries were used to immunize New Zealand White rabbits (library one: XXXXXXKacXXXXXX for immunizing eight rabbits; library two: XXXKacXXXKacXXXXKacXXXKacXXXX for immunizing four rabbits, where X represents a position in the peptide synthesis where a mixture of all 20 amino acids was used except for tryptophan, cysteine, and tyrosine). The peptide libraries were conjugated to keyhole limpet hemocyanin (KLH) with adjuvant to immunize rabbits. Test bleeds were screened for acetyl lysine specificity by ELISA using a lysine acetylated peptide library and nonacetylated peptide library as control. Rabbits showing good reactivity and unique acetyl lysine motif specificity were identified and monoclonal antibodies were generated using a proprietary method for monoclonal production developed at Cell Signaling Technology, Danvers, MA (CST). The final mixture of acetyl lysine antibodies is a mixture containing seven clones (catalog number CST #13416). ELISA analysis of each clone in the mixture was performed according to the procedure described previously (19). Briefly, 100 μl of 1 μm synthetic lysine acetylated and nonacetylated peptides were used to coat wells in a 96-well plate. Coating was carried out overnight at 4 °C. Each purified clone was used at 1:1000 dilution. The plate was incubated for 2 h at 37 °C. An alkaline phosphatase-conjugated goat anti-rabbit secondary antibody (CST #7054S) was added and incubated for 1 h at 37 °C prior to adding p-nitrophenyl phosphate (Sigma-Aldrich) for color development. Absorbance at 405 nm was measured on an ELISA plate reader (PerkinElmer).
Peptide Preparation from Mouse Tissue
Mouse liver tissue was obtained from mature BALB/c mice. Tissue was homogenized in urea lysis buffer (9 m sequanol grade urea, 20 mm 4-(2-hydroxyethyl)-1-piperazineethanesulfonic acid (HEPES), pH 8.0, 1 mm β-glycerolphosphate, 1 mm sodium vanadate, 2.5 mm sodium pyrophosphate). Lysate were reduced by 4.5 mm dithiothreitol (DTT) for 30 min at 55 °C. Reduced lysate was alkylated with 10 mm iodoacetamide for 15 min at room temperature (RT) in the dark. Sample was diluted fourfold with 20 mm HEPES, pH 8, and digested overnight with 10 μg/ml trypsin (Worthington, Lakewood, NJ). Digested peptide lysate was acidified with 1% trifluoroacetic acid (TFA), and peptides were desalted over 360-mg SEP PAK Classic C18 columns (Waters, Milford, MA). Peptides were eluted with 40% acetonitrile in 0.1% TFA, dried under vacuum, and stored at −80 °C.
Peptide Preparation from Jurkat E6–1 Cells
For label-free experiments, Jurkat E6–1 cells (ATCC) were grown in Roswell Park Memorial Institute (RPMI) 1640 media (Gibco, Grand Island, NY), supplemented with 10% fetal bovine serum (FBS) (Gibco), penicillin, and streptomycin (Gibco). For SILAC experiments Jurkat cells were grown in RPMI (Caisson Laboratories), deficient in l-arginine, and l-lysine and supplemented with 10% dialyzed FBS (Sigma-Aldrich), penicillin, streptomycin, and glutamine (Gibco). Cells were grown in SILAC media supplemented with either l-arginine (Arg 0) and l-lysine (Lys 0), or l-arginine 13C6-15N4-HCL (Arg 10) and l-lysine 13C6-15N2-HCL (Lys 8). Sixteen hours prior to harvest, labeled cells were treated with either 2 μm suberoylanilide hydroxamic acid (SAHA) (Sigma-Aldrich) or dimethyl sulfoxide (DMSO) (Sigma). Three biological replicates were prepared for the SAHA treatment experiment with SILAC label swaps. Prior to lysis, cells were pelleted and washed two times in 1× phosphate buffered saline (PBS).
Jurkat cells pellets were lysed at 4 °C in a lysis buffer containing 8 m urea, 50 mm Tris-HCl pH 8.0, 150 mm NaCl, 1 mm ethylenediaminetetraacetic acid (EDTA) (Sigma), 2 μg/μl Aprotinin (Sigma-Aldrich), 10 μg/μl Leupeptin (Roche, West Grove, PA), 1 mm phenylmethylsulfonyl fluoride (PMSF) (Sigma), and 5 mm sodium butyrate. Following lysis, cells were centrifuged at 20,000 × g for 15 min at 4 °C to remove insoluble material. Protein concentration was determined using a bicinchoninic acid (BCA) protein assay (Thermo Scientific, Grand Island, NY).
SILAC labeled samples were prepared by combining 7.5 mg of protein input per SILAC state. Proteins were reduced with 5 mm DTT for 45 min at RT, and subsequently carbamidomethylated with 10 mm iodoacetamide for 30 min at RT in the dark. Prior to digestion the urea concentration was reduced to 2 m with 50 mm Tris-HCl, pH 8. Samples were predigested for 2 h at 30 °C with Endoproteinase Lys-C (Wako Laboratories, Richmond, VA) at an enzyme-to-substrate ratio of 1:50. Samples were digested overnight at 25 °C with sequencing grade trypsin (Promega, Madison, WI) at an enzyme-to-substrate ratio of 1:50. Following digestion samples were acidified with formic acid (FA) (Sigma-Aldrich), and desalted on a 500 mg tC18 Sep-Pak SPE cartridge (Waters) exactly as described in (15, 20). Desalted samples were dried overnight in a vacuum centrifuge and stored at −80 °C.
Basic Reversed Phase (bRP) Chromatography
The offline bRP fractionation was carried out in a manner similar to that previously described (13, 15, 20). In this study, SILAC labeled samples were fractionated using a Zorbax 300 Extend-C18 column (9.4 × 250 mm, 300 Å, 5 μm, Agilent) on an Agilent 1100 series high pressure liquid chromatography (HPLC) system. Samples were reconstituted in 1.8 ml of 5 mm ammonium formate (pH 10.0)/2% (v/v) acetonitrile (MeCN) (bRP solvent A), divided equally into two HPLC vials, and injected successively with bRP solvent A at a flow rate of 3 ml/min. After loading, injected samples were subsequently separated using a 64 min gradient. The gradient consisted of an initial increase to 8% solvent B (1.1% B/min) (90% MeCN, 5 mm ammonium formate, pH 10) followed by a 38 min linear gradient (0.5% B/min) from 8% solvent B to 27% B and successive ramps to 31% B (1% B/min), 39% B (0.5% B/min), and 60% B (3% B/min) using a flow rate of 3 ml/min. Eighty ∼2 ml fractions were collected in a 96-deep well plate (GE Healthcare). For Kac peptide analysis, bRP fractions were pooled in a noncontiguous manner into eight final fractions using the pooling scheme diagramed in Fig. 3A. For example, to generate the first pooled fraction, original fractions 1, 9, 17, 25, 33, 41, 49, 57, 65, and 73 were combined. A similar pooling strategy was used to generate the remaining seven fractions. Pooled fractions were dried using a SpeedVac concentrator.
Fig. 3.

A, Schematic of the proteomic workflow for acetylation profiling. B, Average number of distinct Kac and non-Kac peptides identified in bRP fractionated and nonfractionated single SILAC samples, enriched from 7. 5 mg of peptide input per state. Error bars represent standard deviation for three replicates. C, Average number of distinct Kac and non-Kac peptides identified in each bRP fraction. Error bars represent standard deviation for three replicates. D, Cumulative distribution showing the number of distinct Kac peptides identified with bRP fractionation. Data points show the average of three replicates and error bars represent standard deviation. E, Percentage of distinct Kac peptides identified in one, two, or more than two bRP fractions.
Acetylated Peptide Enrichment from Mouse Tissue
Immunoaffinity enrichment of lysine acetylated peptides from mouse liver was performed using the PTMScan protocol as described previously (21). Briefly, 80 μg of each clone in the lysine acetylation antibody mixture from CST #13416 was conjugated to Protein A beads (Roche) overnight at 4 °C and then washed extensively with PBS. A total of 10 mg of mouse liver tryptic peptides were dissolved in 1.4 ml of immunoaffinity purification (IAP) buffer (50 mm MOPS, pH 7.2, 10 mm sodium phosphate, 50 mm NaCl) and centrifuged for 5 min at 12,000 rpm in a MiniSpin microcentrifuge (Eppendorf, Hauppauge, NY). Supernatant was mixed with lysine acetylation antibody beads and incubated for 2 h at 4 °C. The beads were washed twice with 1 ml of IAP buffer and three times with 1 ml of HPLC grade water (Burdick and Jackson, Muskegon, MI). Peptides were eluted from beads with 0.15% TFA (sequential elutions of 55 μl followed by 50 μl, 10 min each elution at room temperature). Eluted peptides were desalted over tips packed with Empore C18 (Sigma) and eluted with 40% acetonitrile in 0.1% TFA. Eluted peptides were dried under vacuum.
Acetylated Peptide Enrichment from Jurkat E6–1 Cells
Peptides were enriched for lysine acetylation using the mixture of anti-Kac antibodies described above which were noncovalently coupled to protein A agarose beads (CST catalog #13416). A polyclonal anti-Kac antibody from ImmuneChem Pharmaceuticals Inc. British Columbia, Canada (IMC) covalently coupled to Protein A agarose beads (catalog # ICP0388 version supplied as 4 mg/ml) was used for comparative studies. Prior to enrichment, the antibody beads were washed 3× with 1.5 ml of IAP buffer (50 mm MOPS pH 7.2, 10 mm sodium phosphate, 50 mm NaCl). For all Kac enrichment experiments, Jurkat peptides were resuspended in 1.5 ml of IAP buffer and incubated with antibody beads for 1 h at 4 °C with end-over-end rotation. For titration curve experiments completed with the anti-Kac antibody from CST, 2 mg Jurkat peptide aliquots were incubated with 25, 50, 75, 100, or 125 μg of anti-Kac antibody beads. In a parallel experiment 1, 2, 5, 10, and 15 mg of Jurkat peptides were incubated with a fixed amount (50 μg) of anti-Kac antibody beads. For titration curve experiments completed with IMC anti-Kac antibody, 1 mg of Jurkat peptide aliquots were incubated with 20, 30, 40, 50, 60, 100 μg of anti-Kac antibody beads. For the SILAC experiments, eight bRP fractions were each incubated with 50 μg of anti-Kac antibody beads. Following enrichment, anti-Kac antibody beads were washed 4× in 1.5 ml of 1x PBS. Peptides were eluted from antibody beads with 50 μl of 0.15% (TFA) (2×) and desalted using C18 StageTips. Briefly, each StageTip column was packed with two C18 EmporeTM high performance extraction disks (3 m). Prior to sample loading, StageTips were conditioned with 100 μl of 100% MeOH, 100 μl of 50% MeCN, and 2× with 100 μl of 0.1% FA. Enriched peptides were loaded onto conditioned StageTips, washed 2× with 100 μl of 0.1% FA, and eluted with 50 μl of 50% MeCN, 0.1% FA. Eluted peptides were dried to completeness in a SpeedVac concentrator.
Mass Spectrometry Analysis
For mouse liver tissue samples, peptides were dissolved in 0.1% TFA with 5% MeCN and separated on a 100 μm × 15 cm reversed-phase column packed with Magic C18 AQ (100 Å × 3 μm, Michrom, Auburn, CA) into a pulled tip. Peptides were eluted using a 72 min linear gradient of 5–30% MeCN in 0.125% formic acid delivered at 300 nl/min using an Easy nLC (Thermo Fisher Scientific). Tandem mass spectra were collected in a data-dependent manner with either an Orbitrap Elite or a Q Exactive mass spectrometer (Thermo Fisher Scientific). The Orbitrap Elite utilized a top-20 method, collecting MS spectra in the Orbitrap mass analyzer (60,000 resolution) with an automatic gain control target of 1E6 (maximum ion time: 1000 ms) and collision-induced dissociation MS/MS spectra in the ion trap with an automatic gain control target of 4e3 (maximum ion time: 50 ms). The Q Exactive employed a top-10 method, collecting MS spectra at 70,000 resolution and 1E6 automatic gain control with a maximum ion time of 10 ms and higher-energy collisional dissociation MS/MS spectra at 17,500 resolution and 1E5 automatic gain control with maximum ion time of 120 ms and a normalized collision energy of 25. Both instruments scanned precursor masses from 300–1500 m/z and employed dynamic exclusion with a repeat count of 1 and a repeat duration of 30 s. Ions that had a charge of 1 or were unassigned were excluded from MS/MS analysis. The polydimethylsiloxane lock mass (m/z 371.10123) was used as an internal calibrant for all runs.
For all Jurkat cell experiments, desalted peptides were resuspended in 3% MeCN, 0.1% FA and analyzed by online nanoflow liquid chromatography tandem mass spectrometry (LC-MS/MS) using a Q Exactive mass spectrometer (Thermo Fisher Scientific) coupled on-line to a Proxeon Easy-nLC 1000 (Thermo Fisher Scientific). Samples were loaded onto a microcapillary column (360 μm outer diameter × 75 μm inner diameter) containing an integrated electrospray emitter tip (10 μm), packed to 24 cm with ReproSil-Pur C18-AQ 1.9 μm beads (Dr. Maisch GmbH) and heated to 50 °C. The HPLC solvent A was 3% MeCN, 0.1% FA, and the solvent B was 90% MeCN, 0.1% FA. Peptides were eluted into the mass spectrometer at a flow rate of 200 nl/min. For 150 min inject-to-inject LC-MS methods, a linear gradient of 0.3% B/min, followed by a ramp to 60% B (10% B/min) was used. For single-shot, long runs, a 360 min inject-to-inject LC-MS/MS method was utilized. For the 360 min method, a gradient of 0.05% B/min was applied for 150 min, followed by a gradient of 0.09% B/min for 92 min, followed by 0.2% B/min for 42 min, and followed by a ramp to 60% B (10% B/min). The Q Exactive was operated in the data-dependent mode acquiring HCD MS/MS scans (r = 17,500) after each MS1 scan (r = 70,000) on the top 12 most abundant ions using an MS1 target of 3 × 10⁶ and an MS2 target of 5 × 10⁴. The maximum ion time utilized for MS/MS scans was 120 ms; the HCD-normalized collision energy was set to 25; the dynamic exclusion time was set to 20 s, and the peptide match and isotope exclusion functions were enabled.
Data Analysis
For the analysis of data generated from mouse liver tissue, RAW files were converted into mzXML format and processed using a suite of software tools developed in-house at CST for the analysis of large-scale proteomic data sets. All precursors selected for MS/MS fragmentation were confirmed using algorithms to detect and correct errors in monoisotopic peak assignment and refine precursor ion mass measurement. All MS/MS spectra were then exported as individual DTA files and searched using SEQUEST (v. 28 (rev. 12), 1998–2007) against the mouse database (20110802_REV_20110628mouse.fasta, NCBI, June 28, 2011; contains 30,120 forward proteins) and their reversed complements. A precursor mass tolerance of 50 ppm and a product ion tolerance of 1.0 Da (collision-induced dissociation spectra) or 0.02 Da (higher-energy collisional dissociation spectra) were allowed. One tryptic terminus was required, and four missed cleavages were allowed. Static carbamidomethylation of cysteine (+57.02146374) was required, and appropriate lysine acetylation (+42.0105646863) and methionine oxidation (+15.9949146221) were dynamically allowed with a maximum of four modifications of one type per peptide. Peptide spectral matches were filtered to a 1% false discovery rate using linear discriminant analysis in combination with the target-decoy strategy.
All Jurkat cell data was analyzed using MaxQuant software version 1.3.0.5 (22, 23). Files were searched against the human Uniprot database containing 81,470 entries. This database also included a list of 248 common laboratory contaminants provided by the MaxQuant program. The search parameters were set as follows. The enzyme specificity was set to trypsin with the maximum number of missed cleavages set to 2. The precursor mass tolerance for the first search (used for nonlinear mass recalibration) was set to 20 ppm. The precursor mass tolerance for the main search was set to 6 ppm. Variable modification searches included oxidized methionine, acetylation of internal lysine, and N-terminal protein acetylation. Carbamidomethylation of cysteine was searched as a fixed modification. The false discovery rate for peptide, protein, and site identification was set to 1%. The minimum peptide length was set to 6, and the filter-labeled amino acid and peptide requantification functions were enabled.
The identification and quantification information of acetylated peptides, sites, and proteins was obtained from the MaxQuant “evidence,” and “Acetyl (K) Sites” tables. Only acetylation sites with a localization probability of ≥0.75 were considered for the final SILAC SAHA data set. Significance of the regulated acetylated lysine sites was determined using a moderated T-statistical analysis as previously described (24, 25). Analysis of uniqueness per bRP fraction for Kac peptides was completed using Spectrum Mill. supplemental Table S3 contains embedded hyperlinks that link to a Spectrum Mill viewer showing an annotated MS/MS spectrum for Kac peptides. We recommend using Internet Explorer on Windows for best results. To view the spectrum, paste the URL directly into Internet Explorer. The raw mass spectrometry data and the sequence database used for searches may be downloaded from MassIVE (http://massive.ucsd.edu) using the identifier: MSV000079068. Download this data set directly from ftp://MSV000079068:a@massive.ucsd.edu.
Raw data corresponding to only the SAHA treated Jurkat cell experiments from the published study by Choudhary et al. were searched using MaxQuant software version 1.3.0.5 with nearly identical settings as described above for searching our own SILAC data (10). Data of Choudhary et al. was acquired using an LTQ-Orbitrap XL instrument (Thermo Fisher Scientific) and therefore the MS/MS tolerance (ITMS) was set to 0.5 Da.
Gene Ontology
The DAVID bioinformatics functional annotation tool (http://david.abcc.ncifcrf.gov/) was used to identify enriched cellular components (GOCC) and biological processes (GOBP) terms within our data set (26). Human genes were chosen as the background population for all analyses. Enrichment over background was assigned using the Benjamini-Hochberg adjusted p value of ≤ 0.01.
Kac Motif Analysis
The sequences of amino acids around acetylated lysines were analyzed using the IceLogo resource (http://iomics.ugent.be/icelogoserver/main.html) (27). For mouse tissue samples, sequence windows of ±7 amino acids around modified lysines were created. Sequences windows were submitted for the analysis and the mouse proteome was used as the background. For SAHA-treated SILAC experiments sequence windows of ±15 amino acids around the modification sites were created. Sequence windows were submitted for the analysis and the human proteome was used as the background. For all analyses, a p value was set to 0.01 and results were presented as fold change.
Overlap Analysis
For SAHA SILAC experiments, Kac site and protein level overlap analysis was completed using information from the “Acetyl (K) Sites” table generated by MaxQuant. Overlap between our SAHA treated Jurkat cell data and the SAHA treated Jurkat cell data previously generated by Choudhary et al. (10) was completed at the acetylation site level. Only quantified acetylation sites with a localization probability ≥ 0.75 were considered for this analysis. The overlap analysis of the data from Lundby et al. was performed at the acetylated protein level (12). Briefly, the UniProt.ws library was used to retrieve ENSEMBL gene identifiers from the UniProt accessions found in the “Leading proteins” column of our MaxQuant “Acetyl (K) Sites” table (28). In addition, either Biological Database Network (http://biodbnet.abcc.ncifcrf.gov/), g:Profiler (http://biit.cs.ut.ee/gprofiler/), or BioMart (http://www.biomart.org/) were used to retrieve ENSEMBL gene identifiers for those Uniprot accessions that were not matched with Uniprot.ws (29, 30).
Isobaric Labeling Data
To compare acetylated lysine peptide enrichment across different isobaric labeling techniques, human luminal- and basal-subtype breast tumor mouse xenograft tissue samples were lysed and digested according to a previous study method that utilized the same type of pooled tissue (31). Luminal and basal xenograft samples were randomly assigned to different channels within each isobaric label experiment, and equivalent peptide amounts of each channel were labeled to generate 4 mg of total peptide material in each four-plex isobaric tags for relative and absolute quantitation (iTRAQ4) (AB Sciex, P/N 4466096), six-plex tandem mass tags (TMT6)- (Thermo Scientific, #90068), and 10-plex TMT (TMT10)-labeled (Thermo Scientific, #90406) experiment (1 mg of material was designated to each channel in the iTRAQ4 experiment, 667 μg of peptide was used for each channel of TMT6 and 400 μg of material was designated to each channel in the TMT10 experiment).
Offline bRP fractionation of each 4 mg isobaric label experiment was completed using a Zorbax 300 Extend-C18 column (4.6 × 250 mm, 300 Å, 3.5 μm, Agilent) on Agilent, Santa Clara, CA, 1100 series HPLC system. All samples were first separated into 12 bRP fractions and enriched for phosphopeptides as previously described (31). Flow-throughs of the immobilized metal affinity chromatography (IMAC) phosphopeptide enrichments were collected and further combined into four fractions in a noncontiguous manner for sequential Kac peptide enrichment. We used 50 μg of antibody for each Kac enrichment following the same enrichment strategy as described above.
All Kac enrichment fractions were analyzed using 140 min inject-to-inject method on a Q-Exactive mass spectrometer as previously described (13). We used a normalized collision energy of 28 for iTRAQ- and 27 for TMT-samples. MS/MS scans were acquired at a resolution of 17,500 for iTRAQ4- and TMT6-labeled samples and a resolution of 35,000 for TMT10-labeled samples. MS/MS raw data were searched using Spectrum Mill software against a RefSeq Mouse and Human concatenated database (July 2013 version; contains 56,660 forward proteins). A precursor mass tolerance of 20 ppm and a product ion tolerance of 20 ppm (higher-energy collisional dissociation spectra) were allowed. Tryptic enzyme specificity was required, and up to four missed cleavages were allowed. Carbamidomethylation of cysteine as well as iTRAQ- and TMT-tags on lysine residues and the peptide N terminus were analyzed as fixed modifications. Lysine acetylation and methionine oxidation were set as variable modifications. Peptides were identified at a <1% false discovery rate using a target-decoy search strategy.
RESULTS
A Novel Acetyl Lysine Antibody is a Mixture of Seven Monoclones and Shows High Specificity for Acetylated Lysines
An antibody mixture consisting of seven distinct monoclones was recently developed for the enrichment of acetylated peptides. ELISA assays using synthetic acetylated and non-acetylated lysine peptide libraries were performed on test bleeds to determine the specificity of each clone (Fig. 1A, supplemental Table S1) (25). ELISA results show that on average, the clones are ∼11.5-fold more specific for acetylated peptides compared with nonacetylated peptides. Enrichment of Kac peptides from mouse liver tissue using each of the seven monoclones individually and in a mixed format show that on average 3.4-fold more Kac peptides are detected from samples enriched with the mixed antibody reagent relative to enrichment using any individual clone. (supplemental Fig. S1A, supplemental Table S1). Sequence motif analysis of residues flanking Kac sites indicate that there is a general preference for lysine rich regions (Fig. 1B). For some clones a distinct sequence motif proximate to the acetylated lysine is observed. For example, clone 6 has a significant bias for aspartic acid and glutamic acid in the −1 position. Clone 1 and Clone 4 appear to have a significant enrichment of tyrosine in the +1 and −1 position, respectively. Several clones show a bias for underrepresentation of proximate arginine residues. We observed that the sequence motif for the antibody mix is a composite of motifs present in multiple clones (Fig. 1B). These results coupled with the observation that the mixture of antibodies has the highest specificity supports the notion that the combination of multiple clones can allow for broader-range recognition of acetylated peptides (Fig. 1B, supplemental Fig. S1A). Although the non-acetylated peptide signal from clone 3 was much higher than the background signal from the other clones (1, 2, 4, 5, 6, and 7) by ELISA assay (Fig. 1A, supplemental Table S1), the mass spectrometry results clearly highlight the importance of this clone in the final formulation. Based on the major contribution of distinct Kac peptides (supplemental Fig. S1), clone 3 was included in the final formulation providing complementary sequence coverage for additional Kac peptides that were not accessible using only the other six clones (Fig. 1B).
Fig. 1.

A, ELISA analysis of seven clones in the CST anti-acetyl lysine reagent. Samples were probed with acetylated lysine peptide library. Controls were probed with library without acetylated lysines. B, IceLogo motif analysis of Kac peptide sequence windows (p < 0.01). The height of amino acid letters corresponds to fold change.
Titration of Antibody and Peptide Input Amount is Critical to Maximize Yield and Specificity for Detection of Lysine Acetylated Peptides
Our previous work focused on large-scale enrichment of ubiquitination sites from cellular lysates highlighted the importance of optimizing the amount of antibody to maximize the yield of K-ε-GG peptides (20). Therefore, in parallel experiments, we titrated the amount of anti-Kac antibody mixture and the amount of input protein to study the interplay of these factors on the number of identified Kac and non-Kac peptides. Titration experiments that tested a range of anti-Kac antibody amount revealed that 50 μg of antibody is sufficient and optimal for maximizing the yield of Kac peptides from 2 mg of input (Fig. 2, supplemental Table S2). Although amounts of antibody as low as 25 μg can yield high numbers of acetylated peptides, pipetting this small volume of beads (4 μl) is less reproducible between replicates (Fig. 2). The number of identified acetylated peptides steadily decreased when the anti-Kac antibody mixture amount was increased beyond 50 μg and the number of identified non-acetylated peptides steadily increased. This observation is consistent with our previous findings for the anti-K-ε-GG antibody (20). The titration experiments also show that 50 μg of the anti-Kac antibody is sufficient to enrich Kac peptides from up to 15 mg of peptide input (supplemental Fig. S2, supplemental Table S2). Taken together, these results indicate that it is imperative to determine the optimal antibody and protein input combination to maximize the yield of Kac peptides.
Fig. 2.
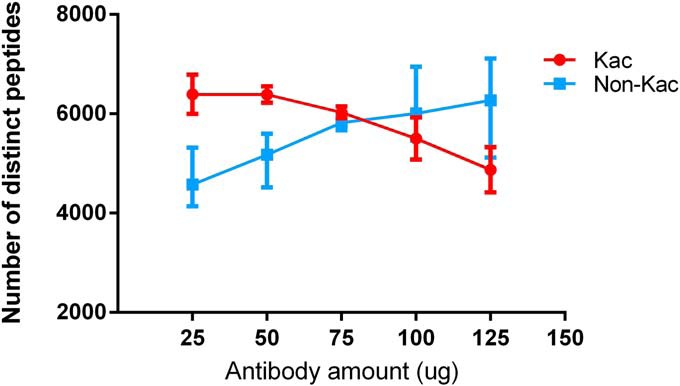
Titration curve data for Kac and non-Kac peptides identified after enrichment of 2 mg of peptide input using indicated amounts of anti-Kac antibody (CST). Each data point is the average of three IAP process replicates and error bars represent standard deviation (exception 75 μg point is the average of two replicates).
Alternate anti-Kac antibody reagents are commercially available and have been previously used in global acetylome experiments (5, 9–12). We compared the performance of the anti-Kac antibody clone mixture from CST to a commonly used anti-Kac antibody from ImmuneChem (IMC). The IMC antibody is a polyclonal rabbit antibody, and is one of the leading reagents used for large scale acetylome profiling experiments (9–12, 32). We performed titration experiments for the IMC antibody to establish the optimal amount of reagent needed for Kac peptide enrichment (supplemental Fig. S3A, S3B, supplemental Table S2). Our results show that 60 μg of antibody is optimal to achieve the maximum yield of acetylated peptides from 1 mg of peptide input. Having defined the optimal amounts of both the CST and IMC anti-Kac antibodies to use for a set amount of digested input protein lysate, we set out to compare the results of Kac peptide enrichment with these reagents. We incubated 2 mg of peptides with either 50 μg or 60 μg of anti-acetyl antibody from CST and IMC, respectively. Results indicate that the yield of distinct Kac peptides is on average 4277 (S.D. 77.5) with CST antibody relative to 1957 (S.D. 479.7) with IMC antibody (supplemental Fig. S4A, supplemental Table S2). The percentage of Kac peptides relative to non-Kac peptides identified in a given sample is 41% for CST and 16.8% for IMC. We next evaluated the overlap of Kac peptides enriched with both reagents to understand if the antibodies exhibit complementary specificity. The overlap between any two IAP process replicates was on average 63% for CST and 56% for IMC (supplemental Fig. S4B, S4C). Interestingly, we found that 68% of the Kac peptides identified after enrichment by IMC were also identified with the CST antibody mix (supplemental Fig. S4D). Altogether, we find that relative to the IMC antibody, the antibody from CST provides better specificity, higher coverage, and enriches for the majority of Kac peptides observed with the IMC antibody.
Basic pH Reversed Phase (bRP) Fractionation Increases the Number of Identified Acetylated Peptides
Our optimized workflow for deep coverage of Kac peptides from cell lysates is shown in Fig. 3A. The workflow is illustrated for a double encoded SILAC experiment with 7.5 mg of peptide input per state. For SILAC based experiments, Jurkat cells were treated with 2 μm SAHA or DMSO 16 h prior to harvest. Cell pellets were lysed, combined, reduced, alkylated, and digested with LysC and trypsin to generate peptides (Fig. 3A). In order to reduce sample complexity, peptides were fractionated off-line using bRP chromatography (13, 15). Peptide fractions were pooled in a noncontiguous fashion (see Methods) into eight final fractions, where each fraction contained ∼2 mg of peptide material. Each fraction was incubated with 50 μg of anti-Kac antibody (CST) for Kac peptide enrichment (Fig. 3A).
To better understand the importance of prefractionation on the identification of Kac peptides, we used SAHA treated samples (7.5 mg input per SILAC state) and either left samples unfractionated prior to Kac enrichment or fractionated them by bRP (Fig. 3A). Nonfractionated samples were analyzed in a single-shot manner using either a 150 min inject-to-inject LC-MS/MS method (82 min effective gradient) or a 360 min inject-to-inject method (282 min effective gradient). The longer LC-MS/MS method increased the number of identified acetylated peptides by 1.7-fold compared with the conventional 150 min method (Fig. 3B, supplemental Table S3). For non-fractionated samples, Kac peptides made up ∼50% of the total identified peptides (Fig. 3B). In contrast, the total number of acetylated peptides observed in a bRP fractionated sample was 2.7-fold and 4.6-fold higher when compared with nonfractionated samples run with a 360 min and 150 min method, respectively. The specificity for Kac peptides per fraction was ∼40% as measured by Kac modified over total distinct peptide counts. Although the specificity for identification of Kac peptides per sample is lower in fractionated versus unfractionated samples, we observed a marked improvement in absolute number of identified Kac peptides using bRP fractionation.
Similar to previous results for K-ε-GG peptides, pooling of nonadjacent basic RP fractions produced fractions containing consistent numbers of acetylated and nonacetylated peptides (Fig. 3C). Importantly, we found that >80% of identified Kac peptides were uniquely identified in any one of eight bRP fractions (Fig. 3E), resulting in a near linear increase in the numbers of acetylated peptides sequenced with each additional fraction (Fig. 3D). Advantages of having the majority of peptides exist in only one bRP fraction include reduced redundancy of MS peptide sampling, conservation of signal intensity for a given peptide, and reduced peptide co-elution interference. Altogether, these data show that bRP fractionation coupled to anti-Kac antibody enrichment significantly improves the depth-of-coverage for identification of low-abundance Kac peptides.
Large-scale Acetylation Profiling of SAHA Treated Cells Reveals High Numbers of Regulated Acetylation Sites
We benchmarked our acetylome workflow using Jurkat E6–1 cells treated with the HDAC inhibitor SAHA (Fig. 3A). As described above, samples underwent bRP prefractionation prior to Kac enrichment. Using this sample preparation workflow combined with enrichment using the newly generated anti-Kac antibody mixture, we identified and quantified unprecedented numbers of Kac peptides from a single SILAC-labeled sample with 7.5 mg of peptide input per state. On average, we identified over 3000 Kac proteins and quantified over 10,000 Kac peptides with over 8600 localized Kac sites in each of three biological replicates (Table I). For localized Kac sites, an average of 6553 were quantified in any two replicates, and 5524 were quantified in all three replicates (Fig. 4A, supplemental Table S3). At the Kac protein level, the overlap between any two replicates was on average 2831, and 2642 proteins were identified in all three replicates (Fig. 4B, supplemental Table S3).
Table I. Number of identified and quantified Kac proteins, peptides, and sites. A Kac site was deemed localized if the localization score in the indicated replicate was ≥0.75 (see Methods).
| Rep1 | Rep2 | Rep3 | Average | |
|---|---|---|---|---|
| # Identified proteins with Kac sites | 3127 | 3221 | 3320 | 3223 |
| # Kac identified peptides | 10409 | 10717 | 11417 | 10848 |
| # Kac quantified peptides | 10135 | 10128 | 11030 | 10431 |
| # Kac identified and localized sites | 8584 | 8831 | 9379 | 8863 |
| # Kac quantified and localized sites | 8400 | 8406 | 9107 | 8638 |
Fig. 4.

A, Quantified Kac site overlap for three biological replicates. B, Kac protein overlap for three biological replicates. C, Scatter plots, histograms, and Pearson correlation values for Kac sites after 2 μm SAHA treatment (16 h) versus DMSO for three biological replicates. The plot shows normalized log2 SILAC ratios. Points colored in red were deemed regulated using a moderated t-statistic (p < 0.01). Points colored in black were deemed not reproducibly regulated.
The average Pearson correlation value for SILAC ratios across three replicates of the SAHA versus DMSO treated cells was 0.84, indicating a high degree of experimental reproducibility (Fig. 4C). As previously shown, the lysine deacetylase inhibitor SAHA induces significant effects on the acetylation landscape (10, 33, 34). A significant percentage (20.4%) of acetylation sites were up-regulated (p < 0.01) in response to SAHA treatment whereas only 1.8% of sites were down-regulated (p < 0.01) (Fig. 4C, supplemental Table S3). As expected Kac sites up-regulated by SAHA treatment were identified on proteins involved in nuclear processes such as transcription, cell cycle, chromatin assembly and histone modification (Fig. 5A). Interestingly, proteins with down-regulated Kac sites were also enriched in transcriptional and chromatin regulation processes. Up-regulated Kac proteins were significantly enriched in both nuclear and mitochondrial proteins, whereas nearly all down-regulated Kac proteins showed enrichment for nuclear localization (Fig. 5A and 5B).
Fig. 5.

A, Gene ontology enrichment of Biological Processes (BP) and Cellular Compartment (CC) terms for SAHA induced up- and (B) down-regulated Kac sites (p < 0. 01). Enrichment analysis was performed using DAVID. C, IceLogo motif analysis of Kac peptide sequence windows (p < 0.01). The height of amino acid letters corresponds to fold change.
We used an identical biological setup to previous work by Choudhary et al. to facilitate comparison and to better understand the extent of improvement in our depth-of-coverage for mapping lysine acetylation sites (10). As part of their broad acetylome study, Choudhary et al. examined the effects of SAHA treatment in Jurkat cells using the anti-Kac antibody from ImmuneChem. Searching their data using our data processing pipeline showed that 1425 Kac sites were quantified and localized after SAHA treatment of Jurkat cells. Comparison of our two data sets showed that we identified ∼sixfold more acetylation sites in a single replicate than detected in the earlier study (supplemental Fig. S5B). This large difference is due in part to the improved antibody (CST versus ImmuneChem) and sample processing strategy we used, but also because of improvements in MS technology (Q-Exactive versus LTQ Orbitrap XL). Overlap analysis showed that of the 1425 Kac sites quantified from the data of Choudhary et al., 972 (68%) overlapped with the 11,922 Kac sites quantified in our total SAHA data set, and 875 (61%) overlapped with a single replicate of our data (supplemental Fig. S5A and S5B). The differences observed in the specific acetylation sites quantified in our data set and the Choudhary et al. data set are likely because of differences in the specificities of these reagents as no more than 68% of the Kac peptides identified after enrichment with the ImmuneChem antibody were also identified with the CST antibody.
An extensive study completed by Lundby et al. created an organ-wide map of lysine acetylation from 16 different rat tissues (12). In aggregate they identified >15,000 total Kac sites with an average of 3000 to 5000 Kac sites per tissue using the anti-Kac antibody from ImmuneChem. To facilitate comparison of our Kac data (human) to the data presented by Lundby et al. (rat), we completed our evaluation at the Kac protein level. Overlap analysis revealed that 46% of Kac proteins reported by Lundby et al. were identified in our study (supplemental Fig. S5C). Similar to Lundby et al., we identify an average of ∼3 Kac sites per protein (supplemental Fig. S6) (12). Taken together, we find that nearly half of all acetylated proteins we identified overlap to acetylated proteins previously identified from rat tissue (12). This is a result of our high depth-of-coverage, the occurrence of multiply acetylated proteins, and evolutionary conservation of lysine acetylation (12, 35).
We also analyzed our acetylome data set for lysine acetylation sequence motifs. In agreement with previous work by Weinert et al. and Lundby et al., we also found that residues flanking acetylation sites are highly enriched in lysine and frequently contain glycine (Gly), aspartic acid (Asp), and glutamic acid (Glu) at the −1 position (12, 35). Interestingly, as shown above, the anti-acetyl antibody clone 6 had a strong preference for Asp and Glu at the −1 position (Fig. 1B). However, although it is always important to consider the potential for sequence bias in global proteomic analyses of post-translational modifications, bias is unlikely in the present case because of the use of mixtures of clonally distinct antibodies with complementary motif specificities.
Acetylome Profiling is Compatible with Isobaric Labeling Techniques
Isobaric labeling techniques such as iTRAQ and TMT offer the ability to quantify peptides and proteins in a highly multiplexed manner and are amenable for use in nearly all sample types. Hebert et al. previously showed that TMT labeling coupled to immunoaffinity enrichment of Kac peptides from mitochondria purified from mouse liver yields an average of 2400 sites from a sample where 1 mg of input material was used per label (11). To further investigate iTRAQ and TMT quantification techniques for global acetylation profiling, luminal and basal subtype breast cancer xenograft tissue samples (see Methods) were homogenized, lysed, and digested as described above. For comparison purposes, a total of 4 mg of tumor material was used in each isobaric labeling plex, with that amount divided equally into each channel of the plex (iTRAQ4, TMT6, TMT10). Each experiment was separated using bRP fractionation, and enriched for Kac peptides. Enrichment for lysine acetylation was completed with 50 μg of anti-Kac antibody (CST) for each of 4 distinct bRP fractions per isobaric label type. We find that bRP fractionation of iTRAQ and TMT labeled peptides leads to a uniform distribution of peptides across four fractions (supplemental Fig. S7, supplemental Table S4). For the iTRAQ4 experiments we quantified 6753 Kac peptides, 5579 Kac sites, and 2327 Kac proteins. For TMT6 experiments 4191 Kac peptides, 3678 Kac sites, and 1828 Kac proteins were quantified. For TMT10 experiments we quantified 4180 Kac peptides, 3653 Kac sites, and 1804 Kac proteins. Isobaric labeling combined with our optimized acetylation profiling workflow yields extremely deep coverage of Kac sites from total tissue lysates. Labeling using iTRAQ4 yields ∼1.5-fold higher numbers of acetylated peptides when compared with labeling with TMT6 and TMT10 (supplemental Fig. S7, supplemental Table S4). Therefore, we find that labeling using iTRAQ4 offers higher sensitivity over TMT6 and TMT10 in acetylation experiments, but with a lower multiplexing capability. Taken together, we show that isobaric labeling techniques are highly amenable for profiling the acetylome and offer increased throughput in profiling of biological samples.
DISCUSSION
We have described the use of a new, commercially available anti-Kac antibody mixture that in combination with our global PTM workflow results in the identification of unprecedented numbers of lysine acetylation sites. Specifically we were able to enrich over 10,000 lysine acetylated peptides from moderate sample input. Our findings show that for the first time the depth-of-coverage attainable for the acetylome is comparable to that for other well studied PTMs (e.g. phosphorylation, ubiquitylation) (13, 16–18, 20).
The high-degree of coverage we achieve can be attributed to multiple improvements in the proteomic workflow including, antibody specificity and handling, off-line fractionation strategy, and higher sensitivity of new LC-MS/MS technology. We showed that the new anti-Kac antibody reagent increases the number of identified acetylated peptides by twofold relative to another commonly used anti-Kac antibody from ImmuneChem. In addition to the improved antibody performance, we attribute the significant increase in the number of Kac sites quantified relative to the study by Choudhary et al. in SAHA-treated Jurkat cells to the highly effective bRP separation technique, UPLC conditions for online separation, and mass spectrometry analysis on a Q Exactive instrument (10). Newer generation of mass spectrometers such as the Q Exactive significantly improve the detection of low abundant PTMs because of improvements in speed and sensitivity.
Deep coverage of the acetylome allows for analysis of primary sequence enrichment proximate to acetylated lysine. From our work, we find that acetylated lysines occur in lysine rich regions and are often preceded by Gly, Asp, and Glu residues as has been previously shown (12, 35). It should be noted that alternate sequence preferences will likely emerge for specific cellular compartments as illustrated by Lundby et al. (12). Finally, we also observed that nearly half of all acetylated proteins we identify for SAHA treated Jurkat cells overlap at the acetylated protein level to the rat acetylome data set reported Lundby et al. Ultimately, this degree of overlap is supported by the evolutionary conservation of lysine acetylation and our high depth-of-coverage (12, 35).
In this study, we show that both metabolic (SILAC) and isobaric (iTRAQ or TMT) labeling methods are highly compatible with the acetylation enrichment workflow. Having flexibility in quantification strategy is advantageous for broadening the spectrum of sample types that can be profiled for acetylation. SILAC labeling offers the advantage of using relatively larger sample inputs which helps to increase depth-of-coverage. Workflows using isobaric labeling strategies are limited to smaller sample inputs because of reagent costs, but offer increased multiplexing capability and are amenable for use with nearly all samples types.
To further increase the coverage of acetylation sites, possibilities include, extending the number of bRP fractions, increasing sample input, and combining the use of different anti-Kac antibodies in a mixed or serial enrichment format. We envision that the state-of-the-art methodology presented here for deep coverage of the acetylome could be applied to the study of other less abundant PTMs and facilitate improved understanding of PTM cross-talk.
Supplementary Material
Acknowledgments
We thank Choudhary, C., Mann, M. et al. for providing us with access SAHA treated Jurkat cell data. We acknowledge Leslie Gaffney, Broad Institute for her help with illustrations.
Footnotes
Author contributions: T.S., P.M., N.D.U., and S.A.C. designed research; T.S., H.G., J.Q., and S.F. performed research; H.G. and J.C.S. contributed new reagents or analytic tools; T.S., H.G., J.C.S., P.M., J.Q., J.D.J., E.K., and N.D.U. analyzed data; T.S., N.D.U., and S.A.C. wrote the paper.
* This work was supported in part by grants from National Institutes of Health: HHSN268201000033C and R01HL096738 from NHLBI and U24CA160034 from NCI Clinical Proteomics Tumor Analysis Consortium initiative to SAC.
 This article contains supplemental Figs. S1 to S7 and Tables S1 to S3.
1 The abbreviations used are:
- Kac
- lysine acetylation
- PTM
- post-translational modification
- KATs
- lysine acetyltransferases
- HDACs
- histone deacetylases
- SILAC
- stable isotope labeling by amino acids in cell culture
- ELISA
- enzyme-linked immunosorbent assay
- KLH
- keyhole limpet hemocyanin
- HEPES
- 4-(2-hydroxyethyl)-1-piperazineethanesulfonic acid
- DTT
- dithiothreitol
- TFA
- trifluoroacetic acid
- RPMI
- Roswell Park Memorial Institute 1640
- FBS
- fetal bovine serum
- SAHA
- suberoylanilide hydroxamic acid
- DMSO
- dimethyl sulfoxide
- PBS
- phosphate buffered saline
- EDTA
- ethylenediaminetetraacetic acid
- PMSF
- phenylmethylsulfonyl fluoride
- BCA
- bicinchoninic acid
- RT
- room temperature
- bRP
- basic reversed phase
- HPLC
- high pressure liquid chromatography
- MeCN
- acetonitrile
- IAP
- immunoaffinity purification
- FA
- formic acid
- iTRAQ
- isobaric tags for relative and absolute quantitation
- TMT
- tandem mass tags
- IMAC
- immobilized metal affinity chromatography
- Gly
- glycine
- Asp
- aspartic acid
- Glu
- glutamic acid
- K-ε-GG
- di-glycine remnant.
REFERENCES
- 1. Choudhary C., Weinert B. T., Nishida Y., Verdin E., Mann M. (2014) The growing landscape of lysine acetylation links metabolism and cell signalling. Nat. Rev. 15, 536–550 [DOI] [PubMed] [Google Scholar]
- 2. Haberland M., Montgomery R. L., Olson E. N. (2009) The many roles of histone deacetylases in development and physiology: implications for disease and therapy. Nat. Rev. 10, 32–42 [DOI] [PMC free article] [PubMed] [Google Scholar]
- 3. Roth S. Y., Denu J. M., Allis C. D. (2001) Histone acetyltransferases. Ann. Rev. Biochem. 70, 81–120 [DOI] [PubMed] [Google Scholar]
- 4. Sterner D. E., Berger S. L. (2000) Acetylation of histones and transcription-related factors. Microbiol. Mol. Biol. Rev. 64, 435–459 [DOI] [PMC free article] [PubMed] [Google Scholar]
- 5. Kim G. W., Yang X. J. (2011) Comprehensive lysine acetylomes emerging from bacteria to humans. Trends Biochem. Sci. 36, 211–220 [DOI] [PubMed] [Google Scholar]
- 6. Kim S. C., Sprung R., Chen Y., Xu Y., Ball H., Pei J., Cheng T., Kho Y., Xiao H., Xiao L., Grishin N. V., White M., Yang X. J., Zhao Y. (2006) Substrate and functional diversity of lysine acetylation revealed by a proteomics survey. Mol. Cell 23, 607–618 [DOI] [PubMed] [Google Scholar]
- 7. Baeza J., Dowell J. A., Smallegan M. J., Fan J., Amador-Noguez D., Khan Z., Denu J. M. (2014) Stoichiometry of site-specific lysine acetylation in an entire proteome. J. Biol. Chem. 289, 21326–21338 [DOI] [PMC free article] [PubMed] [Google Scholar]
- 8. Weinert B. T., Iesmantavicius V., Moustafa T., Scholz C., Wagner S. A., Magnes C., Zechner R., Choudhary C. (2014) Acetylation dynamics and stoichiometry in Saccharomyces cerevisiae. Mol. Syst. Biol. 10, 716. [DOI] [PMC free article] [PubMed] [Google Scholar]
- 9. Chen Y., Zhao W., Yang J. S., Cheng Z., Luo H., Lu Z., Tan M., Gu W., Zhao Y. (2012) Quantitative acetylome analysis reveals the roles of SIRT1 in regulating diverse substrates and cellular pathways. Mol. Cell. Proteomics 11, 1048–1062 [DOI] [PMC free article] [PubMed] [Google Scholar]
- 10. Choudhary C., Kumar C., Gnad F., Nielsen M. L., Rehman M., Walther T. C., Olsen J. V., Mann M. (2009) Lysine acetylation targets protein complexes and co-regulates major cellular functions. Science 325, 834–840 [DOI] [PubMed] [Google Scholar]
- 11. Hebert A. S., Dittenhafer-Reed K. E., Yu W., Bailey D. J., Selen E. S., Boersma M. D., Carson J. J., Tonelli M., Balloon A. J., Higbee A. J., Westphall M. S., Pagliarini D. J., Prolla T. A., Assadi-Porter F., Roy S., Denu J. M., Coon J. J. (2013) Calorie restriction and SIRT3 trigger global reprogramming of the mitochondrial protein acetylome. Mol. Cell 49, 186–199 [DOI] [PMC free article] [PubMed] [Google Scholar]
- 12. Lundby A., Lage K., Weinert B. T., Bekker-Jensen D. B., Secher A., Skovgaard T., Kelstrup C. D., Dmytriyev A., Choudhary C., Lundby C., Olsen J. V. (2012) Proteomic analysis of lysine acetylation sites in rat tissues reveals organ specificity and subcellular patterns. Cell Reports 2, 419–431 [DOI] [PMC free article] [PubMed] [Google Scholar]
- 13. Mertins P., Qiao J. W., Patel J., Udeshi N. D., Clauser K. R., Mani D. R., Burgess M. W., Gillette M. A., Jaffe J. D., Carr S. A. (2013) Integrated proteomic analysis of post-translational modifications by serial enrichment. Nat. Methods 10, 634–637 [DOI] [PMC free article] [PubMed] [Google Scholar]
- 14. Guan K. L., Yu W., Lin Y., Xiong Y., Zhao S. (2010) Generation of acetyllysine antibodies and affinity enrichment of acetylated peptides. Nat. Protocols 5, 1583–1595 [DOI] [PMC free article] [PubMed] [Google Scholar]
- 15. Udeshi N. D., Mertins P., Svinkina T., Carr S. A. (2013) Large-scale identification of ubiquitination sites by mass spectrometry. Nat. Protocols 8, 1950–1960 [DOI] [PMC free article] [PubMed] [Google Scholar]
- 16. Kim W., Bennett E. J., Huttlin E. L., Guo A., Li J., Possemato A., Sowa M. E., Rad R., Rush J., Comb M. J., Harper J. W., Gygi S. P. (2011) Systematic and quantitative assessment of the ubiquitin-modified proteome. Mol. Cell 44, 325–340 [DOI] [PMC free article] [PubMed] [Google Scholar]
- 17. D'Souza R. C., Knittle A. M., Nagaraj N., van Dinther M., Choudhary C., ten Dijke P., Mann M., Sharma K. (2014) Time-resolved dissection of early phosphoproteome and ensuing proteome changes in response to TGF-beta. Sci. Signaling 7, rs5. [DOI] [PubMed] [Google Scholar]
- 18. Huttlin E. L., Jedrychowski M. P., Elias J. E., Goswami T., Rad R., Beausoleil S. A., Villen J., Haas W., Sowa M. E., Gygi S. P. (2010) A tissue-specific atlas of mouse protein phosphorylation and expression. Cell 143, 1174–1189 [DOI] [PMC free article] [PubMed] [Google Scholar]
- 19. Zhang H., Zha X., Tan Y., Hornbeck P. V., Mastrangelo A. J., Alessi D. R., Polakiewicz R. D., Comb M. J. (2002) Phosphoprotein analysis using antibodies broadly reactive against phosphorylated motifs. J. Biol. Chem. 277, 39379–39387 [DOI] [PubMed] [Google Scholar]
- 20. Udeshi N. D., Svinkina T., Mertins P., Kuhn E., Mani D. R., Qiao J. W., Carr S. A. (2013) Refined preparation and use of anti-diglycine remnant (K-epsilon-GG) antibody enables routine quantification of 10,000s of ubiquitination sites in single proteomics experiments. Mol. Cell. Proteomics 12, 825–831 [DOI] [PMC free article] [PubMed] [Google Scholar]
- 21. Guo A., Gu H., Zhou J., Mulhern D., Wang Y., Lee K. A., Yang V., Aguiar M., Kornhauser J., Jia X., Ren J., Beausoleil S. A., Silva J. C., Vemulapalli V., Bedford M. T., Comb M. J. (2014) Immunoaffinity enrichment and mass spectrometry analysis of protein methylation. Mol. Cell. Proteomics 13, 372–387 [DOI] [PMC free article] [PubMed] [Google Scholar]
- 22. Cox J., Mann M. (2008) MaxQuant enables high peptide identification rates, individualized p.p.b.-range mass accuracies and proteome-wide protein quantification. Nat. Biotech. 26, 1367–1372 [DOI] [PubMed] [Google Scholar]
- 23. Cox J., Neuhauser N., Michalski A., Scheltema R. A., Olsen J. V., Mann M. (2011) Andromeda: a peptide search engine integrated into the MaxQuant environment. J. Proteome Res. 10, 1794–1805 [DOI] [PubMed] [Google Scholar]
- 24. Udeshi N. D., Mani D. R., Eisenhaure T., Mertins P., Jaffe J. D., Clauser K. R., Hacohen N., Carr S. A. (2012) Methods for quantification of in vivo changes in protein ubiquitination following proteasome and deubiquitinase inhibition. Mol. Cell. Proteomics 11, 148–159 [DOI] [PMC free article] [PubMed] [Google Scholar]
- 25. Smyth G. K. (2004) Linear models and empirical bayes methods for assessing differential expression in microarray experiments. Stati. Appl. Gen. Mol. Biol. 3, Article3 [DOI] [PubMed] [Google Scholar]
- 26. Huang D. W., Sherman B. T., Lempicki R. A. (2008) Systematic and integrative analysis of large gene lists using DAVID bioinformatics resources. Nat. Protocols 4, 44–57 [DOI] [PubMed] [Google Scholar]
- 27. Colaert N., Helsens K., Vandekerchove J., Gevaert K., Martens L., IceLogo Manual. Department of Medical Protein Research, Department of Biochemistry Ghent University, Ghent, Belgium [Google Scholar]
- 28. M., C. UniProt.ws: R Interface to UniProt Web Services. R package version 3.0.0
- 29. Reimand J., Arak T., Vilo J. (2011) g:Profiler–a web server for functional interpretation of gene lists (2011 update). Nucleic Acids Res. 39, W307–W315 [DOI] [PMC free article] [PubMed] [Google Scholar]
- 30. Kasprzyk A., Keefe D., Smedley D., London D., Spooner W., Melsopp C., Hammond M., Rocca-Serra P., Cox T., Birney E. (2004) EnsMart: a generic system for fast and flexible access to biological data. Genome Res. 14, 160–169 [DOI] [PMC free article] [PubMed] [Google Scholar]
- 31. Mertins P., Yang F., Liu T., Mani D. R., Petyuk V. A., Gillette M. A., Clauser K. R., Qiao J. W., Gritsenko M. A., Moore R. J., Levine D. A., Townsend R., Erdmann-Gilmore P., Snider J. E., Davies S. R., Ruggles K. V., Fenyo D., Kitchens R. T., Li S., Olvera N., Dao F., Rodriguez H., Chan D. W., Liebler D., White F., Rodland K. D., Mills G. B., Smith R. D., Paulovich A. G., Ellis M., Carr S. A. (2014) Ischemia in tumors induces early and sustained phosphorylation changes in stress kinase pathways but does not affect global protein levels. Mol. Cell. Proteomics 13, 1690–1704 [DOI] [PMC free article] [PubMed] [Google Scholar]
- 32. Rardin M. J., Newman J. C., Held J. M., Cusack M. P., Sorensen D. J., Li B., Schilling B., Mooney S. D., Kahn C. R., Verdin E., Gibson B. W. (2013) Label-free quantitative proteomics of the lysine acetylome in mitochondria identifies substrates of SIRT3 in metabolic pathways. Proc. Natl. Acad. Sci. USA 110, 6601–6606 [DOI] [PMC free article] [PubMed] [Google Scholar]
- 33. Sardiu M. E., Smith K. T., Groppe B. D., Gilmore J. M., Saraf A., Egidy R., Peak A., Seidel C. W., Florens L., Workman J. L., Washburn M. P. (2014) Suberoylanilide hydroxamic acid (SAHA)-induced dynamics of a human histone deacetylase protein interaction network. Mol. Cell. Proteomics 13, 3114–3125 [DOI] [PMC free article] [PubMed] [Google Scholar]
- 34. Xu G., Wang J., Wu Z., Qian L., Dai L., Wan X., Tan M., Zhao Y., Wu Y. (2014) SAHA regulates histone acetylation, butyrylation, and protein expression in neuroblastoma. J. Proteome Res. 13, 4211–4219 [DOI] [PubMed] [Google Scholar]
- 35. Weinert B. T., Wagner S. A., Horn H., Henriksen P., Liu W. R., Olsen J. V., Jensen L. J., Choudhary C. (2011) Proteome-wide mapping of the Drosophila acetylome demonstrates a high degree of conservation of lysine acetylation. Sci. Signaling 4, ra48. [DOI] [PubMed] [Google Scholar]
Associated Data
This section collects any data citations, data availability statements, or supplementary materials included in this article.