Abstract
The function of the majority of genes in the mouse and human genomes remains unknown. The mouse ES cell knockout resource provides a basis for characterisation of relationships between gene and phenotype. The EUMODIC consortium developed and validated robust methodologies for broad-based phenotyping of knockouts through a pipeline comprising 20 disease-orientated platforms. We developed novel statistical methods for pipeline design and data analysis aimed at detecting reproducible phenotypes with high power. We acquired phenotype data from 449 mutant alleles, representing 320 unique genes, of which half had no prior functional annotation. We captured data from over 27,000 mice finding that 83% of the mutant lines are phenodeviant, with 65% demonstrating pleiotropy. Surprisingly, we found significant differences in phenotype annotation according to zygosity. Novel phenotypes were uncovered for many genes with unknown function providing a powerful basis for hypothesis generation and further investigation in diverse systems.
Introduction
Phenotypic annotations of knockout mutants have been generated for about a third of the genes in the mouse genome1. However, the screening for phenotype is often dependent upon the expertise and interests of the investigator and in only a few cases has a broad-based assessment of phenotype been undertaken that encompasses developmental, biochemical, physiological, and organ systems2-4. Assessing and cataloguing pleiotropy5 will be critical if we are to begin to understand the contribution of each gene to metabolic pathways, physiological and organ systems and disease states, and interpret those contributions to health and disease. Importantly, our understanding of the role of loci identified in human genetics studies will be underpinned by phenotypic analyses in the mouse, which will inform further studies of genetic and physiological systems in humans. Thus, systematic efforts to undertake broad-based phenotyping of mouse mutants and inbred strains6,7 will be of great value to understand the genetic basis for phenotype and disease states.
It is recognized that any large-scale analysis of mammalian gene function by phenotyping of mouse mutants will require a number of important advances in phenotyping approaches, the scientific infrastructure to deliver large-scale robust datasets, and the development of data acquisition, analysis, and display tools2,3,8. The delivery of a comprehensive functional annotation of mouse genes is beyond the infrastructure and capacity of a single centre, and a multi-centric approach will be required. It is therefore vital to develop a phenotyping pipeline that has been validated across multiple-centres and is robust to changes in time and place. The EUMORPHIA programme reported the development of a set of robust phenotyping tests9 that was validated across our consortium and has subsequently been used in a variety of phenotyping projects. The EMPReSS database10 catalogues the standard operating procedures (SOPs) that were developed, including operational details and the parameters measured. More recently, a significant single centre effort to analyse several hundred knockout lines through a phenotyping pipeline has illuminated the pleiotropy that can be revealed and the opportunities to uncover novel gene function7.
The EMPReSS SOPs are the foundation for future large-scale phenotyping efforts, and the EUMODIC consortium have used a subset of these procedures to undertake a multi-centre, broad-based phenotyping effort to characterize the phenotypes of 449 mouse mutant alleles. We report the application of statistical approaches to the development of experimental design that maximizes the power to detect abnormal phenotypes. We apply novel Bayesian statistical methodologies for the analysis of the phenotype data acquired, with the aim of controlling the false discovery rate (FDR) and providing robust abnormal phenotype data at high confidence. In summary, we have developed both experimental and statistical approaches for high-throughput, broad-based phenotyping and report here our first multi-centre effort to catalogue and analyse phenotypes for 320 mouse genes. These approaches reveal extensive pleiotropy, along with a high discovery rate of abnormal phenotypes for genes with no prior annotation. Moreover, for a number of lines we were able to compare phenotype annotations for homozygotes and heterozygotes, revealing significant differences in phenotype annotation according to zygosity.
Results
The phenotyping pipeline
We have employed the EMPReSSslim pipeline for high-throughput phenotyping analysis, which was developed under the EUMORPHIA programme9 and incorporates a standardised and validated set of tests underpinned by SOPs10. EMPReSSslim (Supplementary Figure 1) comprises two pipelines each incorporating different tests with a separate cohort of mice analysed in each pipeline. EMPReSSslim encompasses 20 phenotyping tests, capturing 413 parameters. The phenotyping tests chosen cover a variety of disease and biological systems including metabolic, cardiovascular, bone, neurological, behavioural, sensory, haematological and clinical chemistry.
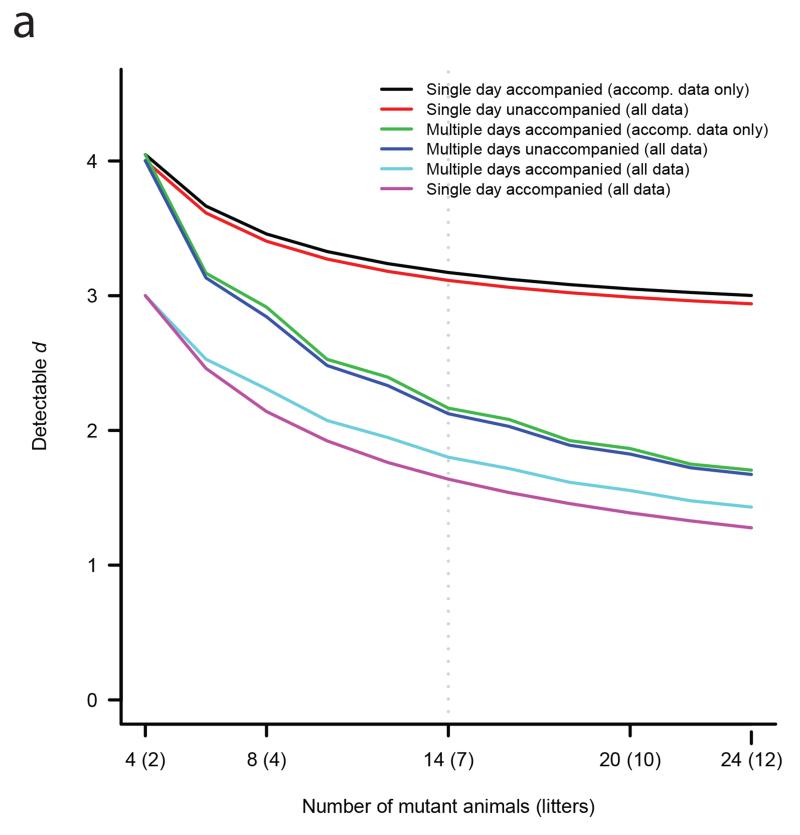
A statistical power analysis was performed to quantify the mutant-genotype standardized effect size, d, that would be detectable under a variety of experimental workflows and analysis methods, where is the absolute difference between mutant and baseline means scaled in units of the phenotypic standard deviation; calculations were based on attaining 80% power under a frequentist linear model with correlated observations (resulting from day and litter effects) at a significance level of 10−7 estimated to control the FDR at 5% (Figure 1a, Supplementary Figure 2, Supplementary Figure 3 and Supplementary Note). This analysis demonstrated that considerable power is to be gained, first by including, as was the practice in EUMODIC, the entire set of baseline data (control C57BL/6N wild type animals) in the analysis, and second by phenotyping baseline animals on the same days as mutants, which was achieved for approximately 71% of the data. Given these two conditions are met, there is little difference in detectable effect size between phenotyping mutants on a single day (the case for 32% of lines) or across multiple days (68%).
Figure 1a. Effect size versus sample size.
Detectable standardized effect size, d, as a function of sample size, under a variety of experimental workflows and analysis approaches (identified in legend). The two qualitative design choices under consideration were: whether mutant animals were phenotyped across multiple days with four animals per day, or all on a single day; and whether baseline animals were phenotyped on the same day(s) as mutants (i.e. whether the mutants were accompanied). Two analytical approaches were compared: analysis of all baseline data (all data); versus analysis restricted to baseline data from animals phenotyped on the same day(s) as mutants (accompanying data only). Calculations were based on attaining 80% power while controlling the FDR at 5%. The variance components used in the power calculations were taken as the average estimates across all parameters and procedures: the variance proportion for day effect was 0.18, for the litter effect 0.12 and for the residual effect 0.69 (Supplementary Figure 2 shows similar plots for procedure-specific variance components).
In EUMODIC we utilized a cohort sample size of 14, consisting of 7 males and 7 females. Under the most powerful design-analysis combination in Figure 1a, increasing the sample size from 14 to 20 animals would decrease detectable d from 1.64 to 1.39 (a 15% improvement), whilst decreasing the sample size from 14 to 8 would increase d from 1.64 to 2.14 (a 31% increase) illustrating that only a relatively small decrease in detectable effect size would be attained by increasing the sample size above 14. In establishing a minimum target number of baseline animals, we propose at least 50 days with animals from two or more litters represented on each day since this provided relatively precise estimation of variance components in the multilevel model (Supplementary Figure 3). In power calculations, a reduction in the number of baseline days from 100 to 50 only increased the estimated detectable d from 1.64 to 1.68 (a 3% increase).
Generation of mouse mutants and assessment of viability and fertility
Embryonic stem (ES) cell lines from the EUCOMM resource were injected to generate chimaeras11, and following the recovery of germ-line transmitting progeny, for the majority of lines heterozygotes were intercrossed to produce homozygous mutants. Of the lines analysed (303), 187 heterozygotes were intercrossed and homozygous viability assessed. Where we failed to recover homozygotes from heterozygote intercrosses in sufficient numbers we classified the mutation as either embryonic lethal (no homozygotes recovered from 28 progeny) or subviable (≤13% of 28 progeny). We found that in total 65 lines (34.8%) of homozygous mutants were embryonic lethal, while 22 lines were subviable (11.8%). Four lines (2.1%) showed a reduced lifespan (defined as death after weaning and before normal lifespan). Where homozygotes were embryonic lethal or subviable we analysed heterozygotes through EMPReSSslim. For many of the viable homozygote lines we also assessed fertility. Of the 153 lines investigated we found that 2.6% (4/153) showed reduced fertility, 1 of which was in both males and females and 1 in females and 2 in males. To test the applicability of new methods we also analysed a number of additional mutant lines, including N-ethyl-N-nitrosourea (ENU) mutations and other targeted mutations and gene traps. In many cases these were analysed as heterozygotes and the appropriate background strain was utilised as a wild-type control (see Methods).
Phenotype data acquisition and analysis
Data from mutants and controls analysed through EMPReSSslim were captured in the EuroPhenome database12. In addition, the data has been incorporated into the IMPC (International Mouse Phenotyping Consortium) portal13. We have developed and implemented statistical models incorporating a broad-range of characteristics common to high-throughput mouse phenotyping data, such as non-Gaussian response distributions, complex correlation structure, confounding variables, systematic drift in measurements over time, outliers and other data anomalies (see Methods and Supplementary Note).
Phenotyping variance
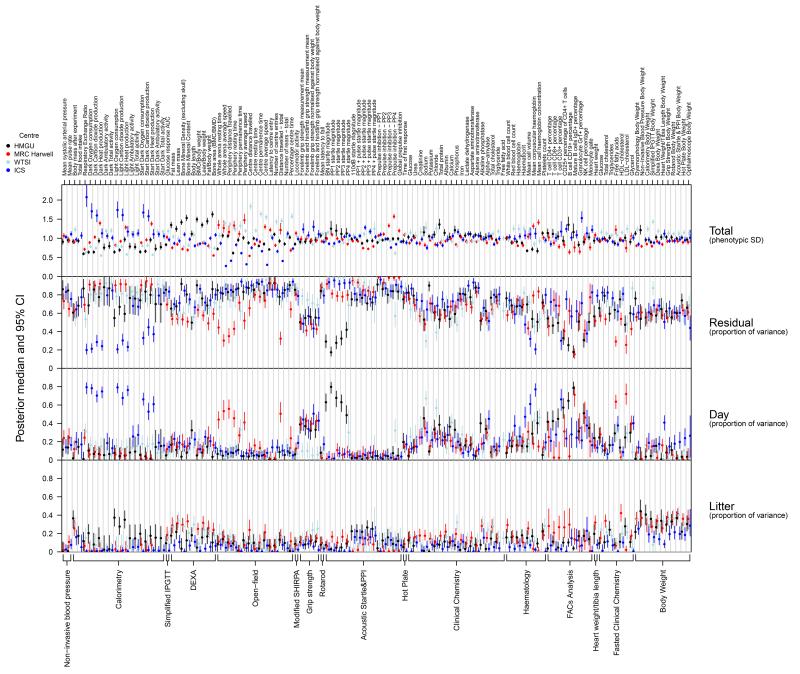
The potential for differences in phenotyping variance across centres on C57BL/6N control animals was explored by estimating variance components underlying each transformed quantitative parameter (Supplementary Figure 1). The total phenotyping variance varied considerably across centres at some parameters, but this variation can only be viewed as a potential indication of more or less precise experimental measurement, because of differences in equipment, and hence in measurement scale, across centres. In order to examine scale-free measures of variation, we estimated the proportion of phenotyping variance attributable to day, litter, and residual effects, which had averages across all parameters of 18%, 12%, and 69% respectively. Of the three variance proportions, litter and residual are substantially comprised of biological variation between litters or between animals. In contrast the day variance proportion is mainly driven by unmodelled experimental variation, and can therefore indicate where experimental procedures could potentially be improved. The day variance proportion was on occasion systematically higher in a particular centre, e.g. some calorimetry parameters at ICS, some open-field parameters at Harwell, and some acoustic-startle parameters at HMGU, with these typically reflecting a day’s worth of outlying baseline data. For some procedures the day variance proportion was generally smaller at some centres compared to others, potentially reflecting more consistent experimental protocol at those centres. Reflecting the inter-centre differences in variance observed, data analyses to identify statistically significant phenotypes were restricted to within-centre comparisons between controls and mutants.
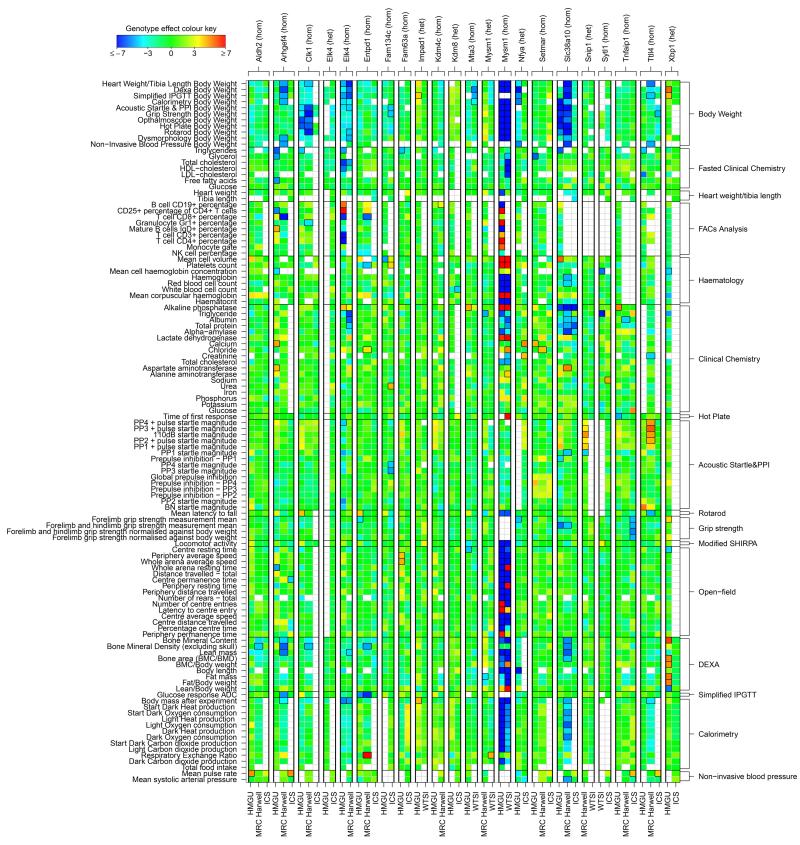
Most importantly, EUMODIC analysed a large set of 22 common reference mutant lines across the multiple centres to examine the inter-centre reproducibility of phenotyping tests (Figure 3). For each line phenotyped at two or more centres, we compared estimates of the genotype effect across centres at each parameter both visually (Figure 3 and Supplementary Figure 4 and Supplementary Figure 5) and using meta-analytical measures of heterogeneity14. The lines were found to exhibit high levels of inter-centre phenotypic heterogeneity in approximately 9% of comparisons (using the threshold I2 > 0.75) and statistically significant heterogeneity in 7% of comparisons (Cochran’s Q test at FDR < 5%). There was estimated to be no heterogeneity in 62% of cases (I2 = 0), so, while there was considerable discordance in about 8% of comparisons, inter-centre consistency was observed in the majority of instances. As illustrated in Figure 3 and S4, relatively extreme phenotypic perturbations demonstrated by, for example, Mysm1 are reproducibly annotated across two or more centres, whereas a number of other genes’ effect sizes are weaker and less reproducibly detected across centres, consistent with there being reduced power to detect smaller effects. Indeed, of 183 instances of a line being annotated in at least one of the (two or three) centres, 61 (33%) were annotated concordantly in more than one centre. However, when effect estimates were compared across pairs of centres for which a call was made in one centre but not the other, 158 out of 222 cases (71%; exact binomial one-tailed p = 1.2e-10) displayed genotype effect estimates in the same direction (Supplementary Figure 5). Overall, the data from the reference lines highlight the concordance of the data between centres, while emphasising the possibility of false negative results.
Figure 3. Heatmap of annotations of reference lines.
Reference line comparison of annotations across centres. Colours represent scaled genotype effect (posterior median / SD), with blue/red indicating a decreased/increased mutant phenotype relative to baseline animals. Significant annotations (FDR < 5%) are indicated by a black outline around the corresponding rectangle.
Phenotype annotations from 449 mutant lines
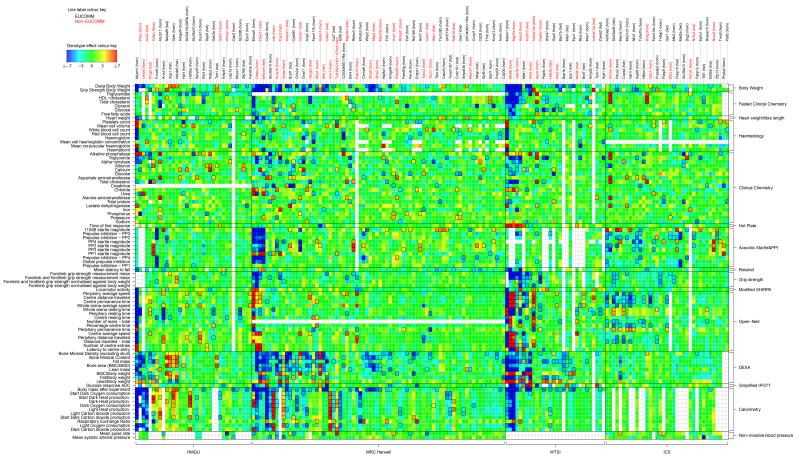
To date, we have phenotyped 449 mouse mutant alleles and accumulated phenotype data on 27,707 mice. In total, we generated 9,019,984 data points and ascribed 2,947 phenotype annotations to 320 genes. A global representation of the significant and non-significant phenotypes in Figure 4 enables us to visualise consistent trends in significant hits across centres. In addition, this global heatmap highlights a number of lines with multiple hits across tests (e.g. acoustic startle and open field) and within a single test (e.g. DEXA) as would be expected from a test measuring different aspects of the same phenotype. Moreover, it is apparent from the heatmaps that broad phenotypic effects are often, but not always, associated with a body-weight phenotype.
Figure 4. Heatmap of annotations of complete dataset.
Heatmap of annotations. Colours represent scaled genotype effect (posterior median / SD), with blue/red indicating a decreased/increased mutant phenotype relative to baseline animals. Significant annotations (FDR < 5%) are indicated by a black outline around the corresponding rectangle. Labels for non-EUCOMM lines are in red. For legibility, the heatmap only displays a subset of parameters for those lines with at least three annotations.
We identified 2,316 non-body-weight parameter annotations at an estimated annotation FDR of 2.2%. We found that 374 of the 449 mouse mutant alleles representing 320 genes (83%) showed at least one parameter annotation, at an estimated line FDR of 11%. Multiple testing across several hundred parameters within a line causes the line FDR (11%) to be greater than the annotation FDR (2.2%). 133 of 448 lines (30%) were found to have at least one body-weight parameter annotated, at an estimated line FDR of 5%. 65% of lines (290/449) had more than one phenotypic hit. Overall, pleiotropy is effectively revealed with the pipelines utilised.
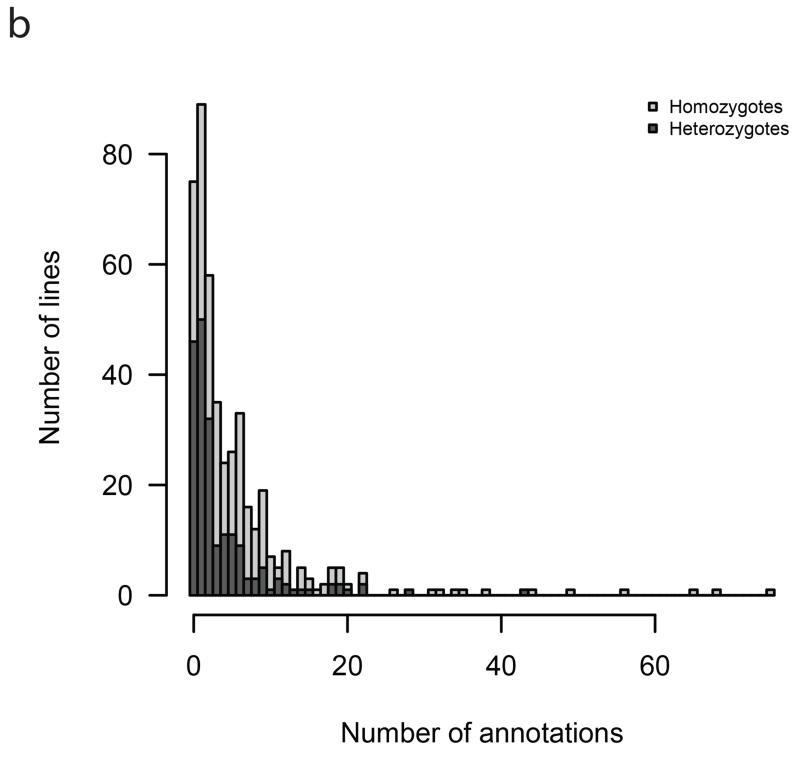
We also analysed hit rates according to zygosity. The proportion of lines with at least one annotation was higher for homozygotes at 88% (219 out of 248 mutant lines tested) than for heterozygotes at 77% (151 of 197 tested), with this difference statistically significant (Chi-square test p = 0.002) (Figure 1b). The mean number of annotations was 8.3 (SE = 0.8) for homozygotes, significantly higher than the 4.4 (SE = 0.5) for heterozygotes (negative-binomial GLM, Wald test p = 6e-7). Nevertheless, the high hit rate for heterozygotes underscores the utility of phenotyping heterozygotes and adds to the catalogue of dosage-sensitive genes.
Figure 1b. Histogram of number of annotations per line.
Histogram of number of annotations per line, with each bar split by colour into counts arising from homozygous and heterozygous lines.
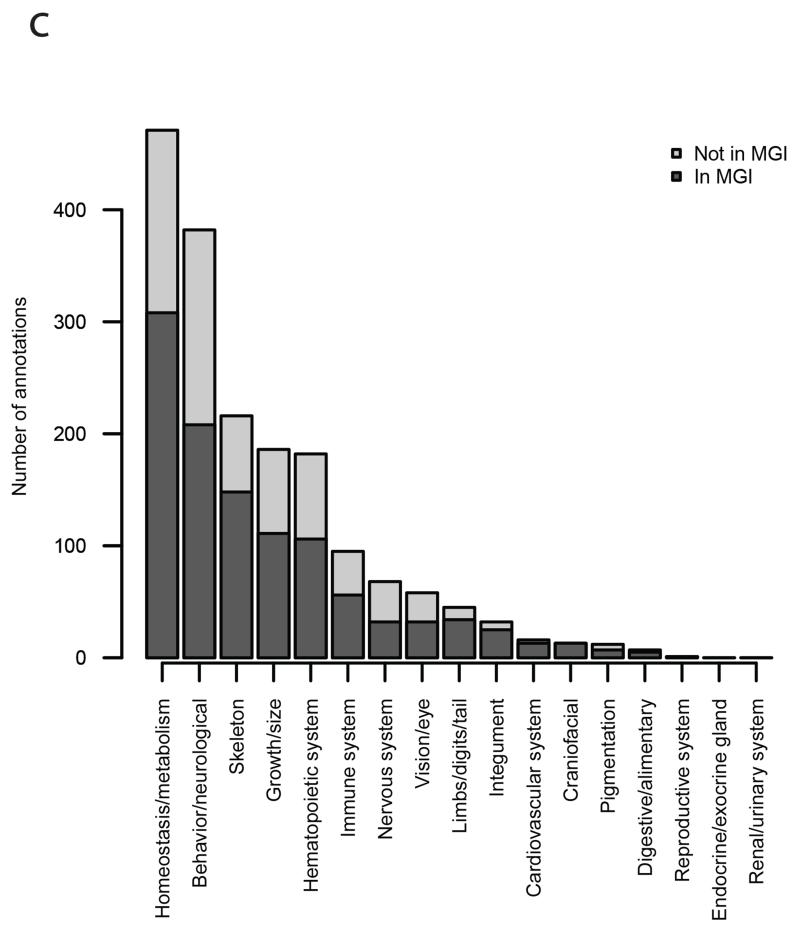
Finally, we assessed the performance of each individual phenotyping test by computing the hit rate for each procedure (Supplementary Figure 6). First, as expected, the overall hit rates across tests showed considerable variation, ranging from clinical chemistry (33%) and body weight (29%) to hot plate (4%) and heart weight/tibia length (3%). The distribution of phenotype outputs is similarly reflected in the number of annotations per top level Mammalian Phenotype (MP) ontology term (Figure 1c). Second, there were significant differences in hit rates across centres at 13 of the 20 tests (Fisher’s exact test controlling FDR ≤ 5%), with the tendency for hit rates to be relatively high at MRC-Harwell and WTSI, and lower at ICS (Supplementary Figure 6). Variation in hit rates across centres is unsurprising given that a subset of mutant lines, mainly non-EUCOMM, was selected on the basis of pre-existing phenotypic information in some centres. Phenotypically selected lines are more likely to have broad-effect phenotypes, particularly when pleiotropy is taken into account. The gene-choice effect is illustrated in Figure 4, where a relatively small number of lines, preferentially non-EUCOMM (labelled in red), contribute strongly to the sets of annotations at MRC- Harwell and WTSI, and to a lesser extent at HMGU. At ICS, however, where non-EUCOMM lines were selected at random with respect to phenotype, there is a lower annotation rate (Figure 4 and Supplementary Table 1). While we attribute differences mainly to the gene-choice effect, we investigated the alternative explanation that differences in phenotyping across centres could lead to variation in power and thus hit rate (Figure 2 and Supplementary Data Set). Differences in sample size, unmodelled variation in baseline animals, and heterogeneity in phenotyping variance (particularly the day variance proportion) explained hit rate variation at a few particular parameters, but the extent of these effects was minor relative to the global impact of gene choice.
Figure 1c. Histogram of number of annotation in each top level MP term.
Histogram of number of annotations within each top-level MP ontology term, with each bar split by colour into numbers arising from mutant lines with or without annotations in MGI.
Figure 2. Phenotyping variance.
Comparison of estimated variance components across centres. Posterior median (with error bars indicating 95% credible intervals) of total phenotypic SD (top panel), and proportions of variance (bottom three panels), are shown for each quantitative parameter, labelled top, within each test, labelled bottom. For visual comparison the total phenotypic SDs at each test were scaled multiplicatively to a mean of 1.
Homozygote and heterozygote comparisons
For 43 of the mutant genes, we analysed both homozygotes and heterozygotes to compare phenotype outputs according to zygosity. The heterozygotes accumulated 101 parameter annotations compared to 410 for homozygotes. We found 53 annotations held in common between heterozygotes and homozygotes, which were confined to 11 of the 43 lines. Interestingly, we found that effect sizes when identified in both homozygotes and heterozygotes tended to be stronger in homozygotes (Supplementary Figure 7).
Phenotype Similarity to published datasets
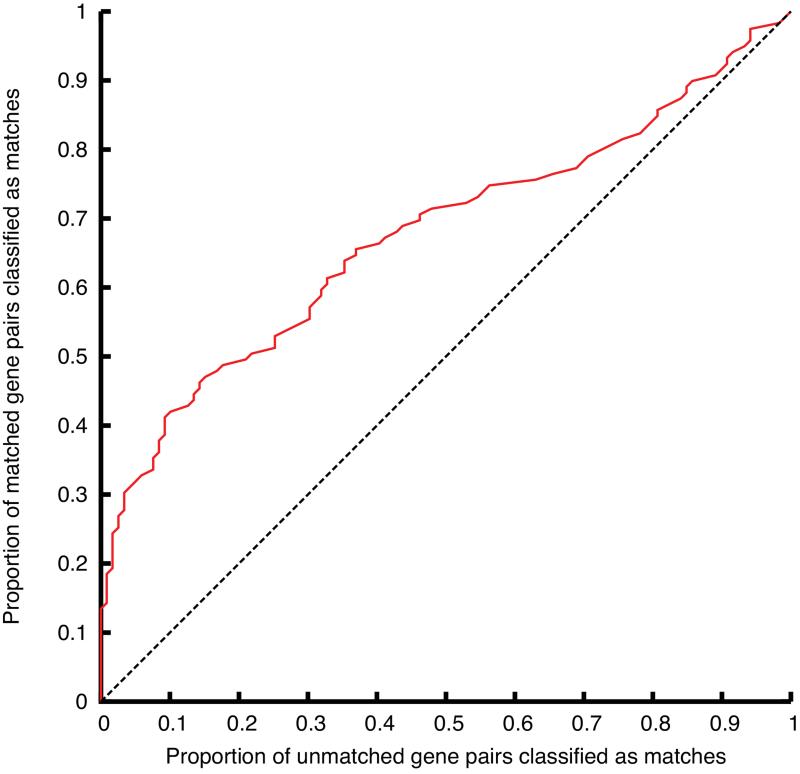
We assessed phenotype similarity between the EUMODIC dataset and phenotypes observed with genes in the MGI database. We investigated the ability to classify EUMODIC-MGI gene pairs into matched or unmatched on the basis of phenotype similarity (Figure 5), and found phenotypes observed in EUMODIC to be significantly more similar to the MGI literature-curated phenotypes of alleles of the same gene than they are to alleles of different genes (p = 0.00048; see Methods).
Figure 5. Phenotyping similarity.
Classification of EUMODIC-MGI gene pairs into matched or unmatched on the basis of phenotype similarity. The Receiver Operating Characteristic (ROC) curve plots the proportion of (EUMODIC-MGI) matched gene pairs correctly classified as matched against the proportion of unmatched gene pairs incorrectly classified as matched, as the phenotype-similarity threshold is varied (ROC area under curve 0.674).
Novel gene function identified
Aside from genes with existing phenotype annotations, we analysed a large class of genes with no prior annotations (see Methods). Around half of the genes analysed (179) had no prior annotations in the MGI curated database. We found that for 87.9% (152/179) of the genes in this class we were able to find significant phenotypes. This discovery rate is similar to the overall discovery rate for all mutants in the EMPReSSslim pipeline, demonstrating that the pipeline is efficient at uncovering phenotypes in mutants with phenotype-poor annotations as well as phenotype-rich annotations.
For the class of genes with no-prior annotations, we have undertaken an analysis to identify if these novel mouse models can provide knowledge about the functional role of human GWAS-discovered loci, rare disease genes, and genes associated with human genetic disorders in OMIM15. Of the 152 genes with significant phenotypes identified by EUMODIC, 21 were orthologs for rare disease genes in Orphanet16, 20 for genetic disorders in OMIM, and 36 associated with GWAS loci (see Methods). We investigated if the phenotype data from the mouse demonstrated concordance with the human disease data (see Methods). Of the 42 unique human disease genes, 14 showed a correlation with the mouse (Supplementary Table 2) demonstrating that these novel mouse models recapitulate phenotypes which correlate with the human disease and in a number of cases add functional data to known human diseases. In addition this demonstrates that these mouse models are a valuable resource for studying the function of novel genes.
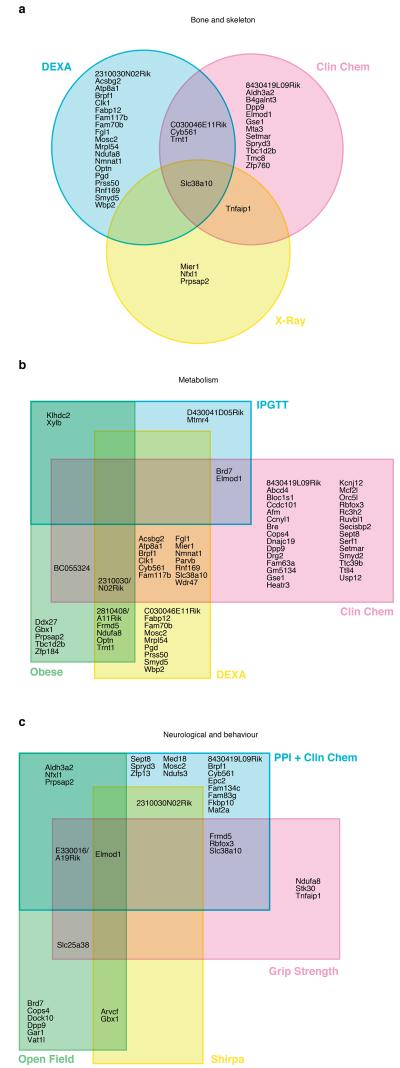
To further investigate the role of these novel and uncharacterised genes in disease, we examined three disease areas: 1) metabolism including diabetes/obesity; 2) bone and skeleton; and 3) neurological and behavioural disorders to identify if the significant phenotype hits in mouse can either singly or in combination indicate a potential disease model. In each case, we identified combinations of tests, where a phenotype hit would be indicative of the relevant disease correlate. Subsequently, we analysed our set of genes with no prior annotations for phenotype hits in each test class and plotted each gene with one or more hits on a Venn diagram (see Figure 6). Our expectation is that genes with multiple hits represent interesting candidates for further exploration and validation. For each disease area, we have identified a large number of interesting candidate disease genes with a number that have impacts upon diverse disease areas.
Figure 6. Analysis of genes with no prior annotations.
The Venn diagrams illustrate the distribution of genes with relevant phenotype hits in three disease areas – (a) bone and skeleton; (b) metabolism; (c) neurological and behaviour. For each area, we identified combinations of tests, where a phenotype hit would be indicative of the relevant disease correlate and assigned genes accordingly. A total of 94 genes were identified across the three disease areas.
69 genes displayed highly significant effects on metabolic parameters, identifying a number of novel metabolic loci. For example, Elmod1, a gene with no existing functional information showed reduced fasted blood glucose concentration and area under the glucose response curve, reduced concentrations of various blood lipids and reduced body weight.
Classification of genes according to bone and skeletal parameters revealed 39 genes, including the solute carrier Scl38a10 that has already been reported as an interesting candidate bone disease gene17. Our analysis of the EUMODIC dataset reveals Scl38a10 as a significant hit in the Neurological/Behavioural domain, providing a typical example of the pleiotropy that is observed by utilising the phenotyping pipeline. Of the 45 genes in the Neurological/Behavioural domain, we identified many candidate disease genes. Interestingly, Elmod1 showed increased activity (as measured in open field and SHIRPA), a lack of fluidity in gait, and increased frequency of trunk curling, reduced grip strength, reduced acoustic startle in one amplitude, and reduced pre-pulse inhibition across multiple amplitudes.
Discussion
We have demonstrated the feasibility of multi-centre, large-scale, broad-based phenotyping of mutant mouse lines for the generation of rich and novel phenotypic information. There were a number of novel experimental and statistical developments that were required in order to undertake a multi-centric approach to large-scale phenotyping of mouse mutants.
First, a multi-centre approach requires the use of robust, validated phenotyping tests and EUMODIC employed the EMPReSS procedures in a common phenotyping pipeline, EMPReSSslim. In using these procedures, we undertook a statistical power analysis of experimental design to determine the impact upon mutant-genotype effect size under a variety of experimental workflows and analysis methods. This underscored the utility of employing the entire control baseline set and the phenotyping of baseline animals on the same day as mutants. This analysis also indicated that reasonable power was provided by cohort sample sizes of 14, with only modest power enhancements if cohort size was increased. Nevertheless, increased power would potentially enhance inter-centre reproducibility (see below).
Second, we developed and implemented novel statistical models that addressed many of the features of large-scale, multivariate mouse phenotyping datasets, aiming to ensure the reproducibility of phenotype calls via a permutation-based control of the FDR. In carrying out this analysis, we examined the phenotyping variance attributable to day, litter, and residual effects. While litter and residual effects reflect the biological variation between litter and animals, the day variation reflects experimental variation and revealed higher or lower variance for some tests at some centres. These analyses allow us to consider unwanted variation underlying the reproducibility of phenotyping protocols and feed forward into test improvements in the future.
Third, we employed 22 reference lines to directly test inter-centre reproducibility. We found high levels of inter-centre phenotypic heterogeneity in only 9% of comparisons, whereas in contrast for 62% of parameters no heterogeneity was observed. This indicates the high level of concordance exhibited for phenotyping tests across centres.
The analysis of the EUMODIC dataset demonstrated a significant number of pleiotropic lines with 65% (290/449) having more than one phenotype hit. A large number of lines (30% at an FDR of 5%) had at least one body-weight parameter annotated, and it is noteworthy that there is strong association between non-body-weight annotations, and annotations to body-weight parameters (see Fig. 4). Thus body weight is a potential early marker for pleiotropic phenotypic effects.
Intriguingly, we found a high hit rate for heterozygotes (77%), though the hit rates for homozygotes were significantly higher than heterozygotes. Thus, analysis of heterozygotes further enriches the dataset, and provides information on dosage-sensitive loci and their phenotypic effects. In this regard, the comparisons of the 43 lines where both homozygotes and heterozygotes have been analysed revealed that, while a considerable number of annotations were shared, we unexpectedly found a number of annotations specific to heterozygotes. These data implies significant differences in pathway outcomes from the loss of a single versus two copies of each gene and these dosage-sensitive annotations will merit further investigation. Such studies will potentially have a bearing on our wider understanding of haploinsufficiency and its contribution to disease in the human population18.
The phenotype hit rates for genes without any prior annotation underline the value of the broad-based phenotyping and analysis methodologies that we developed. We extended the analysis of this class of genes, aiming to identify novel candidate disease genes. For three disease areas (metabolism; bone and skeleton; neurological and behaviour) we identified parameter sets that would be indicative of the relevant disease correlate, and assigned genes with appropriate hits to different disease areas. We identified a large number of genes (94) with single or multiple hits across the parameter sets. Some genes were exclusive to an individual disease area, while others had hits in multiple disease areas reflecting the underlying pleiotropy that was revealed by the programme.
Importantly, we uncovered novel candidate disease genes that merited further investigation. One such gene, Elmod1, belongs to the large class of genes expressed in the brain for which there is little if any functional information (the so-called “ignorome” 19). Many of these genes are indistinguishable from well-studied genes in terms of network connectivity or other protein characteristics. Elmod1 has recently been shown to be involved in auditory function20, but no other functional attributes have been determined. However Elmod1 is associated with a strong cis-eQTL for brain expression, including regional brain expression. Moreover, variation in locomotor activity is known to map in the region of the Elmod1 locus on chromosome 9. Using the EUMODIC pipeline we have been able to demonstrate the function of Elmod1 in several behavioural traits. Importantly, we have also shown that the Elmod1 mutant displays a number of metabolic traits, further elaborating the functional characterisation of this largely unexplored locus. This analysis underscores the diversity of hypotheses that might be generated from the development of a genome-wide dataset.
In summary, the work described here demonstrates the utility of scaling phenotyping efforts from hundreds to thousands of mouse mutants as the international mouse genetics community embarks upon the comprehensive annotation of all the protein-coding genes in the mouse genome8. Most importantly, it provides fundamental insights into the experimental design and statistical analyses that will underpin large multi-centre programmes to gather and analyse robust phenotype data. As such, the work reported here paves the way towards a reference resource with a well-defined series of mutant alleles and a broad-based phenotyping dataset accessible to the scientific community for further in-depth characterization.
Methods
Mouse production
Targeted ES cell clones obtained from the EUCOMM cell repository (EuMMCR) were injected into BALB/cAnN or C57BL/6J blastocysts for chimaera generation. The resultant chimaeras were mated to C57BL/6NTac mice and the progeny screened to confirm germline transmission. As part of the original targeting strategy the ES cell clones were derived from one of four different C57BL/6N parental cell lines, namely JM8.F6, JM8.N4, JM8A3.N1, and JM8A1.N3. The JM8A3.N1 and JM8A1.N3 cell lines had been subjected to targeted repair in order to correct the non-agouti allele 1.
Mice carrying targeted mutations were bred to C57BL/6NTac mice prior to the intercrossing of heterozygote carriers. Cohorts of at least 7 homozygote mice of each sex per pipeline were generated by the most effective breeding scheme dependent on the mutant line and the mice available. If no homozygotes were obtained from 28 or more offspring from heterozygous intercrosses, the line was deemed nonviable. Similarly, if less than 13% of intercross pups were homozygous, the line was judged as being subviable. In both circumstances heterozygote mice were committed to the phenotyping pipelines. The fertility of both sexes of each line was also assessed during cohort generation. Mutant lines failing to produce any live pups when at least four homozygotes of either sex were mated with a non-homozygote animal were assessed as sub-fertile. Phenotype cohorts were obtained from sub-fertile lines by breeding heterozygotes of the affected sex.
Since both wild-type and mutant cohorts are analysed through the phenotyping pipeline, the randomization of allocation of animals to experimental groups is not relevant. Although randomization is not employed there is no preferential selection of stock, either mutant or wild-type, for phenotyping. Reflecting the high-throughput nature of the phenotyping pipeline, blinding of mutant lines during phenotyping was not employed. However, the effect of operator bias was a quality control step that was performed during data analysis.
The targeted alleles were validated by conventional PCR for the presence of the 3’-loxP site and by non-radioactive Southern blot with neo or lacZ probes for accuracy of homologous recombination events. Whenever sequences permitted, 2 different enzymes were employed for each arm. A number of other existing mutant lines, including ENU mutations, other targeted alleles, and gene traps were bred and analysed through the EMPReSSslim pipeline. In total, mice were bred from 449 lines for phenotyping, of which 334 were EUCOMM lines. The total numbers generated and analysed at each centre were: HMGU, 101; MRC Harwell, 141; WTSI, 72; ICS, 136. In addition, 13 lines were analysed through EMPReSSslim at TCP.
EUMODIC institutes who collect phenotyping data are guided by their own ethical review panels, licenses, and accrediting bodies that reflect the national legislation to which they operate. The details of their ethical review bodies and licenses are detailed below. All efforts were made to minimize suffering by considerate housing and husbandry. All phenotyping procedures were examined for potential refinements that were disseminated throughout the consortium. Animal welfare was assessed routinely for all mice involved.
Institute: GMC Helmholtz Zentrum München; Ethics committee: Regierung von Oberbayern; Approval Licence: 2532
Institute: MRC Harwell Ethics committee: Animal Welfare and Ethical review Board (AWERB); Approval Licence: PPL 30/2380, PPL 30/2890
Institute: WTSI Wellcome Trust Sanger Institute; Ethics committee: Animal Welfare and Ethical review Board (AWERB); Approval Licence: PPL 80/2076; PPL 80/2485
Institute: ICS Mouse Clinical Institute;Ethics Committee: Com’Eth. (CNREAn°17) for the Ministry of Research ; Approval licences: internal numbers 2012-009 & 2014-024
Data capture by EuroPhenome
The EMPReSS database 10 incorporates both SOPs, measured data parameters, and metadata from the EMPReSSlim pipelines. In addition, EMPReSS stores the mammalian phenotype ontology annotations for the majority of parameters i.e. the expected phenotype that would be identified if the mutant is statistically different from the control. All of the data in EMPReSS has now been migrated to the newer international version of the database called IMPReSS, which holds all of the IMPC standardized phenotyping protocols. Further details on the implementation of the ARRIVE guidelines in EUMODIC and IMPC are described in Karp et.al.2. Data generated from EMPReSSlim by the four centres are stored in their local LIMS, backed by diverse database schemas running on different relational database management systems. The phenotyping data collected in each centre was guided by their own ethical review panels and licenses applicable to each countries regulation. The data is transferred to EuroPhenome in a common standardised format. To assist in data export and improve standardization and data consistency EuroPhenome provided a java library or data export. The informaticians at the centres use the library to represent the data to be exported as an object model. The library then performs the necessary validation against the European Mouse Phenotyping Resource for Standardized Screens (EMPReSS) database and the schema. If this is successful the data are output to XML, compressed and placed on a file transfer protocol (FTP) site.
Each centre’s FTP site is regularly checked by the EuroPhenome data capture system and any new files are uploaded. The data is again verified against the schema and EMPReSS, and further checked for consistency against existing data within EuroPhenome. The results of the upload and validation are provided to the sites in the form of XML log files and a web interface, the EuroPhenome Tracker. If validation is successful the data is loaded into the EuroPhenome database. Data can be removed from the database by placing the files in the delete directory of the FTP site. The same process is employed to capture and validate the data prior to removal. The informatics architecture that supported EUMODIC has now been enhanced to support the larger IMPC project.
Statistical Analysis
Bayesian linear and logistic multilevel regression models were applied to each transformed quantitative or dichotomized categorical phenotype at each centre, with all baseline data at a centre being included in the analysis. Sex, strain, litter, day, and other experimental metadata (such as the equipment used and certain details of the procedure, such as how blood samples were handled) were included as covariates, and a penalized spline was incorporated to account for systematic changes in the baseline mean over time. Day and litter effects were modelled hierarchically with variance components to allow for phenotypic correlation amongst groups of animals. The posterior evidence for a non-zero mutant genotype effect was summarised and used as a test statistic, and significance thresholds chosen via a permutation-based approach to control the false discovery rate at 5% for each test at each centre (see Supplementary Note). R code to generate the results is available on request.
Phenotype Similarity
We use the PhenomeNET3 system to compute the semantic similarity between phenotypes observed in EUMODIC, and phenotypes observed with alleles of the same genes in the MGI database. The data from the EUMODIC alleles was excluded from the MGI database for this analysis. To compare sets of phenotypes (either associated with a disease, or observed in a mouse model) in PhenomeNET, we use the set-based simGIC semantic similarity measure. simGIC is a Jaccard-index weighted with information content, and comparing sets closed against the super-class relation. To compute the phenotypic similarity between the phenotypes observed in EUMODIC and phenotypes observed with alleles of the same genes in the MGI database we search MGI for the same unique gene identifier as in the EUMODIC dataset excluding all data integrated into MGI from EUMODIC. We tested the null hypothesis that phenotypic similarity between EUMODIC and MGI lines was independent of whether the lines relate to the same or different genes. To do this, for each EUMODIC gene we ranked all MGI genes according to their phenotypic similarity to that gene, thereby yielding a rank (between 1 and 9821, i.e. the number of MGI genes) for each EUMODIC-MGI gene pair. We then performed a Wilcoxon rank-sum test comparing the distribution of ranks for matching EUMODIC-MGI gene pairs against the distribution for non-matching gene pairs.
Analysis of genes with no prior annotations
A subset of the genes with significant phenotype annotations were identified as having no prior annotation if they had no corresponding alleles in the MGI dataset with curated phenotype from the literature. While performing this analysis, the data from this project and the WTSI project have been incorporated into MGI, so these gene-allele combinations now show phenotypic annotations from these projects but remain without annotations from literature. Two methods were implemented to study this set of ‘novel’ genes.
The first analysis, identified orthologous human genes to the mouse genes in Ensembl v764. Three datasets (GWAS-central5, Orphanet, and OMIM) were then mined to search for human diseases associated to these genes6. All diseases with associations to these genes were extracted from Orphanet and OMIM. In order to limit our focus to robust statistical associations in GWAS-central, we extracted data on associations with p-values <10−5. In order to find phenotype correlations between our novel mouse phenotypes and human disease we adopted a phenotype-centric approach. For all the retrieved human datasets we mapped the phenotypic term to MESH terms using the NIH MeSH Browser7. In order to find equivalent mouse phenotypes we manually mapped the higher level MeSH term to the corresponding higher-level Mammalian Phenotype Ontology (MPO) term. Previous work has created hierarchical systems to integrate phenotype ontologies across species, but with this dataset we found this automated approach problematic to adopt a manual process.
Secondly, in collaboration with experts in the domain and literature, three groups of phenotypic annotations were selected as representative of the three disease areas. The novel genes were placed on the appropriate sections of the Venn diagram depending on the results of the annotation pipeline with respect to these parameters. In total 94 genes were included in the Venn diagrams.
Supplementary Material
Editorial summary.
Steve Brown and colleagues report an analysis of 20 phenotyping tests, including 413 data parameters, across 449 mutant mouse alleles. They identify widespread pleiotropy and assign putative functions to genes that lacked prior phenotypic annotation.
Acknowledgments
The EUMODIC project was funded by European Commission contract number LSHG-CT-2006-037188. The work in at MRC Harwell was funded by the Medical Research Council under project MC_U142684172. The work at the Toronto Centre for Phenogenomics (TCP) was funded under the NorCOMM project by the government of Canada through Genome Canada and Genome Prairie. The Institut Clinique de la Souris (ICS) has been supported by French state funds through the Agence Nationale de la Recherche under the framework program Investissements d'Avenir by ANR-10-IDEX-0002-02, ANR-10-LABX-0030-INRT and ANR-10-INBS-07 PHENOMIN. A full list of members of the EUMODIC consortium who contributed to the goals of the project is available in the Supplementary Note, and a list of partners is available at http://www.eumodic.org/partners.html.
URLs
EMPReSS – http://empress.har.mrc.ac.uk
EUMODIC – http://www.eumodic.org
EuroPhenome – http://www.europhenome.org
EuroPhenome Library - http://sourceforge.net/projects/europhenome/
Data Access
The EuroPhenome database is an open access public database. All raw data can be downloaded from http://www.europhenome.org/rawdata.html. Additional information about data access and web services is available from the IMPC website at http://www.mousephenotype.org/.
Author contributions
M.H.A, K.P.S., Y.H., and S.D.M.B conceived the study and directed the research; G.N., H.M., A-M.M., and S.D.M.B. wrote the paper; M.S, J.W, R.R-S, T.S., S.W., H.F., M.F., D.J.A., N.C.A., T.A., A.A-P., D.A-H., G.A., P.A., S.A., A.Au., A.Ay., J.B., L.B., E.B., R.B., M-C.B., J.B., M.B, V.B., D.H .B., J.N.B., J.C-W., H.C., M-F.C., P.C., C.C., F.C., G.F.C., R.C., R.Cox, E.D., A.D, , B.D, Ar.D., O.E., C.T.E., L.E.F, I.E., J.E., J.F., A.F., A.G., L.G., H.G., A.K.G., L.G., P.G., I.G.D.C., A.G., J.G., A.G., W.H., G..H, S.M.H., H.H., T.H., R.H., A.H., B.I., H.J., S.J., H.K., S.Ki., T.K-R., M.K., T.K., V.L., E.M., T.L., A.L., C. McK., J-L.M., S.M., M.M., H.M., K.M., C.M., L.M., D.M., S.M., B.N., F.N, P.M.N., L.MJ.N., M.O., G.P., N.S.P., E.P., B.P-D., A.P., C.P., P.P., L.P., O.P., D.R., S.R., L.Q-F., M.M.Q., I.R., B.R., F.R., J.R., M.R., J.R., E.R., J.S., K-H.S., E.S., A.S., H. S., R.S., M.S., C.S., T.S., M.S., D.S., L.T., I.T., G.P.T-V., M.T., I.T., E.V., D.V-W., C.W., B.W., O.W., M.W., E.W., A.W., W.W., A.Y., R.Z., A.Z., A.Zi., V.G-D., undertook mouse production, phenotyping and data acquisition and assessment from the phenotyping pipelines; G.N, H.M., A.B., A.D.F., T.F., G.G., S.G., J.M.H., R.H., N.J., N.A.K., S.L., C.L., H. M., D.G.M., L.S., M.S., L.V., A.W., H.W., J.W., C.H., A-M.M. developed data tools and databases and carried out data and statistical analysis.
Footnotes
Competing Financial Interests
The authors declare no competing financial interests.
References
- 1.Blake JA, et al. The Mouse Genome Database: integration of and access to knowledge about the laboratory mouse. Nucleic Acids Res. 2014;42:D810–7. doi: 10.1093/nar/gkt1225. [DOI] [PMC free article] [PubMed] [Google Scholar]
- 2.Brown SD, Wurst W, Kuhn R, Hancock JM. The functional annotation of mammalian genomes: the challenge of phenotyping. Annu Rev Genet. 2009;43:305–33. doi: 10.1146/annurev-genet-102108-134143. [DOI] [PubMed] [Google Scholar]
- 3.Brown SD, Hancock JM, Gates H. Understanding mammalian genetic systems: the challenge of phenotyping in the mouse. PLoS Genet. 2006;2:e118. doi: 10.1371/journal.pgen.0020118. [DOI] [PMC free article] [PubMed] [Google Scholar]
- 4.Gailus-Durner V, et al. Introducing the German Mouse Clinic: open access platform for standardized phenotyping. Nat Methods. 2005;2:403–4. doi: 10.1038/nmeth0605-403. [DOI] [PubMed] [Google Scholar]
- 5.Wagner GP, Zhang J. The pleiotropic structure of the genotype-phenotype map: the evolvability of complex organisms. Nat Rev Genet. 2011;12:204–13. doi: 10.1038/nrg2949. [DOI] [PubMed] [Google Scholar]
- 6.Simon MM, et al. A comparative phenotypic and genomic analysis of C57BL/6J and C57BL/6N mouse strains. Genome Biol. 2013;14:R82. doi: 10.1186/gb-2013-14-7-r82. [DOI] [PMC free article] [PubMed] [Google Scholar]
- 7.White JK, et al. Genome-wide generation and systematic phenotyping of knockout mice reveals new roles for many genes. Cell. 2013;154:452–64. doi: 10.1016/j.cell.2013.06.022. [DOI] [PMC free article] [PubMed] [Google Scholar]
- 8.Brown SD, Moore MW. Towards an encyclopaedia of mammalian gene function: the International Mouse Phenotyping Consortium. Dis Model Mech. 2012;5:289–92. doi: 10.1242/dmm.009878. [DOI] [PMC free article] [PubMed] [Google Scholar]
- 9.Brown SD, Chambon P, de Angelis MH, Eumorphia C. EMPReSS: standardized phenotype screens for functional annotation of the mouse genome. Nat Genet. 2005;37:1155. doi: 10.1038/ng1105-1155. [DOI] [PubMed] [Google Scholar]
- 10.Mallon AM, Blake A, Hancock JM. EuroPhenome and EMPReSS: online mouse phenotyping resource. Nucleic Acids Res. 2008;36:D715–8. doi: 10.1093/nar/gkm728. [DOI] [PMC free article] [PubMed] [Google Scholar]
- 11.Skarnes WC, et al. A conditional knockout resource for the genome-wide study of mouse gene function. Nature. 2011;474:337–42. doi: 10.1038/nature10163. [DOI] [PMC free article] [PubMed] [Google Scholar]
- 12.Morgan H, et al. EuroPhenome: a repository for high-throughput mouse phenotyping data. Nucleic Acids Res. 2010;38:D577–85. doi: 10.1093/nar/gkp1007. [DOI] [PMC free article] [PubMed] [Google Scholar]
- 13.Koscielny G, et al. The International Mouse Phenotyping Consortium Web Portal, a unified point of access for knockout mice and related phenotyping data. Nucleic Acids Res. 2014;42:D802–9. doi: 10.1093/nar/gkt977. [DOI] [PMC free article] [PubMed] [Google Scholar]
- 14.Higgins JP, Thompson SG, Deeks JJ, Altman DG. Measuring inconsistency in meta-analyses. BMJ. 2003;327:557–60. doi: 10.1136/bmj.327.7414.557. [DOI] [PMC free article] [PubMed] [Google Scholar]
- 15.McKusick VA. Mendelian Inheritance in Man and its online version, OMIM. Am J Hum Genet. 2007;80:588–604. doi: 10.1086/514346. [DOI] [PMC free article] [PubMed] [Google Scholar]
- 16.Rath A, et al. Representation of rare diseases in health information systems: the Orphanet approach to serve a wide range of end users. Hum Mutat. 2012;33:803–8. doi: 10.1002/humu.22078. [DOI] [PubMed] [Google Scholar]
- 17.Bassett JH, et al. Rapid-throughput skeletal phenotyping of 100 knockout mice identifies 9 new genes that determine bone strength. PLoS Genet. 2012;8:e1002858. doi: 10.1371/journal.pgen.1002858. [DOI] [PMC free article] [PubMed] [Google Scholar]
- 18.Huang N, Lee I, Marcotte EM, Hurles ME. Characterising and predicting haploinsufficiency in the human genome. PLoS Genet. 2010;6:e1001154. doi: 10.1371/journal.pgen.1001154. [DOI] [PMC free article] [PubMed] [Google Scholar]
- 19.Pandey AK, Lu L, Wang X, Homayouni R, Williams RW. Functionally enigmatic genes: a case study of the brain ignorome. PLoS One. 2014;9:e88889. doi: 10.1371/journal.pone.0088889. [DOI] [PMC free article] [PubMed] [Google Scholar]
- 20.Johnson KR, Longo-Guess CM, Gagnon LH. Mutations of the mouse ELMO domain containing 1 gene (Elmod1) link small GTPase signaling to actin cytoskeleton dynamics in hair cell stereocilia. PLoS One. 2012;7:e36074. doi: 10.1371/journal.pone.0036074. [DOI] [PMC free article] [PubMed] [Google Scholar]
Additional References
- 1.Pettitt SJ, et al. Agouti C57BL/6N embryonic stem cells for mouse genetic resources. Nat Methods. 2009;6:493–5. doi: 10.1038/nmeth.1342. [DOI] [PMC free article] [PubMed] [Google Scholar]
- 2.Karp N, et al. Applying the ARRIVE Guidelines to an In Vivo Database. PLoS Biol. 2015;13(5):e1002151. doi: 10.1371/journal.pbio.1002151. [DOI] [PMC free article] [PubMed] [Google Scholar]
- 3.Hoehndorf R, Schofield PN, Gkoutos GV. PhenomeNET: a whole-phenome approach to disease gene discovery. Nucleic Acids Res. 2011;39:e119. doi: 10.1093/nar/gkr538. [DOI] [PMC free article] [PubMed] [Google Scholar]
- 4.Cunningham F, et al. Ensembl 2015. Nucleic Acids Res. 2014 doi: 10.1093/nar/gku1010. [DOI] [PMC free article] [PubMed] [Google Scholar]
- 5.Beck T, Hastings RK, Gollapudi S, Free RC, Brookes AJ. GWAS Central: a comprehensive resource for the comparison and interrogation of genome-wide association studies. Eur J Hum Genet. 2014;22:949–52. doi: 10.1038/ejhg.2013.274. [DOI] [PMC free article] [PubMed] [Google Scholar]
- 6.Kitsios GD, Tangri N, Castaldi PJ, Ioannidis JP. Laboratory mouse models for the human genome-wide associations. PLoS One. 2010;5:e13782. doi: 10.1371/journal.pone.0013782. [DOI] [PMC free article] [PubMed] [Google Scholar]
- 7.Nelson SJ, Schulman JL. Orthopaedic literature and MeSH. Clin Orthop Relat Res. 2010;468:2621–6. doi: 10.1007/s11999-010-1387-4. [DOI] [PMC free article] [PubMed] [Google Scholar]
Associated Data
This section collects any data citations, data availability statements, or supplementary materials included in this article.


