

Significance
Metabolomics has been increasingly recognized as a powerful functional tool that integrates the impacts from genetics, environment, microbiota, and xenobiotics. We used a broad-spectrum metabolomics platform to analyze plasma samples from 80 adults of normal health. The comprehensive metabolic profiles provided a functional readout to assess the penetrance of gene mutations identified by whole-exome sequencing on these individuals. Conversely, metabolic abnormalities identified by statistical analysis uncovered potential damaging mutations that were previously unappreciated. Additionally, we found metabolic signatures consistent with early signs of disease conditions and drug effects associated with efficacy and toxicity. Our findings demonstrate that metabolomics could be an effective tool in precision medicine for disease risk assessment and customized drug therapy in clinics.
Keywords: metabolomics, whole-exome sequencing, functional phenotyping, gene penetrance, disease assessment
Abstract
Precision medicine, taking account of human individuality in genes, environment, and lifestyle for early disease diagnosis and individualized therapy, has shown great promise to transform medical care. Nontargeted metabolomics, with the ability to detect broad classes of biochemicals, can provide a comprehensive functional phenotype integrating clinical phenotypes with genetic and nongenetic factors. To test the application of metabolomics in individual diagnosis, we conducted a metabolomics analysis on plasma samples collected from 80 volunteers of normal health with complete medical records and three-generation pedigrees. Using a broad-spectrum metabolomics platform consisting of liquid chromatography and GC coupled with MS, we profiled nearly 600 metabolites covering 72 biochemical pathways in all major branches of biosynthesis, catabolism, gut microbiome activities, and xenobiotics. Statistical analysis revealed a considerable range of variation and potential metabolic abnormalities across the individuals in this cohort. Examination of the convergence of metabolomics profiles with whole-exon sequences (WESs) provided an effective approach to assess and interpret clinical significance of genetic mutations, as shown in a number of cases, including fructose intolerance, xanthinuria, and carnitine deficiency. Metabolic abnormalities consistent with early indications of diabetes, liver dysfunction, and disruption of gut microbiome homeostasis were identified in several volunteers. Additionally, diverse metabolic responses to medications among the volunteers may assist to identify therapeutic effects and sensitivity to toxicity. The results of this study demonstrate that metabolomics could be an effective approach to complement next generation sequencing (NGS) for disease risk analysis, disease monitoring, and drug management in our goal toward precision care.
The rapid progression of next generation sequencing (NGS) technology in recent years has significantly reduced the cost and time required to query a patient’s genome accurately. The ability to comprehensively survey genetic variations and their associations with diseases is currently central to personalized medicine and can potentially transform clinical diagnosis and disease management. Indeed, whole-genome sequencing and whole-exome sequencing (WES) have been used successfully to investigate both common and rare diseases (1–7), as well as to provide guidance for drug treatment (8). Despite these successes, significant limitations remain on applying NGS in clinical settings for patient care (9–11). One of the key challenges is the proper interpretation of NGS data. It is known that human exome sequencing identifies ∼10,000 nonsynonymous single-nucleotide variants (12). The computational algorithms and databases for predicting and prioritizing functional pathogenic variants are not yet fully effective. More importantly, the impact of nongenetic factors, such as environment, diet, lifestyle, epigenetics, and microbiome in the disease process needs to be taken into account for clinicians to make an informed diagnosis. These nongenetic factors are particularly important as we apply genomic information for disease risk identification to adults.
Metabolomics is a rapidly evolving field that aims to measure all small molecular metabolites in biological samples. Metabolites represent an intermediate biological process that bridges gene function, nongenetic factors, and phenotypic end points (13, 14). Numerous studies have shown that metabolic phenotypes can provide novel insights into gene function, mechanisms of disease pathogenesis, and biomarkers for disease diagnosis and prognosis (13, 15–21). MS, in combination with liquid chromatography (LC) and GC, has become the main platform for metabolomic analysis. It offers great sensitivity and selectivity to detect a broad range of metabolites that differ significantly in both concentrations and chemical properties (22, 23). In a previous study, we evaluated the application of WES for genetic risk assessment on a healthy adult cohort of 80 volunteers of normal health conditions. We detected various risk alleles, linked personal disease histories with potential causative disease genes in a number of cases, and identified several heritable diseases (24). We envisioned that metabolomics may further extend our understanding of the WES data and improve clinical assessment of these volunteers. Using a broad-spectrum metabolomics platform consisting of three independent LC/MS and GC/MS methods, we profiled 575 metabolites in the plasma samples of the volunteers. We have previously reported the features of the cohort, analytical methods used to identify sequence variants, and their relevance with personal and three-generation medical family history. The databases and bioinformatics analyses used to predict damaging allelic variations were also described (24). In an effort to link predicated damaging alleles to function, we have now studied the cohort’s plasma metabolic profile. The metabolomics data were cross-referenced with WES and clinical data, and also served to identify metabolic abnormalities associated with potential disease conditions. To our knowledge, this study is the first to apply nontargeted metabolomics with NGS for individual diagnosis. The results presented here demonstrate that metabolomics can generate significant insights with clinical importance in health status assessment and disease management. We find that WES and metabolomics data are complementary and provide value for enhancing precision care.
Results
Patient Cohort and Metabolomic Profiling.
The cohort used in this study consisted of 80 of the 81 volunteers previously described (24). Briefly, there were 45 men and 35 women, with an average age of 54 y. The cohort was considered to be in normal health because there were no serious diseases reported at the time of plasma sample collection. A detailed medical history, three-generation medical pedigree, and WES were acquired on each volunteer.
The plasma samples were analyzed using a metabolomics platform consisting of three independent methods: ultrahigh performance liquid chromatography (UHLC)/tandem mass spectrometry (MS/MS2) optimized for basic species, UHLC/MS/MS2 optimized for acidic species, and GC/MS. The metabolites were identified by comparison of the ion features in the experimental samples to a reference library of chemical standards. A total of 575 metabolites of known structures were identified and profiled (Dataset S1). The metabolites covered 72 biochemical pathways and compound classes, including amino acids, lipids, carbohydrates, nucleotides, peptides, dietary compounds, and xenobiotics (Fig. 1A). Interestingly, the plasma metabolomic profiles also contained significant contributions from gut microbiome activities (Fig. 1B and Dataset S1). For example, the levels of various aromatic amino acid catabolites, secondary bile acids, and xenobiotic metabolites are known to be primarily regulated by bacterial metabolism. In addition, many lipid metabolites and energy metabolites are jointly modulated by mammalian and bacterial metabolism (25).
Fig. 1.

Classification of the plasma metabolites detected in this study. (A) Total number of metabolites based on their biochemical classes. (B) Metabolites modulated by gut bacteria activities. Nonitalicized metabolites are exclusively or mainly contributed by bacteria metabolism, and italicized metabolites are jointly contributed by both mammalian cells and bacteria.
It was found that the individual metabolite levels exhibited a substantial range of variation across the 80 volunteers (Fig. 2). To identify metabolic abnormalities associated with each individual, we calculated z-scores and statistical significances for all the metabolites (Dataset S2). Metabolites with levels significantly (P < 0.05) deviating from the population mean may indicate metabolic abnormalities that warrant further investigation. Additionally, we examined the metabolites within the context of their biochemical pathways and biological functions for patterns consistent with known disease conditions. In our whole-exome analysis, we typically detected ∼20,000 variants per exome. From those variants, ∼11,000 were nonsynonymous. After filtering common variants and evaluating each variant for pathogenicity, we finished with ∼1,700 rare variants with potential damaging effects (24). As shown in Fig. 3, we searched this fraction of exon data for any possible gene allele/metabolomics convergence. By this approach, we gained insights for a number of volunteers through the correlations of their metabolomics profile with their clinical conditions and genetic data, indications of early disease conditions, and pharmacologic effects.
Fig. 2.

Metabolomics diversity of the cohort illustrated by the heat map of the metabolomic profiles of the volunteers. Red and blue indicate high and low levels, respectively, relative to the median value for all samples (median = 1.0). The workflow to generate new candidate genes from metabolomics data is shown in Fig. 3. The vCard files are annotated using spnEff and ANNOVAR. Nonsynonymous coding variants are identified. A list of genes corresponding to an abnormal metabolic pathway is generated, and nonsynonymous coding variants are isolated. Variants are filtered using frequency and functional effect filters. Details of the process and methods are provided in Materials and Methods.
Fig. 3.

Work flow for searching WES data and metabolomics convergence. MAF, minor allele frequency.
Clinical, Genetic, and Metabolic Correlations.
Table 1 summarizes the results correlating clinical condition and metabolic pathway abnormalities within the predicted metabolic pathways. We used the metabolomics pathway program to prioritize the genes for bioinformatics examination of sequence variants, prediction of damaging mutations, and their frequency. The number of genes analyzed for pathways ranged from 17 (carnitine metabolism) to 89 (glycolysis), as summarized in Table 1. The total number of variants of unknown significance for each individual’s pathway ranged from four to 33. By restricting possible disease-causative variants to those variants that were rare and predicted damaging by the character of the mutation or by two bioinformatics predictive programs, the number of candidate mutations was reduced, ranging from one to two. Thus, the combination of clinical features, metabolomics, and exon sequence provides a genetic and functional analytic approach to disease understanding.
Table 1.
Summary of illustrated samples
| Sample | Pathway | Genes | Variants | Rare and damaging |
| 3905 | Glycolysis/gluconeogenesis | 89 | 32 | ALDOB p.I177L |
| 3923 | Purine metabolism | 21 | 9 | XDH p.R1296W |
| 3890 | Fatty acid beta oxidation | 17 | 4 | SLC22A5 p.V488I |
| 3952 | Bile acid | 79 | 33 | None |
| 3926 | BCAA metabolism, fatty acid, glycolysis | 60 | 22 | None |
| 3923 | BCAA metabolism, fatty acid, glycolysis | 60 | 21 | MAPK8IP1 p.D386E, MC4R p.I1251L |
| 3891 | BCAA metabolism, fatty acid | 60 | 26 | None |
| 3902 | BCAA metabolism, fatty acid, glycolysis | 60 | 7 | THADA p.E1741K, CLPS p.R55H |
| 3917 | Bile acid | 79 | 33 | TTC37 p.L1505S |
| 3937 | BCAA metabolism, fatty acid, glycolysis | 60 | 26 | LDLR p.P526H, FN3K p.H146R, PASK p.P1249L |
The column labeled “Pathway” represents the metabolic pathway identified by the nontargeted metabolomics. The column labeled “Genes” represents the number of genes belonging to the metabolic pathway. The column labeled “Variants” represents the number of nonsynonymous coding variants identified by the bioinformatics analysis within the genes selected for the pathway. The column labeled “Rare and damaging” represent variants with a minor allele frequency (MAF) <0.5 and considered damaging by two of three functional predication programs (SIFT, PolyPhen-2, and MutationTaster).
Case 3923 had early onset renal stones and a mutation in the xanthine dehydrogenase gene (XDH p.R1296W) in the purine degradation pathway, which was reported to be causative of xanthinuria (26). We considered that the xanthine dehydrogenase mutation was a possible cause for this volunteer’s history of early onset of renal stones (24). Clinically, the plasma biochemical features for patients with xanthinuria are xanthine accumulation (>10-fold of normal), urate depletion (<2% of normal), and elevated hypoxanthine in certain cases (27, 28). Close examination of the metabolic profiles for volunteer 3923 indicated that xanthine was only slightly elevated and that hypoxanthine and urate levels were normal (Fig. 4A). Given the normal metabolomics purine pathway values, we interpreted the gene mutation as not disease-causative, as well as excluding another nine common gene variants.
Fig. 4.

Assessment of the metabolic perturbations defined biochemical pathways. (A) Purine degradation pathway and dot plots showing data distribution in the cohort for xanthine, urate, and hypoxanthine. The red dots show the metabolite level for volunteer 3923. The open dots show the data distribution for the rest of the cohort (n = 80). (B) Sorbitol degradation pathway and dot plots showing data distribution in the cohort for fructose and sorbitol. The red dots show the metabolite level for volunteer 3905. The open dots show the data distribution for the rest of the cohort (n = 80). The box represents the middle 50% of the distribution, and left and right ‘‘whiskers’’ represent the entire spread of the data. The vertical line refers to the median, and the plus symbol refers to the mean. The first and second numbers within the parentheses are the z-score and P value, respectively.
Case 3905 had no significant history of metabolic disease but was found to have a striking alteration in fructose metabolism. The levels of fructose and sorbitol were substantially elevated to greater than fourfold and >34-fold of the cohort medians, respectively (Fig. 4B). We examined 89 candidate pathway genes and identified 32 gene sequence variants. Only one, in the aldolase gene (ALDOB p.I177L), was rare, predicted to be damaging, and reported to cause fructose intolerance (29). The ALDOB gene encodes fructose-1,6-bisphosphate aldolase, an enzyme catalyzing the conversion of fructose-1-phosphate to glyceraldehyde and dihydroxyacetone phosphate (Fig. 4B). We interpreted the data as the patient being an asymptomatic carrier for autosomal recessive fructose intolerance, and in this particular case, the patient did not complain of any manifestation of fructose intolerance. However, due to the observed metabolomic phenotype, we recommended careful dietary planning for volunteer 3905, because persistent fructose intolerance can lead to adverse symptoms, including damage to the liver and kidneys.
Case 3890 was found to have low levels of carnitine and long-chain fatty acids (Fig. 5). Carnitine plays a central role in moving long-chain fatty acids into mitochondria for β-oxidation. Its deficiency impairs fatty acid metabolism, leading to various clinical conditions, such as cardiomyopathy and muscle weakness. Interestingly, volunteer 3890 also had an elevated level of 3-methylhistidine (Fig. 5). Elevated 3-methylhistidine has been known to associate with cardiomyopathy (30) and is considered to be a marker for muscle degradation (31). These metabolic findings were suggestive of carnitine deficiency. We examined 17 pathway genes identifying four sequence variants. Only one mutation, in an organic cation/carnitine transporter gene (SLC22A5 p.V488I), had features of rarity and predicted damaging for a carnitine transporter. We interpreted the findings as the subject being a carrier for the autosomal recessive carnitine deficiency caused by mutations in SLC22A5. The patient was without symptoms.
Fig. 5.

Data distribution for long-chain fatty acid carnitines and 3-methylhistidine in the cohort (n = 80). The red dots show the metabolite level for volunteer 3890. The open dots show the data distribution for the rest of the cohort. An explanation of the plots is provided in the legend for Fig. 4. The first and second numbers within the parentheses are the z-score and P value, respectively.
Cases 3917 and 3952 had elevations of primary bile acids (Fig. 6). The primary bile acids (glycocholate, glycochenodeoxycholate, taurocholate, and taurochenodeoxycholate) are synthesized in the liver, stored in the gallbladder, and subsequently released into the gut for digestion (Fig. 6). In the ileum, the bile acids are actively transported by enterohepatic circulation to be reabsorbed by the liver (32). In healthy conditions, the liver is very efficient in removing bile acids from the circulation (33), but liver diseases, including nonalcoholic fatty liver disease and nonalcoholic steatohepatitis, have been known to elevate total bile acid levels in the general circulation (34–36). Because neither subject had evidence of liver disease, we searched 79 pathway candidate genes, identifying 33 gene variants. Only one variant was found to be rare and predicted damaging (TTC37 p.LI505S) in patient 3917. No mutations were identified for patient 3952, who had a negative history of hepatotoxic medications. Mutations in TTC37 are reported to cause enterohepatic circulatory deficiency, among other features (37).
Fig. 6.

Bile acid circulation and dot plots showing data distribution in the cohort (n = 80) for the four primary bile acids. The red dots show the metabolite level for either volunteer 3917 or volunteer 3952. The open dots show the data distribution for the rest of the cohort. The box represents the middle 50% of the distribution, and left and right ‘‘whiskers’’ represent the entire spread of the data. The vertical line refers to the median, and the plus refers to the mean. An explanation of the plots is provided in the legend for Fig. 4. The first and second numbers within the parentheses are the z-score and P value, respectively.
Diabetes mellitus was reported for case 3926 (type 1), case 3923 (type 2), and case 3891 (type 2). Case 3902 (type 2 risk) had a brother and father with diabetes (type 2) but was clinically not diagnosed with disease at the time of our study. One of the early hallmarks of metabolic diseases is mitochondrial dysfunction (38). A number of biochemical pathways originating from key mitochondrial functions, such as energy homeostasis and redox balance, can be readily observed in the metabolomics data. Additionally, metabolites with known associations to insulin resistance and type II diabetes, including α-hydroxybutyrate (α-HB) (39), 1,5-anhydroglucitol (1,5-AG) (40), branched chain amino acids (BCAAs) (41), and glycine (42), may provide insights on the disease condition. We examined the metabolomics data for signatures consistent with diabetes-associated metabolic alterations. Subject 3902 exhibited elevated α-HB, decreased 1,5-AG, decreased glycine, and slightly elevated BCAAs (Fig. 7 and Table 1). In addition, increased glucose and 3-hydroxybutyrate (a product of fatty acid β-oxidation and BCAA catabolism) suggested altered energy metabolism consistent with disrupted glycolysis and increased lipolysis (Fig. 7). Collectively, these biochemical signatures suggested early indications of diabetes. Volunteers 3926 and 3923 displayed similar signatures, albeit more subtle (Fig. 7 and Table 1). Examination of clinical information and WES data on these volunteers reveled potential risk alleles consistent with their metabolic phenotypes. Volunteer 3902 had a family history of diabetes II (father and brother), and genetic studies revealed mutations of genes with known associations to type II diabetes, CLPS (43), and THADA (44). Volunteer 3926 had type I diabetes. Volunteer 3923’s most recent metabolic panel showed fasting blood glucose in the prediabetic range, and the subject carried mutations on two diabetes risk alleles: MAPK81P1 (45) and MC4R (46). Whether these mutations were causative for the phenotypes would need further testing. Nonetheless, the convergence of the metabolomics and genomics data found here may provide new insights on the risks on these volunteers.
Fig. 7.

Condensed metabolic schemes for energy metabolism and dot plots showing data distribution in the cohort (n = 80) for key metabolites with a known association with diabetes. The red dots show the metabolite level for the specific volunteers as labeled next to the plots. The open dots show the data distribution for the rest of the cohort. An explanation of the plots is provided in the legend for Fig. 4. The first and second numbers within the parentheses are the z-score and P value, respectively.
Responses to Medications.
MS analysis is a conventional approach to determining drug dosage schedules, as well as toxicity in clinical trials, for drug approvals. Dosage schedules that achieve efficacy with safety are developed from these studies for the general population. Following US Food and Drug Administration approval, individual drug blood measurements are generally not made. The metabolomics program provides individual blood levels, as well as indicating drug responsiveness. It has been suggested that detection of genetic variations, particularly in P450 genes, could improve individual drug dosage schedules. The utility of such genetic measurements is in question (47). In our metabolomics analysis, various drugs and drug metabolites were detected, including salicylate, cold and antiinflammatory medications (acetaminophen, ibuprofen, fexofenadine, pseudoephedrine naproxen, and celecoxib), heartburn medications (omeprazole and pantoprazole), antidiabetic medications (metformin and pioglitazone), hypertension medications (furosemide, hydrochlorothiazide, and metoprolol), antidepressants (escitalopram and desvenlafaxine), antibiotics (ofloxacin), gout medication (oxypurinl), atorvastatin, and warfarin (Dataset S1). Interestingly, many of the medications were not reported by the volunteers in their health survey forms. However, this finding presented an opportunity to examine each individual’s metabolomics profile for the impact of his/her medications. We selected several examples where the metabolomics study identified toxicity effects, as well as highly variant drug levels.
It was found that the antidiabetic medications metformin and pioglitazone were exclusively detected in volunteers 3891 and 3937, respectively. Both subjects were under well-controlled diabetes care at the time of this metabolomics study. Volunteer 3937 was known to carry mutations for LDL receptor (LDLR p.P526H) and diabetes risk genes for fructosamine-3-kinase (FN3K p.H146R) and Per-Arnt-Sim domain-containing serine/threonine kinase (PASK p.P1256L) (24) (Table 1). In volunteer 3891, all of the metabolites and biochemical pathways with known diabetes associations (as described in the section above) were in the normal range of the cohort (Fig. 8). Similarly, the metabolites of volunteer 3937 were also in the normal range, with the exception of significantly depleted 1,5-AG and Gly and slightly elevated glucose (Fig. 8). The metabolomics data obtained in this study suggested that the medications were likely effective in at least partially restoring dysregulated metabolic perturbation caused by diabetes in both volunteers. However, this effect was more apparent in volunteer 3891.
Fig. 8.
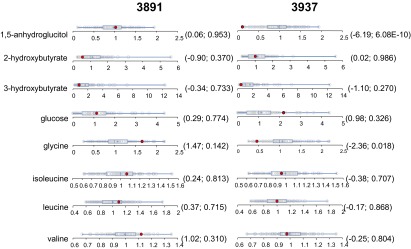
Distribution of key metabolites with known association with diabetes in the cohort (n = 80). The red dots show the metabolite level for either volunteer 3891 or volunteer 3837. The open dots show the data distribution for the rest of the cohort. An explanation of the plots is provided in the legend for Fig. 4. The first and second numbers within the parenthesis are the z-score and P value, respectively.
We observed acetaminophen and its metabolites in 48 of the 80 volunteers. Acetaminophen overdose is a leading cause of acute liver failure (48). In the liver, acetaminophen is converted to a reactive metabolite that depletes cellular glutathione (GSH), thus leading to oxidative stress and cell death (49). Due to acetaminophen’s frequent and chronic use for pain and fever, the identification of at-risk populations could improve therapeutic options for individual patients and prevent adverse clinical outcomes. In this cohort, the highest levels of acetaminophen metabolites were detected in volunteers 3958 and 3976 (Fig. 9). Neither volunteer disclosed the use of acetaminophen in his/her drug history. Volunteer 3976 also displayed a clear trend of elevated levels of all four primary bile acids (Fig. 9), suggesting impaired liver function. The elevated plasma primary bile acids have been found to be early biomarkers for drug-induced liver injury (50). Coincidently, volunteer 3976 also exhibited the lowest level of GSH in this cohort (Fig. 8). In contrast, volunteer 3958 showed normal bile acid levels, with the exception of elevated taurocholate. Volunteer 3958 also had elevated GSH (Fig. 9). We observed that volunteer 3958 had higher levels of acetaminophen metabolites than volunteer 3976 (Fig. 9). Collectively, these observations may suggest that volunteer 3976 was sensitive to acetaminophen-induced liver injury, whereas volunteer 3958 could tolerate acetaminophen well. This difference may relate to their cellular capability to maintain GSH levels in response to acetaminophen. We searched for a genetic basis of this variation in acetaminophen degradation/toxic metabolism without success.
Fig. 9.

Dot plots showing data distribution in the cohort (n = 80) for the acetaminophen metabolites, four primary bile acids, and GSH. The red dots show the metabolite level for either volunteer 3976 or volunteer 3958. The open dots show the data distribution for the rest of the cohort. An explanation of the plots is provided in the legend for Fig. 3. The first and second numbers within the parenthesis are the z-score and P value, respectively.
There were 10 volunteers taking Lipitor, whose levels are reported in Fig. 10, together with their use dosage. Statin exposure has been reported to cause muscle myopathy (51). Volunteer 3927 was found to have a marked elevation of serum atorvastatin among the 10 volunteers taking Lipitor, even compared with subjects with higher daily doses (Fig. 10). Genetic analysis on this volunteer failed to identify any known variants associated with statin-induced muscle toxicity in the transporter genes that play significant roles in modulating systemic exposure of statins (52). Coincidently, this volunteer was taking ginkgo biloba. The substances in ginkgo biloba are known to inhibit CYP3A (53), which may potentially interfere with drug metabolism. The volunteer’s cardiologist was informed of this observation to monitor possible drug interaction or toxicity.
Fig. 10.

Relative serum level of atorvastatin and daily dose among the 10 volunteers taking Lipitor.
Discussion
To control escalating health care costs and maintain life quality in our current aging society, there are increased emphases to incorporate more advanced and informative technologies in clinical practices to guide disease prevention and early diagnosis. As the cost to obtain genome sequences continues to decline, NGS will be increasingly adopted by clinicians and patients. However, reduction of large genomics datasets and proper interpretation of gene variances, especially the ones with uncertain functional consequences, remain major challenges in the application of NGS for patient care (54). Because the current databases [Online Mendelian Inheritance in Man (OMIM), Clinvar, and Human Gene Mutation Database] are small, there are only between 3,000 and 4,000 genes that are associated with human disorders (∼140,000 variants). The vast majority of diseases do not have a gene association, as recently demonstrated by the 25% success rate among patients referred for clinical WES (55). New approaches to increase the success rate and the identification of disease-causative genes are therefore essential. Furthermore, high allelic variation, polygenicity of traits of interest (56), and influences from the microbiome, epigenetics, and the environment add significant complexities. There has been growing appreciation that complex diseases, such as diabetes, cancer, and cardiovascular and neurological diseases, are caused by a combination of genetic and nongenetic factors.
Due to rapid technological improvement, metabolomics has emerged as a new and powerful technology for dissecting underlying disease processes, and this advance sets the stage for new ways to diagnose, monitor, and provide guidance for treatment. Combining metabolomics with genomics has been shown to be a valuable approach to gain new understanding of genetic variance and disease risks in large population studies, such as genome-wide association analyses (57). This study was our first attempt in integrating genomic and metabolomics data toward the improved medical interpretation of an individual’s disease risk in a small clinical cohort. As the examples presented here demonstrate, the functional impact of certain gene variances, especially genes encoding metabolic pathways, can potentially be assessed from the metabolic phenotypes. In the case of volunteer 3923, the projected damaging mutation on xanthine dehydrogenase was found to have no impact on the purine degradation pathway, and thus may not be the cause of renal stone history in this individual. In the case of volunteer 3905, the metabolic phenotype suggested that the ALDOB mutation resulted in perturbation of the fructose catabolic pathway and fructose intolerance risk. These understandings led to more insightful diagnoses and clinical recommendations for these volunteers. More importantly, metabolic phenotypes can help to guide our genetic screening by identifying preclinical abnormalities. For example, in three volunteers (3902, 3923, and 3926), we found abnormal metabolic phenotypes associated with early indications of diabetes. With this valuable information, we further identified that these subjects carried potentially damaging mutations on genes with known association to diabetes. These data provide gene targets for testing whether these mutations were causative for the metabolic perturbation and disease phenotypes observed in these individuals. In addition, metabolomics can add another dimension to NGS by providing real-time assessments and potential biomarkers on health status and the effects of drug treatment. The identification of disease signatures could lead to better clinical recommendations for early intervention, such as lifestyle changes or drug treatments. The detection of a broad range of xenobiotics, including various medications and their metabolites, and their impacts on metabolic homeostasis may further enable clinicians to optimize individualized treatment options. We also note that the metabolomics platform used in this analysis did not provide comprehensive coverage of complex lipid species. The inclusion of these metabolites in the future may bring additional biological insights.
A limitation of this study was that the identification of abnormal metabolic signatures was restricted by the relatively small number of subjects in the cohort. The cases presented here are the metabolic phenotypes that can be readily used for cross-reference with genetic or clinical data, or with disease signatures that have been well established in literature. The metabolomic dataset contains a wealth of information that could be further explored as we gain more knowledge about its biological significance. For example, elevated levels of gut bacteria-derived metabolites were observed in volunteer 3930, suggesting that this individual had altered gut microbiota balance. Interestingly, volunteer 3930 has tics and a positive family history of Tourette syndrome (TS), including her three offspring and her mother. Gastrointestinal disorders and increased intestinal permeability have been known to have close associations with neurological diseases, such as autism spectrum disorder (ASD) (58–60), which is a frequent comorbidity with TS (61). Recently, gut bacteria metabolites, particularly 4-ethylphenylsulfate (4EPS), were found to cause ASD behavioral traits directly in an ASD mouse model. Probiotic treatment was able to restore the serum metabolites and to alleviate ASD behaviors (62). In volunteer 3930, 4EPS was also among the elevated metabolites (Fig. S1). It would be of interest to continue to monitor volunteer 3930 for the association of gut bacteria metabolites with TS symptoms. Volunteer 3930’s three offspring are under genomic and metabolomics analysis at this time.
Fig. S1.

Data distribution for gut bacteria-derived metabolites in the cohort. The red dots show the metabolite level for volunteer 3930. The open dots show the data distribution for the rest of the cohort.
The results of our study demonstrate that metabolomics can effectively enhance the interpretation of NGS data and improve the overall disease diagnosis and risk assessment for patient care. As similar studies are commissioned in the future, we can develop a better understanding of the plasticity and composition of the healthy human metabolome, as well as metabolic signatures for diseases. Moreover, the metabolomics technology used in this study is an efficient and cost-effective approach to obtain a comprehensive metabolic phenotype. Metabolomic analysis, as a routine monitoring tool or in conjunction with NGS, is worthy of consideration as a potentially productive tool in individual diagnosis.
Materials and Methods
Cohort, Sample Collection, and Whole-Exome Sequencing.
The cohort, overnight fasted plasma sample collection, and WES procedures are described by Gonzalez-Garay et al. (24). Informed consent was obtained from all subjects used in this study. This research was overseen by the Institutional Review Board (HSC-IMM-08-0641) of the University of Texas Health Science Center at Houston.
Metabolomic Profiling.
The metabolomic platforms consisted of three independent methods: UHLC/MS/MS2 optimized for basic species, UHLC/MS/MS2 optimized for acidic species, and GC/MS.
Sample preparation.
The plasma samples were stored at −80 °C until needed and then thawed on ice just before extraction. Extraction was executed using an automated liquid-handling robot (MicroLab Star; Hamilton Robotics), where 450 μL of methanol was added to 100 μL of each sample to precipitate proteins. The methanol contained four recovery standards to allow confirmation of extraction efficiency. Each solution was then mixed on a Geno/Grinder 2000 (Glen Mills, Inc.) at 675 strokes per minute and then centrifuged for 5 min at 700 × g. Four 110-μL aliquots of the supernatant of each sample were taken and dried under nitrogen and then under vacuum overnight. The following day, one aliquot was reconstituted in 50 μL of 6.5 mM ammonium bicarbonate in water at pH 8 and one aliquot was reconstituted using 50 μL of 0.1% formic acid in water. Both reconstitution solvents contained sets of instrument internal standards (23) for marking an LC retention index (RI) and evaluating LC/MS instrument performance. A third 110-μL aliquot was derivatized by treatment with 50 μL of a mixture of N,O-bis trimethylsilyltrifluoroacetamide and 1% trimethylchlorosilane in cyclohexane/dichloromethane/acetonitrile (5:4:1) plus 5% (vol/vol) triethylamine, with internal standards added for marking a GC RI and for assessment of recovery from the derivatization process. This mixture was dried overnight under vacuum, and the dried extracts were then capped, shaken for 5 min, and heated at 60 °C for 1 h. The samples were allowed to cool and were spun briefly to pellet any residue before being analyzed by GC/MS. The remaining aliquot was sealed after drying and stored at −80 °C to be used as backup samples, if necessary. The extracts were analyzed on three separate mass spectrometers: one UPLC/MS system comprising a UPLC-OrbiElite instrument (Thermo Scientific) detecting positive ions, one UPLC/MS system comprising a UPLC-OrbiElite system detecting negative ions (Thermo Scientific), and one Trace GC Ultra Gas Chromatograph-Dual Stage Quadrapole (DSQ) GC/MS system (Thermo Scientific).
UPLC method.
All reconstituted aliquots analyzed by LC/MS were separated using a Waters Acquity UPLC system (Waters Corp.). The aliquots reconstituted in 0.1% formic acid used mobile phase solvents consisting of 0.1% formic acid in water (A) and 0.1% formic acid in methanol (B). Aliquots reconstituted in 6.5 mM ammonium bicarbonate used mobile phase solvents consisting of 6.5 mM ammonium bicarbonate in water at pH 8 (A) and 6.5 mM ammonium bicarbonate in 95:5 methanol/water. The gradient profile used for both the formic acid-reconstituted extracts and the ammonium bicarbonate-reconstituted extracts was from 0.5% B to 70% B in 4 min, from 70% B to 98% B in 0.5 min, and holding at 98% B for 0.9 min before returning to 0.5% B in 0.2 min. The flow rate was 350 μL⋅min−1. The sample injection volume was 5 μL, and 2× needle loop overfill was used. LC separations were made at 40 °C on separate acid- or base-dedicated 2.1-mm × 100-mm Waters BEH C18 1.7-μm particle size columns.
UPLC/MS methods.
The OrbiElite system used a heated-electrospray ionization (HESI-II) source with sheath gas set to 80, auxiliary gas set to 12, and voltage set to 4.2 kV for the positive mode. Settings for the negative mode had sheath gas set to 75, auxiliary gas set to 15, and voltage set to 2.75 kV. The source heater temperature for both modes was 430 °C, and the capillary temperature was 350 °C. The mass range was 99–1,000 m/z, with a scan speed of 4.6 total scans per second, also alternating one full scan and one MS/MS2 scan, and the resolution was set to 30,000. The Fourier transform mass spectrometry (FTMS) full-scan automatic gain control (AGC) target was set to 5 × 10⁵ with a cutoff time of 500 ms. The AGC target for the ion trap MS/MS2 was 3 × 10³, with a maximum fill time of 100 ms. Normalized collision energy for the positive mode was set to 32 arbitrary units, and normalized collision energy for the negative mode was set to 30 arbitrary units. For both methods, activation Q was 0.35 and activation time was 30 ms, again with a 3-m/z isolation mass window. The dynamic exclusion setting with a 3.5-s duration was enabled for the OrbiElite. Calibration was performed weekly using an infusion of Pierce LTQ Velos ESI Positive Ion Calibration Solution or Pierce ESI Negative Ion Calibration Solution.
GC/MS method.
Derivatized samples were analyzed by GC/MS. A sample volume of 1.0 μL was injected in split mode with a 20:1 split ratio onto a diphenyl dimethyl polysiloxane stationary phase, thin film fused silica column, Crossbond RTX-5Sil, 0.18-mm i.d. × 20 m with a film thickness of 20 μm (Restek). The compounds were eluted with helium as the carrier gas and a temperature gradient that consisted of the initial temperature held at 60 °C for 1 min and then increased to 220 °C at a rate of 17.1 °C⋅min−1, followed by an increase to 340 °C at a rate of 30 °C⋅min−1, and then held at this temperature for 3.67 min. The temperature was then allowed to decrease and stabilize to 60 °C for a subsequent injection. The mass spectrometer was operated using electron impact ionization with a scan range of 50–750 atomic mass units (amu) at four scans per second, 3,077 amu⋅s−1. The DSQ was set with an ion source temperature of 290 °C and a multiplier voltage of 1865 V. The MS transfer line was held at 300 °C. Tuning and calibration of the DSQ were performed daily to ensure optimal performance.
Data processing and analysis.
For each biological matrix dataset on each instrument, relative SDs of peak area were calculated for each internal standard to confirm extraction efficiency, instrument performance, column integrity, chromatography, and mass calibration. Several of these internal standards serve as RI markers and were checked for retention time and alignment. For peak detection and integration, in-house software was used. The output from this processing generates a list of m/z ratios, retention times, and area under the curve values. Software-specified criteria for peak detection include thresholds for signal-to-noise ratio, height, and width.
The biological datasets, including quality control (QC) samples, were chromatographically aligned based on an RI that uses internal standards assigned a fixed RI value (23). The RI of the experimental peak is determined by assuming a linear fit between flanking RI markers whose values do not change. The benefit of the RI is that it corrects for retention time drifts that are caused by systematic errors, such as sample pH and column age. Each compound’s RI was designated based on the elution relationship with its two lateral retention markers. Using a proprietary software package, integrated and aligned peaks were matched against the in-house library of authentic standards and routinely detected unknown compounds and were specific to the positive, negative, or GC/MS data collection method. Matches were based on RI values within 150 RI units of the prospective identification and experimental precursor mass match to the library authentic standard within 0.005 m/z for the OrbiElite data and within 0.4 m/z for the DSQ data. The experimental MS/MS2 was compared with the library spectra for the authentic standard and was assigned forward and reverse scores. A perfect forward score would indicate that all ions in the experimental spectra were found in the library for the authentic standard at the correct ratios, and a perfect reverse score would indicate that all authentic standard library ions were present in the experimental spectra and at the correct ratios. The forward and reverse scores were compared, and a MS/MS2 fragmentation spectral score was given for the proposed match. All matches were then manually reviewed by an analyst who approved or rejected each call based on the above criteria.
QC.
From the samples of plasma, aliquots of each of the individual samples were combined to make technical replicates, which were extracted as described above. Extracts of this pooled plasma sample were injected six times for each dataset on each instrument to assess process variability. As an additional QC, five water aliquots were extracted as part of the sample set on each instrument to serve as process blanks for artifact identification. All QC samples included the instrument internal standards to assess extraction efficiency and instrument performance, and to serve as RI markers for ion identification. The standards were isotopically labeled or, otherwise, exogenous molecules were chosen so as not to obstruct detection of intrinsic ions (23).
Statistical Analysis.
The goal of the statistical analysis was to identify “extreme” values (outliers) in each of the metabolites detected in this study. The statistical analysis relied on the subjects being sampled from a normal population. The data showed consistent log-normality, so the (natural) log-transformation was applied to each metabolite. The univariate statistical analysis was performed on modified z-score statistics, where each subject was compared against all of the others. When sampling from a normal population with a mean μ and SD σ, the statistic z = (x − µ)/σ, has a N(0,1) distribution. Because μ and σ are unknown, they were estimated by the statistics m and s, respectively, and z = (x − m)/s was instead computed. For each subject i, the statistics m(−i) and s(−i) were estimated from all subjects, except subject i, to form zi = (xi − m(−i))/s(−i). Typically, the sample mean and SD were used for these statistics. In this case, if we assumed that subject i was sampled from a population with the same SD as the others, then under the null hypothesis that this observation was sampled from a population with the same mean, sqrt(n/(n + 1)) * (x − m)/s would have a t distribution with n − 1 df. For n = 80, the statistic is approximately equal to (x − m)/s and the N(0,1) was a close approximation to the t distribution for this many subjects. Because all of the remaining subjects may have outliers (ones who do not truly belong), we wanted to use more robust estimators than the sample mean and sample SD, which could be greatly affected by outliers. For a normal population, the median is equal to the mean, and the SD is equal to the interquartile range (IQR)/1.349, where IQR = (third quartile − first quartile). For the SD, one could also use (third quartile − median)/0.6745. Thus, m(−i) = median of all of the values, except subject i; if a metabolite had fewer than 25% missing values, then s(−i) = IQR(−i)/1.349, and if a metabolite had between 25% and 50% missing values, s(−i) = (third quartile − median)/0.6745, where the missing values were assumed to be below the limit of detection (i.e., for 80 observations, if 40 were missing, the median was the lowest observed value, if those missing observations were assumed to be lower than those observations observed). If the value of subject i was missing, then the minimum observed value was used for its estimate. Metabolites with more than 50% missing values were not used for the significance testing. Because of the large number of comparisons being performed, the false discovery rates were also estimated for each comparison (each subject). The false discovery rates were estimated with the q-value method of Storey and Tibshirani (63) and computed with the “q-value” package in R.
Finally, for the sparse metabolites (those metabolites in fewer than 50% of the samples), formal statistical testing was not performed, but visual assessments were used instead. Many of these sparse metabolites were drug metabolites.
WES Sequencing.
Genomic DNA was extracted using a DNA kit (Promega Wizard Genomic DNA Purification Kit) following the manufacturer’s instructions. The cohort was sequenced using Illumina’s HiSeq 2500 system after enrichment with Agilent SureSelect target enrichment V5 + UTRs (targeting coding regions plus UTRs) (outsourced to Axeq Technologies).
Sequencing Analysis.
Details of the process and literature references for the database and tools used in this process can be found in our previous publication (24). Essentially, our analysis pipeline consists of Novoalign, Samtools, Picard, and Genome Analysis Toolkit (GATK), followed by variant annotation using multiple databases from UCSC Genome bioinformatics. For each metabolic pathway identified by the metabolomics experiment, a group of candidate genes was manually curated using multiple resources (www.wikipathways.org, www.biocarta.com, www.genome.jp/kegg, pid.nci.nih.gov, and www.reactome.org). Nonsynonymous coding variants were extracted from the vCard file of a volunteer. Filtration of common polymorphisms was accomplished using frequencies from the NHLBI Exome Sequencing Project (1,000 genomes and internally by removing any variant that appeared more than three times in our cohort). Functional effects of each nonsynonymous coding variant were evaluated using three different functional predication algorithms (Polyphen 2.0, Sift, and MutationTaster) using the dbNSFP database. Fig. 2 illustrates our pipeline. We detected known variants associated with human diseases using the ClinVar database from National Center for Biotechnology Information and genes known to be associated with human disorders (OMIM database and GeneTests).
Supplementary Material
Acknowledgments
We thank Dr. Nelson Rhodes for helpful discussions and Elim Chao for technical assistance.
Footnotes
The authors declare no conflict of interest.
This article contains supporting information online at www.pnas.org/lookup/suppl/doi:10.1073/pnas.1508425112/-/DCSupplemental.
References
- 1.Yang Y, et al. Clinical whole-exome sequencing for the diagnosis of mendelian disorders. N Engl J Med. 2013;369(16):1502–1511. doi: 10.1056/NEJMoa1306555. [DOI] [PMC free article] [PubMed] [Google Scholar]
- 2.Berg JS, et al. Next generation massively parallel sequencing of targeted exomes to identify genetic mutations in primary ciliary dyskinesia: Implications for application to clinical testing. Genet Med. 2011;13(3):218–229. doi: 10.1097/GIM.0b013e318203cff2. [DOI] [PMC free article] [PubMed] [Google Scholar]
- 3.Maxmen A. Exome sequencing deciphers rare diseases. Cell. 2011;144(5):635–637. doi: 10.1016/j.cell.2011.02.033. [DOI] [PubMed] [Google Scholar]
- 4.Ng SB, et al. Exome sequencing identifies the cause of a mendelian disorder. Nat Genet. 2010;42(1):30–35. doi: 10.1038/ng.499. [DOI] [PMC free article] [PubMed] [Google Scholar]
- 5.Roach JC, et al. Analysis of genetic inheritance in a family quartet by whole-genome sequencing. Science. 2010;328(5978):636–639. doi: 10.1126/science.1186802. [DOI] [PMC free article] [PubMed] [Google Scholar]
- 6.Dasouki MJ, et al. Exome sequencing reveals a thrombopoietin ligand mutation in a Micronesian family with autosomal recessive aplastic anemia. Blood. 2013;122(20):3440–3449. doi: 10.1182/blood-2012-12-473538. [DOI] [PMC free article] [PubMed] [Google Scholar]
- 7.Schaaf CP, et al. Truncating mutations of MAGEL2 cause Prader-Willi phenotypes and autism. Nat Genet. 2013;45(11):1405–1408. doi: 10.1038/ng.2776. [DOI] [PMC free article] [PubMed] [Google Scholar]
- 8.Takeuchi F, et al. A genome-wide association study confirms VKORC1, CYP2C9, and CYP4F2 as principal genetic determinants of warfarin dose. PLoS Genet. 2009;5(3):e1000433. doi: 10.1371/journal.pgen.1000433. [DOI] [PMC free article] [PubMed] [Google Scholar]
- 9.Katsanis SH, Katsanis N. Molecular genetic testing and the future of clinical genomics. Nat Rev Genet. 2013;14(6):415–426. doi: 10.1038/nrg3493. [DOI] [PMC free article] [PubMed] [Google Scholar]
- 10.Ginsburg GS. Realizing the opportunities of genomics in health care. JAMA. 2013;309(14):1463–1464. doi: 10.1001/jama.2013.1465. [DOI] [PubMed] [Google Scholar]
- 11.Feero WG, Guttmacher AE, Collins FS. Genomic medicine—An updated primer. N Engl J Med. 2010;362(21):2001–2011. doi: 10.1056/NEJMra0907175. [DOI] [PubMed] [Google Scholar]
- 12.Bamshad MJ, et al. Exome sequencing as a tool for Mendelian disease gene discovery. Nat Rev Genet. 2011;12(11):745–755. doi: 10.1038/nrg3031. [DOI] [PubMed] [Google Scholar]
- 13.Suhre K, et al. CARDIoGRAM Human metabolic individuality in biomedical and pharmaceutical research. Nature. 2011;477(7362):54–60. doi: 10.1038/nature10354. [DOI] [PMC free article] [PubMed] [Google Scholar]
- 14.Shin SY, et al. Multiple Tissue Human Expression Resource (MuTHER) Consortium An atlas of genetic influences on human blood metabolites. Nat Genet. 2014;46(6):543–550. doi: 10.1038/ng.2982. [DOI] [PMC free article] [PubMed] [Google Scholar]
- 15.Milburn MV, Lawton KA. Application of metabolomics to diagnosis of insulin resistance. Annu Rev Med. 2013;64:291–305. doi: 10.1146/annurev-med-061511-134747. [DOI] [PubMed] [Google Scholar]
- 16.Langley RJ, et al. An integrated clinico-metabolomic model improves prediction of death in sepsis. Sci Transl Med. 2013;5(195):195ra95. doi: 10.1126/scitranslmed.3005893. [DOI] [PMC free article] [PubMed] [Google Scholar]
- 17.Menni C, et al. Metabolomic markers reveal novel pathways of ageing and early development in human populations. Int J Epidemiol. 2013;42(4):1111–1119. doi: 10.1093/ije/dyt094. [DOI] [PMC free article] [PubMed] [Google Scholar]
- 18.Zhang Y, et al. Detrimental effects of adenosine signaling in sickle cell disease. Nat Med. 2011;17(1):79–86. doi: 10.1038/nm.2280. [DOI] [PMC free article] [PubMed] [Google Scholar]
- 19.Yu B, et al. Genome-wide association study of a heart failure related metabolomic profile among African Americans in the Atherosclerosis Risk in Communities (ARIC) study. Genet Epidemiol. 2013;37(8):840–845. doi: 10.1002/gepi.21752. [DOI] [PMC free article] [PubMed] [Google Scholar]
- 20.Zheng Y, et al. Metabolomics and incident hypertension among blacks: The atherosclerosis risk in communities study. Hypertension. 2013;62(2):398–403. doi: 10.1161/HYPERTENSIONAHA.113.01166. [DOI] [PMC free article] [PubMed] [Google Scholar]
- 21.Gieger C, et al. Genetics meets metabolomics: A genome-wide association study of metabolite profiles in human serum. PLoS Genet. 2008;4(11):e1000282. doi: 10.1371/journal.pgen.1000282. [DOI] [PMC free article] [PubMed] [Google Scholar]
- 22.Shah SH, Kraus WE, Newgard CB. Metabolomic profiling for the identification of novel biomarkers and mechanisms related to common cardiovascular diseases: form and function. Circulation. 2012;126(9):1110–1120. doi: 10.1161/CIRCULATIONAHA.111.060368. [DOI] [PMC free article] [PubMed] [Google Scholar]
- 23.Evans AM, DeHaven CD, Barrett T, Mitchell M, Milgram E. Integrated, nontargeted ultrahigh performance liquid chromatography/electrospray ionization tandem mass spectrometry platform for the identification and relative quantification of the small-molecule complement of biological systems. Anal Chem. 2009;81(16):6656–6667. doi: 10.1021/ac901536h. [DOI] [PubMed] [Google Scholar]
- 24.Gonzalez-Garay ML, McGuire AL, Pereira S, Caskey CT. Personalized genomic disease risk of volunteers. Proc Natl Acad Sci USA. 2013;110(42):16957–16962. doi: 10.1073/pnas.1315934110. [DOI] [PMC free article] [PubMed] [Google Scholar]
- 25.Nicholson JK, et al. Host-gut microbiota metabolic interactions. Science. 2012;336(6086):1262–1267. doi: 10.1126/science.1223813. [DOI] [PubMed] [Google Scholar]
- 26.Stenson PD, et al. The Human Gene Mutation Database: 2008 update. Genome Med. 2009;1(1):13. doi: 10.1186/gm13. [DOI] [PMC free article] [PubMed] [Google Scholar]
- 27.Boulieu R, Bory C, Baltassat P, Divry P. Hypoxanthine and xanthine concentrations determined by high performance liquid chromatography in biological fluids from patients with xanthinuria. Clin Chim Acta. 1984;142(1):83–89. doi: 10.1016/0009-8981(84)90103-7. [DOI] [PubMed] [Google Scholar]
- 28.Bennett MJ, Carpenter KH, Hill PG. Asymptomatic xanthinuria detected as a result of routine analysis of serum for urate. Clin Chem. 1985;31(3):492. [PubMed] [Google Scholar]
- 29.Steinmann B, Baerlocher K, Gitzelmann R. [Hereditary disorders of fructose metabolism. Loading tests with fructose, sorbitol and dihydroxyacetone] Nutr Metab. 1975;18(Suppl 1):115–132. German. [PubMed] [Google Scholar]
- 30.Alexander D, Lombardi R, Rodriguez G, Mitchell MM, Marian AJ. Metabolomic distinction and insights into the pathogenesis of human primary dilated cardiomyopathy. Eur J Clin Invest. 2011;41(5):527–538. doi: 10.1111/j.1365-2362.2010.02441.x. [DOI] [PMC free article] [PubMed] [Google Scholar]
- 31.Long CL, Dillard DR, Bodzin JH, Geiger JW, Blakemore WS. Validity of 3-methylhistidine excretion as an indicator of skeletal muscle protein breakdown in humans. Metabolism. 1988;37(9):844–849. doi: 10.1016/0026-0495(88)90118-7. [DOI] [PubMed] [Google Scholar]
- 32.Russell DW. The enzymes, regulation, and genetics of bile acid synthesis. Annu Rev Biochem. 2003;72:137–174. doi: 10.1146/annurev.biochem.72.121801.161712. [DOI] [PubMed] [Google Scholar]
- 33.Hofmann AF. The enterohepatic circulation of bile acids in mammals: Form and functions. Front Biosci (Landmark Ed) 2009;14:2584–2598. doi: 10.2741/3399. [DOI] [PubMed] [Google Scholar]
- 34.Barnes S, Gallo GA, Trash DB, Morris JS. Diagnostic value of serum bile acid estimations in liver disease. J Clin Pathol. 1975;28(6):506–509. doi: 10.1136/jcp.28.6.506. [DOI] [PMC free article] [PubMed] [Google Scholar]
- 35.Bouchier IA, Pennington CR. Serum bile acids in hepatobiliary disease. Gut. 1978;19(6):492–496. doi: 10.1136/gut.19.6.492. [DOI] [PMC free article] [PubMed] [Google Scholar]
- 36.Kalhan SC, et al. Plasma metabolomic profile in nonalcoholic fatty liver disease. Metabolism. 2011;60(3):404–413. doi: 10.1016/j.metabol.2010.03.006. [DOI] [PMC free article] [PubMed] [Google Scholar]
- 37.Hartley JL, et al. 2010. Mutations in TTC37 cause trichohepatoenteric syndrome (phenotypic diarrhea of infancy). Gastroenterology 138(7):2388–2398, 2398.e1–2398.e2.
- 38.Lowell BB, Shulman GI. Mitochondrial dysfunction and type 2 diabetes. Science. 2005;307(5708):384–387. doi: 10.1126/science.1104343. [DOI] [PubMed] [Google Scholar]
- 39.Ferrannini E, et al. Early metabolic markers of the development of dysglycemia and type 2 diabetes and their physiological significance. Diabetes. 2013;62(5):1730–1737. doi: 10.2337/db12-0707. [DOI] [PMC free article] [PubMed] [Google Scholar]
- 40.Yamanouchi T, et al. Clinical usefulness of serum 1,5-anhydroglucitol in monitoring glycaemic control. Lancet. 1996;347(9014):1514–1518. doi: 10.1016/s0140-6736(96)90672-8. [DOI] [PubMed] [Google Scholar]
- 41.Newgard CB, et al. A branched-chain amino acid-related metabolic signature that differentiates obese and lean humans and contributes to insulin resistance. Cell Metab. 2009;9(4):311–326. doi: 10.1016/j.cmet.2009.02.002. [DOI] [PMC free article] [PubMed] [Google Scholar]
- 42.Perseghin G, Ghosh S, Gerow K, Shulman GI. Metabolic defects in lean nondiabetic offspring of NIDDM parents: A cross-sectional study. Diabetes. 1997;46(6):1001–1009. doi: 10.2337/diab.46.6.1001. [DOI] [PubMed] [Google Scholar]
- 43.Weyrich P, et al. Genetic variability of procolipase associates with altered insulin secretion in non-diabetic Caucasians. Exp Clin Endocrinol Diabetes. 2009;117(2):83–87. doi: 10.1055/s-2008-1078733. [DOI] [PubMed] [Google Scholar]
- 44.Simonis-Bik AM, et al. Gene variants in the novel type 2 diabetes loci CDC123/CAMK1D, THADA, ADAMTS9, BCL11A, and MTNR1B affect different aspects of pancreatic beta-cell function. Diabetes. 2010;59(1):293–301. doi: 10.2337/db09-1048. [DOI] [PMC free article] [PubMed] [Google Scholar]
- 45.Waeber G, et al. The gene MAPK8IP1, encoding islet-brain-1, is a candidate for type 2 diabetes. Nat Genet. 2000;24(3):291–295. doi: 10.1038/73523. [DOI] [PubMed] [Google Scholar]
- 46.Vaisse C, et al. Melanocortin-4 receptor mutations are a frequent and heterogeneous cause of morbid obesity. J Clin Invest. 2000;106(2):253–262. doi: 10.1172/JCI9238. [DOI] [PMC free article] [PubMed] [Google Scholar]
- 47.Zanger UM, Schwab M. Cytochrome P450 enzymes in drug metabolism: Regulation of gene expression, enzyme activities, and impact of genetic variation. Pharmacol Ther. 2013;138(1):103–141. doi: 10.1016/j.pharmthera.2012.12.007. [DOI] [PubMed] [Google Scholar]
- 48.Larson AM, et al. Acute Liver Failure Study Group Acetaminophen-induced acute liver failure: Results of a United States multicenter, prospective study. Hepatology. 2005;42(6):1364–1372. doi: 10.1002/hep.20948. [DOI] [PubMed] [Google Scholar]
- 49.James LP, Mayeux PR, Hinson JA. Acetaminophen-induced hepatotoxicity. Drug Metab Dispos. 2003;31(12):1499–1506. doi: 10.1124/dmd.31.12.1499. [DOI] [PubMed] [Google Scholar]
- 50.Yamazaki M, et al. Perturbation of bile acid homeostasis is an early pathogenesis event of drug induced liver injury in rats. Toxicol Appl Pharmacol. 2013;268(1):79–89. doi: 10.1016/j.taap.2013.01.018. [DOI] [PubMed] [Google Scholar]
- 51.Thompson PD, Clarkson P, Karas RH. Statin-associated myopathy. JAMA. 2003;289(13):1681–1690. doi: 10.1001/jama.289.13.1681. [DOI] [PubMed] [Google Scholar]
- 52.Niemi M. Transporter pharmacogenetics and statin toxicity. Clin Pharmacol Ther. 2010;87(1):130–133. doi: 10.1038/clpt.2009.197. [DOI] [PubMed] [Google Scholar]
- 53.von Moltke LL, et al. Inhibition of human cytochromes P450 by components of Ginkgo biloba. J Pharm Pharmacol. 2004;56(8):1039–1044. doi: 10.1211/0022357044021. [DOI] [PubMed] [Google Scholar]
- 54.Jacob HJ. Next-generation sequencing for clinical diagnostics. N Engl J Med. 2013;369(16):1557–1558. doi: 10.1056/NEJMe1310846. [DOI] [PubMed] [Google Scholar]
- 55.Yang Y, et al. Molecular findings among patients referred for clinical whole-exome sequencing. JAMA. 2014;312(18):1870–1879. doi: 10.1001/jama.2014.14601. [DOI] [PMC free article] [PubMed] [Google Scholar]
- 56.Cooper DN, Krawczak M, Polychronakos C, Tyler-Smith C, Kehrer-Sawatzki H. Where genotype is not predictive of phenotype: Towards an understanding of the molecular basis of reduced penetrance in human inherited disease. Hum Genet. 2013;132(10):1077–1130. doi: 10.1007/s00439-013-1331-2. [DOI] [PMC free article] [PubMed] [Google Scholar]
- 57.Adamski J, Suhre K. Metabolomics platforms for genome wide association studies—Linking the genome to the metabolome. Curr Opin Biotechnol. 2013;24(1):39–47. doi: 10.1016/j.copbio.2012.10.003. [DOI] [PubMed] [Google Scholar]
- 58.de Magistris L, et al. Alterations of the intestinal barrier in patients with autism spectrum disorders and in their first-degree relatives. J Pediatr Gastroenterol Nutr. 2010;51(4):418–424. doi: 10.1097/MPG.0b013e3181dcc4a5. [DOI] [PubMed] [Google Scholar]
- 59.Coury DL, et al. Gastrointestinal conditions in children with autism spectrum disorder: developing a research agenda. Pediatrics. 2012;130(Suppl 2):S160–S168. doi: 10.1542/peds.2012-0900N. [DOI] [PubMed] [Google Scholar]
- 60.Kohane IS, et al. The co-morbidity burden of children and young adults with autism spectrum disorders. PLoS One. 2012;7(4):e33224. doi: 10.1371/journal.pone.0033224. [DOI] [PMC free article] [PubMed] [Google Scholar]
- 61.Bitsko RH, et al. A national profile of Tourette syndrome, 2011-2012. J Dev Behav Pediatr. 2014;35(5):317–322. doi: 10.1097/DBP.0000000000000065. [DOI] [PMC free article] [PubMed] [Google Scholar]
- 62.Hsiao EY, et al. Microbiota modulate behavioral and physiological abnormalities associated with neurodevelopmental disorders. Cell. 2013;155(7):1451–1463. doi: 10.1016/j.cell.2013.11.024. [DOI] [PMC free article] [PubMed] [Google Scholar]
- 63.Storey JD, Tibshirani R. Statistical significance for genomewide studies. Proc Natl Acad Sci USA. 2003;100(16):9440–9445. doi: 10.1073/pnas.1530509100. [DOI] [PMC free article] [PubMed] [Google Scholar]
Associated Data
This section collects any data citations, data availability statements, or supplementary materials included in this article.