Significance
The liver is rich in mitochondria and has an exceptional regenerative capacity after partial hepatectomy or transplantation, viral infections, or chemical injuries; however, relatively little is known about the genetic factors for mitochondrial DNA (mtDNA) replication during liver regeneration. Here, we show that liver regeneration is markedly reduced in mice lacking mitochondrial topoisomerase I (TOP1mt). This defect is linked with reduced production of mtDNA and defective mitochondrial functions during acute energy demand for liver regeneration. Additionally, TOP1mt KO primary hepatocytes from CCl4-treated mice showed reduced and damaged mitochondria, decreased O2 consumption, and ATP production. Together with mtDNA depletion and regeneration experiments with ethidium bromide, these results demonstrate that Top1mt is required for mtDNA synthesis and appropriate liver regeneration.
Keywords: liver regeneration, mitochondrial topoisomerase I, cell proliferation, mitochondrial DNA replication, mitochondrial homeostasis
Abstract
The liver has an exceptional replicative capacity following partial hepatectomy or chemical injuries. Cellular proliferation requires increased production of energy and essential metabolites, which critically depend on the mitochondria. To determine whether Top1mt, the vertebrate mitochondrial topoisomerase, is involved in this process, we studied liver regeneration after carbon tetrachloride (CCl4) administration. TOP1mt knockout (KO) mice showed a marked reduction in regeneration and hepatocyte proliferation. The hepatic mitochondrial DNA (mtDNA) failed to increase during recovery from CCl4 exposure. Reduced glutathione was also depleted, indicating increased reactive oxygen species (ROS). Steady-state levels of ATP, O2 consumption, mtDNA, and mitochondrial mass were also reduced in primary hepatocytes from CCl4-treated KO mice. To further test whether Top1mt acted by enabling mtDNA regeneration, we tested TOP1mt KO fibroblasts and human colon carcinoma HCT116 cells and measured mtDNA after 3-d treatment with ethidium bromide. Both types of TOP1mt knockout cells showed defective mtDNA regeneration following mtDNA depletion. Our study demonstrates that Top1mt is required for normal mtDNA homeostasis and for linking mtDNA expansion with hepatocyte proliferation.
Individual cells contain hundreds to thousands of copies of mitochondrial DNA (mtDNA), which are essential for cellular metabolism because each mtDNA molecule encodes 13 indispensible genes (that complement the 153 nuclear encoded genes) involved in mitochondrial electron transport and ATP production (for review, see ref. 1). Given that mtDNA exists as small circular double-stranded DNA molecules (16,569 bp) with bidirectional replication and transcription, and is organized in nucleoids that are anchored to the mitochondrial inner membrane, topoisomerases are required for mtDNA replication and transcription.
Type IB topoisomerases are ubiquitous enzymes that dissipate the DNA topological stress generated during replication and transcription by rapidly and reversibly breaking and rejoining the phosphodiester DNA backbone (for review, see refs. 2–4). They act both in the nucleus and in mitochondria (5), but each compartment has its own enzyme: Top1mt being mitochondrial-specific (6) and topoisomerase I (Top1) nuclear-specific (6, 7). In addition to its roles in regulating mtDNA replication (8), transcription (9), and mtDNA integrity (10), Top1mt participates in mitochondrial functions. Indeed, murine embryonic fibroblasts (MEFs) generated from TOP1mt KO mice have mitochondrial defects, including excessive reactive oxygen species (ROS) production and altered polarization of mitochondrial membranes (11).
Regulation of mtDNA copy number is crucial to maintain mitochondrial function and ATP production during cell proliferation (12). The liver has an exceptional proliferative capacity; it can rapidly regenerate its mass both in human and animals after partial hepatectomy or viral or chemical injuries (13–15). Liver regeneration is also key to successful partial liver transplantations from living donors (small-for-size liver transplants) (for review, see ref. 14). A common and convenient model to study liver regeneration is carbon tetrachloride (CCl4) exposure. CCl4 is one of the most potent hepatotoxins. It is widely used to evaluate antioxidant agents, mechanisms of hepatic injury, pathogenesis of cirrhosis, and liver regeneration. CCl4 is metabolized in the liver by cytochrome P450 2E1 (CYP2E1) to trichloromethyl radical (CCl3*), which initiates free radical-mediated lipid peroxidation. Accumulation of lipid-derived oxidative products then causes liver injury (16). This damage triggers the activation and coordination of multiple intracellular and intercellular pathways to regenerate the liver mass and meet the metabolic needs of the organism (13, 14, 16). Notably, hepatocytes are packed with mitochondria.
To address the role of mtDNA in liver regeneration, we took advantage of the fact that mice lacking TOP1mt are viable (5, 11, 17). We suspected that Top1mt might play a role in liver regeneration because we recently uncovered a critical role for TOP1mt in maintaining mtDNA homeostasis and mitochondrial function in adaptive response to doxorubicin-induced cardiotoxicity (17). Indeed, the cardiomyocytes of TOP1mt KO mice exhibit pronounced mtDNA damage, and fail to maintain respiratory chain protein production and mitochondrial cristae ultrastructure organization, resulting in decreased O2 consumption, increased ROS production, and severe heart muscle damage (17). In the present study, we show that Top1mt is critical for mtDNA synthesis and appropriate cell proliferation to meet the massive energy demand during liver regeneration after CCl4 injury.
Results
Top1mt Supports Cellular Replication and Liver Recovery After CCl4 Injury.
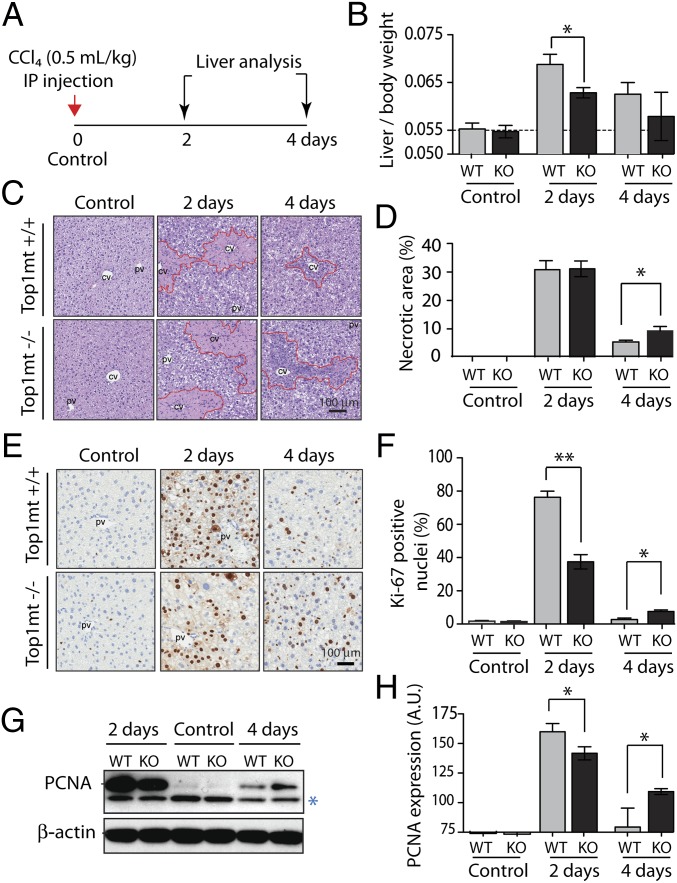
To assess the role of TOP1mt in liver regeneration, we compared TOP1mt knockout (TOP1mt KO) and wild-type (TOP1mt WT) mice born in the same litters from heterozygous (TOP1mt+/−) parents. Seven-week-old mice received a single i.p. injection of CCl4 [0.5 mL/kg body weight; 10% (vol/vol) CCl4 in olive oil] or the vehicle, olive oil alone (control). Livers were analyzed 2 and 4 d after CCl4 injection (Fig. 1A).
Fig. 1.
Defective liver regeneration in TOP1mt knockout mice. (A) Treatment scheme: Seven-week-old paired TOP1mt KO and wild-type (WT) mice from same litters were treated with a single i.p. injection of CCl4 0.5 mL/kg body weight or with olive oil as solvent control. Two and four days later, liver tissues were analyzed (n = 5 for control and n = 8 for CCl4-treated mice). (B) Liver/body weight ratios. (C) H&E staining of liver tissue sections. CCl4 induces necrosis in centrilobular areas around central vein (CV). (D) Quantification of necrotic areas around central veins (outlined with red lines). (E) Ki-67 IHC staining of liver tissue sections. Replication starts from the portal vein (pv) and migrates to replace the necrotic area around the CV. (F) Quantification of Ki-67–positive nuclei. (G) Western blot analysis of PCNA protein expression levels in liver tissues at days 2 and 4 of recovery. *, nonspecific band serving as loading control together with β-actin. (H) Quantification of PCNA expression level. C, E, and G show representative experiments. (B, D, F, and H) *P < 0.05, **P < 0.01, ANOVA test.
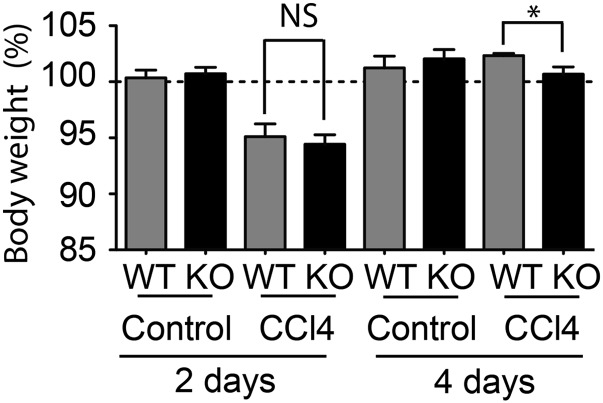
Following CCl4 injection, liver regeneration is known to cause a rapid increase in liver weight (18). To evaluate the changes in liver mass, the ratio of liver to body weight was used to avoid any bias between animals having different body weights. No difference was observed between WT and TOP1mt KO mice after olive oil injection (Fig. 1B), which is consistent with the fact that TOP1mt-deficient mice are normal in size. By contrast, administration of CCl4 resulted in a marked difference in liver to body weight between WT and TOP1mt KO mice. Two days after CCl4 injection, liver to body weight increased by 35% in WT animals, whereas this increase was only 10% in the TOP1mt KO mice (Fig. 1B). This difference was liver-specific because body weights after CCl4 injection were the same for the WT and TOP1mt KO mice (both losing approximately 6% of their original weight; Fig. S1).
Fig. S1.
Changes in body weight after treatment with CCl4. Results are normalized to wild-type controls before treatment (100%) (mean ± SEM; n = 8; *P < 0.05, ANOVA test).
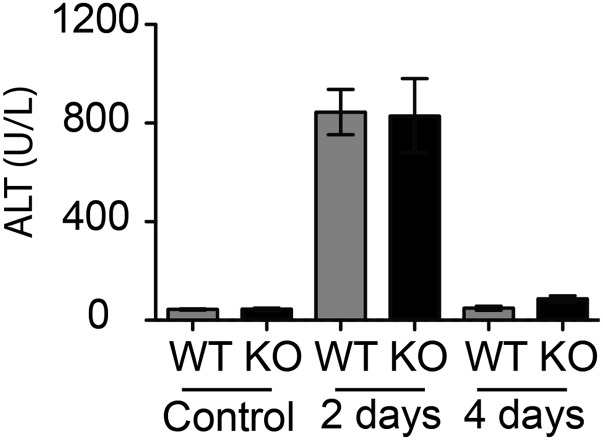
Because CCl4 induces necrosis in the centro-lobular zones of the hepatic lobules (reviewed in ref. 14), sections of the liver tissue were analyzed after H&E staining (Fig. 1 C and D). Two days after treatment, areas of necrosis around the central vein (CV) were similar in WT and TOP1mt KO mice. This result was paralleled by a sharp and comparable release into blood of alanine aminotransferase (ALT), a sensitive indicator of hepatocyte integrity. Transaminases that catalyze the transfer of the amino group (−NH2) of an amino acid to a carbonyl compound are abundant in the hepatocytes and very low in the blood. Upon hepatocyte damage, the enzymes are released into the bloodstream. In both WT and KO mice, ALT levels increased ∼15-fold after 2 d of recovery and returned to the basal levels at day 4 (Fig. S2). By this time, almost all necrotic areas in WT mice were cleared and replaced by regenerating parenchyma (Fig. 1C). Notably, the remaining necrotic and inflamed areas still persisted at day 4 after recovery in TOP1mt KO mice (Fig. 1C).
Fig. S2.
CCl4 administration induces elevation in serum level of alanine aminotransferase (ALT), a sensitive indicator of hepatocyte necrosis, at day 2 of recovery. Data shown as means ± SEM, n = 8.
To determine whether Top1mt affects cellular proliferation during liver regeneration, we used two classical biomarkers: Ki-67 and PCNA (proliferating cell nuclear antigen). Ki-67 staining revealed that TOP1mt KO mice were unable to elicit an adequate proliferative response to CCl4-mediated liver tissue injury (Fig. 1E), demonstrating that the fraction of proliferating cells was significantly reduced in the TOP1mt KO mice. After 2 d, more than 70% of WT hepatocytes were Ki-67–positive compared with less than 40% in TOP1mt KO livers (Fig. 1F). In support of these results, CCl4 treatment also induced a stronger PCNA expression in WT mice 2 d after CCl4 injection (Fig. 1 G and H). Notably, both the Ki-67 staining and PCNA expression decreased progressively in WT mice 4 d after injury, reflecting a successful completion of liver regeneration. In contrast, both proliferative markers were expressed at higher levels in TOP1mt KO mice 4 d after injury, indicative of a delayed liver regeneration in the absence of Top1mt (Fig. 1 C–H). Together, these results demonstrate that genetic deletion of TOP1mt does not affect the extent of the initial tissue damage but leads to attenuated hepatocyte replication and delayed liver regeneration.
Top1mt Enables mtDNA Expansion During Liver Regeneration.
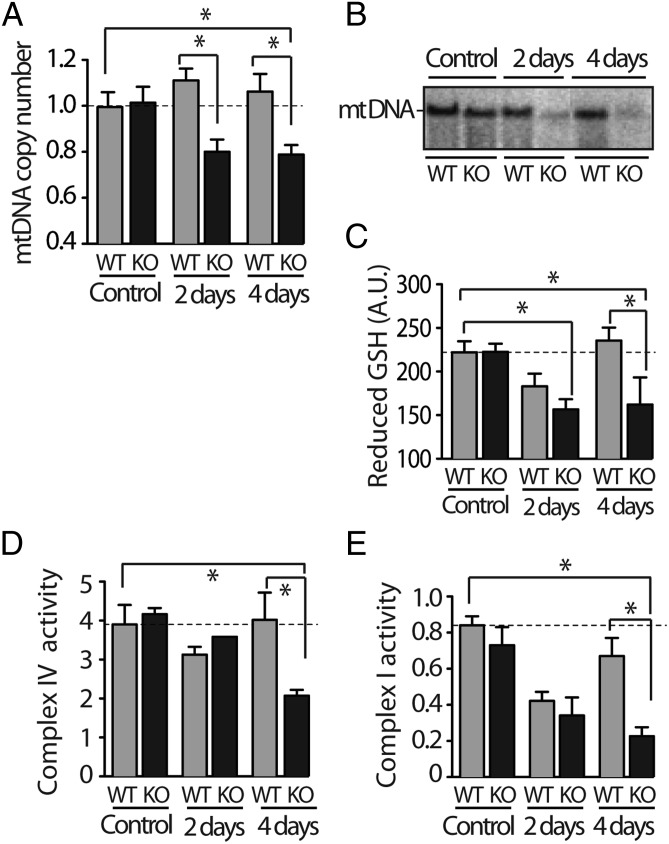
Dividing cells have to be metabolically balanced to respond to energy demand (11, 19). Fig. 2A shows that 2 and 4 days after CCl4 administration, mtDNA copy number [relative to nuclear DNA per cell normalized to the housekeeping nuclear gene β2 microglobulin (β2m)] was significantly reduced in KO mice (approximately 20% loss), whereas under the same conditions, matched WT siblings showed a slight increase in mtDNA copy number. Southern blot analysis also showed loss of liver mtDNA in KO mice (Fig. 2B). Mitochondrial DNA copy number is tightly regulated in a cell- and tissue-specific manner (20, 21). The decrease of mtDNA copy number observed in TOP1mt KO mice suggests that during acute hepatocytes proliferation, Top1mt is required for the appropriate expansion of mtDNA in the daughter cells.
Fig. 2.
Defective mtDNA and mitochondrial functions in liver tissue of TOP1mt knockout mice following CCl4 administration. (A) MtDNA copy number was quantified relative to nuclear DNA and expressed relative to untreated (control) wild type (WT) (n = 8 for control and n = 8 for CCl4 administration, *P < 0.05, ANOVA test). (B) Agarose/Southern blot analysis of linearized mtDNA. (C) Drop in reduced glutathione in mouse liver tissue lysates from TOP1mt KO mice following CCl4 exposure (n = 5 for control and n = 8 for CCl4, *P < 0.05, unpaired Student's t test). (D and E) Complex IV and complex I activities in isolated mitochondria from liver tissue, respectively. Data were normalized to citrate synthase activity.
Because mtDNA is packaged in nucleoids attached to the inner mitochondrial membrane near the respiratory chain proteins, the source of ROS, we tested whether mtDNA deficiency in TOP1mt KO mice was associated with changes in reduced glutathione (GSH), the main quencher of ROS. Administration of CCl4 significantly depleted the hepatic GSH levels (by 25%) both in WT and TOP1mt KO mice at day 2 after treatment (Fig. 2C), which is consistent with the reports that CCl4 metabolism releases free radicals causing acute GSH depletion (22). Four days after treatment, the level of GSH in WT mice completely recovered and reached the basal level, whereas GSH remained low in TOP1mt KO mice (Fig. 2C), indicating the persistence of ROS in TOP1mt KO mice.
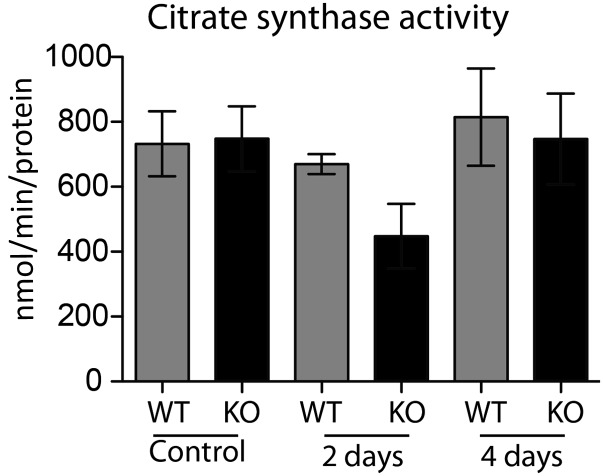
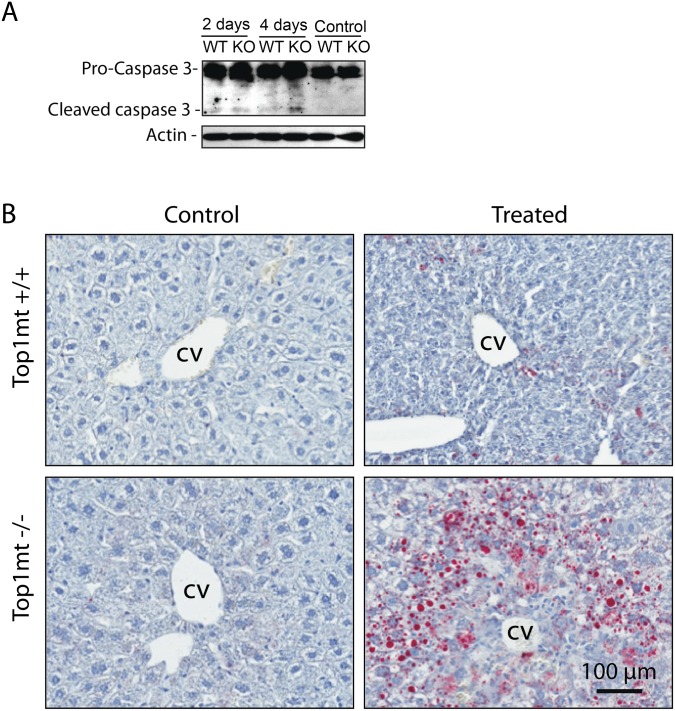
Because mtDNA alterations lead to respiratory chain defects, we assessed the enzymatic activities of the mitochondrial complexes IV and complex I in isolated mitochondria from liver tissue. All activities were normalized to the Krebs cycle enzyme citrate synthase (control for the amount of mitochondria used to measure the activity of each complex; Fig. S3). Fig. 2 D and E show that the activities of complexes IV and I were decreased by 45% and 75%, respectively, in TOP1mt KO mice at day 4 after CCl4 treatment. We also tested the expression of the nuclear-encoded respiratory chain protein, COX4, which is part of the oxidative chain phosphorylation complex IV. CCl4 markedly decreased the steady-state levels of COX4 in TOP1mt KO livers, consistent with the fact that respiratory chain proteins that fail to assemble in stable complexes are quickly degraded (23) (Fig. S4). However, ATP5A, a component of complex V, which is assembled even in the complete absence of mitochondrial protein synthesis (24), remained unaffected in both WT and TOP1mt KO mice (Fig. S4). These mitochondrial defects were accompanied by a slight increase in caspase-3 cleavage, indicative of apoptosis in TOP1mt KO mice at day 4 (Fig. S5A). Marked liver damage was also observed by increased Oil Red O staining in TOP1mt KO-regenerating livers 4 d after CCl4 injection (Fig. S5B). Together, these results demonstrate that mtDNA as well as mitochondria and hepatocyte functions are defective in TOP1mt KO mice after CCl4 treatment.
Fig. S3.
Activity of citrate synthase, a Krebs cycle enzyme used to normalize the mitochondrial amount in each sample to measure the activities of complexes I and IV. Mitochondria were harvested from 100 mg of liver tissue and suspended at a final concentration of protein at 2 mg/mL. Data shown as mean ± SEM, n = 3.
Fig. S4.
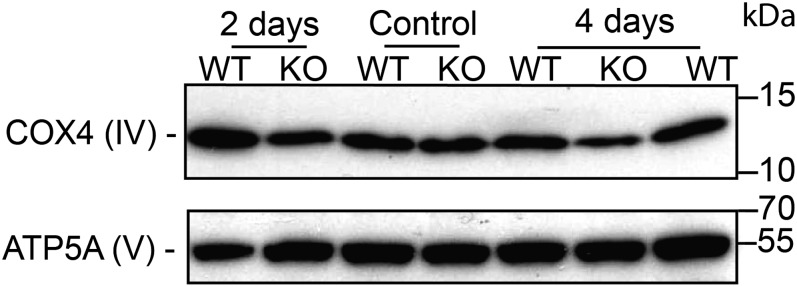
CCl4 administration decreases COX4 steady-state protein level in TOP1mt KO mice. Western blot shows the expression level of COX4 and ATP5A in liver tissue.
Fig. S5.
Increased liver damage in TOP1mt KO mice 4 d after exposure to CCl4. (A) Apoptosis analysis by Western blotting for cleaved caspase-3. β-actin was used as loading control. (B) Increased lipid accumulation in TOP1mt KO livers 4 d after CCl4 administration. Frozen liver sections were stained with Oil Red and counterstained with hematoxylin. CV, central vein.
Lack of TOP1mt Impairs Mitochondrial Functions and Steady-State Level of ATP in Primary Hepatocytes from Mice Treated with CCl4.
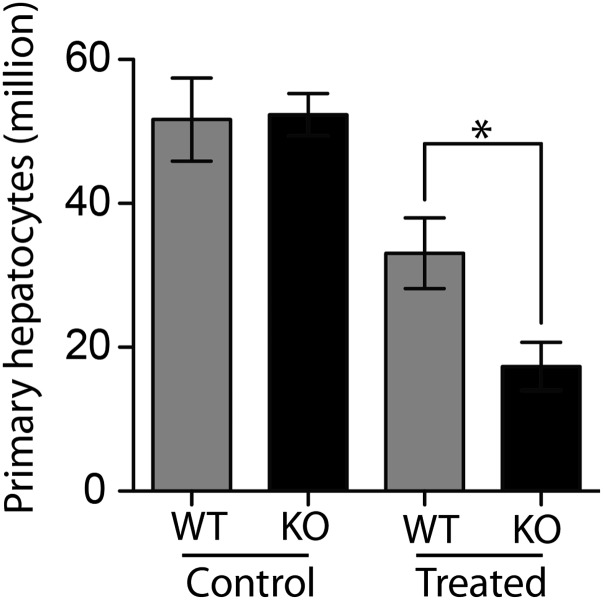
Because primary hepatocytes allow direct biochemical analyses, we isolated hepatocytes by a two-step collagenase perfusion followed by Percoll purification (25). Cells were harvested 4 d after CCl4 exposure and cultured for 24 h to allow reconstitution of cell polarity and function before analyses (26). The yield of viable TOP1mt-deficient hepatocytes was decreased more than twofold compared with the matched WT cells (Fig. S6), which is consistent with the reduced proliferation (Fig. 1 E and F) and more extensive hepatocyte damage (Fig. S5B) observed in the regenerating liver of the TOP1mt KO mice.
Fig. S6.
Decreased yield of viable hepatocytes from TOP1mt KO livers at day 4 after CCl4 administration. (n = 3. *P < 0.05, paired t test).
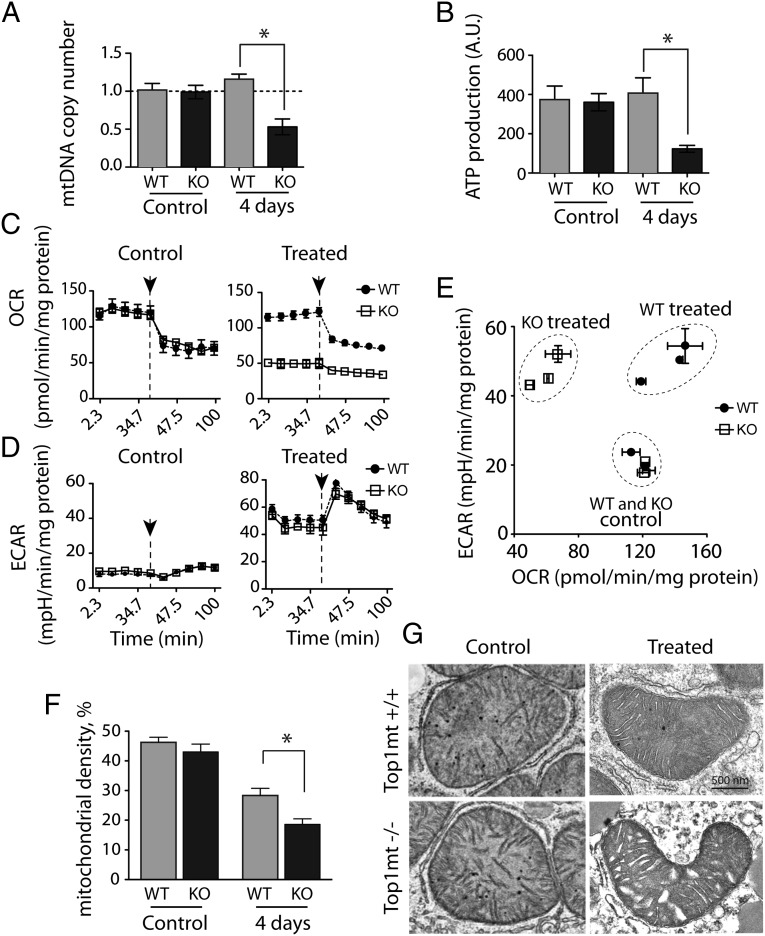
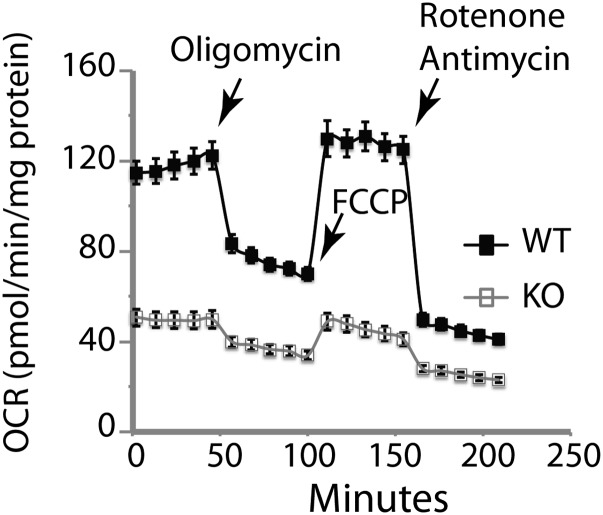
Measurement of mtDNA confirmed copy number deficiency in the primary hepatocytes from the CCl4-treated KO mice (Fig. 3A; consistent with Fig. 2 A and B). Steady-state levels of intracellular ATP were also markedly reduced (threefold lower in KO than for WT hepatocytes; Fig. 3B). Because defective ATP production due to dysfunctions of mitochondrial oxidative phosphorylation (OXPHOS) induces a compensatory increase in aerobic glycolysis, we analyzed the oxygen consumption rate (OCR, a measure of OXPHOS) and the extracellular acidification rate (ECAR, a measure of lactate production and glycolysis) (Fig. 3 C–E). Hepatocytes from KO-treated mice showed significantly lower basal OCR (Fig. 3C), indicating impaired mitochondrial respiration (Fig. S7). ECAR levels were elevated in both WT and KO hepatocytes from treated mice compared with untreated mice (Fig. 3D). Fig. 3E shows similar metabolic profiles for the hepatocytes from untreated WT and KO mice. However, the metabolic profiles of the WT and KO hepatocytes from CCl4-treated mice were different. WT hepatocytes showed robust glycolytic and respiratory activities, which is consistent with high metabolic activity to support liver regeneration, whereas the KO hepatocytes displayed a marked reduction in OCR and high ECAR, indicative of their reliance on glycolysis for energy production.
Fig. 3.
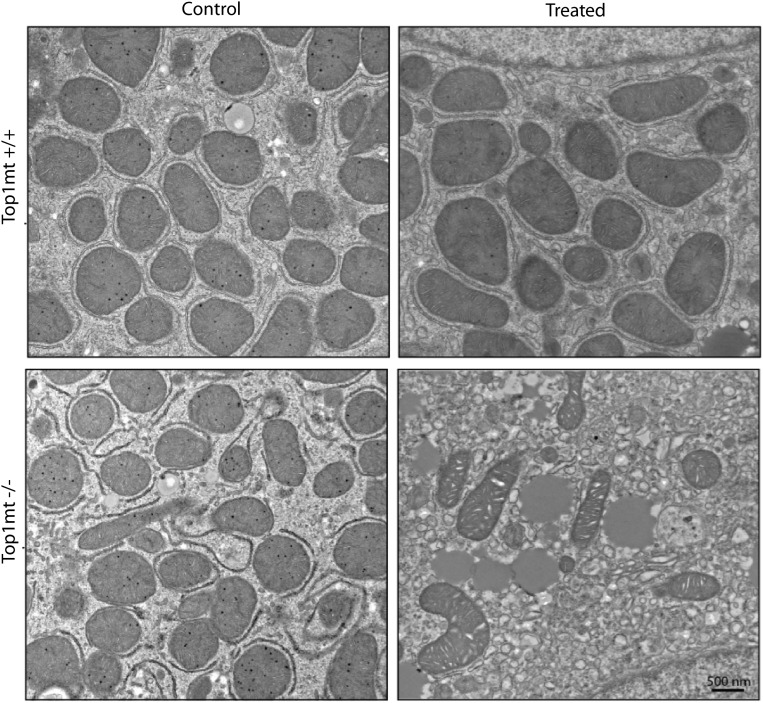
Defective mitochondrial functions in primary hepatocytes from TOP1mt knockout mice isolated four days after CCl4 treatment. (A) MtDNA copy number was quantified relative to nuclear DNA, and expressed relative to untreated (control) WT set as 1. (B) Intracellular ATP levels determined by the ATPlite luminescence assay. Oxygen consumption rate (OCR, a measure of OXPHOS) (C) and extracellular acidification rate (ECAR, a measure of lactate production and glycolysis) (D) measured by Seahorse XF296 Extracellular Flux Analyzer. Arrows indicate addition of oligomycin to inhibit mitochondrial respiration. (E) Defective metabolic profile (based on relative values of OCR and ECAR) of TOP1mt KO livers. Three KO and their paired WT siblings were included in each group. (F) Mitochondrial density assessed by electron microscopy (n = 10 cells for each genotype/group). *P < 0.05, paired t test. (G) Representative ultrastructure images of mitochondria from WT and TOP1mt KO primary hepatocytes from untreated and treated animals. (Scale bar: 500 nm.) Full-size images are shown in Fig. S8.
Fig. S7.
Respiration analysis of primary hepatocytes determined by Seahorse XF96 Extracellular Flux Analyzer. Hepatocytes were isolated from livers 4 d after treatment with CCl4 and cultured overnight. After baseline OCR determination, cells were sequentially treated with oligomycin A (1 µM), FCCP (0.3 µM), and rotenone (1 µM) + antimycin A (1 µM) as indicated by the arrows. The basal respiration rate of the KO hepatocytes was dramatically decreased compared with the WT cells. Top1mt KO hepatocytes were friable, and oxygen consumption could not stabilize after FCCP treatment.
Transmission electron microscopy was performed to assess the ultrastructure and density of mitochondria in the primary hepatocyte cultures (Fig. 3 F and G and Fig. S8). There were no obvious differences in the number and ultrastructure of mitochondria in primary hepatocytes isolated from the untreated WT and TOP1mt KO livers. However, in the hepatocytes from CCl4-treated mice, we observed that the KO hepatocytes displayed a significant reduction in mitochondrial density compared with the corresponding WT heptatocytes (Fig. 3F). In addition, the KO hepatocytes showed signs of a more extensive structural damage. The most obvious were changes in the appearance of mitochondrial cristae and disorganization and dilation of endoplasmic reticulum and frequent lipid droplets (Fig. 3G and Fig. S8). The accumulation of more progressive ultrastructural alterations in TOP1mt KO cells exposed to CCl4 could contribute to the low yield of viable hepatocytes (Fig. S5) and diminished functional performance. These data show that loss of Top1mt reduces the fitness and adaptive responses of hepatocytes.
Fig. S8.
CCl4 administration has profound effects on the mitochondria and cytoplasm of primary hepatocytes at day 4 of recovery. Representative electron micrographs are shown. They correspond to the enlarged images shown in Fig. 3G. (Scale bar: 500 nm.)
Top1mt Supports mtDNA Replication in MEFs and Human Cancer Cells.
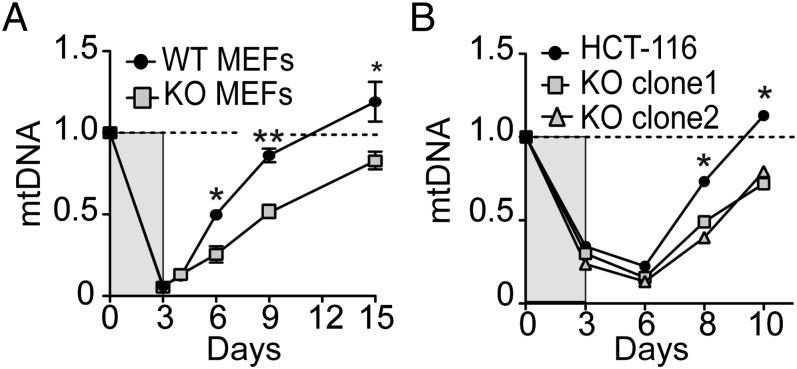
Top1mt sites are enriched in mtDNA replication and transcription regulatory regions (8, 27). Based on our results showing an uncoupling of mtDNA replication and cellular proliferation (Figs. 2 and 3), we tested whether cells lacking TOP1mt were defective in mtDNA synthesis. We took advantage of the fact that ethidium bromide (EB) selectively depletes mtDNA and that mtDNA recovers within days following EB removal (see protocol; Fig. 4A) (28, 29). These results show that mtDNA depletion was similarly effective in WT and TOP1mt KO murine embryonic fibroblasts (MEFs) after a 3-d EB treatment. However, mtDNA copy number recovered at different rates in WT and TOP1mt KO cells. WT MEFs recovered almost 90% of their initial mtDNA compared with 50% in TOP1mt KO MEFs after 9 d of recovery, and it took 15 d to regenerate 90% of mtDNA in the KO MEFs (Fig. 4B).
Fig. 4.
Delayed mtDNA recovery after EB treatment in TOP1mt knockout cells. Cells were treated with 1 µg/mL EB for 3 d. After washing cell cultures free of EB, mtDNA was quantified at the indicated days. MtDNA copy number in murine embryonic fibroblasts MEFs from knockout (KO) and wild-type (WT) mice (A), and in human colon carcinoma HCT116 cells (WT and TOP1mt KO; Figs. S9 and S10) following EB treatment (B). MtDNA copy number is expressed relative to nontreated cells (set as 1). n = 3, *P < 0.05, unpaired Student's t test.
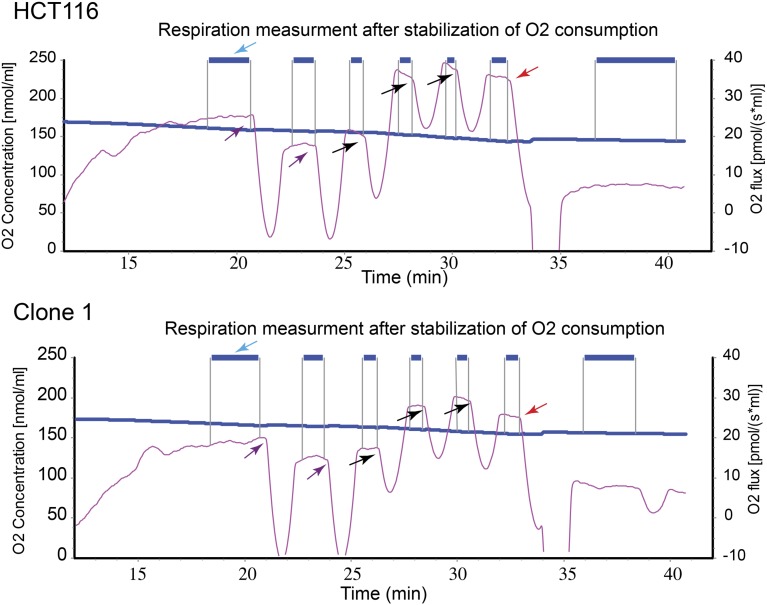
To further substantiate the role of Top1mt in mtDNA replication, we generated human colon carcinoma HCT116 cells, in which TOP1mt had been inactivated by using CRISPR/Cas9 (Fig. S9). Consistent with the results obtained in the MEFs (11) and hepatocytes (Fig. 3 C–E and Fig. S7), the TOP1mt KO HCT116 cells also displayed a defective mitochondrial respiration (Fig. S10), and delayed mtDNA recovery after EB treatment (Fig. 4C). These results were reproduced in two TOP1mt KO clones compared with the isogenic HCT116 WT cells (Fig. 4C). Taken together, these experiments demonstrate the importance of Top1mt for accelerated mtDNA synthesis and mitochondrial function.
Fig. S9.

Generation of TOP1mt KO cells using CRISPR/Cas9. (A) Western blot of whole-cell lysate using Top1mt-specific antibody (5). ATP5A was included as loading control. (B) Relative mRNA expression levels of Top1mt in HCT116 parental cells and Top1mt KO cells (clone 1, clone 2). (C) Representative gel of the PCR product of Top1mt following qPCR.
Fig. S10.
Respiration parameters in HCT116 WT and TOP1mt KO HCT116 cells. Polarography with a Clark-type oxygen electrode (Oroboros oxygraph-2k; Oroboros) was performed as described (39). The basal respiration rate of intact cells (3–5 × 10⁶ cells suspended in 200 µL of DMEM) was determined by measuring the linear rate of oxygen consumption. The nonphosphorylating respiration rate was recorded after addition of 1 and 2 µg/mL oligomycin (purple arrows). The maximal uncoupled respiration was recorded after addition of 50, 100, and 150 nM of carbonyl cyanide 4-(trifluoromethoxy)phenylhydrazone (FCCP, black arrows). Rotenone and antimycin were added to measure the no mitochondrial respiration (red arrow).
Discussion
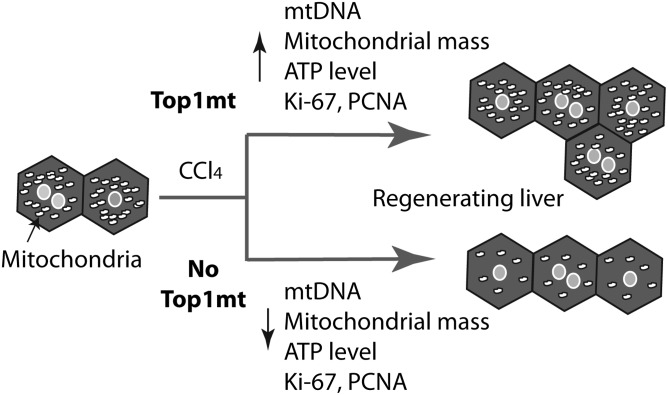
Diverse tissues have different metabolic profiles because of their inherently different functions. In addition, energy requirements need to be adjusted to physiological or pathological conditions. Hepatocytes are rich in mitochondria, and during liver regeneration, the cellular energy demand for biosynthesis of cellular components increases considerably. Building on the fact that the capacity of the liver to regenerate is correlated with efficient oxidative phosphorylation (OXPHOS) (30), we demonstrate the critical importance of mtDNA synthesis for liver regeneration. Mice lacking the mitochondrial topoisomerase gene TOP1mt are deficient in liver regeneration, due to decreased mtDNA and mitochondrial functions. The molecular mechanisms underlying the role of Top1mt in mtDNA adaptation are demonstrated by experiments showing that cells lacking Top1mt have impaired mtDNA synthesis. During cellular proliferation, mitochondrial mass and mtDNA must expand to provide an appropriate amount to daughter cells. Therefore, the decrease of mtDNA copy number observed in KO mice demonstrates that during acute hepatocytes proliferation, Top1mt is required to expand an appropriate number of mtDNA molecules to the daughter cells (Fig. 5).
Fig. 5.
Model for differential liver regeneration after CCl4 injection in WT and TOP1mt KO mice. CCl4 administration triggers hepatocytes replication. Top1mt allows mtDNA and mitochondrial mass to increase proportionally to support liver regeneration. Lack of Top1mt limits mtDNA replication, leading to decreased mtDNA in daughter cells, reduced mitochondrial mass and ATP production, and delayed liver regeneration.
Intact mtDNA is required for the production of the key catalytic subunits of the mitochondrial respiratory chain and, therefore, for ATP production. Here, we show that lack of Top1mt impairs mtDNA copy number expansion, delaying liver regeneration. However, lack of Top1mt was not lethal after CCl4 exposure, which is consistent with the fact that mtDNA copy number varies among individuals, and that hepatocytes have a surplus of mtDNA. We also demonstrate that mitochondria are defective and ROS accumulate following CCl4 treatment in the regenerating liver of TOP1mt KO mice. The importance of TOP1mt for mitochondrial regeneration and function are consistent with our recent finding that, in the heart, lack of TOP1mt accentuates mtDNA copy number loss, decreases respiratory chain protein expression levels, damages cristae ultrastructure organization, and increases ROS production after doxorubicin treatment (17).
Mitochondrial biogenesis occurs by division of preexisting organelles in coordination with cellular proliferation and nuclear DNA replication (12). Here, we show that Top1mt is required to expand and maintain the relative mitochondrial mass during acute hepatocytes proliferation after CCl4 administration (Fig. 5). Mitochondrial biogenesis is also up-regulated to increase energy production during exercise (31) and to compensate for mitochondrial dysfunction and preserve cellular ATP synthesis (32). In the case of liver regeneration, many studies have shed light on the molecular pathways controlling mitochondrial biogenesis (for review, see refs. 13 and 33). However, until now, the role of TOP1mt in regulating mtDNA copy number was unknown (20).
Under normal conditions, TOP1mt KO mice do not show significant mtDNA copy number depletion in the heart (17) and liver (current study). Moreover, TOP1mt KO mice exhibit normal life span and reproductive cycle (5). This normal phenotype was initially unexpected (5) because knocking out the other topoisomerases genes results in severe phenotypes. The nonessentiality of TOP1mt is likely due to the compensation of most Top1mt functions by other topoisomerases. Topoisomerases IIα and IIβ have both recently been shown in vertebrate mitochondria (5) as well as Top3α (34, 35). Under stress conditions [doxorubicin treatment for the heart (17) or CCl4 administration for the liver (present study)], lack of Top1mt becomes rate limiting by failing to increase mtDNA copy number. Thus, Top1mt appears to be primarily required to sustain acute mtDNA replication under stress conditions. Under such acute mtDNA replication, the compensation by other topoisomerases appears insufficient to appropriately regenerate mtDNA.
Drug-induced liver injuries and successful partial liver transplantations differ across individuals. The present study demonstrates the importance of Top1mt for mtDNA homeostasis during tissue regeneration. Because potentially deleterious genomic variants are present for TOP1mt in the normal population (17), further studies are warranted to determine whether deleterious genomic variant of TOP1mt and other mitochondrial DNA enzymes, which are all coded in the nucleus contribute to interindividual susceptibilities.
Materials and Methods
Mouse Handling.
TOP1mt+/+ (WT) and TOP1mt−/− (KO) mice were generated from heterozygous (TOP1mt+/−) parents. Each KO mouse had at least one sibling WT as control. Mice were genotyped by PCR using genomic DNA from mice tail tips (5). Three primers were used as follows: TOP1mt-A (5′-GGTGCTAGACATTGAACTCAG-), TOP1mt-B (5′-CTGCAAATGGCCTCGTTAGC), and TOP1mt-C (5′-GTCCTGGATTCCATCTTAAGC). KO and WT gave 254-and 306-bp PCR products, respectively (5). Seven-week-old mice were treated with a single i.p. injection of CCl4 [0.5 mL/kg body weight of CCl4 in 100 μL of 10% (vol/vol) CCl4 in olive oil]. Control animals received 100 μL of olive oil. Experiments were performed in accordance with the guidelines of the Animal Care and Use Committee of the National Institutes of Health (protocol LMP-010).
Immunohistochemistry (Ki-67) and Hematoxylin/Eosin (H&E) Staining.
Livers were fixed in 10% (vol/vol) neutral-buffered-formalin. Five-micrometer paraffin sections were stained with anti-Ki-67 (ab16667; Abcam). Details are provided in SI Materials and Methods.
Western Blotting.
For detection of PCNA, actin, and respiratory chain proteins, 50 mg of liver tissue were homogenized and lysed in RIPA buffer (89900; Thermo Scientific) supplemented with 0.4 M NaCl and protease inhibitors mixture (Roche Applied Science). Further details are provided in SI Materials and Methods.
Quantification of mtDNA by PCR and Southern Blotting.
Analyses were performed in liver tissue, primary hepatocytes, and in human colon carcinoma cells (HCT116) as described in SI Materials and Methods.
ROS Production Measured by Glutathione Assay.
ROS production was measured by quantifying reduced glutathione (GSH) in liver tissue. GSH levels were assessed in 50 mg of tissue lysates by using the luminescence-based GSH-Glo Glutathione Assay (Promega) according to the manufacturer’s protocol.
Mitochondrial Enzymatic Activities.
The activities of the complexes I and IV and the Krebs enzyme, citrate synthase, in isolated mitochondria from liver tissue were measured at 37 °C on Beckman DU-640B spectrophotometer (Beckman Coulter) by using standard methods (36). The activities of complexes I and IV were normalized to citrate synthase activity.
Primary Hepatocyte Isolation and Culture.
Hepatocytes were isolated by two-step collagenase perfusion of the mouse livers followed by isodensity purification in Percoll gradient (25). After quantification of viable cells with 0.4% Trypan blue (T10282; Life Technologies), cells were seeded in 96-well plates (for Seahorse analysis and ATP production) and in six-well plates [for electron microscopy (EM) analysis] in the plating medium supplemented with 10% (vol/vol) FBS (25). After 4 h, the plating medium was replaced by serum-free medium. Cells were cultured for 24 h before analyses.
Measurements of Extracellular Acidification and Oxygen Consumption Rate.
The XF96 Extracellular Flux Analyzer (Seahorse Bioscience) was used to detect rapid, real-time changes in cellular respiration and glycolysis rate as described (37). Details are provided in SI Materials and Methods.
Transmission Electron Microscopy.
Details are provided in SI Materials and Methods.
Generation of Human TOP1mt KO Cells.
TOP1mt KO HCT116 cells were generated by CRISPR genome editing (38) targeting exon 6 of TOP1mt (see details in SI Materials and Methods). Two independent clones (clones 1 and 2) showing undetectable Top1mt expression were used.
MtDNA Recovery After EB Depletion.
WT and TOP1mt KO murine embryo fibroblasts (MEFs) and human colon carcinoma HCT116 cells were seeded in six-well plates at 20% confluence. After 24 h, cells were incubated with or without 0.1 µg/mL EB. After 3 d, cells were washed at least five times with 3 mL of medium without EB. For each washing time, cells were incubated with washing medium for 30 min. After washing, mtDNA was quantified after 1, 3, 6, 12, and 15 d of recovery.
SI Materials and Methods
Immunohistochemistry (Ki-67).
Slides were examined with a high-resolution TV camera attached to a light microscope, and the magnification was calibrated with a stage micrometer (Zeiss) (Pathology/Histology Laboratory, Frederick National Laboratory for Cancer Research). Quantification of positive nuclei was done by comparing WT and KO mice from the same litters. For each animal (n = 5 for control and n = 8 for CCl4-treated mice), positive nuclei were counted from four to seven regions of liver sections and a mean value was obtained. Five different pictures from each region were used. More than 2,000 nuclei were counted for each animal.
H&E Staining.
Liver tissues were fixed in 10% (vol/vol) phosphate-buffered formalin, pH 7.4, at room temperature for 2 h. Sections of 5 μm from the paraffin-embedded livers were stained with H&E for histology analysis. Slides were examined by using a high-resolution TV camera (Spot Flex, Diagnostic Instruments) attached to a light microscope, and the magnification was calibrated with a stage micrometer (Zeiss) (Pathology/Histology Laboratory, Frederick National Laboratory for Cancer Research). The quantification of the necrotic areas was done by comparison of areas between WT and TOP1mt KO mice from the same litters. For each animal (n = 5 for control and n = 8 for CCl4-treated mice), five pictures from four to seven regions of liver sections were analyzed and a mean value was obtained.
Western Blotting.
After incubation for 1 h at 4 °C, lysates were centrifuged for 10 min at full speed and protein concentration in the supernatant was measured (Bio-Rad Protein Assay). Forty micrograms of protein were subjected to SDS/PAGE (EC6028BOX, 4–20% Tris-Glycine Gel; Novex) and transferred onto nitrocellulose membranes (Bio-Rad). After 1 h of blocking with 5% milk in PBST (PBS, Tween20 0.1%), membranes were incubated overnight with anti-PCNA antibody (G262; Santa Cruz). After three washes in PBST, the membrane was incubated with horseradish peroxidase-conjugated goat anti-rabbit antibody (NA934V; GE Life Sciences) for 1 h and then washed three times. Immunoblots were detected by using enhanced chemiluminescence detection kit (Pierce).
β-actin was detected with the same blots after stripping. Membranes were washed with PBST for 5 min and immersed in stripping buffer (21059; Thermo Scientific) for 30 min. After removing the stripping buffer, membranes were washed with PBST for 1 h and blocked with 5% milk for 30 min. Membranes were incubated overnight with anti–β-actin antibody (H062; Santa Cruz). Immunodetection for COX4 and ATP5A were performed similarly to the previous described protocol (Anti-OxPhos Complex Kit antibody, 457999; Invitrogen). The PageRuler Plus prestained protein ladder was used (26619; Thermo Scientific).
Blood ALT Level.
Animals were euthanized with CO2, and the blood was immediately harvested from the heart. Tubes containing lithium heparin and gel (365956; MICROTAINER Brand) for plasma separation were used. After mixing by inverting (10 times) the tubes containing the blood were centrifuged at 35 × g for 5 min. The gel allowed a clear separation of the cell (pellet) and plasma (supernatant). ALT levels were determined in the supernatant at Pathology/Histology Laboratory, SAIC Frederick, by biochemistry analysis.
Quantification of mtDNA Copy Number by PCR.
mtDNA quantification was performed in liver tissue, primary hepatocytes, and in human colon carcinoma cells (HCT116). Total DNA was isolated from 30 mg of liver tissue by using the DNeasy Blood and tissues Kit (QIAGEN). The DNeasy kit was also used to harvest the DNA from primary hepatocytes and HCT116 cells. Quantitative PCRs were performed in triplicates in 384-well reaction plates (Applied Biosystems). Each reaction (final volume 10 μL) contained 25 ng of DNA, 5 μL of Power SYBR-Green PCR Master Mix (Applied Biosystems), and 0.5 μM of each forward and reverse primer. COX3 gene (for mice tissue) and ND1 (for human cells) was amplified, and β2 microglobulin (β2m) was used as normalizing control.
Quantification of mtDNA by Southern Blotting.
Total DNA was isolated by using DNeasy Blood and tissues Kit (QIAGEN) from 50 mg of liver tissue. Two micrograms of total DNA were digested with XhoI and separated in 0.3% agarose gels at 4 °C overnight. DNA was blotted by capillary transfer into Hybond-N+ membrane (GE Healthcare) and hybridized with a 32P-labeled probe for mouse-mtDNA (nucleotides 15007–15805). 32P signals were visualized by PhosphorImager (Molecular Dynamics).
Primers List.
Primer sequences used for mice tissue:
β2m F: 5′-AAATGCTGAAGAACGGGAAAA-3′
β2m R: 5′-ATAGAAAGACCAGTCCTTGCTGAAG-3′
COX3 F: 5′-TCATGCATATCACATAGTTAATCC-3′
COX3 R: 5′-AGACCTGATGTTAGAAGGAG-3′
Primers sequences used for human cells:
β2m F: 5′-TGCTGTCTCCATGTTTGATGTATCT-3′
β2m R: 5′-TCTCTGCTCCCCACCTCTAAGT-3′
ND1 F: 5′-AAGTCACCCTAGCCATCATTCTAC-3′
ND1 R: 5′-GCAGGAGTAATCAGAGGTGTTCTT-3′
Measurements of Extracellular Acidification and Oxygen Consumption Rate.
The XF96 Extracellular Flux Analyzer (Seahorse Bioscience) was used to detect rapid, real-time changes in cellular respiration and glycolysis rate. Briefly, cells (5,000–20,000 cells per well) were cultured in XF96 microplates. Analysis of extracellular acidification rate (ECAR) reflects lactate excretion and serves as an indirect measure of glycolysis rate, whereas O2 consumption (OCR) reflects cellular respiration and is directly determined. All measurements were performed following manufacturer's instructions and protocols, and the observed rates are reported in pMol/min for OCR and mpH/min for ECAR.
Transmission Electron Microscopy.
After isolation, different concentrations of primary hepatocytes were incubated in six-well plates for 24 h. After washing with PBS, cells were immediately fixed in 4% (vol/vol) formaldehyde, 2% (vol/vol) glutaraldehyde, 0.1 M cacodylate (pH 7.4) for 2 h at room temperature. Cells were postfixed in 1% osmium tetroxide for 1 h and stained in 0.5% uranyl acetate for another hour. The samples were then dehydrated in a graded series of 35%, 50%, 70%, 100% (vol/vol) ethanol. Samples were then embedded in 100% epoxy resin, incubated without lid for 16 h, and after changing to resin one more time to fresh 100% resin, polymerization was performed for 2 d at 55 °C. Thin sections of 70–90 nm were cut with an ultramicrotome (Leica EM UC6; Leica Microsystems), stained with uranyl acetate and lead citrate, lightly carbon coated, and imaged in a Hitachi 7650 or 7600 transmission electron microscope (Hitachi High Technologies America). Images were taken with 2k × 2k AMT digital camera (Advanced Microscopy Techniques). The density of mitochondria in WT and TOP1mt KO primary hepatocytes was estimated by using the point-counting method in a blinded fashion. Three random pictures were taken from each individual cell at a magnification of 5,000 and analyzed at a final magnification of 27,300. For each set of three pictures, average volume density was calculated and used to estimate the mean volume density for each genotype and treatment group.
Generation of the Human TOP1mt KO Cells.
Plasmid pX330 with the cloned-in target site sequence (target site: GCTCCGATAACACCGTCACGTGG) were cotransfected with a Puro-resistance gene flanked by homology arms upstream and downstream of the target site. Transfected cells were selected with 1 μg/mL puromycin 72 h after initial transfection for cells with puro-resistance gene recombined into at least one copy of the target site. Secondary screen by quantitative PCR (qPCR) and by Western blotting was carried out to identify clones with different levels of TOP1mt expression. Two independent clones (clones 1 and 2) showed undetectable level of Top1mt expression and were used as knockout clones in subsequent experiments (Figs. S9 and S10).
Acknowledgments
We thank K. Nagashima and U. Baxa for EM support and the Pathology/Histology Laboratory, Frederick National Laboratory for Cancer Research (S. Florea, L. Dutko, J. Krolus, G. V. Rivera, B. Gouker, and D. Butcher for liver tissue staining and R. Smith for blood analysis). Our studies are supported by the Intramural Programs of the National Cancer Institute, Center of Cancer Research Grant Z01 BC006161.
Footnotes
The authors declare no conflict of interest.
This article is a PNAS Direct Submission. W.C.C. is a guest editor invited by the Editorial Board.
This article contains supporting information online at www.pnas.org/lookup/suppl/doi:10.1073/pnas.1511016112/-/DCSupplemental.
References
- 1.Bonawitz ND, Clayton DA, Shadel GS. Initiation and beyond: Multiple functions of the human mitochondrial transcription machinery. Mol Cell. 2006;24(6):813–825. doi: 10.1016/j.molcel.2006.11.024. [DOI] [PubMed] [Google Scholar]
- 2.Champoux JJ. DNA topoisomerases: Structure, function, and mechanism. Annu Rev Biochem. 2001;70:369–413. doi: 10.1146/annurev.biochem.70.1.369. [DOI] [PubMed] [Google Scholar]
- 3.Pommier Y. Drugging topoisomerases: Lessons and challenges. ACS Chem Biol. 2013;8(1):82–95. doi: 10.1021/cb300648v. [DOI] [PMC free article] [PubMed] [Google Scholar]
- 4.Pommier Y, Leo E, Zhang H, Marchand C. DNA topoisomerases and their poisoning by anticancer and antibacterial drugs. Chem Biol. 2010;17(5):421–433. doi: 10.1016/j.chembiol.2010.04.012. [DOI] [PMC free article] [PubMed] [Google Scholar]
- 5.Zhang H, et al. Increased negative supercoiling of mtDNA in TOP1mt knockout mice and presence of topoisomerases IIα and IIβ in vertebrate mitochondria. Nucleic Acids Res. 2014;42(11):7259–7267. doi: 10.1093/nar/gku384. [DOI] [PMC free article] [PubMed] [Google Scholar]
- 6.Zhang H, et al. Human mitochondrial topoisomerase I. Proc Natl Acad Sci USA. 2001;98(19):10608–10613. doi: 10.1073/pnas.191321998. [DOI] [PMC free article] [PubMed] [Google Scholar]
- 7.Dalla Rosa I, et al. Adaptation of topoisomerase I paralogs to nuclear and mitochondrial DNA. Nucleic Acids Res. 2009;37(19):6414–6428. doi: 10.1093/nar/gkp708. [DOI] [PMC free article] [PubMed] [Google Scholar]
- 8.Zhang H, Pommier Y. Mitochondrial topoisomerase I sites in the regulatory D-loop region of mitochondrial DNA. Biochemistry. 2008;47(43):11196–11203. doi: 10.1021/bi800774b. [DOI] [PMC free article] [PubMed] [Google Scholar]
- 9.Sobek S, et al. Negative regulation of mitochondrial transcription by mitochondrial topoisomerase I. Nucleic Acids Res. 2013;41(21):9848–9857. doi: 10.1093/nar/gkt768. [DOI] [PMC free article] [PubMed] [Google Scholar]
- 10.Medikayala S, Piteo B, Zhao X, Edwards JG. Chronically elevated glucose compromises myocardial mitochondrial DNA integrity by alteration of mitochondrial topoisomerase function. Am J Physiol Cell Physiol. 2011;300(2):C338–C348. doi: 10.1152/ajpcell.00248.2010. [DOI] [PMC free article] [PubMed] [Google Scholar]
- 11.Douarre C, et al. Mitochondrial topoisomerase I is critical for mitochondrial integrity and cellular energy metabolism. PLoS One. 2012;7(7):e41094. doi: 10.1371/journal.pone.0041094. [DOI] [PMC free article] [PubMed] [Google Scholar]
- 12.Lee S, Kim S, Sun X, Lee JH, Cho H. Cell cycle-dependent mitochondrial biogenesis and dynamics in mammalian cells. Biochem Biophys Res Commun. 2007;357(1):111–117. doi: 10.1016/j.bbrc.2007.03.091. [DOI] [PubMed] [Google Scholar]
- 13.Böhm F, Köhler UA, Speicher T, Werner S. Regulation of liver regeneration by growth factors and cytokines. EMBO Mol Med. 2010;2(8):294–305. doi: 10.1002/emmm.201000085. [DOI] [PMC free article] [PubMed] [Google Scholar]
- 14.Mao SA, Glorioso JM, Nyberg SL. Liver regeneration. Transl Res. 2014;163(4):352–362. doi: 10.1016/j.trsl.2014.01.005. [DOI] [PMC free article] [PubMed] [Google Scholar]
- 15.Durand F, et al. 2002. Auxiliary liver transplantation for fulminant hepatitis B: Results from a series of six patients with special emphasis on regeneration and recurrence of hepatitis B. Liver Transpl 8(8):701–707.
- 16.Manibusan MK, Odin M, Eastmond DA. Postulated carbon tetrachloride mode of action: A review. J Environ Sci Health C Environ Carcinog Ecotoxicol Rev. 2007;25(3):185–209. doi: 10.1080/10590500701569398. [DOI] [PubMed] [Google Scholar]
- 17.Khiati S, et al. 2014. Mitochondrial topoisomerase I (top1mt) is a novel limiting factor of Doxorubicin cardiotoxicity. Clinical Cancer Res 20(18):4873–4881.
- 18.Uemitsu N, Nakayoshi H. Evaluation of liver weight changes following a single oral administration of carbon tetrachloride in rats. Toxicol Appl Pharmacol. 1984;75(1):1–7. doi: 10.1016/0041-008x(84)90069-3. [DOI] [PubMed] [Google Scholar]
- 19.Zoppoli G, et al. Coordinated regulation of mitochondrial topoisomerase IB with mitochondrial nuclear encoded genes and MYC. Nucleic Acids Res. 2011;39(15):6620–6632. doi: 10.1093/nar/gkr208. [DOI] [PMC free article] [PubMed] [Google Scholar]
- 20.Moraes CT. What regulates mitochondrial DNA copy number in animal cells? Trends Genet. 2001;17(4):199–205. doi: 10.1016/s0168-9525(01)02238-7. [DOI] [PubMed] [Google Scholar]
- 21.Shadel GS, Clayton DA. Mitochondrial DNA maintenance in vertebrates. Annu Rev Biochem. 1997;66:409–435. doi: 10.1146/annurev.biochem.66.1.409. [DOI] [PubMed] [Google Scholar]
- 22.Shimuzu M, Morita S, Yamano T, Yamada A. Relationship between hepatic glutathione content and carbon tetrachloride-induced hepatotoxicity in vivo. Toxicol Lett. 1989;47(1):95–102. doi: 10.1016/0378-4274(89)90089-1. [DOI] [PubMed] [Google Scholar]
- 23.Park CB, et al. MTERF3 is a negative regulator of mammalian mtDNA transcription. Cell. 2007;130(2):273–285. doi: 10.1016/j.cell.2007.05.046. [DOI] [PubMed] [Google Scholar]
- 24.Buchet K, Godinot C. Functional F1-ATPase essential in maintaining growth and membrane potential of human mitochondrial DNA-depleted rho degrees cells. J Biol Chem. 1998;273(36):22983–22989. doi: 10.1074/jbc.273.36.22983. [DOI] [PubMed] [Google Scholar]
- 25.Kao CY, Factor VM, Thorgeirsson SS. Reduced growth capacity of hepatocytes from c-myc and c-myc/TGF-alpha transgenic mice in primary culture. Biochem Biophys Res Commun. 1996;222(1):64–70. doi: 10.1006/bbrc.1996.0698. [DOI] [PubMed] [Google Scholar]
- 26.Wanson JC, Drochmans P, Mosselmans R, Ronveaux MF. Adult rat hepatocytes in primary monolayer culture. Ultrastructural characteristics of intercellular contacts and cell membrane differentiations. J Cell Biol. 1977;74(3):858–877. doi: 10.1083/jcb.74.3.858. [DOI] [PMC free article] [PubMed] [Google Scholar]
- 27.Dalla Rosa I, et al. Mapping topoisomerase sites in mitochondrial DNA with a poisonous mitochondrial topoisomerase I (Top1mt) J Biol Chem. 2014;289(26):18595–18602. doi: 10.1074/jbc.M114.555367. [DOI] [PMC free article] [PubMed] [Google Scholar]
- 28.Meyer RR, Simpson MV. DNA biosynthesis in mitochondria. Differential inhibition of mitochondrial and nuclear DNA polymerases by the mutagenic dyes ethidium bromide and acriflavin. Biochem Biophys Res Commun. 1969;34(2):238–244. doi: 10.1016/0006-291x(69)90637-8. [DOI] [PubMed] [Google Scholar]
- 29.Leibowitz RD. The effect of ethidium bromide on mitochondrial DNA synthesis and mitochondrial DNA structure in HeLa cells. J Cell Biol. 1971;51(1):116–122. doi: 10.1083/jcb.51.1.116. [DOI] [PMC free article] [PubMed] [Google Scholar]
- 30.Guerrieri F, et al. Correlation between rat liver regeneration and mitochondrial energy metabolism. Biochim Biophys Acta. 1995;1272(2):95–100. doi: 10.1016/0925-4439(95)00072-c. [DOI] [PubMed] [Google Scholar]
- 31.Russell AP, Foletta VC, Snow RJ, Wadley GD. Skeletal muscle mitochondria: A major player in exercise, health and disease. Biochim Biophys Acta. 2014;1840(4):1276–1284. doi: 10.1016/j.bbagen.2013.11.016. [DOI] [PubMed] [Google Scholar]
- 32.Gonzalvez F, et al. Barth syndrome: Cellular compensation of mitochondrial dysfunction and apoptosis inhibition due to changes in cardiolipin remodeling linked to tafazzin (TAZ) gene mutation. Biochim Biophys Acta. 2013;1832(8):1194–1206. doi: 10.1016/j.bbadis.2013.03.005. [DOI] [PubMed] [Google Scholar]
- 33.Diaz F, Moraes CT. Mitochondrial biogenesis and turnover. Cell Calcium. 2008;44(1):24–35. doi: 10.1016/j.ceca.2007.12.004. [DOI] [PMC free article] [PubMed] [Google Scholar]
- 34.Wang Y, Lyu YL, Wang JC. Dual localization of human DNA topoisomerase IIIalpha to mitochondria and nucleus. Proc Natl Acad Sci USA. 2002;99(19):12114–12119. doi: 10.1073/pnas.192449499. [DOI] [PMC free article] [PubMed] [Google Scholar]
- 35.Wu J, Feng L, Hsieh TS. Drosophila topo IIIalpha is required for the maintenance of mitochondrial genome and male germ-line stem cells. Proc Natl Acad Sci USA. 2010;107(14):6228–6233. doi: 10.1073/pnas.1001855107. [DOI] [PMC free article] [PubMed] [Google Scholar]
- 36.Medja F, et al. Development and implementation of standardized respiratory chain spectrophotometric assays for clinical diagnosis. Mitochondrion. 2009;9(5):331–339. doi: 10.1016/j.mito.2009.05.001. [DOI] [PubMed] [Google Scholar]
- 37.Yang Y, et al. UOK 262 cell line, fumarate hydratase deficient (FH-/FH-) hereditary leiomyomatosis renal cell carcinoma: in Vitro and in vivo model of an aberrant energy metabolic pathway in human cancer. Cancer Genet Cytogenet. 2010;196(1):45–55. doi: 10.1016/j.cancergencyto.2009.08.018. [DOI] [PMC free article] [PubMed] [Google Scholar]
- 38.Cong L, et al. Multiplex genome engineering using CRISPR/Cas systems. Science. 2013;339(6121):819–823. doi: 10.1126/science.1231143. [DOI] [PMC free article] [PubMed] [Google Scholar]
- 39.Loiseau D, et al. Mitochondrial coupling defect in Charcot-Marie-Tooth type 2A disease. Ann Neurol. 2007;61(4):315–323. doi: 10.1002/ana.21086. [DOI] [PubMed] [Google Scholar]


