

Abstract
A main goal of the U.S. Tox21 program is to profile a 10K-compound library for activity against a panel of stress-related and nuclear receptor signaling pathway assays using a quantitative high-throughput screening (qHTS) approach. However, assay artifacts, including nonreproducible signals and assay interference (e.g., autofluorescence), complicate compound activity interpretation. To address these issues, we have developed a data analysis pipeline that includes an updated signal noise–filtering/curation protocol and an assay interference flagging system. To better characterize various types of signals, we adopted a weighted version of the area under the curve (wAUC) to quantify the amount of activity across the tested concentration range in combination with the assay-dependent point-of-departure (POD) concentration. Based on the 32 Tox21 qHTS assays analyzed, we demonstrate that signal profiling using wAUC affords the best reproducibility (Pearson's r = 0.91) in comparison with the POD (0.82) only or the AC50 (i.e., half-maximal activity concentration, 0.81). Among the activity artifacts characterized, cytotoxicity is the major confounding factor; on average, about 8% of Tox21 compounds are affected, whereas autofluorescence affects less than 0.5%. To facilitate data evaluation, we implemented two graphical user interface applications, allowing users to rapidly evaluate the in vitro activity of Tox21 compounds.
Keywords: qHTS data analysis, in vitro activity profiling, Tox21, concentration-response curve
Introduction
Tox21 is a U.S. federal interagency collaboration involving the National Institute of Environmental Health Sciences (NIEHS)/National Toxicology Program (NTP), the U.S. Environmental Protection Agency's (EPA's) National Center for Computational Toxicology, the U.S. Food and Drug Administration, and the National Center for Advancing Translational Sciences (NCATS). Currently, a major effort is screening a 10K-compound library against a panel of assays related to stress and nuclear receptor signaling pathways.1
Tox21 employs a quantitative high-throughput screening (qHTS) approach to test compounds at multiple concentrations as opposed to using a single concentration typical for HTS in drug discovery. This facilitates the detection of weakly active compounds, an important outcome because such compounds may also cause adverse health outcomes in vivo, especially under chronic exposure conditions.2 Moreover, systematic activity profiling across a broad range of concentrations might help elucidate the complex interactions between chemicals and diverse biological networks.
Ideally, “actives” in qHTS assays are (1) reproducible in the same assay across experimental runs3 and (2) relevant to the pathway of interest.4 Several approaches for activity classification have been developed to analyze qHTS data5–9; however, these approaches tend to focus on the first criterion more than the second criterion. Each criterion links to different challenges of hit calling. For criterion 1, the challenge is to distinguish robust from nonrobust signals and involves the identification and removal of nonreproducible artifacts such as noise and technical artifacts at the well or plate level.6,10,11 Increased attention is now directed at criterion 2,12 in which the challenge is to identify compound-dependent assay interference (i.e., reproducible artifacts).13 Tox21 qHTS technologies rely heavily on sensitive light-based detection methods using either fluorescence (e.g., β-lactamase reporter) or luminescence (e.g., luciferase reporter). For example, in activation-type assays, autofluorescent compounds or stabilizers of luciferase could result in reproducible, strong signals that are false-positives. Similarly, for inhibition-type assays, it can be difficult to separate compound-induced cytotoxicity from the response of interest. Counterscreens can help to identify compounds that interfere with the assay.13 Among the Tox21 assays, counterscreens to identify autofluorescent and cytotoxic compounds are used. In addition, it is useful to flag those compounds with substructures that tend to be promiscuous in HTS assays.14,15 Thus, the challenge is to effectively integrate knowledge from multiple sources.
Moreover, there are limitations inherent to the qHTS pipeline analysis approaches currently used for activity profiling. The Curve Class approach5 developed at NCATS has been widely used for prioritizing actives in qHTS data; it provides a categorical activity outcome (i.e., Curve Class, representing curve data quality) and other activity metrics including efficacy (i.e., Emax, maximal elicited response) and the AC50 (i.e., half-maximal response concentration). Although a categorical activity outcome is easy to interpret, it is not ideal for numerical activity ranking. Furthermore, the AC50 by itself might be inadequate when profiling compounds with widely differing efficacies (i.e., compounds with the same AC50 value but different efficacies should be treated differently) or could be inaccurate when based on concentration-response curves with poor data quality.16 The three-stage approach7 developed by Shockley for qHTS data adopts a monotonicity model but without considering the impact of outlier data. Thus, the approach might not accurately handle severely nonmonotonic curves, which could happen in qHTS data due to, for example, cytotoxicity or interference with protein trafficking.
To address these issues, we developed a data analysis pipeline for evaluating Tox21 qHTS data. Although specific for such data, some of the pipeline's components can be applied to other concentration-response screening projects. We applied the pipeline to data from 32 assays covering 20 pathways of interest. We found that signal reproducibility greatly improved after removing the nonreproducible artifacts, whereas, as expected, the number of compounds classified as active was reduced after taking cytotoxicity and autofluorescence into account. Finally, to facilitate Tox21 data exploration, we designed graphical user interfaces (GUIs) for the activity profiling data analyzed by the pipeline.
Methods
Tox21 10K Library
The Tox21 10K library (http://www.epa.gov/ncct/dsstox/sdf_tox21s.html) includes three sublibraries, each provided by a separate Tox21 partner, and collectively consists of ∼10,500 substances (∼8300 unique compounds). The sublibraries were named EPA, NPC (National Institutes of Health Chemical Genomics Center Pharmaceutical Collection), and NTP. Each of the sublibraries contains three 1536-well compound plates (A, B, C), and each compound plate was screened at 15 concentrations on three independent runs (Suppl. Fig. S1). In total, 405 plates (3 agencies × 3 compound plates × 3 screening plates × 15 concentrations) were used in the analysis, resulting in at least ∼30,000 (10,000 substances screened on 3 separate days) concentration-response curves for each assay.
Tox21 Assays
At the time of this analysis, the Tox21 10K compound library had been screened in 32 assays covering 20 different pathways related to stress response and nuclear receptor activity. The names of these 20 pathways are provided in Table 1. The assays are classified into three groups: (1) activation-type assays (10), (2) inhibition-type assays (8), and (3) cytotoxicity assays (14). These Tox21 qHTS assays use either fluorescence (e.g., β-lactamase reporter) or luminescence (e.g., luciferase reporter) technology. The luciferase reporter gene assay has only one assay readout; however, the β-lactamase report gene assay has two assay readouts: background (channel 1, ch1) and gene expression readout (channel 2, ch2), which are used to calculate a ratio (ch2/ch1) for analysis. The complete assay names as well as their classification can be found in Supplemental Table S1.
Table 1.
Pathways screened in the Tox21 assays.
| Pathway Type | Toxicity Pathway | Abbreviation | PubChem Assay ID |
|---|---|---|---|
| Stress response | Induced stabilization of the ATAD5 protein in Hek293 cells | atad5 | 720516 |
| Induced stabilization in HCT-116 cells | p53 | 720552 | |
| DNA damage (stalled replication fork [srf] formation) in DT40 cells | dna_damage (srf) | 743014, 743012 | |
| DNA damage (double strand break [dsb] formation) in DT40 cells | dna_damage (dsb) | 743015, 743012 | |
| Mitochondria membrane potential in HepG2 cells | mitotox | 720637 | |
| Nuclear receptors | Androgen receptor (AR) (partial receptor) agonism and antagonism in Hek293 cells | ar_agonism/ar_ antagonism (hek293) | 743053, 743063 |
| AR (full receptor) agonism and antagonism in MDA-kb-2 cells | ar_agonism/ar_ antagonism (mdakb2) | 743040, 743054 | |
| Aryl hydrocarbon receptor (AHR) (full receptor) agonism in HepG2 cells | ahr | 743122 | |
| Estrogen receptor (ER) alpha (partial receptor) agonism and antagonism in Hek293 cells | er_agonism/er_ antagonism (hek293) | 743077, 743078 | |
| ER alpha (full receptor) agonism and antagonism in BG1 cells | er_agonism/er_ antagonism (bg1) | 743079, 743091 | |
| Glucocorticoid receptor (GR) (full receptor) agonism and antagonism in HeLa cells | gr_agonism/gr_ antagonism | 720719, 720725 | |
| Peroxisome proliferator-activated receptor gamma (PPARg) (partial receptor) in Hek293 cells | pparg_agonism | 743140 | |
| Thyroid receptor (TR) (full receptor) agonism and antagonism in GH3 rat cells | tr_agonism/tr_antagonism | 743066, 743067 | |
| Other | Inhibition of aromatase in MCF-7 cells | aromatase | 743139 |
Pipeline Components
The concentration-response data preprocessed (normalization and pattern correction) by NCATS were used for pipeline analysis (Fig. 1a). This pipeline consisted of components at the plate level (signal noise filtering, curation, and quantification), at the substance/source level (assay interference identification), and at the compound level (hit calling/ranking). The source code of plate-level component (Curvep) can be found in GitHub (Curvep: https://github.com/sedykh/curvep). The components at other levels were implemented in R (version 3.01) and Konstanz Information Miner (KNIME, http://knime.org, version 2.92). The data processed by the pipeline and the source code in each component can be found in the Odum Institute Dataverse Network (http://arc.irss.unc.edu/dvn/dv/curvepwauc). The documentation of each component for Tox21 data can be found in the Supplementary Material.
Figure 1.
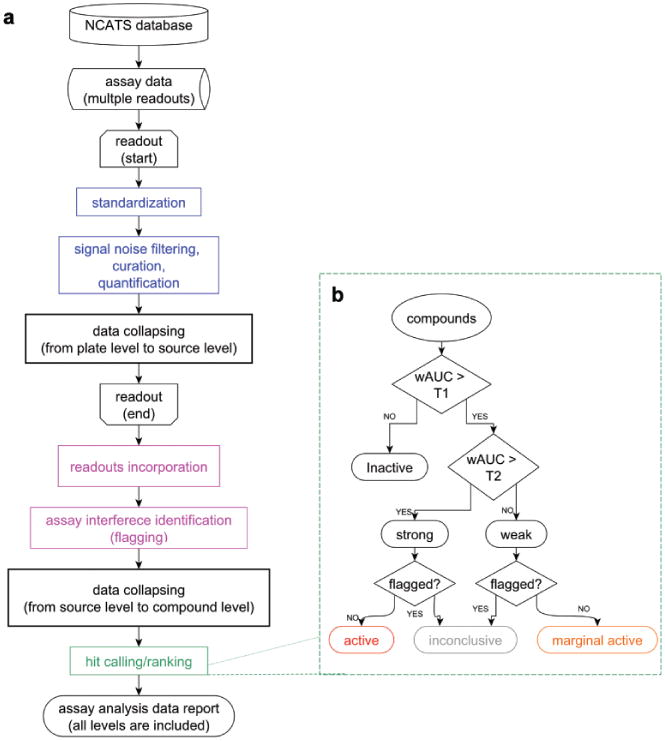
Quantitative high-throughput screening profiling pipeline. (a) Blue components represent the analysis at plate level, magenta components represent the analysis at the source level, and the green component represents the analysis at compound level. (b) Compound hit calling/ranking schema.
Plate-Level Components
Signal noise filtering and curation
We processed the normalized concentration-response data using an established qHTS noise-filtering algorithm (Curvep).11 Curvep adjusts data points that violate monotonic concentration-response pattern and suppresses near-baseline noise using a user-defined baseline noise threshold (THR). To obtain optimal baseline noise threshold values for Curvep, a range of THR values was tested. The range was estimated by the assay-dependent standard deviation (SD) parameter (Suppl. Table S1), which is the standard deviation of the responses (after normalization and pattern correction) in the DMSO control plates in each qHTS assay. After Curvep, the curves were labeled either as clean signals or as having nonreproducible artifacts. The common nonreproducible artifacts in qHTS curves were pin-tool compound carryover across assay plates, baseline shift, and false spikes (Suppl. Fig. S3a, e, f; Table 2). A pattern recognition algorithm (i.e., signal curation) has been newly implemented into Curvep (Supplemental Material, Methods) to handle these artifacts.
Table 2.
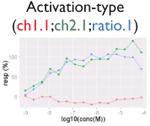
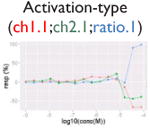
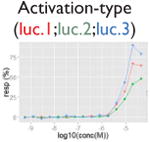
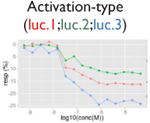
Challenges in quantitative high-throughput screening data analysis.a.
| Challenge Description | True Signal/Activity | False Signal/Assay Interference |
|---|---|---|
| Nonmonotonic curve: U-shape |
|
|
| Identification of weak signal |
|
N/A |
| Assay interference: cytotoxicity |
|
|
| Assay interference: autofluorescence |
|
|
| Assay interference: contradictory readout |
|
|
| Assay interference: reverse signal |
|
|
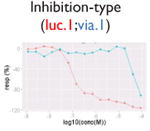
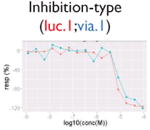
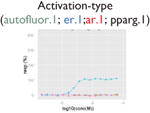
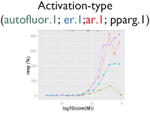
Ratio or luc, main readout in either β-lactamase assay or luciferase assay, respectively; ch1, channel 1, the background in bla (β-lactamase assay) assay; ch2, channel 2, the signal channel in bla assay; via, cell viability; autofluor, autofluorescence; er, estrogen receptor; ar, androgen receptor; pparg, peroxisome proliferator-activated receptor gamma. Numbers represent different batches.
Signal quantification
A new parameter, weighted version of the area under the curve (wAUC), was introduced to quantify the strength of the assay signal after noise filtering and curation by Curvep. The wAUC is the product of the point of departure (POD) and the AUC, normalized by the test concentration range (eq 1).
| (1) |
The POD is defined as the concentration at which the response exceeds the assay-dependent noise threshold and is calculated by linear interpolation between the two concentration points, where their range of response includes the noise threshold. All molar concentrations (M) were converted using the negative logarithm with base 10; thus, higher POD values were equivalent to more potent responses. For compounds classified as inactive over the concentrations tested (i.e., flat curves), the highest tested concentration was used as the POD. Although there was no direction on the “strength” of the signal, we used positive values for increasing signals and negative values for decreasing signals when analyzing data at the source level.
Substance/Source-Level Components
Assay interference identification
Not all signals could be directly translated as activities. We flagged signals that might be caused by compound-dependent assay interference (i.e., reproducible artifacts that include autofluorescence, cytotoxicity, contradictory readout, and reverse signal; Table 2). The data from the fluorescence-based assays (PubChem AID 720674, 720675, 720678-720787, https://pubchem.ncbi.nlm.nih.gov/pcassay/), which were conducted in two cell lines (HepG2 and Hek293) and cell-free medium, were used to identify autofluorescent compounds. A substance is flagged as autofluorescent in β-lactamase assays if its ch2, ratio, and autofluorescence counterscreen data all have activity higher than the minimum activity (wAUC > T1, see the “Hit Calling/Ranking” section). A substance is flagged as having a contradictory readout if the directions of the wAUC signals in ch2 and ratio readouts do not correspond. Reverse signal refers to those compounds that show decreasing/increasing signals (judging by wAUC value) in activation/inhibition–type assays, respectively, irrelevant to the designed direction. Also, for each inhibition-type assay, a cytotoxicity assay was multiplexed in the same well. We flagged decreasing signals that may be caused by cytotoxicity if the POD separation between the inhibitory signal and the cytotoxicity signal is insignificant (PODprimary – PODviability < 0.5, p > 0.05, Student t test). Selection of the 0.5 log10 unit was based on the average potency value variation of the plate positive controls.
Compound-Level Components
Hit calling/ranking
We classified the compounds into active, marginal active, inactive, and inconclusive (i.e., assay interference) based on their flags and two assay-dependent wAUC thresholds (T1 and T2; Fig. 1b). T1 and T2 are two thresholds that are intended to account for the minimum required activity and biological relevance, respectively. T1 is defined as a value equal to the mean plus 3 standard deviations (SD) of the wAUC distribution from the simulated curves with a single-point response. The single-point responses ranged from 2.5 SD to 3 SD of responses in the DMSO control plates with an incremental step equivalent to 0.1. The POD values ranged between the last two highest concentrations with an incremental step equivalent to 0.01. The wAUC values were calculated from the enumeration of these hypothetical curves. T2 is defined as the median wAUC value of the curves, which have half-maximal response concentration (AC50) values less potent than 10 μM, a cutoff often used to prioritize activity in biochemical assays.17 Depending on the direction of the signal (i.e., either increasing or decreasing), signals with wAUC > T1 but ≤ T2 are labeled as weak. Signals with wAUC > T2 are labeled as strong. If the weak and strong signals are not flagged for assay interference, they are labeled as marginal active and active, respectively.
Data Collapsing in the wAUC Pipeline
At the substance/source level, the wAUC values from the three runs for each substance are first collapsed using the median value. Each substance is further labeled as normal, autofluorescent (β-lactamase reporter gene assay only), contradictory (β-lactamase reporter gene assay only), or cytotoxic (inhibition-type assays) based on data from multiple readouts/assays. The substances with labels other than normal are classified as exhibiting assay interference. Then, at the compound level, different substances corresponding to the same compound are analyzed. When discordant labels occur, the compound is flagged as having assay interference if >50% of the samples have assay interference. The wAUC values are then collapsed using the mean value. POD values are collapsed likewise after excluding inactive sources.
Activity Normalization
To facilitate interassay comparison, we rescaled the wAUC values in each of the assays to [0, 1]. Because values on the wAUC scale (0, ∞) are, in theory, not bound from above, we used logistic function transformation, which retains the relative order of values but binds them to a finite scale. We applied the following modified logistic function to convert the wAUC values to give less weight to the weak signals (eq 2).
| (2) |
where x is the raw wAUC value in an assay and T1 and T2 are the two assay-dependent wAUC thresholds (see above). C ensures the lowest and highest values of f(x) are, respectively, 0 and 1.
GUIs
To facilitate data exploration, two GUIs were constructed with the R Shiny package.18 The first is to visualize the qHTS data processed by the pipeline. The second is to visualize the Tox21 concentration-response data. The two GUIs are deployed in the RStudio Shiny server (Tox21 qHTS assays: signal/activity profiling, http://spark.rstudio.com/moggces/profiling/; Tox21 concentration-response data visualization: http://spark.rstudio.com/moggces/plotting/). The source code can be found in Github (https://github.com/moggces/ActivityProfilingGUI/archive/v1.0-beta.zip and https://github.com/moggces/CurveVisualizationGUI4Tox21/archive/v1.0-beta.zip).
Results and Discussion
Pipeline Summary
Our pipeline (Fig. 1a) starts with qHTS signal extraction and signal quantification. A noise-filtering algorithm, Curvep,11 was applied first to enforce monotonic behavior of the responses. The use of Curvep instead of response-fitting methods (e.g., Hill or logistic function17) obviates the receptor saturation binding assumption. This was followed by a new signal curation protocol to identify nonreproducible artifacts such as false spikes (Table 2) based on their response patterns. False spikes belong to the group of nonmonotonic responses (“U-shape”). The U-shape curve violates the monotonicity assumption and represents mostly nonreproducible artifacts in qHTS assays. However, some of them could be real signals based on the presence of the same spikes in the three runs, which is a unique advantage of Tox21 qHTS data.
After noise filtering and signal curation (artifact cleaning), we adopted an area-under-the-curve (AUC) approach, which has been employed in in vitro chemosensitivity assays19,20 to quantify signals. However, this approach depends on the range of the test concentrations used (i.e., a wider range would tend to yield larger AUC values). Thus, we designed a new activity metric, called a weighted version of area-under-the-curve (wAUC), which combines the AUC with the POD to estimate activity. The AUC quantifies a compound's total effect across the concentrations tested, whereas the POD estimates the concentration at which the compound begins eliciting an effect above the assay-specific noise level. Unlike AUC, the wAUC allows for the ability to compare compounds tested over different concentration ranges. Also, the wAUC can be used to compare curves with widely differing efficacies as well as to quantify activity in cases in which a curve's maximal response asymptote is unavailable or when the responses may be too low to provide enough support for accurate curve fitting (Table 2, “weak” signals). Both of the last two situations make estimation of the half-maximal response concentration (AC50) difficult. Also, the wAUC makes it straightforward to profile “no effect” curves (for which wAUC = 0). Using the 10K library data, we compared the wAUC with AC50 data from high-quality curves defined by the Curve Class approach21 (Suppl. Table S2; Suppl. Fig. S5). For inhibition-type assays, the average Pearson's r value is 0.84; for the activity-type assays, the average Pearson's r value is 0.72. This is likely due to many curves with differing maximal responses in activation-type assays, which is accounted for by the wAUC but not by AC50 approach. Thus, ranking using wAUC could provide results similar to using AC50 alone yet with the efficacy factor included, which could be more informative in the activation-type assays.
Compound autofluorescence and cytotoxicity are known issues for activation-type, fluorescence readout assays and inhibition-type assays, respectively.13 Compounds autofluorescent at the appropriate wavelengths would induce increasing signals in fluorescence-based assays, whereas cytotoxic compounds can cause decreasing signals coinciding with its pathway-related signal (Table 2). Thus, after robust signals are identified, we incorporated data from autofluorescence and pathway-specific cytotoxicity assays to flag signals that are likely caused by assay interference. Two additional flags were created (Table 2) to deal with contradictory readout and reverse signal response curves. The contradictory readout is a specific issue in assays with multireadouts (e.g., ch2, ch1, and the ratio data in the β-lactamase assays). Although ratio data help reduce background variation, signal directions between the ratio data and reporter gene expression readout (ch2) can be incongruent (e.g., due to cytotoxicity). The reverse signal flag simply labels signals that are in a direction inconsistent with assay expectations (e.g., decreasing signal in an agonist assay, increasing signal in an antagonist assay). We expect that assay interference is not limited to these four types and that more interference flags will likely be identified in the future.
Finally, based on the wAUC and the assay interference labels, a compound hit calling/ranking schema was designed. The compounds that were not considered to have assay interference were classified as active, marginal active, or inactive, depending on their strength of activity (i.e., wAUC), whereas compounds identified as assay interference were labeled as inconclusive. To facilitate interassay comparison, we rescaled the unbounded raw wAUC values to [0, 1] in each assay (see the “Methods” section). The relationship between the raw wAUC values and the normalized wAUC value is provided in Supplemental Figure S6.
Signal Curation Improves Assay Reproducibility
We compared the wAUC reproducibility between the three replicates of each of the nine compound plates (three [NTP, EPA, NPC] agency libraries × three [A, B, C] compound plates; Suppl. Fig. S1) based on six baseline noise thresholds (THR ranging from 0.5 SD to 3 SD) using three signal-processing protocols (i.e., including neither noise filtering nor signal curation [no treatment], with noise filtering only, and with noise filtering plus signal curation). The Pearson correlation coefficient (Pearson's r) was used to quantify the degree of wAUC reproducibility. The median and 25th percentile of the Pearson's r values from the pairwise comparison between three replicates (in total, 27 values) were used to represent the reproducibility for a particular threshold. For the protocol without additional signal treatment, we calculated the wAUC directly from the normalized, “raw” responses based on different baseline noise thresholds; thus, different POD values were used to weight the AUC. We then plotted the results for the three classes of assays (activation, inhibition, or cytotoxicity). For the cytotoxicity-type assays, plotting by either the median Pearson's r value or the 25th percentile Pearson's r value, there was a clear improvement in reproducibility between stages: lowest reproducibility using the protocol with no treatment, highest reproducibility using the protocol of noise filtering plus curation, and in-between reproducibility using the protocol of noise filtering only (Fig. 2a). Generally, a plateau of Pearson's r values was reached by using 2 SD or 2.5 SD as the THR. A similar but less obvious trend was observed in the inhibition-type assays (Suppl. Fig. S7a). For the majority of the cytotoxicity and inhibition-type assays, large reproducibility improvement was observed after applying the protocol with noise-filtering features, suggesting that there was a high amount of noise in these data, which was also reflected in their larger SD values. For activation-type assays, because they contained less noise (smaller SD), we saw only marginal improvement (Suppl. Fig. S7b). However, reproducibility results are more variable when using the protocol of no treatment (i.e., large Pearson's r difference between median and the 25th percentile Pearson's r value). Based on our analysis, the new protocol (noise filtering plus signal curation) improved reproducibility, and the 2 SD or 2.5 SD thresholds were optimal for Curvep to achieve the balance between signal reproducibility and signal preservation.
Figure 2.
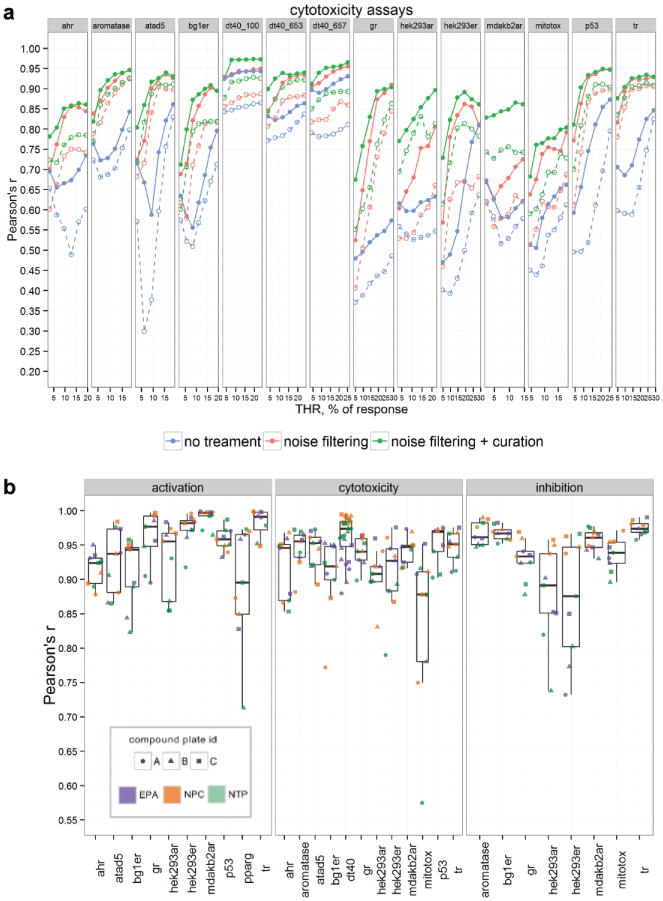
Assay reproducibility by weighted version of the area under the curve (wAUC). (a) Comparison of cytotoxicity assays based on three signal-processing protocols as a function of Curvep baseline noise threshold (THR). The solid/dashed line represents the median/25th percentile of 27 Pearson's r values (3 agencies × 3 compound plates × 3 screening plates). (b) Reproducibility within compound plates presented as highest Pearson's r for three corresponding screening-plate comparisons. Note: NTP_C plate in TR activation-type assay is removed (Pearson's r = 0.35) to give higher resolution to the plot.
In addition, we compared the reproducibility between three batches across 32 assays using the wAUC method (2.5 SD as THR) proposed in this study with two commonly used activity metrics: the POD (2.5 SD as THR) and AC50. The AC50 values were obtained from the NCATS curve-fitting protocol based on the Hill model, and for each curve, a Curve Class, which represents the data quality, was assigned. By using the Curve Class, we filtered AC50 values into two groups: high quality (Curve Class = 1.1, 1.2, 2.1, 2.2, −1.1, −1.2, −2.1, and −2.2) and medium quality (any curve with non–Curve Class 4). For those curves with no AC50 calculated (no significant activity observed at any test concentration), inactive (Curve Class = 4), and the filtered curves, the last tested concentration is used as their AC50. For the 32 assays, the Pearson's r value based on different activity metrics between plates was calculated, and the median value (out of 27 pairwise plate comparisons) from each assay was collected. The distribution of the 32 values was presented as a box-and-whisker plot (Fig. 3). The wAUC metric affords superior reproducibility (median Pearson's r value = 0.91) followed by POD (0.82) and AC50 (0.81 [AC50 from high-quality curves only] and 0.66 [AC50 from high- and marginal-quality curves]). The result suggests that the reliability of AC50 depends largely on curve data quality, whereas wAUC is more robust and thus more suitable for activity profiling.
Figure 3.
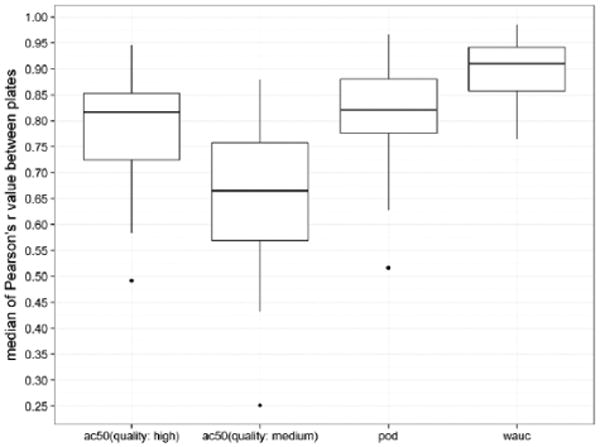
The signal reproducibility between nine plates and three batches across 32 assays using different activity metrics (weighted version of the area under the curve (wAUC), point of departure (POD), and AC50) is presented as box-and-whisker plots. Each box-and-whisker-plot is constructed based on 32 median Pearson's r values from pairwise plate comparisons of each assay. The outliers shown in the plots are all viability assays: mitochondria membrane potential (high-quality AC50), glucocorticoid receptor antagonism (medium-quality AC50), and androgen receptor (full-length) antagonism (POD).
Good Reproducibility of Tox21 Assays
By using noise filtering plus signal curation with a threshold of 2.5 SD (corresponding to the fifth green point in each assay; Fig. 2a), we compared the overall wAUC reproducibility between assays as well as the reproducibility among the nine compound plates. The maximum Pearson's r value from the three pairwise plate replicate comparisons (Fig. 2b) was chosen to represent the reproducibility of the compound plate, because the median wAUC value was used to collapse the three-run data (e.g., often two runs correlate well; the third poorly correlated with both, so collapsing by the median yields data close to the first two runs, corresponding to the maximum correlation). In general, the reproducibility of three replicate runs in the Tox21 assays was excellent after signal noise filtering plus curation, with median Pearson's r values >0.9. The mitochondria membrane potential (MMP) assay (cytotoxicity), estrogen receptor (ER) or androgen receptor (AR) antagonism assays (inhibition), and proliferator-activated receptor gamma agonism assay (activation) were the four exceptions, with median Pearson's r values between 0.85 and 0.9. The results suggest that the nature of those assays does not fully reflect on the SD value in DMSO plates, and a higher THR value for Curvep may be needed to clean the data. For the reproducibility of plates, the NTP and EPA plates generally tended to have lower reproducibility when compared with the NPC plates. This observation could be due to the composition of these two libraries (i.e., mainly environmental compounds, which tend to be more reactive than pharmaceuticals predominant in NPC plate). Based on quantitative signal measurement (wAUC), this analysis provides additional quality control on the assays and compound plates.
Signal versus Activity
We defined signals as the responses induced by compounds in the assay system and activities as the signals that are relevant to the pathway of interest. In Supplemental Table S3, we show the percentages of the four signal types for each assay, including strongly activated/inhibitory signal and weakly activated/inhibitory signal. For all of the assays, although each was optimized for a particular direction of signal, both directions of signals were observed. In Table 3, we present the fractions of four activity types including active, marginal active, inactive, and inconclusive for the 20 pathways of interests. The inconclusive activity could be of four kinds: autofluorescence, contradictory readout, cytotoxicity, and reverse signal (see the “Methods” section). Cytotoxicity is the major confounding factor in inhibition-type assays; on average, about 8% (∼664/8306, based on eight assays) of all compounds are affected, which amounts to ∼50% of the compounds with decreasing signal. In the β-lactamase reporter gene assays, where ratiometric data analysis was used, the percentage of contradictory readout was as high as 5.6% (∼465/8306, based on nine β-lactamase assays). In addition, although the reporter gene expression readout had been normalized, we still observed an average of 3% (∼249/8306, based on nine assays) reverse signals, especially in the MMP assay. However, the ability of compounds to increase MMP has been reported.22 For autofluorescence, less than 0.5% (∼42/8306, based on nine assays) of the compounds were affected in the β-lactamase reporter gene assays. After removing the signals that might be caused by assay interference, the hit rate of some assays dropped greatly. For example, the TR antagonism assay had the highest potential hit rate (strong (–): 12.8%; 1064/8306). However, after eliminating inhibitory signals that might be caused by cytotoxicity, the hit (active) rate dropped to 3% (244/8306). The hit (active) rate of most pathways was between 1.5% (∼125/8306) and 4.5% (∼374/8306). Six pathways fell out of this range: ER agonism (full-length receptor, 8%; 660/8306), MMP (6.6%; 549/8306), and aryl hydrocarbon receptor agonism (6.5%; 542/8306) were the three assays with the highest active hit rates, whereas DNA stalled replication fork damage (1.2%; 98/8306), DNA double-strand break damage (1.1%; 92/8306), and TR agonism (0.6%; 47/8306) were the three assays with the lowest hit rates.
Table 3.
Percentage of activity types in assays (n = 8306).
| Pathway | Active | Marginal Active | Inactive | Inconclusivea | ||||
|---|---|---|---|---|---|---|---|---|
|
| ||||||||
| Autofluorescence | Contradictory | Cytotoxicity | Reverse | Total | ||||
| ahr_agonism | 6.50 | 10.84 | 80.64 | NA | NA | NA | 2.02 | 2.02 |
| ar_agonism (hek293) | 3.00 | 1.32 | 89.38 | 0.30 | 4.91 | NA | 1.08 | 6.30 |
| ar_agonism (mdakb2) | 3.48 | 2.56 | 89.24 | NA | NA | NA | 4.72 | 4.72 |
| ar_antagonism (hek293) | 4.18 | 4.76 | 75.88 | 0.20 | 4.77 | 8.44 | 1.77 | 15.18 |
| ar_antagonism (mdakb2) | 2.05 | 5.01 | 77.27 | NA | NA | 7.46 | 8.21 | 15.68 |
| aromatase_antagonism | 3.08 | 5.66 | 70.90 | NA | NA | 9.45 | 10.91 | 20.36 |
| atad5 | 2.28 | 2.76 | 86.74 | NA | NA | NA | 8.22 | 8.22 |
| dna_damage (dsb) | 1.11 | 6.42 | 77.76 | NA | NA | 13.21 | 1.50 | 14.71 |
| dna_damage (srf) | 1.18 | 5.35 | 77.39 | NA | NA | 14.92 | 1.17 | 16.08 |
| er_agonism (bg1) | 7.95 | 8.63 | 73.02 | NA | NA | NA | 10.40 | 10.40 |
| er_agonism (hek293) | 3.17 | 4.95 | 88.44 | 0.41 | 2.99 | NA | 0.05 | 3.44 |
| er_antagonism (bg1) | 2.11 | 5.89 | 77.49 | NA | NA | 6.03 | 8.49 | 14.52 |
| er_antagonism (hek293) | 2.64 | 3.36 | 80.05 | 0.30 | 6.32 | 3.53 | 3.80 | 13.95 |
| gr_agonism | 1.93 | 1.40 | 85.34 | 0.31 | 7.07 | NA | 3.96 | 11.34 |
| gr_antagonism | 3.03 | 4.21 | 75.70 | 0.25 | 7.65 | 4.21 | 4.94 | 17.05 |
| mitotox | 6.53 | 5.98 | 71.06 | 0.18 | 4.36 | 5.86 | 6.03 | 16.43 |
| p53 | 2.99 | 4.71 | 84.37 | 0.53 | 7.31 | NA | 0.10 | 7.93 |
| pparg_agonism | 2.49 | 1.85 | 85.00 | 0.34 | 5.26 | NA | 5.06 | 10.65 |
| tr_agonism | 0.57 | 1.79 | 80.63 | NA | NA | NA | 17.01 | 17.01 |
| tr_antagonism | 2.94 | 6.69 | 70.03 | NA | NA | 18.20 | 2.13 | 20.33 |
NA, not applicable or not checked; reverse, response change in the opposite to expected direction; see “Pipeline Components” in the “Methods” section.
GUI Functionality
In the profiling GUI, the user is able to input a selected set of chemicals in Tox21 library with their predefined classes (e.g., results in an in vivo assay with three classes: positive, negative, and untested). The GUI then automatically clusters the compounds based on their similarity of chemical structures (defined by Leadscope's structure fingerprints23 and default clustering setting: average linkage hierarchical clustering analysis with a similarity cutoff of 0.7). Then, the user can view and explore the relationship between in vitro, in vivo (i.e., the predefined class), and the chemical structures, presented as a heat map. The columns of the heat map (i.e., chemicals) can be rearranged based on signal/activity similarity (hierarchical clustering with average linkage), toxicity score (sum of activities), or chemical structure similarity. Also, results incongruent across the multiple substances of the same compound will be labeled. Thus, it is easy to identify compounds with potential chemical quality issues. The data and the heat map can be downloaded by the user for further analysis. In the curve visualization GUI, the user is able to input various types of chemical IDs (e.g., CAS and Tox21 ID) in addition to selected pathways. The GUI will report relevant activity information at the plate level and arrange the curves at the substance level. The user has the option to toggle on/off the information on batches and readouts, to plot the curves by various methods (i.e., raw data, Curvep method, Hill function), and to view curves of compounds from different pathways in overlay or parallel mode.
In summary, we have developed a pipeline for analyzing Tox21 qHTS data. The pipeline includes the components that remove nonreproducible artifacts by a new signal-processing protocol, flag assay interference by incorporating available counterscreen data, and perform compound hit calling/ranking based on wAUC values. We demonstrated that the wAUC method provides improved reproducibility in comparison with the more traditional metrics (i.e., the POD and the AC50) and is thus more useful for activity profiling. Also, because the efficacy factor is included in the wAUC metric, ranking using the wAUC is likely preferable to using AC50 alone, especially in the activation-like assays, in which the actives tend to have varied efficacy. Although the pipeline is specific for Tox21 10K qHTS data, the signal-processing protocol for nonreproducible artifacts can be directly used for other concentration-response data. In addition, we think it is important to account for assay interference in all qHTS data, especially cytotoxicity in inhibition-type assays, which can affect a significant fraction of the potential hits. As a caveat, because the pipeline is used for activity profiling of potential toxicants, it is more lenient toward the presence of false-positives, as reflected in the setting of thresholds and the procedure used in data collapsing, which are designed to include more potential active compounds. For example, the information of wAUC or label variation between multiple substances of the same compound could be used to exclude less confident actives. To further facilitate Tox21 data exploration, the GUI applications were designed to visualize the compound activity data analyzed by the pipeline and are particularly suitable for activity profiling of a set of focused compounds.
Supplementary Material
Acknowledgments
We thank Paul Shinn and Misha Itkin for assistance with Tox21 compound management. We also thank Srilatha Sakamuru, Sampada Shahane, Jean Zhao, Nicole Miller, and Sam Michael for assistance with the Tox21 screens. We thank Keith Shockley for providing valuable comments when reviewing the manuscript. Alexander Sedykh is currently affiliated with Multicase Inc., and he declares no conflict of interest.
Funding: The authors disclosed receipt of the following financial support for the research, authorship, and/or publication of this article: This work was supported through an interagency agreement (IAG #Y2-ES-7020-01) from the National Institute of Environmental Health Sciences/National Toxicology Program to the National Center for Advancing Translational Sciences, National Institutes of Health. The views expressed in this article are those of the authors and do not necessarily reflect the statements, opinions, views, conclusions, or policies of the National Institute of Environmental Health Sciences (NIEHS), the National Center for Advancing Translational Sciences (NCATS), National Institutes of Health (NIH), or the United States government. Mention of trade names or commercial products does not constitute endorsement or recommendation for use.
Footnotes
Supplementary material for this article is available on the Journal of Biomolecular Screening Web site at http://jbx.sagepub.com/supplemental.
Declaration of Conflicting Interests: The authors declared no potential conflicts of interest with respect to the research, authorship, and/or publication of this article.
References
- 1.Tice RR, Austin CP, Kavlock RJ, et al. Improving the Human Hazard Characterization of Chemicals: A Tox21 Update. Environ Health Perspect. 2013;121:756–765. doi: 10.1289/ehp.1205784. [DOI] [PMC free article] [PubMed] [Google Scholar]
- 2.Xie L, Evangelidis T, Xie L, et al. Drug Discovery Using Chemical Systems Biology: Weak Inhibition of Multiple Kinases May Contribute to the Anti-Cancer Effect of Nelfinavir. PLoS Comput Biol. 2011;7:e1002037. doi: 10.1371/journal.pcbi.1002037. [DOI] [PMC free article] [PubMed] [Google Scholar]
- 3.Prinz F, Schlange T, Asadullah K. Believe It or Not: How Much Can We Rely on Published Data on Potential Drug Targets? Nat Rev Drug Discov. 2011;10:712–712. doi: 10.1038/nrd3439-c1. [DOI] [PubMed] [Google Scholar]
- 4.Bradley D. Dealing with a Data Dilemma. Nat Rev Drug Discov. 2008;7:632–633. doi: 10.1038/nrd2649. [DOI] [PubMed] [Google Scholar]
- 5.Inglese J, Auld DS, Jadhav A, et al. Quantitative High-Throughput Screening: A Titration-Based Approach That Efficiently Identifies Biological Activities in Large Chemical Libraries. Proc Natl Acad Sci U S A. 2006;103:11473–11478. doi: 10.1073/pnas.0604348103. [DOI] [PMC free article] [PubMed] [Google Scholar]
- 6.Parham F, Austin C, Southall N, et al. Dose-Response Modeling of High-Throughput Screening Data. J Biomol Screen. 2009;14:1216–1227. doi: 10.1177/1087057109349355. [DOI] [PMC free article] [PubMed] [Google Scholar]
- 7.Shockley KR. A Three-Stage Algorithm to Make Toxicologically Relevant Activity Calls from Quantitative High Throughput Screening Data. Environ Health Perspect. 2012;120:1107–1115. doi: 10.1289/ehp.1104688. [DOI] [PMC free article] [PubMed] [Google Scholar]
- 8.Shockley KR. Using Weighted Entropy to Rank Chemicals in Quantitative High-Throughput Screening Experiments. J Biomol Screen. 2014;19:344–353. doi: 10.1177/1087057113505325. [DOI] [PMC free article] [PubMed] [Google Scholar]
- 9.Wilson A, Reif DM, Reich BJ. Hierarchical Dose-Response Modeling for High-Throughput Toxicity Screening of Environmental Chemicals. Biometrics. 2014;70:237–246. doi: 10.1111/biom.12114. [DOI] [PubMed] [Google Scholar]
- 10.Motulsky HJ, Brown RE. Detecting Outliers when Fitting Data with Nonlinear Regression: A New Method Based on Robust Nonlinear Regression and the False Discovery Rate. BMC Bioinform. 2006;7:123. doi: 10.1186/1471-2105-7-123. [DOI] [PMC free article] [PubMed] [Google Scholar]
- 11.Sedykh A, Zhu H, Tang H, et al. Use of In Vitro HTS-Derived Concentration–Response Data as Biological Descriptors Improves the Accuracy of QSAR Models of In Vivo Toxicity. Environ Health Perspect. 2011;119:364–370. doi: 10.1289/ehp.1002476. [DOI] [PMC free article] [PubMed] [Google Scholar]
- 12.Vempati UD, Przydzial MJ, Chung C, et al. Formalization, Annotation and Analysis of Diverse Drug and Probe Screening Assay Datasets Using the BioAssay Ontology (BAO) PLoS ONE. 2012;7:e49198. doi: 10.1371/journal.pone.0049198. [DOI] [PMC free article] [PubMed] [Google Scholar]
- 13.Thorne N, Auld DS, Inglese J. Apparent Activity in High-Throughput Screening: Origins of Compound-Dependent Assay Interference. Curr Opin Chem Biol. 2010;14:315–324. doi: 10.1016/j.cbpa.2010.03.020. [DOI] [PMC free article] [PubMed] [Google Scholar]
- 14.Baell JB, Holloway GA. New Substructure Filters for Removal of Pan Assay Interference Compounds (PAINS) from Screening Libraries and for Their Exclusion in Bioassays. J Med Chem. 2010;53:2719–2740. doi: 10.1021/jm901137j. [DOI] [PubMed] [Google Scholar]
- 15.Schorpp K, Rothenaigner I, Salmina E, et al. Identification of Small-Molecule Frequent Hitters from AlphaScreen High-Throughput Screens. J Biomol Screen. 2014;19:715–726. doi: 10.1177/1087057113516861. [DOI] [PMC free article] [PubMed] [Google Scholar]
- 16.Shockley KR. Quantitative High-Throughput Screening Data Analysis: Challenges and Recent Advances. Drug Discov Today. 2015;20:296–300. doi: 10.1016/j.drudis.2014.10.005. [DOI] [PMC free article] [PubMed] [Google Scholar]
- 17.Ritz C. Toward a Unified Approach to Dose–Response Modeling in Ecotoxicology. Environ Toxicol Chem. 2010;29:220–229. doi: 10.1002/etc.7. [DOI] [PubMed] [Google Scholar]
- 18.RStudio Inc. Shiny: Web Application Framework for R. R package version 0.10.0. 2014 http://CRAN.R-project.org/package=shiny.
- 19.Barretina J, Caponigro G, Stransky N, et al. The Cancer Cell Line Encyclopedia Enables Predictive Modelling of Anticancer Drug Sensitivity. Nature. 2012;483:603–607. doi: 10.1038/nature11003. [DOI] [PMC free article] [PubMed] [Google Scholar]
- 20.Huang S, Pang L. Comparing Statistical Methods for Quantifying Drug Sensitivity Based on In Vitro Dose–Response Assays. ASSAY Drug Dev Technol. 2012;10:88–96. doi: 10.1089/adt.2011.0388. [DOI] [PubMed] [Google Scholar]
- 21.Huang R, Xia M, Cho MH, et al. Chemical Genomics Profiling of Environmental Chemical Modulation of Human Nuclear Receptors. Environ Health Perspect. 2011;119:1142–1148. doi: 10.1289/ehp.1002952. [DOI] [PMC free article] [PubMed] [Google Scholar]
- 22.Montague CR, Fitzmaurice A, Hover BM, et al. Screen for Small Molecules Increasing the Mitochondrial Membrane Potential. J Biomol Screen. 2014;19:387–398. doi: 10.1177/1087057113495295. [DOI] [PubMed] [Google Scholar]
- 23.Valerio LG, Yang C, Arvidson KB, et al. A Structural Feature-Based Computational Approach for Toxicology Predictions. Expert Opin Drug Metab Toxicol. 2010;6:505–518. doi: 10.1517/17425250903499286. [DOI] [PubMed] [Google Scholar]
Associated Data
This section collects any data citations, data availability statements, or supplementary materials included in this article.