

Abstract
The primary visual cortex (V1) is widely regarded as faithfully conveying the physical properties of visual stimuli. Thus, experience-induced changes in V1 are often interpreted as improving visual perception (i.e., perceptual learning). Here we describe how, with experience, cue-evoked oscillations emerge in V1 to convey expected reward time as well as to relate experienced reward rate. We show, in chronic multisite local field potential recordings from rat V1, that repeated presentation of visual cues induces the emergence of visually evoked oscillatory activity. Early in training, the visually evoked oscillations relate to the physical parameters of the stimuli. However, with training, the oscillations evolve to relate the time in which those stimuli foretell expected reward. Moreover, the oscillation prevalence reflects the reward rate recently experienced by the animal. Thus, training induces experience-dependent changes in V1 activity that relate to what those stimuli have come to signify behaviorally: when to expect future reward and at what rate.
Keywords: behavior, local field potential, oscillation, reward, timing, visual cortex
Introduction
Constructing predictive representations of the timing and value of future reward given the identity of a stimulus is essential for goal-directed behavior. Therefore, how the brain learns to foretell the timing (Gavornik et al., 2009) and value (Huertas et al., 2013) of reward predicated on such information is a central issue. Temporal information regarding future expected reward is expressed in high-order brain areas, such as the posterior parietal and prefrontal cortex (Leon and Shadlen, 2003; Genovesio et al., 2009; Xu et al., 2014). Surprisingly, studies have also shown that neurons within the primary visual cortex (V1) are capable of expressing the time from a visual cue to expected reward (Shuler and Bear, 2006; Chubykin et al., 2013). Indeed, V1 has long been a system for studying how experience modifies responses to external cues (Hubel and Wiesel, 1970). Whereas studies of experience-dependent plasticity in V1 are commonly interpreted in the context of enhancing visual processing (perceptual learning) (Teller and Movshon, 1986; Seitz and Watanabe, 2005), other experiments have demonstrated that V1 may be the site of reinforcement-induced changes (Shuler and Bear, 2006; Chubykin et al., 2013) that relate visual cues to their behavioral significance. How these two expressions of experience-dependent plasticity interact in V1 remains unknown.
Recent studies revealed that repeated presentation of a visual stimulus or sequence of visual stimuli result in a persistent and stimulus-specific enhancement of the visually evoked potential (VEP) triggered by the test stimulus in the adult mouse (Frenkel et al., 2006; Gavornik and Bear, 2014). These forms of plasticity require intrinsic plastic changes in V1 and have properties similar to long-term potentiation (Frenkel et al., 2006; Cooke and Bear, 2010). Earlier studies of experience-dependent plasticity in V1 reported that repeated exposure to a brief flash may elicit an oscillation that persists for some time after the stimulus terminates (“photic after-discharge”) (Bishop and O'leary, 1936; Kimura, 1962). Despite this cortical expression of experience-dependent plasticity being characterized subsequently in greater detail (Shearer et al., 1976; Bigler et al., 1978; Uhlrich et al., 2005; Mwanza et al., 2008), its role has remained enigmatic. Collectively, these studies reveal that repeated presentation of visual stimuli induce a long-term response sensitization in V1 readily observable in local field potential (LFP) activity.
Experience-dependent plasticity can also be interpreted in a reinforcement learning framework. Several studies have observed plasticity in V1 related to learning the behavioral significance of a stimulus, including expected reward value and timing (Shuler and Bear, 2006; Serences, 2008; Stănişor et al., 2013). Reward timing activity, as with stimulus-selective response potentiation and sequence sensitivity, is based on plasticity mechanisms intrinsic to V1 (Cooke and Bear, 2010; Chubykin et al., 2013; Gavornik and Bear, 2014). However, what changes emerge as a consequence of learning visual cue-reward contingencies evident in the LFP, and what they may reveal, remains to be examined. To address this, we performed chronic LFP recordings in V1 of adult rats while they learned to associate visual stimuli of different intensities with water rewards of varying magnitudes occurring at a fixed delay.
Materials and Methods
Subjects
All animal procedures followed National Institutes of Health guidelines and were approved by the Johns Hopkins University Institutional Animal Care and Use Committee. Male Long–Evans rats (>P60; Charles River Laboratories) were maintained on a 12 h light:12 h dark cycle (lights on at 7:00 A.M.) with ad libitum food and water. Rats were chronically implanted with electrodes in V1. After recovery from surgery, animals had restricted access to water for 20 min each day and a day rest period each week. This schedule maintained animals at ∼90% of their predeprivation weight, with any further weight loss being counteracted by increased free water access.
Surgical procedure
Animals were anesthetized with isoflurane, treated with local anesthetic (lidocaine) in the scalp and pressure points, and secured within a stereotaxic frame. Temperature was maintained using a heating pad. The skull was exposed, and small metal screws were placed as anchors for the implant as well as ground connection points for the electrode assembly. Bilateral craniotomies were drilled overlying the binocular portion of V1 (1–2 mm anterior, 4.5 mm lateral from lambda). Multichannel linear arrays were designed to record across cortical layers. Platinum iridium 15 μm wires (California Fine Wire) were placed flat, glued, and cut to obtain a spacing between wire tips of ∼100 μm. The electrode tips were gold-plated and inserted normal to the cortical surface until the last wire contacted the surface of the brain. In addition, three animals were implanted bilaterally with 2 × 8 arrays of 35 μm tungsten wires (California Fine Wire) inserted to a depth of 1 mm at a 10° angle. Sterile petroleum ointment was applied to the craniotomy, and dental cement was used to anchor the electrode assemblies to the skull. Animals were then treated with antibiotics (gentamicin, 1 mg/ml) and a nonsteroid anti-inflammatory agent (flunixin, 4 mg/ml) and kept under careful observation until awakening. Animals were allowed to recover in the home cage for at least 1 week before starting the water restriction protocol for behavioral training.
Behavioral training
Visual cues were presented through removable, head-mounted goggles overlying each eye and embedded with green LEDs. Animals were placed in a dark behavioral testing chamber that contained a nose-poke where the animal could seek a water reward by licking through a slot onto a lick tube (Med Associates). After a 2 s intertrial interval, the animal could initiate a trial by entering the nose-poke, after which a full-field visual stimulus (100 ms duration) of three possible intensities was presented pseudo-randomly through head-mounted goggles. The animal was then required to lick eight times to gain a water bolus in half of the trials. The intensity of the visual stimulus was predictive of the magnitude of the reward (small = 20 μl; intermediate = 40 μl; big = 60 μl). Trials ended when the animal removed its head from the nose-poke. The required number of licks was held constant throughout training. Behavioral sessions were controlled via custom signal conditioning hardware and MATLAB (MathWorks) software executed on the data acquisition computer.
Electrophysiology
Neural activity was recorded using a 32-channel Cheetah setup (Neuralynx). Sixteen-channel headstage amplifiers were attached to electrode interface plugs overlying each hemisphere, and bandpass filtered (1–300 Hz) neural signals were continuously sampled at 32 kHz (downsampled to 3.2 KHz). Events in the behavioral task were coregistered and time-stamped by the acquisition system.
Histology
After the final recording session, a small current was applied through each electrode tip for identification of the final recording depths. Animals were given a lethal dose of pentobarbital and transcardially perfused with cold PBS containing heparin (500 U/L) followed by 4% PFA in PBS. The brain was quickly removed, postfixed in PFA at 4°C for 2–12 h, and placed in a 30% sucrose solution in PBS. Frozen coronal sections (35 μm) were collected with a sliding microtome, and histological verification of the electrode endpoints and recording tracks was done on cresyl violet-stained sections.
Data analysis
All analyses were done with MATLAB (The MathWorks).
Phase locking analysis.
The LFP was decomposed with a discrete wavelet transform (Meyer type) to obtain a 5–10 Hz frequency band. A Hilbert transform was used to obtain the phase angle at every point of each waveform (“instantaneous phase”) (for further details, see Zold et al., 2007, 2012). Next, the number of spikes or licks occurring at different phase angles of each waveform was depicted in circular plots (bin size: 12°). Phase locking of licks or spike discharges was determined by assessing deviation from uniformity in these circular plots with the Rayleigh test.
Oscillation detection and duration.
The analysis was performed on three channels per hemisphere, which were then averaged within hemisphere for each of the “early” sessions (the first three behavioral sessions) as well as for each of the “late” sessions (three consecutive sessions at asymptotic performance expressing stable cue-reward intervals and “give up” times after at least 2 weeks of training). To detect the presence and duration of visually evoked oscillations, we first computed a time-frequency representation of the signal based on Gabor filters between 6 and 9 Hz (SD of Gaussian = 0.5, step size 0.05). We then calculated the mean energy values across frequencies in every moment in time (“energy”). In addition to energy, we also characterized how concentrated the energy in this range was across that range at any moment in time, calling this measure the “purity” of the signal as follows:
 |
Where freq is the range of frequency values and energynormalized is the energy values across that range normalized by their sum across that range.
Finally, the “concentrated energy” is the quotient of the mean energy and the purity in every moment in time. This concentrated energy value improved the detection of oscillations and their durations. To determine an objective threshold to detect oscillations and calculate their durations, we first calculated the mean concentrated energy in a time window of 500 ms (from 200 to 700 ms after visual cue presentation) for every trial in a behavioral session. The threshold was then set as follows: (max − min)/2.5, where max and min are the maximum and minimum mean concentrated energy values in this window of the session, respectively. A trial was considered to have an oscillation if any value of the concentrated energy in time was greater than this threshold (excluding the 200 ms period after visual cue presentation). The oscillation could not begin after 500 ms after visual cue presentation. The end of the oscillation was computed as the time in which the concentrated energy value fell below this threshold.
Current source density (CSD) analysis was performed to determine the spatiotemporal pattern of current sinks and sources evoked by the visual stimulus presentation. The CSD profiles were approximated by the second spatial derivative of field potentials (Mitzdorf, 1985) collected on channels immediately adjacent to each other by the equation as follows:
 |
where Vn−1, Vn, and Vn+1 stand for the field potentials recorded at electrode n−1, n, and n+1, and where d(n) is the distance between electrode n−1 and n, and where d(n') is the distance between electrode n and n+1. To perform this analysis on single trials, the CSD estimates were spatially filtered with a 3 point low-pass Hamming filter (Pettersen et al., 2006).
Oscillation prevalence analyses.
To study the oscillation prevalence across a given behavioral session, we calculated the proportion of trials showing an oscillation in consecutive nonoverlapping bins of 6 trials. The percentage of trials with oscillations was also averaged across each session to compare early and late in training for all animals. For the oscillation rate, trial rate, photic rate, and reward rate analysis, we used a 300 s sliding window moved every 2 s. In each window, the oscillation rate equaled the number of trials with oscillations divided by the duration of the time window. The trial rate was computed as the number of trials self-initiated by the animal in each 300 s window per unit of time. In addition, we calculated the photic rate taking into account the relative intensity of the visual cues presented to the animal in the trials occurring in each 300 s window per unit of time (low = 1, medium = 2, high = 3). Finally, the reward rate was calculated by taking into account the amount of reward delivered in each 300 s window per unit of time. A Pearson correlation analysis was performed between the oscillation rate versus the trial, photic, and reward rate for each session.
Receiver operating characteristic (ROC) analysis.
The oscillation detection algorithm was used to identify trials with and without oscillations for all sessions and animals. Perievent histograms of the lick times were centered either on the visual cue or the nth lick time for trials with and without oscillations. A 10 ms nonoverlapping bin was used to calculate the relative licking frequency per bin. Next, a bin-by-bin ROC analysis was used to compare the lick time responses from the distributions formed by trials with oscillations and without oscillations.
Results
To establish whether cue-dependent reward expectancies relating time and magnitude are observable in visually evoked LFP recordings in V1, adult Long–Evans rats were trained to associate visual cues of three intensities with rewards of varying magnitude occurring at the same fixed delay (Fig. 1A,D). Operationally, rats were motivated through water restriction to obtain water droplets from a lick tube located within a recessed “nose-poke” in a standard behavioral chamber. Trials were self-paced by the animal by entry into the nose-poke following the expiry of, minimally, a 2 s intertrial interval. On entry, one of three visual stimuli varying in intensity (full-field binocular flash of 100 ms duration) was presented through head-mounted goggles in a pseudo-random order. Following the visual cue, animals were required to lick a fixed number of times for a water reward to be presented (Fig. 1D). To differentiate reward receipt from expectancy, half of the total number of trials the animal licked to criterion were rewarded, half unrewarded. LFP activity was recorded bilaterally in V1 from the first day of training using custom-made multichannel linear arrays (Fig. 1B). Electrode contacts were implanted perpendicular to the cerebral cortex so as to allow LFPs to be recorded across the depth of the cortex (n = 8 animals) (Fig. 1C). Additional recordings from multichannel 8 × 2 arrays sampling rostrocaudally/mediolaterally, rather than across depth, were also conducted to assess the areal extent of observed oscillations (n = 5 animals).
Figure 1.

Experimental design. A, Operant chamber containing a water spout within a nose-poke port. Movements into or out of the nose-poke were detected by an infrared beam. Licks were detected by breaking a second infrared beam located in front of the water spout. Visual stimuli were delivered through head-mounted goggles. B, Custom-made multichannel linear array. The electrodes were cut so that the ends of the wires were staggered relative to one another. C, Top, Schematic of a coronal section showing electrode positioning. The electrode tips were inserted normal to the cortical surface. Bottom, Nissl staining showing the electrode array track. D, Following a 2 s intertrial interval, rats entered a nose-poke to receive a 100 ms full-field retinal flash of three possible intensities (low, medium, or high). The animals were then required to lick × number of times to gain a small bolus of water in half of the trials. The intensity of the visual stimulus was predictive of the magnitude of the reward delivered. Two different policies were used in this study: the one depicted above and another pairing low intensity-big reward, medium intensity-small reward, high intensity-intermediate reward.
Familiarity with the task leads to stereotyped behavior
Rats soon learned, as observed even on the first day of training, to lick after presentation of the visual stimulus to criterion to get reward, as indicated by the percentage (∼70%) of completed trials (Fig. 2A). Once the animals gained experience in this task, they adopted the strategy of licking immediately after the visual cue presentation and exiting the port either after consuming the water (on rewarded trials) or shortly after the expected reward delay expired in unrewarded trials (the give up time), indicating a comprehension of the cue-reward delay (Fig 2). Measures of task performance thus include stereotypically licking to criterion to garner reward on a large fraction of rewarded trials, as well as the time to depart from the nose-poke on unrewarded trials. As indicated by the amount of time that they remained licking in the nose-poke in unrewarded trials, rats did not exhibit a precise apprehension of the time of expected reward until approximately the fourth behavioral session (Fig. 2B; p < 0.05, Tukey's post hoc, repeated-measures ANOVA). After 2 weeks of training, all animals had acquired stable task performance. Sessions were thus categorized according to animals' performance as “early” (the first three training sessions) and “late” in training (three consecutive sessions at asymptotic performance expressing stable cue-reward intervals and give up times). Both reward and give up times significantly decreased with training (p < 0.05). Rats showed no differences within-session in either reward times or give up times in trials with different reward magnitudes or cue intensities, early or late in training (p > 0.05, repeated-measures two-way ANOVA; Fig. 2C,D).
Figure 2.

Performance in the behavioral task. A, Percentage of trials successfully completed increases with training. *p < 0.01 (Tukey post hoc, repeated-measures ANOVA). B, Behavioral report of reward time measured as the ratio between the time in which the animal exits the nose-poke in unrewarded trials (give up time) relative to the reward delivery time per session. A, B, Sessions classified as early and late in training are plotted in red and blue, respectively. *p < 0.05 (Tukey post hoc, repeated-measures ANOVA). There was no difference in the reward time or give up time for the different light intensities (C) or reward magnitudes (D) in either early or late training. Training did shorten both the reward and give up times. *p < 0.05 (two-way repeated-measures ANOVA).
Repeated presentation of visual cues induces the emergence of stimulus-evoked oscillations in V1
Across initial trial presentations (<50 trials), light flash evokes a VEP as expected. The amplitude of the VEP correlates with the intensity of the visual stimulus, being greater for higher flash intensities (low, 0.6 ± 0.05 mV; medium, 0.69 ± 0.06 mV; high, 0.75 ± 0.06 mV; p < 0.01 Tukey's post hoc, repeated-measures ANOVA). As animals were repeatedly exposed to the stimuli, a fraction of the visual cue presentations induced a high-amplitude (∼1.3 mV), low-frequency (∼7–8 Hz) oscillation in the LFP that persisted long after the end of the stimulus for variable durations (Fig. 3A). The probability of evoking an oscillation increased with training during the first behavioral session (see Fig. 7A). None of the rats expressed an oscillation in the first 50 correctly completed trials, following which the prevalence then increased as animals performed subsequent trials (see Fig. 7A).
Figure 3.
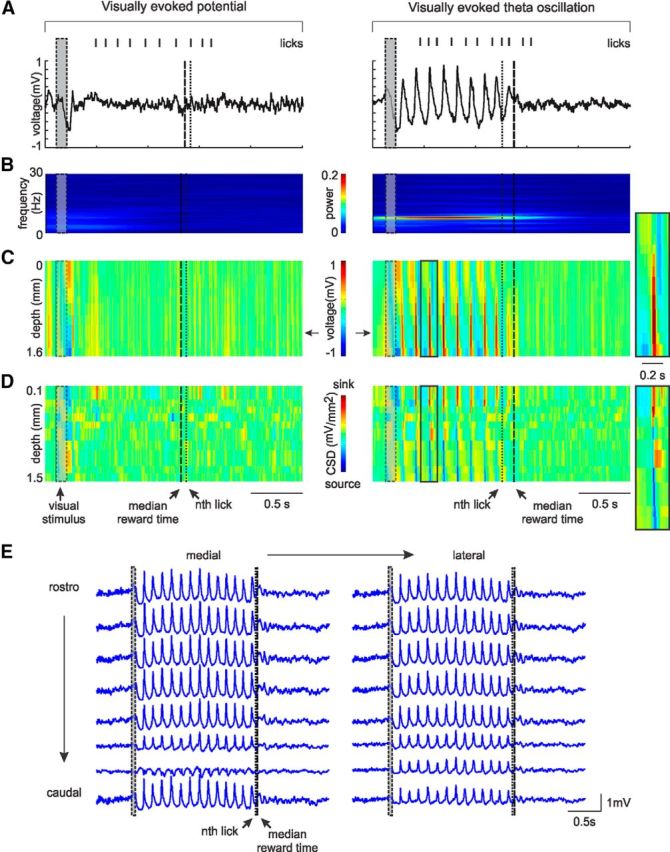
The visually evoked oscillations are not layer specific, are generated within V1 itself, and are aerially extensive. A, Example trials, recorded from one electrode, with (right) and without (left) a visually evoked oscillation. Tick marks on top of the LFP indicate the lick times in each trial. Gray rectangle represents the time interval in which the visual cue is on. B, Single-channel time-frequency representation of trials in A. The time interval in which the oscillation is present is characterized by a peak at ∼7.5 Hz (right). This peak is absent in trials with no oscillation (left). C, Cortical laminar pattern of visually evoked responses for the same trials. Voltage is color coded. Arrows indicate the electrode position of the example in A. Left, VEP recorded across cortical depth. Right, The oscillation evoked by the visual stimulus recorded in every cortical layer. A magnification of a single oscillation cycle (black rectangle) is shown to the right of the plot. D, Single-trial CSD profiles calculated from the second derivative of the field potentials. Right, The visual stimulus evokes sinks and sources that alternate in time and space up to the time of expected reward. A magnification of the sinks and sources from a single oscillation cycle (black rectangle) is shown to the right of the plot. E, Visually evoked oscillation recorded with an 8 × 2 electrode array implanted in the rostrocaudal/mediolateral axis. Approximate area of study: 1.5 × 0.4 mm. The oscillations are observable in a widespread area of V1.
Figure 7.

Percentage of trials with visually evoked oscillations. The likelihood of evoking an oscillation develops in early sessions (A), from expressing no oscillations for any animal in the first 50 trials to soon achieving a stereotypical pattern thereafter characterized by a rapid rise followed by a gradual decline across the course of the session (B). C, Log-normal fit for the oscillation prevalence observed on average on all late sessions. D, Correlation between oscillation rate and reward rate on an example session late in training. E, Correlation coefficients and averages between oscillation rate and one of the following: (1) trial rate, (2) photic rate, or (3) reward rate. The oscillation prevalence across the behavioral session correlates best with the recently experienced reward rate. *Error bars indicate SEM.
Oscillations are local to V1 and observable across all cortical layers and across large areal expanses of V1
The linear arrays of electrodes that penetrated across the entire depth of the cortex afforded a further characterization of this cue-evoked LFP response in terms of its depth profile, timing, duration, and location of current sources and sinks. Visually evoked oscillations were not detected in every trial even in fully trained animals (see Fig. 7B). However, when an oscillation was present, the linear array used in these recordings detected its presence in every cortical layer (Fig. 3C). Current sources and sinks were then assessed by performing a CSD analysis of the signal (Fig. 3D). Both the amplitude and phase of these theta oscillations changed as a function of depth, with the largest amplitude located in infragranular cortical layers (Fig. 3C). In addition, recordings from multichannel 2 × 8 arrays sampling mediolaterally/rostrocaudally showed that the oscillations are simultaneously observable across a large portion of V1 (Fig. 3E). Thus, in a fraction of the trials, the visual cue induces the emergence of a global oscillation spanning all cortical layers across a large expanse of V1.
A time-frequency representation of the LFP shows that the oscillation is evoked immediately following the visual stimulus, with its frequency restricted to a narrow range (6–9 Hz) and with a mean frequency of 7.30 ± 0.05 Hz (Fig. 3A,B; range of mean frequency across all animals, 6.9–7.7 Hz). The spatiotemporal pattern of current sinks and sources was approximated by the second spatial derivative of field potentials collected on channels immediately adjacent to each other. Although standard CSD analysis typically averages the LFP waveform over a large number of stimulus presentations to increase the signal-to-noise ratio, the robust nature of the oscillation observed here allows the method to be applied to individual trials. Doing so permits the properties of the signal to be assessed free from corruption resulting from across-trial averaging of small fluctuations in the phase and amplitude, and by variation in the duration of the oscillation. The visual cue evoked a laminar flow of current sink activity in V1 characterized by an early sink-peak in layer 4, followed by a current sink-peak in superficial layers and finally a sink of lesser amplitude but of prolonged duration in deep layers. This pattern was repeated for the duration of the oscillation at a theta frequency. The CSD analysis depicts the oscillation as a repeating pattern of current sources and sinks alternating in space and time that remains coherent until the approximate time of expected reward (Fig. 3D, right). That the sinks and sources that follow the VEP resemble those observed during the VEP itself suggests that they may share a common thalamocortical mechanism. This analysis reveals that, although the genesis of the oscillations may be cortical-thalamic loops, or otherwise, the oscillation observed is local to V1 and not the result of volume conduction from nearby areas.
V1 single unit activity but not animals' licking behavior is phase-locked to the visually evoked oscillations
To ascertain whether these oscillations were related to the animals' licking behavior, we analyzed the phase relationship between the oscillation and licking (Fig. 4A). Lick times occurred at different phases of the oscillation as the trial progressed and at different phases across trials. The total number of licks per session gave rise to a uniform distribution around a circular axis for all animals (Fig. 4B; p > 0.05, Rayleigh test). Additional observations evidence that the oscillations and lick times are unrelated: (1) oscillations are only observed on a fraction of trials (even though licking behavior is not distinguishable between those trials with and without observed oscillations); (2) oscillations terminate, typically, long before the bout of licking ceases; and (3) the first cycles of the oscillation occur in the absence of licking (Fig. 3A). Nonetheless, to ensure that the licking behavior is identical in trials with and without oscillations, we used a bin-by-bin ROC analysis to compare the lick time responses across trials. To this end, we built perievent histograms of the lick times (10 ms nonoverlapping bins) centered on the cue presentation for trials with and without oscillations. The licking behavior was indistinguishable in trials with and without oscillations for all animals (p > 0.05, ROC analysis). Thus, these data demonstrate that, early during training, at a stage where animals have not yet learned the cue-reward time association, repeated presentation of the visual stimulus induces the emergence of an oscillation that outlasts the visual cue and is not related to the licking behavior.
Figure 4.
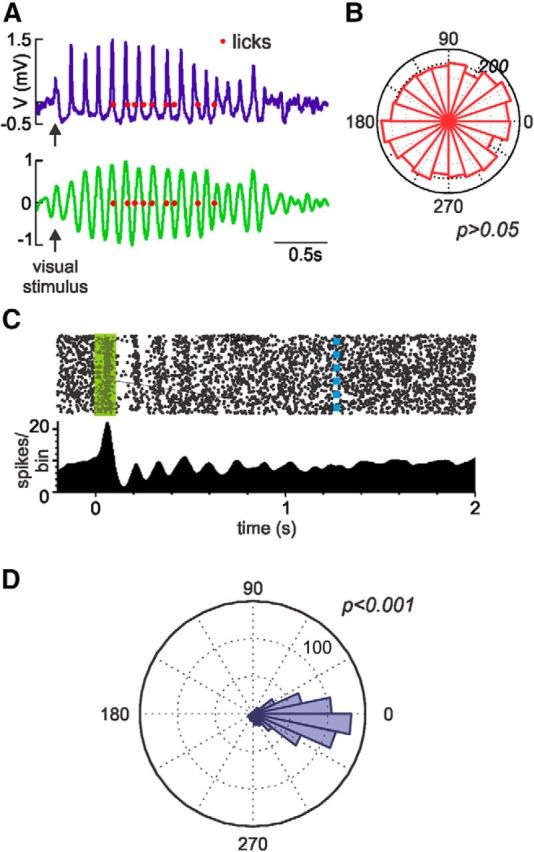
V1 single-unit activity, but not lick times, is phase-locked to the visually evoked oscillation. A, Top, Example of an LFP trace recoded from one trial. Red dots represent the lick times. Bottom, The LFP was decomposed using a discrete wavelet transform, and the 5–10 Hz frequency band was used to study the phase relationship between this frequency band and the licking behavior. A Hilbert transformation was performed to obtain the phase angle of each lick to the oscillation. B, Representative polar plot depicting the uniform phase distribution of lick times to the oscillation for a whole session. Phase locking of licks was studied by assessing deviation from uniformity (Rayleigh test, p > 0.05). C, Stimulus-evoked visual response recorded from a single unit during a behavioral session. Top, Dots represent each spike recorded for all trials within a session. Green rectangle represents the time the visual cue is on. Blue dashed line indicates the median reward time for this session. Bottom, Perievent histogram from the raster plot. D, Representative polar plot depicting the phase distribution of the spikes in relation to the phase of the visually evoked oscillation. The spikes are significantly phase-locked to the oscillation.
In addition, we analyzed the relationship between the visually evoked oscillation and the neuronal firing in V1. V1 single-unit data were collected from four animals while they performed the behavioral task. Many neurons' firing qualitatively appeared to correlate with the visually evoked oscillations (Fig. 4C). To quantify this observation in individual neurons, we analyzed the phase relationship between spike discharges and the theta component of the LFP (Fig. 4D). From the 125 neurons recorded in four animals, 54 units were significantly phase-locked to the theta oscillation. This provides further support to the claim that the oscillations are locally generated.
With training oscillations evolve to report the time interval to expected reward while losing their relationship to stimulus intensity
An interesting feature of these theta oscillations is that their duration changed as animals learned the temporal relationship between the visual cue and the reward. To quantify this observation rigorously, we developed an objective algorithm based on two distinctive features of this cue-evoked oscillatory activity: (1) high energy values in the frequency range between 6 and 9 Hz; and (2) the high degree to which that energy is concentrated across that frequency range at any moment in time. To this end, we first estimated a time-frequency representation of the LFP using Gabor filters and calculated the energy within the 6–9 Hz frequency band (Fig. 5A,B). Second, we calculated how concentrated the signal was within this 6–9 Hz band, using this measure of “purity” as another descriptive characteristic (Fig. 5C). A combined variable taking into account the energy and purity of the signal resulted in a robust measure (the “concentrated energy”; Fig. 5D) that qualitatively captured the temporal envelope that oscillations, subjectively, subtended. A threshold, per session, was set [(max − min)/2.5] and applied to this concentrated energy score (Fig. 5E). A trial was considered to have an oscillation if its concentrated energy value crossed the threshold in the first 500 ms after visual stimulus presentation. The end of the oscillation was taken as the time in which the concentrated energy score dropped back below this threshold value. This automated calculation and thresholding of concentrated energy resulted in objective and robust detection of oscillations and their durations.
Figure 5.
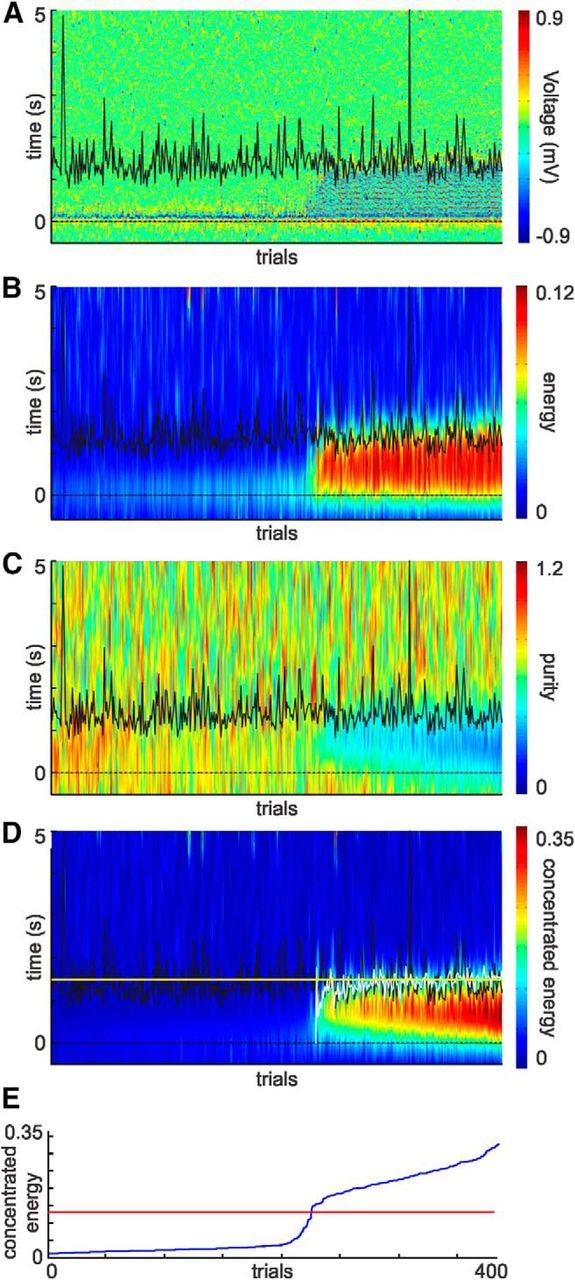
Objective, automatic characterization of oscillation duration. A, Visually evoked activity recorded from one channel shown for every trial of an entire training session (ordered by concentrated energy). Time 0 represents the visual stimulus onset (dashed line). Black line indicates the time of the nth lick. B, Mean energy values for frequencies between 6 and 9 Hz. C, Measure of how concentrated the energy is for the frequency band of interest (“purity”). D, Both independent measures, the energy and purity, were combined (“concentrated energy”) to improve the detection of the presence and duration of oscillations. This measure was used to determine a threshold used for oscillation detection and duration. White line indicates the end of the oscillation determined by the automatic detection algorithm. The oscillation duration accords well with the mean reward time (yellow line). E, Distribution of the mean concentrated energy value within the 500 ms window used to set the threshold for the entire session. Red line indicates the calculated threshold for this session. Trials in all panels ordered by concentrated energy score.
Early in training, the duration of the oscillations correlates to the physical attributes of the visual stimuli, with the low-intensity stimulus evoking shorter durations and the high-intensity stimulus evoking longer durations (p < 0.01, Tukey post hoc test for all comparisons after a two-way ANOVA significant interaction; Fig. 6A,C). There was no significant correlation between oscillation duration and the experienced reward times in the early behavioral sessions (p > 0.05, linear regression; slopes: low, −0.06 ± 0.05, r2 = 0.01; medium, −0.02 ± 0.04, r2 = 0.002; high, 0.02 ± 0.05, r2 = 0.003; Fig. 6A,C). However, as animals learned the task, the oscillation duration evolved to report the time of expected reward. In late training, we found a positive correlation between the oscillation duration and the reward time (p < 0.001, linear regression; slopes: low, 0.46 ± 0.06, r2 = 0.45; medium, 0.51 ± 0.06, r2 = 0.51; high, 0.51 ± 0.07, r2 = 0.47; Fig. 6B,D). To achieve this relationship, the evoked oscillation durations (which varied by animal and stimulus intensity), had to become either shorter or longer depending on their duration relative to the animals' average reward time. Furthermore, as animals gained experience in the task, the oscillation duration lost its relationship to the stimulus intensity, with different flash intensities evoking similar oscillation durations (p > 0.05, ANCOVA; Fig. 6B,D). Finally, to ascertain whether the oscillation end was related to changes on the licking behavior, we performed an ROC analysis to compare the licking pattern observed on trials with and without oscillations around the nth lick. For every session, we built perievent histograms of the lick times centered on the nth lick for trials with and without oscillations. We did not find any differences in the licking behavior around the nth lick on trials with or without oscillations for all animals (p > 0.05, ROC analysis). Together, visually evoked oscillations evolved with training from showing a dependency on the stimulus intensity and no dependency on the delay to reward, to showing a dependency on the delay to reward (p < 0.001, ANCOVA; Fig. 6E) and no dependency on the stimulus intensity (p > 0.05, ANCOVA interaction; Fig. 6E).
Figure 6.

With training, the visually evoked oscillations evolve to accord with the time to expected reward regardless of the intensity of the visual stimuli. A, Example of a session recorded early in training. Trials were plotted separately according to the intensity of the visual stimulus (low, medium, and high) in chronological order. Filled gray circles on color plots represent the nth lick. Black squares represent when the oscillation terminates. Early in training, the duration of the oscillation relates to the intensity of the visual stimuli: being shorter for low intensities and longer for higher intensities. B, Visually evoked activity for the same channel recorded after 3 weeks of training in the behavioral task. With training, the oscillation duration comes to accord well with the median reward time. C, D, Correlation between oscillation duration and median reward time early (C) and late (D) in training for all animals. The oscillation duration for each visual stimulus was plotted against the median reward time for that session. Each color represents a different hemisphere. C, Early in training, there is no correlation between the oscillation duration and the median reward time for any of the stimuli, although stimuli of greater intensity result in longer durations. D, However, when animals become experienced in the task, there is a positive and significant correlation between the oscillation duration and the expected reward time, yet they lose their relationship to stimulus intensity. E, The correlations early and late in training are significantly different (p < 0.0001, ANCOVA).
Because animals were trained in two cohorts with different light-intensity/reward-magnitude policies [low intensity → intermediate reward, medium intensity → big reward, high intensity → small reward (n = 8 animals); and low intensity → big reward, medium intensity → small reward, high intensity → intermediate reward (n = 5 animals)], we also analyzed the relationship between oscillation duration and reward magnitude. Oscillation duration evoked by a stimulus did not correlate with reward magnitude predicted by the stimulus (p > 0.05, one-way ANOVA). Finally, oscillations were not related to the acquisition of reward per se, as rewarded and unrewarded trials evoked nondistinguishable responses regarding duration and their likelihood of being evoked (i.e., their “prevalence”) (p > 0.05, t tests). Overall, these results demonstrate that repeated presentation of cues predicting delayed rewards induce the emergence of oscillations that, although initially relating to the physical characteristics of the visual stimulus, evolve to report the temporal interval to expected reward.
Behavioral performance is not influenced by the presence or absence of oscillations
Should visually evoked oscillations in V1 convey information used to drive task behaviors, the presence or absence of theta oscillations within V1 may be relatable to measures of the animals' performance in the task. To address this, we analyzed whether the time to lick to criteria covaries with the presence/absence of the oscillation. We observed no differences in the time to lick to criterion comparing trials with and without oscillations (early in training, trials with oscillations 1.94 ± 0.13 s vs trials without oscillation 1.92 ± 0.12 s; late in training, trials with oscillations 1.29 ± 0.10 s vs trials without oscillation 1.30 ± 0.09 s; p > 0.05, two-way repeated-measures ANOVA). In addition, we addressed whether the presence or absence of oscillations could influence the estimation of the delay to reward by evaluating the time animals remained in the nose-poke in unrewarded trials. In these unrewarded trials, we observed no difference in the time to exit the nose-poke (give up time) when comparing trials with and without oscillations (early in training, trials with oscillation 5.34 ± 0.39 vs trials without oscillation 5.44 ± 0.52 s; late in training, trials with oscillation 2.04 ± 0.10 vs trials without oscillation 2.00 ± 0.10 s; p > 0.05, two-way repeated-measures ANOVA). These results indicate that the occurrence of oscillations is related to neither an enhancement nor decrement of the animals' measured behavior.
The likelihood of evoking an oscillation is related to the VEP amplitude
Another feature of the LFP activity that changed with training was the likelihood of evoking an oscillation. As shown in Figure 3, not every visual cue presentation evoked an oscillation, even after the animals became familiarized with the behavioral task. As we stated earlier, the VEP amplitude relates to the visual cue intensity. Using the same oscillation detection algorithm, we found that the oscillation prevalence was smaller for the lowest intensity stimulus, being greater for the medium and high intensities both early and late in training (p < 0.05, Tukey post hoc, low vs high and low vs medium after a significant main factor, two-way repeated-measures ANOVA). To analyze whether the VEP amplitude was predictive of the appearance of an oscillation, the VEPs for trials with and without oscillations were compared across training. We found that the VEP amplitude was higher for those trials showing an oscillation, whether early or late in training (VEP oscillation trials, 0.74 ± 0.02 mV vs VEP no oscillation trial, 0.65 ± 0.02 mV; p < 0.01, two-way repeated measure ANOVA). Finally, the VEP amplitude showed no relationship with the oscillation duration either on early or late sessions (p > 0.05, linear regression) and no relationship to the associated reward magnitude (p > 0.05, two-way repeated-measures ANOVA). Thus, the likelihood of evoking an oscillation is greater for trials with higher elicited VEPs.
Experienced reward rate predicts the likelihood of evoking an oscillation
When animals have gained familiarity with the task, the prevalence of evoking an oscillation is observed to wax and wane throughout a session in a stereotyped fashion from day to day, being characterized as a rapid increase in the probability of evoking an oscillation across the first ∼50 trials, followed by a steady and gradual decline (Fig. 7B,C). Given this distinctive and consistent patterning of the prevalence of oscillations across the course of a session, we reasoned that V1 is sensitive to the recent experience of the animal in the task. Therefore, we hypothesized that the likelihood of evoking an oscillation may reflect the animal's motivational state, as rats typically performed the task faster at the beginning of the behavioral session, decreasing steadily their trial rate there onwards, presumably as they became sated. To test this potential relationship, we calculated the rate in which animals performed trials (“trial rate”) to serve as a measure of motivational state. This trial rate was calculated by counting the number of trials performed within a trailing 300 s sliding window (using a 2 s step size). We found that, in 58 of 60 cases, there was a significant correlation between the trial rate experienced in the recent past and the oscillation rate (mean Pearson correlation coefficient, 0.43 ± 0.03; Fig. 7E).
Although trial rate indeed accounts for a substantial proportion of the variability observed in evoking an oscillation, the prevalence of oscillations, rather than reflecting trial rate per se, may actually reflect the rate of photic bombardment (“photic rate”) experienced in the recent past by the animal (i.e., processes of sensitization/habituation). Alternatively, should reward history impact the visual cortex, the likelihood of oscillations, rather than being determined by recent visual experience, could be determined by the rate of experienced reward (“reward rate”). Although photic and reward rates are both similarly dependent upon the pace of self-executed trials (trial rate), they are independently determined by, respectively, the particular sequence of visual stimuli (low, medium, and high intensity) or rewards (small, intermediate, big, and omissions) experienced over the recent past. Because, by design, stimulus intensity and reward volumes do not map linearly to each other, the experienced photic rate and reward rate can independently be correlated to the rate of evoking oscillations (“oscillation rate”).
In 58 of 60 cases, the three variables studied (trial, photic, and reward rate) showed a significant correlation to the oscillation rate (Fig. 7E). However, the correlation coefficient was significantly higher for the reward rate, whereas we found no differences between the trial and photic correlations (trial rate, 0.43 ± 0.03; photic rate, 0.43 ± 0.03; reward rate, 0.49 ± 0.03; p < 0.001, Tukey post hoc, one-way repeated-measures ANOVA; Fig. 7D,E). In addition, in 41 of 58 sessions, the reward rate showed the highest correlation coefficient compared with both the trial and photic rate (p < 0.01, χ2 test). The photic rate correlation was higher than the trial rate in 26 of 58 cases, indicating that both variables provide redundant information (p > 0.05, χ2 test). Thus, the oscillation prevalence across a behavioral session best reflects the recently experienced reward rate.
Discussion
Here we describe how, with experience, cue-evoked oscillations emerge in V1 to convey expected reward time as well as to relate experienced reward rate. Repeated presentation of visual cues induces the emergence of stimulus-evoked oscillations in V1 that initially outlast the visual cue and whose durations correspond to the cues' intensity. With training, the duration of this oscillatory activity evolves from relating the physical parameters of the stimuli to relating the time in which those stimuli foretell of expected reward. Furthermore, the likelihood of evoking an oscillation reflects the reward rate recently experienced by the animal. These observations depart from the framework of perceptual learning wherein changes in evoked responses that occur as a result of training are regarded as furthering the detection and discrimination of visual cues. Rather, by demonstrating that cue evoked-responses evolve to convey the timing and rate of experienced reward, we advance an alternative framework in which V1 actively transforms visual input into what it connotes behaviorally to the animal: expected reward time and experienced reward rate.
The visual cortex is commonly thought of as a feature detector that builds representations of stimuli in the visual world by faithfully encoding their physical properties (but see Purves et al., 2001; Purves, 2010). In this view, the visual system responds to visual inputs in a manner that reflects the attributes of the stimulus. There is nonetheless ample evidence that visual experience can induce long-lasting changes in V1 responses in adult animals and humans. Cortical representations of visual inputs in the adult animal can be modified by a variety of manipulations, such as repeated exposure (Fiorentini and Berardi, 1980; Furmanski et al., 2004; Frenkel et al., 2006; Gavornik and Bear, 2014), visual deprivation (Sawtell et al., 2003; Hofer et al., 2006), attentional demands (Ahissar and Hochstein, 1993; Fahle, 2004), and positive reinforcements (Serences, 2008; Seitz et al., 2009; Stănişor et al., 2013). These changes in V1 responses are generally interpreted in a perceptual learning framework, wherein visual experience improves our ability to perceive the world (Karmarkar and Dan, 2006; Gilbert et al., 2009; Roelfsema et al., 2010). Here we demonstrate that, with training, stimulus-evoked oscillations in V1 lose their relationship with the physical parameters of the stimuli and evolve to relate to the behavioral meaning, as acquired through training, that the stimuli foretell: reward time and prior reward history but not reward magnitude itself. Thus, our results suggest that changes in V1 responses observed here are due to learning the behavioral relevance of visual cues and may not correspond to a perceptual learning process.
Here we show that changes in V1 responsivity induced by cue-reward associations can manifest as stimulus-evoked oscillations. These visually evoked oscillations are observable across all cortical layers and a large area of V1. Furthermore, the presence of sinks and sources located in V1 demonstrates that the oscillations observed are not due to volume conduction of signals from other brain areas (Mitzdorf, 1985) and suggest that they are local to V1, generated through external inputs or by recurrent activity within cortical layers. Additionally, the sinks and sources related to the oscillations resemble those of the VEP, suggesting that they both share a common mechanism. The thalamocortical circuit is strongly implicated in the generation of naturally occurring sleep oscillations and in pathological spike-wave oscillations present in some epileptic disorders (Destexhe et al., 1993; Sherman and Guillery, 2002). This raises the possibility that theta oscillations in V1 stem from resonant activity in the thalamocortical network like those that give rise to the VEP.
Oscillatory activity is thought to have an important role in brain operations and cognition (Buzsáki and Draguhn, 2004; Buzsáki, 2007). In particular, local field oscillations at the theta frequency range have been observed in several cortical structures (Steriade, 2000) and related to learning and memory processes (Hasselmo, 2005; Jones and Wilson, 2005; Siapas et al., 2005; Dragoi and Buzsáki, 2006; DeCoteau et al., 2007; Womelsdorf et al., 2007). Furthermore, theta oscillations are associated with induction of synaptic plasticity (Buzsáki, 2002). Within the visual system, oscillatory activity has been implicated in selective attention (Fries et al., 2001; Palva and Palva, 2007; Schroeder and Lakatos, 2009), working memory (Jensen, 2002; Lee et al., 2005), and interregional communication (Gray et al., 1989; Singer and Gray, 1995; Liebe et al., 2012) among other processes. If the visually evoked oscillations described here are related to these processes, one might expect to have observed either a facilitatory or deleterious effect on the animal's behavior; yet we did not observe any differences in animal's performance in trials with, versus without, oscillations. Thus, we propose that, in this context, rather than relating to an enhancement (or detriment) in visual perception, visually evoked oscillations are instead a signature that V1 constructs predictive expectations of behaviorally relevant cues.
The ability to generate predictions about a forthcoming event based on a given stimulus requires the timing and value of a future reward to be represented. This ability is central to making adaptive decisions and guiding behavior. It is commonly held that animals' behavior is motivated to maximize rewards and avoid punishments. In a dynamic and uncertain environment, estimating reinforcement rate based on recent experience provides an advantage in selecting among rewarding options (Namboodiri et al., 2014a). A contemporaneous theory posits that intertemporal decision making is based on expectations of reward rate derived from the recently experienced past (Namboodiri et al., 2014a, b, c). According to this theory (Training-Integrated Maximized Estimation of Reinforcement Rate), animals make choices to optimize expected reward rates over this past temporal interval as well as the expected delay to future reward. Interestingly, the visually evoked oscillations described here evolve with training to relate both the time of expected reward as well as the recently experienced reward rate, and could thus be an electrophysiological signature of these essential features.
To create predictions about future events, animals should store the experienced magnitudes and times of rewards following conditioned stimuli. In the present study, we found a strong reward timing signal in V1, but we failed to observe reward value signaling in the evoked oscillations. However, recent studies in humans (Serences, 2008; Serences and Saproo, 2010) and monkeys (Stănişor et al., 2013) have demonstrated that V1 has the ability to report information about reward magnitude. Stănişor et al. (2013) trained monkeys in a curve-tracing task in which animals were signaled to saccade toward one of two possible targets associated to different reward values. They found that V1 responses are stronger for higher reward stimuli. However, when only one cue is presented to the animal, reward magnitude has a much diminished effect on V1 activity. This suggests that reward value modulations arise, or are more easily detected, in V1 when competing stimuli are presented and could thus explain the absence of a value signal in our experimental conditions. Another important fact to consider is that, in this study, the visual cues are visible throughout the choice and reward acquisition period, whereas in our case the stimulus is long since terminated by the time the animal receives the reward. Finally, expected reward magnitude may yet be present in V1 but simply not observable in the oscillatory activity.
The mechanism by which the brain learns to create temporal expectations based on predictive stimuli is unknown. Although temporal information is known to reside in high-order brain areas (Leon and Shadlen, 2003; Xu et al., 2014), recent studies have demonstrated that V1 neurons are also capable of providing information about the time of an expected reward (Shuler and Bear, 2006; Chubykin et al., 2013). Computational studies have shown that cue-reward intervals can be expressed in V1 single units through reward-dependent expression of synaptic plasticity (Gavornik et al., 2009; Gavornik and Shouval, 2011). According to this reward-dependent expression model, V1 receives a local reinforcement signal, as recently experimentally observed (Liu et al., 2015), that selectively enables changes in synaptic weights of those synapses that have been active in the recent past. The population reward timing signal evidenced in V1's LFP arises with training as a result of oscillations becoming longer or shorter to match the animal's behavioral reward time. That this oscillatory activity emerges and is local to V1 lends further credence to the notion that V1 learns through reinforcement signaling the cue-to-reward interval.
Behavioral choices are made based on having learned from past experience what stimuli predict. To make the most adaptive choices, it is also important to apprehend the reward rate of an environment as experienced in the recent past so that choice behavior drives actions that can maintain or increase that rate, or if not possible, to minimize the rate of loss. We evidence in LFP recordings that V1 actively processes sensory inputs to create predictions of forthcoming events and is privy to recent reward history. Therefore, cue-evoked responses in V1 may provide valuable information regarding what to expect and when.
Footnotes
This work was supported by National Institutes of Health Grant R01MH084911. We thank Dr. Nicola Nerritti for the development of a custom spectral decomposition function using Gabor filters used in our oscillation detection algorithm; Grant Gillary for help developing the CSD analysis; and Emma Roach, Vijay M. K. Namboodiri, and Tanya Marton for helpful discussions of the experimental design.
The authors declare no competing financial interests.
References
- Ahissar M, Hochstein S. Attentional control of early perceptual learning. Proc Natl Acad Sci U S A. 1993;90:5718–5722. doi: 10.1073/pnas.90.12.5718. [DOI] [PMC free article] [PubMed] [Google Scholar]
- Bigler ED, Shearer DE, Dustman RE, Fleming DE. Differential effects of convulsants on visually evoked responses in the albino rat. Pharmacol Biochem Behav. 1978;8:727–733. doi: 10.1016/0091-3057(78)90273-3. [DOI] [PubMed] [Google Scholar]
- Bishop G, O'Leary J. Components of the electrical response of the optic cortex of the rabbit. Am J Physiol. 1936;117:292–308. [Google Scholar]
- Buzsáki G. Theta oscillations in the hippocampus. Neuron. 2002;33:325–340. doi: 10.1016/S0896-6273(02)00586-X. [DOI] [PubMed] [Google Scholar]
- Buzsáki G. The structure of consciousness. Nature. 2007;446:267. doi: 10.1038/446267a. [DOI] [PubMed] [Google Scholar]
- Buzsáki G, Draguhn A. Neuronal oscillations in cortical networks. Science. 2004;304:1926–1929. doi: 10.1126/science.1099745. [DOI] [PubMed] [Google Scholar]
- Chubykin AA, Roach EB, Bear MF, Shuler MG. A cholinergic mechanism for reward timing within primary visual cortex. Neuron. 2013;77:723–735. doi: 10.1016/j.neuron.2012.12.039. [DOI] [PMC free article] [PubMed] [Google Scholar]
- Cooke SF, Bear MF. Visual experience induces long-term potentiation in the primary visual cortex. J Neurosci. 2010;30:16304–16313. doi: 10.1523/JNEUROSCI.4333-10.2010. [DOI] [PMC free article] [PubMed] [Google Scholar]
- DeCoteau WE, Thorn C, Gibson DJ, Courtemanche R, Mitra P, Kubota Y, Graybiel AM. Learning-related coordination of striatal and hippocampal theta rhythms during acquisition of a procedural maze task. Proc Natl Acad Sci U S A. 2007;104:5644–5649. doi: 10.1073/pnas.0700818104. [DOI] [PMC free article] [PubMed] [Google Scholar]
- Destexhe A, Mccormick DA, Sejnowski TJ. A model for 8–10 Hz spindling in interconnected thalamic relay and reticularis. Neurons. 1993;65:2473–2477. doi: 10.1016/S0006-3495(93)81297-9. [DOI] [PMC free article] [PubMed] [Google Scholar]
- Dragoi G, Buzsáki G. Temporal encoding of place sequences by hippocampal cell assemblies. Neuron. 2006;50:145–157. doi: 10.1016/j.neuron.2006.02.023. [DOI] [PubMed] [Google Scholar]
- Fahle M. Perceptual learning: a case for early selection. J Vis. 2004;4:879–890. doi: 10.1167/4.8.879. [DOI] [PubMed] [Google Scholar]
- Fiorentini A, Berardi N. Perceptual learning specific for orientation and spatial frequency. Nature. 1980;287:43–44. doi: 10.1038/287043a0. [DOI] [PubMed] [Google Scholar]
- Frenkel MY, Sawtell NB, Diogo AC, Yoon B, Neve RL, Bear MF. Instructive effect of visual experience in mouse visual cortex. Neuron. 2006;51:339–349. doi: 10.1016/j.neuron.2006.06.026. [DOI] [PubMed] [Google Scholar]
- Fries P, Reynolds JH, Rorie AE, Desimone R. Modulation of oscillatory neuronal synchronization by selective visual attention. Science. 2001;291:1560–1563. doi: 10.1126/science.1055465. [DOI] [PubMed] [Google Scholar]
- Furmanski CS, Schluppeck D, Engel SA. Learning strengthens the response of primary visual cortex to simple patterns. Curr Biol. 2004;14:573–578. doi: 10.1016/j.cub.2004.03.032. [DOI] [PubMed] [Google Scholar]
- Gavornik JP, Bear MF. Learned spatiotemporal sequence recognition and prediction in primary visual cortex. Nat Neurosci. 2014;17:732–737. doi: 10.1038/nn.3683. [DOI] [PMC free article] [PubMed] [Google Scholar]
- Gavornik JP, Shouval HZ. A network of spiking neurons that can represent interval timing: mean field analysis. J Comput Neurosci. 2011;30:501–513. doi: 10.1007/s10827-010-0275-y. [DOI] [PMC free article] [PubMed] [Google Scholar]
- Gavornik JP, Shuler MG, Loewenstein Y, Bear MF, Shouval HZ. Learning reward timing in cortex through reward dependent expression of synaptic plasticity. Proc Natl Acad Sci U S A. 2009;106:6826–6831. doi: 10.1073/pnas.0901835106. [DOI] [PMC free article] [PubMed] [Google Scholar]
- Genovesio A, Tsujimoto S, Wise SP. Feature- and order-based timing representations in frontal cortex. Neuron. 2009;63:254–266. doi: 10.1016/j.neuron.2009.06.018. [DOI] [PMC free article] [PubMed] [Google Scholar]
- Gilbert CD, Li W, Piech V. Perceptual learning and adult cortical plasticity. J Physiol. 2009;587:2743–2751. doi: 10.1113/jphysiol.2009.171488. [DOI] [PMC free article] [PubMed] [Google Scholar]
- Gray CM, König P, Engel AK, Singer W. Oscillatory responses in cat visual cortex exhibit inter-columnar synchronization which reflects global stimulus properties. Nature. 1989;338:334–337. doi: 10.1038/338334a0. [DOI] [PubMed] [Google Scholar]
- Hasselmo ME. What is the function of hippocampal theta rhythm? Linking behavioral data to phasic properties of field potential and unit recording data. Hippocampus. 2005;15:936–949. doi: 10.1002/hipo.20116. [DOI] [PubMed] [Google Scholar]
- Hofer SB, Mrsic-Flogel TD, Bonhoeffer T, Hübener M. Prior experience enhances plasticity in adult visual cortex. Nat Neurosci. 2006;9:127–132. doi: 10.1038/nn1610. [DOI] [PubMed] [Google Scholar]
- Hubel DH, Wiesel TN. The period of susceptibility to the physiological effects of unilateral eye closure in kittens. J Physiol. 1970;206:419–436. doi: 10.1113/jphysiol.1970.sp009022. [DOI] [PMC free article] [PubMed] [Google Scholar]
- Huertas MA, Shuler MGH, Shouval HZ. Plasticity of network dynamics as observed experimentally requires heterogeneity of the network connectivity pattern. BMC Neurosci. 2013;14:360. [Google Scholar]
- Jensen O, Gelfand J, Kounios J, Lisman JE. Oscillations in the alpha band (9–12 Hz) increase with memory load during retention in a short-term memory task. Cereb Cortex. 2002;12:877–882. doi: 10.1093/cercor/12.8.877. [DOI] [PubMed] [Google Scholar]
- Jones MW, Wilson MA. Theta rhythms coordinate hippocampal-prefrontal interactions in a spatial memory task. PLoS Biol. 2005;3:e402. doi: 10.1371/journal.pbio.0030402. [DOI] [PMC free article] [PubMed] [Google Scholar]
- Karmarkar UR, Dan Y. Experience-dependent plasticity in adult visual cortex. Neuron. 2006;52:577–585. doi: 10.1016/j.neuron.2006.11.001. [DOI] [PubMed] [Google Scholar]
- Kimura D. Multiple response of visual cortex of the rat to photic stimulation. Electroencephalogr Clin Neurophysiol. 1962;14:115–122. doi: 10.1016/0013-4694(62)90013-5. [DOI] [PubMed] [Google Scholar]
- Lee H, Simpson GV, Logothetis NK, Rainer G. Phase locking of single neuron activity to theta oscillations during working memory in monkey extrastriate visual cortex. Neuron. 2005;45:147–156. doi: 10.1016/j.neuron.2004.12.025. [DOI] [PubMed] [Google Scholar]
- Leon MI, Shadlen MN. Representation of time by neurons in the posterior parietal cortex of the macaque. Neuron. 2003;38:317–327. doi: 10.1016/S0896-6273(03)00185-5. [DOI] [PubMed] [Google Scholar]
- Liebe S, Hoerzer GM, Logothetis NK, Rainer G. Theta coupling between V4 and prefrontal cortex predicts visual short-term memory performance. Nat Neurosci. 2012;15:456–462. S1–S2. doi: 10.1038/nn.3038. [DOI] [PubMed] [Google Scholar]
- Liu CH, Coleman JE, Davoudi H, Zhang K, Hussain Shuler MG. Selective activation of a putative reinforcement signal conditions cued interval timing in primary visual cortex. Curr Biol. 2015 doi: 10.1016/j.cub.2015.04.028. doi: 10.1016/j.cub.2015.04.028. Advance online publication. [DOI] [PMC free article] [PubMed] [Google Scholar]
- Mitzdorf U. Current source-density method and application in cat cerebral cortex: investigation of evoked potentials and EEG phenomena. Physiol Rev. 1985;65:37–100. doi: 10.1152/physrev.1985.65.1.37. [DOI] [PubMed] [Google Scholar]
- Mwanza JC, Finley D, Spivey CL, Graff JE, Herr DW. Depression of the photic after discharge of flash evoked potentials by physostigmine, carbaryl and propoxur, and the relationship to inhibition of brain cholinesterase. Neurotoxicology. 2008;29:87–100. doi: 10.1016/j.neuro.2007.09.004. [DOI] [PubMed] [Google Scholar]
- Namboodiri VM, Mihalas S, Shuler MG. Rationalizing decision-making: understanding the cost and perception of time. Timing Time Percept Rev. 2014a;1:4. [Google Scholar]
- Namboodiri VM, Mihalas S, Hussain Shuler MG. A temporal basis for Weber's law in value perception. Front Integr Neurosci. 2014b;8:79. doi: 10.3389/fnint.2014.00079. [DOI] [PMC free article] [PubMed] [Google Scholar]
- Namboodiri VM, Mihalas S, Marton TM, Hussain Shuler MG. A general theory of intertemporal decision-making and the perception of time. Front Behav Neurosci. 2014c;8:61. doi: 10.3389/fnbeh.2014.00061. [DOI] [PMC free article] [PubMed] [Google Scholar]
- Palva S, Palva JM. New vistas for alpha-frequency band oscillations. Trends Neurosci. 2007;30:150–158. doi: 10.1016/j.tins.2007.02.001. [DOI] [PubMed] [Google Scholar]
- Pettersen KH, Devor A, Ulbert I, Dale AM, Einevoll GT. Current-source density estimation based on inversion of electrostatic forward solution: effects of finite extent of neuronal activity and conductivity discontinuities. J Neurosci Methods. 2006;154:116–133. doi: 10.1016/j.jneumeth.2005.12.005. [DOI] [PubMed] [Google Scholar]
- Purves D. Brains: how they seem to work. Upper Saddle River, NJ: FT Press Science; 2010. [Google Scholar]
- Purves D, Lotto RB, Williams SM, Nundy S, Yang Z. Why we see things the way we do: evidence for a wholly empirical strategy of vision. Philos Trans R Soc Lond B Biol Sci. 2001;356:285–297. doi: 10.1098/rstb.2000.0772. [DOI] [PMC free article] [PubMed] [Google Scholar]
- Roelfsema PR, van Ooyen A, Watanabe T. Perceptual learning rules based on reinforcers and attention. Trends Cogn Sci. 2010;14:64–71. doi: 10.1016/j.tics.2009.11.005. [DOI] [PMC free article] [PubMed] [Google Scholar]
- Sawtell NB, Frenkel MY, Philpot BD, Nakazawa K, Tonegawa S, Bear MF. NMDA receptor-dependent ocular dominance plasticity in adult visual cortex. Neuron. 2003;38:977–985. doi: 10.1016/S0896-6273(03)00323-4. [DOI] [PubMed] [Google Scholar]
- Schroeder CE, Lakatos P. Low-frequency neuronal oscillations as instruments of sensory selection. Trends Neurosci. 2009;32:9–18. doi: 10.1016/j.tins.2008.09.012. [DOI] [PMC free article] [PubMed] [Google Scholar]
- Seitz A, Watanabe T. A unified model for perceptual learning. Trends Cogn Sci. 2005;9:329–334. doi: 10.1016/j.tics.2005.05.010. [DOI] [PubMed] [Google Scholar]
- Seitz AR, Kim D, Watanabe T. Rewards evoke learning of unconsciously processed visual stimuli in adult humans. Neuron. 2009;61:700–707. doi: 10.1016/j.neuron.2009.01.016. [DOI] [PMC free article] [PubMed] [Google Scholar]
- Serences JT. Value-based modulations in human visual cortex. Neuron. 2008;60:1169–1181. doi: 10.1016/j.neuron.2008.10.051. [DOI] [PMC free article] [PubMed] [Google Scholar]
- Serences JT, Saproo S. Population response profiles in early visual cortex are biased in favor of more valuable stimuli. J Neurophysiol. 2010;104:76–87. doi: 10.1152/jn.01090.2009. [DOI] [PMC free article] [PubMed] [Google Scholar]
- Shearer DE, Fleming DE, Bigler ED. The photically evoked afterdischarge: a model for the study of drugs useful in the treatment of petit mal epilepsy. Epilepsia. 1976;17:429–435. doi: 10.1111/j.1528-1157.1976.tb04455.x. [DOI] [PubMed] [Google Scholar]
- Sherman SM, Guillery RW. The role of the thalamus in the flow of information to the cortex. Philos Trans R Soc Lond B Biol Sci. 2002;357:1695–1708. doi: 10.1098/rstb.2002.1161. [DOI] [PMC free article] [PubMed] [Google Scholar]
- Shuler MG, Bear MF. Reward timing in the primary visual cortex. Science. 2006;311:1606–1609. doi: 10.1126/science.1123513. [DOI] [PubMed] [Google Scholar]
- Siapas AG, Lubenov EV, Wilson MA. Prefrontal phase locking to hippocampal theta oscillations. Neuron. 2005;46:141–151. doi: 10.1016/j.neuron.2005.02.028. [DOI] [PubMed] [Google Scholar]
- Singer W, Gray CM. Visual feature integration and the temporal correlation hypothesis. Annu Rev Neurosci. 1995;18:555–586. doi: 10.1146/annurev.ne.18.030195.003011. [DOI] [PubMed] [Google Scholar]
- Stănişor L, van der Togt C, Pennartz CM, Roelfsema PR. A unified selection signal for attention and reward in primary visual cortex. Proc Natl Acad Sci U S A. 2013;110:9136–9141. doi: 10.1073/pnas.1300117110. [DOI] [PMC free article] [PubMed] [Google Scholar]
- Steriade M. Corticothalamic resonance, states of vigilance and mentation. Neuroscience. 2000;101:243–276. doi: 10.1016/S0306-4522(00)00353-5. [DOI] [PubMed] [Google Scholar]
- Teller DY, Movshon JA. Visual development. Vision Res. 1986;26:1483–1506. doi: 10.1016/0042-6989(86)90169-0. [DOI] [PubMed] [Google Scholar]
- Uhlrich DJ, Manning KA, O'Laughlin ML, Lytton WW. Photic-induced sensitization: acquisition of an augmenting spike-wave response in the adult rat through repeated strobe exposure. J Neurophysiol. 2005;94:3925–3937. doi: 10.1152/jn.00724.2005. [DOI] [PubMed] [Google Scholar]
- Womelsdorf T, Schoffelen JM, Oostenveld R, Singer W, Desimone R, Engel AK, Fries P. Modulation of neuronal interactions through neuronal synchronization. Science. 2007;316:1609–1612. doi: 10.1126/science.1139597. [DOI] [PubMed] [Google Scholar]
- Xu M, Zhang SY, Dan Y, Poo MM. Representation of interval timing by temporally scalable firing patterns in rat prefrontal cortex. Proc Natl Acad Sci U S A. 2014;111:480–485. doi: 10.1073/pnas.1321314111. [DOI] [PMC free article] [PubMed] [Google Scholar]
- Zold CL, Larramendy C, Riquelme LA, Murer MG. Distinct changes in evoked and resting globus pallidus activity in early and late Parkinson's disease experimental models. Eur J Neurosci. 2007;26:1267–1279. doi: 10.1111/j.1460-9568.2007.05754.x. [DOI] [PubMed] [Google Scholar]
- Zold CL, Escande MV, Pomata PE, Riquelme LA, Murer MG. Striatal NMDA receptors gate cortico-pallidal synchronization in a rat model of Parkinson's disease. Neurobiol Dis. 2012;47:38–48. doi: 10.1016/j.nbd.2012.03.022. [DOI] [PubMed] [Google Scholar]