

Abstract
We spend the majority of our lives indoors; yet, we currently lack a comprehensive understanding of how the microbial communities found in homes vary across broad geographical regions and what factors are most important in shaping the types of microorganisms found inside homes. Here, we investigated the fungal and bacterial communities found in settled dust collected from inside and outside approximately 1200 homes located across the continental US, homes that represent a broad range of home designs and span many climatic zones. Indoor and outdoor dust samples harboured distinct microbial communities, but these differences were larger for bacteria than for fungi with most indoor fungi originating outside the home. Indoor fungal communities and the distribution of potential allergens varied predictably across climate and geographical regions; where you live determines what fungi live with you inside your home. By contrast, bacterial communities in indoor dust were more strongly influenced by the number and types of occupants living in the homes. In particular, the female : male ratio and whether a house had pets had a significant influence on the types of bacteria found inside our homes highlighting that who you live with determines what bacteria are found inside your home.
Keywords: microbial ecology, bacteria, fungi, dust, built environment, allergens
1. Introduction
If there was ever any doubt, it has become clear in recent years that we are exposed to many thousands of bacterial and fungal species as we go about our daily lives [1–4]. As humans become ever-more urban and we now spend the majority of our lives indoors [5], the time we spend with the microbial taxa found inside homes is increasing. While some of these taxa have negative effects on human health, either as pathogens (e.g. antibiotic-resistant Staphylococcus aureus, [6]) or by serving as triggers of allergies and allergenic asthma [7–10], others may even be beneficial [11–14]. More generally, it has been argued that childhood exposure to reduced levels of microbial diversity in and around homes may partially explain the rise in the incidence of allergies and autoimmune disorders in many developed countries [13,15]. Clearly understanding the factors that influence which microbial taxa can be found within a particular home has great significance for human health and well-being.
Previous studies suggest that the composition of the microbes found inside homes can be strongly influenced by the presence, identity and activities of human occupants [16–20]. Non-human occupants, including dogs [3,21,22] and household insects [23], can also influence the types of microbes found inside homes. Likewise, there is evidence that the types of bacteria and fungi found inside homes can be affected by differences in ventilation, building design, the environmental characteristics found within buildings [20,22,24–28] or prior water damage from flooding [29]. If we consider a home to be a microbial ecosystem, the geographical location of a home should also be important in structuring the types of bacteria or fungi found inside the home, just as geography has been known for many decades to structure plant and animal communities across and within continents [30].
Geographical structure in the composition of microbe species in homes could arise from dispersal constraints—not all microbial taxa that can enter homes are evenly distributed across broad geographical regions, or they could arise from environmental factors (e.g. temperature, humidity) that select for certain taxa in certain regions. We expect that indoor fungi will exhibit particularly strong variability across geographical regions, given that most fungal taxa found indoors come from outside the home [27] and the fungi found in outdoor air can exhibit a high degree of geographical endemism [31,32]. Yet, the biogeography of indoor microbial life remains largely unstudied with the exception of a single study of 72 buildings, in which strong effects of climate were found on indoor fungal taxa [25].
If the types of bacteria and fungi inside homes track outdoor climatic conditions, then it could be because of the influence of outdoor climate on indoor climate (e.g. houses in Florida are warmer in the winter than those in Alaska [33]). Alternatively, such patterns could arise because of the influence of outdoor microbes on indoor microbes due to dispersal into homes through windows and doors or on occupants [24,34]. Just as pollutants inside homes often reflect pollution levels outside homes [35,36], indoor microbes might be influenced by outdoor conditions either because of frequent flow of outdoor microbes into homes [24,34] or because indoor conditions are incompletely buffered from outdoor conditions [33]. From previous work, we know that the types of bacteria and fungi found in outdoor air can vary as a function of surrounding soil conditions, land-use type, climate and net primary productivity [37], with these factors together yielding predictable regional differences in the overall composition of bacterial and fungal communities found in outdoor air [38]. All of these factors may influence the species found indoors directly, or they may do so via their effects on outdoor taxa. Alternatively since many homes, particularly those in developed countries, have environmental conditions distinct from those found outdoors with limited air exchange [33], the effects of regional conditions might be modest when compared with the effects of house design (including ventilation), operation and occupancy.
We currently lack a comprehensive understanding of how those microbial communities found in homes vary across broad geographical regions and what factors are most important in shaping the types of bacteria and fungi found inside our homes. This knowledge gap persists despite the well-recognized importance of these microbes to human health and well-being. Ideally, one wants to understand what factors influence which microbes live in homes and, in turn, how the composition of those microbes influences health and well-being. Here, we take the first of those two steps; we investigated the geography and local ecology of the fungi and bacteria found inside approximately 1200 homes located across the continental US, homes that represent a broad range of home designs and span many climatic zones. We used high-throughput sequencing coupled with multivariate statistical models to identify how home characteristics, the types of bacteria and fungi found outside the home, the numbers of occupants (both human and non-human), outdoor climate, degree of urbanization and geographical location shape the assemblages of fungi and bacteria found in dust collected from inside homes.
2. Material and methods
(a). Sample collection, molecular analyses and sample characterization
Details of the sample collection and analytical procedures are nearly identical to those described previously [38]. Briefly, indoor and outdoor dust samples were collected by volunteers participating in the Wild Life of Our Homes citizen science project (homes.yourwildlife.org). Participants were instructed to sample the upper door trim on an interior door in the main living area of the home and the upper door trim on the outside surface of an exterior door. These sampling locations were selected as they are unlikely to be cleaned frequently and serve as passive collectors of settled dust inside or outside home with little to no direct contact from the home occupants.
Swabs were prepared for sequencing using a direct PCR approach [39]. For bacteria, we sequenced the V4 hypervariable region of the 16S rRNA gene using the 515-F (GTGCCAGCMGCCGCGGTAA) and 806-R (GGACTACHVGGGTWTCTAAT) primer pair. For fungi, we sequenced the first internal transcribed spacer (ITS1) region of the rRNA operon using the ITS1-F (CTTGGTCATTTAGAGGAAGTAA) and ITS2 (GCTGCGTTCTTCATCGATGC) primer pair. The primers included the appropriate Illumina adapters with the reverse primers also having an error-correcting 12-bp barcode unique to each sample to permit multiplexing of samples [40]. Sequences were quality filtered (maxee value of 0.5) and clustered into greater than or equal to 97% similar phylotypes after removing singleton sequences using the UPARSE pipeline [41]. Phylotype taxonomy was determined using the Ribosomal Database Project classifier [42] trained on the Greengenes 13_8 16S rRNA database [43] and the May 2014 version of the UNITE ITS database [44]. In order to remove potential amplicon sequencing biases, we first removed samples with less than 10 000 sequences and then we normalized the sequence counts using a cumulative-sum scaling [45]. For bacteria, the number of paired dust samples collected from both indoors and outdoors was 2284 (i.e. 1142 indoor samples and 1142 outdoor samples). For fungi, the number of paired dust samples was 2266 with an equal number of indoor and outdoor dust samples. The average number of sequences per sample was 79 450 and 99 145 for bacteria and fungi, respectively. The total number of phylotypes identified from both the indoor and outdoor samples was 125 066 and 72 284 for bacteria and fungi, respectively.
Geographical coordinates were derived from location information (home address). Coordinates were then used to obtain georeferenced variables for each household. These variables included climatic and soil factors, population density, plant productivity and the presence of livestock (see details in [38]). Home characteristics and occupant (both human and pets) information were obtained through a questionnaire filled out by the participants. The list of house variables included age and size of the house, number of bedrooms, presence of basement, carpeting, ventilation index, number of days with the windows open, use of insecticides and mould products, number of inhabitants, female : male ratio, number of smokers and vegetarians, number of pets (dogs, cats, birds) and number of house plants.
(b). Data analyses
All analyses were carried out in the R environment (www.r-project.org). We calculated pair-wise dissimilarities between communities using the Bray–Curtis dissimilarity metric, with dissimilarity matrices visualized via non-metric multidimensional scaling (NMDS). We used analysis of similarities (ANOSIM) based on 1000 permutations to test for differences in microbial community composition between indoor and outdoor samples [46]. ANOSIM's R statistic ranges from 0 (no group separation) to 1 (complete separation). To estimate the explanatory power of environmental and house variables on bacterial or fungal community composition, we used permutational multivariate analysis of variance (PERMANOVA) based on 1000 permutations [47]. In order to identify potential taxa indicative of specific source environments (i.e. soil, oceans, human skin, human/livestock faeces, plants and insects), we used indicator value analyses, which combines abundance and frequency of occurrence [48], as described in [38]. We also used indicator value analyses to detect phylotypes associated with indoors. Only phylotypes with an indicator value greater than 0.3 and p < 0.01 were considered significantly associated with the indoor environment. We used the R packages vegan (http://vegan.r-forge.r-project.org/), labdsv (http://ecology.msu.montana.edu/labdsv/R/) and ecodist (http://cran.r-project.org/web/packages/ecodist/) for multivariate statistics.
We used machine learning, in particular boosted regression trees (BRTs), to predict the probability of the presence of pets (i.e. dogs and cats) based on the abundance of indoor bacterial phylotypes. BRTs combine regression trees (i.e. models with recursive binary splits) and boosting algorithms (i.e. large number of simple models merged to optimize prediction). In addition, BRTs can fit nonlinear relationships and allow for missing data and outliers [49]. We used cross-validation to select the optimal number of trees with tree complexity set to 10, learning rate to 0.001, and bag fraction to 0.5. Based on the results of cross-validation, the number of trees was 4450 and 3900 for the presence of dogs model and for the presence of cats model, respectively. Models were trained with 70% of the samples and the remaining 30% were used to test the predictive performance. We used the R package gbm (https://github.com/gbm-developers/gbm) for BRTs.
3. Results and discussion
(a). Comparing indoor to outdoor microbial communities
From the more than 1100 homes for which we had paired dust samples collected from both inside and outside the home, we could directly compare the diversity and composition of the indoor and outdoor microbial communities. Not surprisingly, indoor communities were, on average, distinct from those found outdoors (figure 1). While individual indoor and outdoor dust samples all harboured diverse microbial communities with hundreds of unique bacterial and fungal taxa, the diversity of bacteria and fungi was on average approximately 50% higher for the indoor samples (Mann–Whitney test p < 0.001 for both; figure 1a). These differences in diversity levels are likely driven by two inter-related phenomena. First, many of the outdoor communities were dominated by a handful of microbial taxa, while the indoor communities had greater Shannon diversity (Mann–Whitney test p < 0.001 for both; figure 1b). For example, fungi in the Cladosporium and Toxicocladosporium genera were often very abundant in individual outdoor samples (15.8% and 11.7% of ITS sequences, respectively) as were bacteria in the Actinomycetales and Sphingomonadales orders (11.1% and 8.5% of 16S rRNA sequences, respectively). Second, the bacterial and fungal communities found inside homes were more diverse, because they included both the microbes found outside of homes as well as those taxa that are restricted to the inside of homes or likely to have originated from indoor sources.
Figure 1.

Differences in the richness, diversity and composition of indoor versus outdoor bacterial and fungal communities (panels a, b and c, respectively). (a,b) Differences in observed richness (number of phylotypes per sample) and diversity of phylotype distribution for the bacterial and fungal communities. (c) Differences in community composition for the bacterial and fungal communities using non-metric multidimensional scaling (ellipses represent 90% confidence intervals). In all panels, blue colours indicate those dust samples collected from inside homes, while yellow colours indicate dust samples collected from outside homes. (Online version in colour.)
In addition to the diversity differences, indoor and outdoor samples harboured distinct microbial communities (figure 1c). These differences were larger for bacteria (ANOSIM R = 0.34, p < 0.001) than for fungi (ANOSIM R = 0.29, p < 0.001), but in both cases these differences between indoor and outdoor communities could be attributed, in part, to certain taxa that were relatively more abundant and prevalent indoors than outdoors. For fungi, only 1.1% of taxa (763 out of 72 284 phylotypes) were relatively more abundant inside homes than outside homes. These findings are directly in line with previous work demonstrating that most fungi found inside buildings come from outside the home [16,34], and they suggest that there are unlikely to be many sources of fungi inside homes. However, examining the small subset of fungal phylotypes that were significantly more abundant inside homes than outside homes (electronic supplementary material, table S1) provides some insight into the possible sources of fungi within homes. These included well-known household moulds such as Aspergillus, Penicillium, Alternaria and Fusarium [50], and wood-degrading fungi such as Stereum, Trametes, Phlebia and Ganoderma that are likely wood colonizers [51]. We also find that fungi associated with human skin (including Candida and Trichosporon, [52]), and gastronomically relevant fungi (such as Saccharomyces, Pleurotus and Agaricus, [53]) were rare, but significantly more abundant inside homes than outside homes (electronic supplementary material, table S1).
As with the fungal communities, the bacterial communities found inside the home were also distinct from those found outside the home. Only 1.6% of the bacterial phylotypes (1994 out of 125 066) were significantly more abundant inside homes than outside homes but many of these taxa were quite frequent and, when encountered, relatively abundant (electronic supplementary material, table S1). Most notably, bacterial taxa that likely originate from the occupants of homes were relatively more abundant inside homes than outdoors. For example, bacteria likely associated with human skin (e.g. Staphylococcus, Streptococcus, Corynebacterium and Propionibacterium [52]), vaginas (e.g. Lactobacillus, Bifidobacterium and Lactococcus [54]) and faeces (e.g. Bacteroides, Faecalibacterium and Ruminococcus [55]) were far more abundant inside homes (electronic supplementary material, table S1). To quantify the relative importance of different environmental sources of bacteria to the indoor and outdoor dust samples, we compared the relative abundances of taxa indicative of different source environments using the approach described previously [38]. These analyses confirm that skin and faeces are more important sources of bacteria found in indoor dust compared to outdoor dust (figure 2). Furthermore, these analyses show that bacteria from non-human occupants, including those taxa commonly associated with insects, including household insects (e.g. Wolbachia, Buchnera, Rickettsia and Bartonella, [56]) were found to be relatively more abundant inside homes (figure 2).
Figure 2.

Differences in the proportional abundances of bacterial indicator taxa of potential source environments between indoor (blue) and outdoor (yellow) dust samples across the more than 1100 homes for which we had data from both indoor and outdoor dust samples. Vertical lines correspond to medians. (Online version in colour.)
Together these results highlight that we can use the relative abundances of bacterial and fungal taxa found inside homes to identify potential sources of these microbes within our homes, just as analyses of bacteria found in outdoor air can be used to identify how the sources of outdoor bacteria change over time [57] or across different geographical locations [37]. More generally, these results indicate that those bacteria and fungi living with us in our homes are not identical to those found outdoors and attempts to link microbes to human health outcomes (e.g. [12,13]) cannot rely exclusively on data collected from outside homes.
(b). Strong influence of the outdoor environment on indoor fungi
Given that 65% of fungal phylotypes found indoors were also found outdoors, it is not surprising that the overall composition of the indoor and outdoor fungal communities were highly correlated across the sampled homes (Mantel's ρ = 0.43, p < 0.001). The best predictor of indoor fungal communities is outdoor fungal community composition. Likewise, those factors that best predict the composition of fungi found in outdoor dust, particularly regional climatic conditions [38], are also those factors that best predict the composition of indoor fungal communities (electronic supplementary material, table S2) with environmental variables (particularly mean annual temperature and mean annual precipitation) explaining 14% of the variability in the composition of the fungal communities found in the indoor dust samples (by contrast, only 5% of the variability was explained by house characteristics; electronic supplementary material, table S2). The correlations with climate variables indicate that homes in different geographical regions of the US harbour distinct fungal communities indoors. More generally, homes located closer in geographical proximity tended to harbour more similar fungal communities (Mantel's ρ = 0.35, p < 0.001). Broad regional patterns are evident in figure 3a, where we see that homes in the eastern USA have distinct communities from those found in more western regions. These patterns are partially driven by homes in the eastern USA having higher relative abundances of Basidiomycota (particularly taxa in the class Agaricomycetes) while western homes have higher relative abundances of Ascomycota (specifically from the classes Dothideomycetes and Leotiomycetes). Taken together, these results highlight that the fungal taxa found inside homes are largely determined by the geographical location of the home (as already observed at the local scale; [34]), a finding that may explain strong regional differences in sensitivities to known fungal allergens [10]. Potential fungal allergens usually described in the literature [58] were abundant in indoor samples (on average they represented 31% of the total number of fungal sequences; figure 4). Geographical variability in the relative abundances of potential fungal allergens was driven by the individual distributions of the three most abundant allergenic genera (i.e. Alternaria, Aspergillus and Phoma; electronic supplementary material, figure S1), and these genera were concentrated along the regions of the Great Plains and the Great Lakes (due to Alternaria), the Northeast region (due to Aspergillus) and the state of Arizona (due to Phoma; figure 4 and electronic supplementary material, figure S1). We are careful to note that the species in these genera differ in their levels of allergenicity [8,58] and that linking the abundances of these putative fungal allergens found in household dust to rates of allergic diseases is non-trivial but worthy of additional study.
Figure 3.
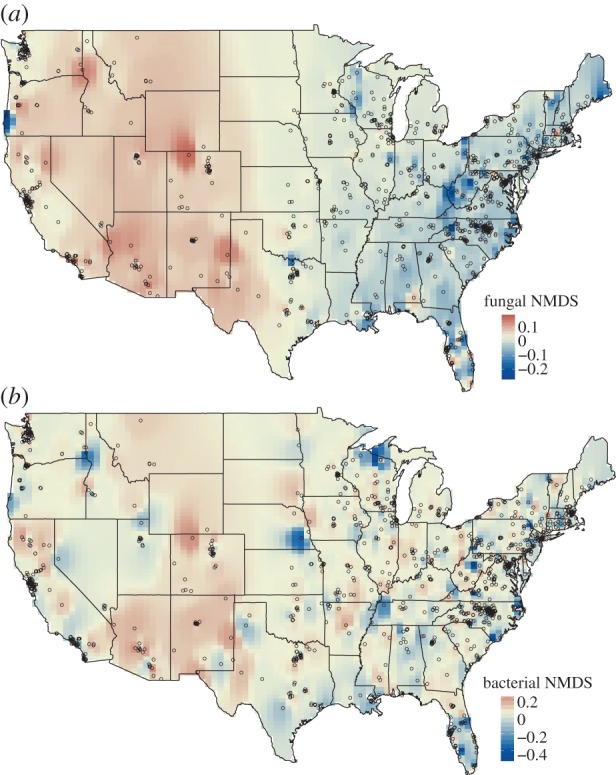
Maps of community similarity (NMDS axis scores) for fungal (a) and bacterial communities (b) found in the indoor dust samples. NMDS axis scores were mapped by inverse distance weighting interpolation on 100 × 100 grid cells. Similar colours indicate microbial communities that are more similar in overall community composition. Points represent sampling locations. (Online version in colour.)
Figure 4.

Relative abundance of potential allergenic genera of fungi in dust samples collected from inside homes (a), map of the relative abundance of potential fungal allergens (interpolated using inverse distance weighting on 100 × 100 grid cells; b), and the distribution of total relative abundances of potential fungal allergens across the indoor dust samples (c). Points in (b) represent sampling locations. (Online version in colour.)
Owing to the strong influence of those fungi coming from outside the house on indoor fungal communities, we re-ran the analyses just focusing on the 1.1% of fungal phylotypes that were consistently more abundant inside homes than outside homes. By focusing on just this subset, we hoped to better understand how conditions within homes may alter those fungi that are preferentially found within homes. The fungi that were more common in homes were influenced by a relatively small number of indoor variables with the presence of a basement, the age of the home and the presence of dogs having weak, but significant, effects on the relative abundances of these fungal taxa (electronic supplementary material, table S2). Since these effects are far weaker than the effects of outdoor variables or geographical locations (electronic supplementary material, table S2), we conclude that the geographic allocation of the home, not the house or occupant characteristics measured here, is the best predictor of what types of fungi will be found in a given home.
(c). Home occupants structure indoor bacterial communities
Just as for fungi, the composition of the bacterial communities found in indoor dust were significantly correlated with the composition of the bacterial communities found in outdoor dust from the same home (Mantel's ρ = 0.28, p < 0.001). However, there were larger differences between indoor and outdoor bacterial communities with many of the bacterial taxa found indoors likely coming from occupants (as mentioned above). While an important portion of the variation among homes in fungal community composition was associated with geographical location and climatic variables, this was not the case for the bacterial communities (only 6% of the variability was explained by environmental variables; electronic supplementary material, table S2). Likewise, geographical location was not a good predictor of the types of bacterial communities found in a given home and, although geographical distance was significantly correlated with bacterial community dissimilarity, the relationship was far weaker than for fungi (Mantel's ρ = 0.09, p < 0.001). Unlike the maps showing clear geographical gradients in fungal communities inside homes across the USA (figure 3a)—the corresponding maps for bacterial communities showed no clear regional patterns (figure 3b). Homes located far apart, for example one in California and one in North Carolina, do not necessarily harbour more distinct bacterial communities than homes located in the same state.
Our analyses focusing on the 1.6% of bacterial phylotypes that were consistently more abundant inside homes than outside homes suggest that the occupants of the homes play a significant role in determining the types of bacterial communities found indoors (electronic supplementary material, table S2). In particular, whether a home had dogs was the most important predictor of the relative abundances of those bacteria preferentially found within homes (electronic supplementary material, table S2). This effect of dogs on indoor bacterial communities has been noted previously [3,20,22] with some work suggesting that these bacterial differences are associated with human health outcomes [21]. To the best of our knowledge, this is the first study to demonstrate that cats can also influence the types of bacteria found in household dust or on household surfaces.
We identified 56 and 24 bacterial genera that were significantly more abundant in homes with dogs or cats, respectively, a subset of which are shown in figure 5, including members of the Prevotella, Porphyromonas, Moraxella and Bacteroides genera. These bacterial taxa have previously been shown to be common in the mouths or faeces of dogs and cats [59,60], suggesting that the pet effect on bacterial communities is in part caused by these pets directly shedding these bacterial taxa from their bodies into our home environment. We then used a machine learning approach (BRTs) focusing on indoor ‘indicator’ taxa to determine whether we could use the relative abundances of these bacterial phylotypes to predict which homes have dogs or cats in them (electronic supplementary material, figure S2). When we tested the predictive performance of these models, we found that we could predict, just from the indoor bacterial phylotypes alone, whether a home has a dog or cat in it with 92% and 83% accuracy, respectively, highlighting the predictable influence that our pets have on the bacterial communities found in household dust.
Figure 5.

Differences in the proportion of bacterial indoor genera (Mann–Whitney test p < 0.01 after false discovery rate correction) between homes with or without dogs (a), and between homes with or without cats (b). (c) Differences in the proportion of bacterial indoor genera (Spearman's rank correlation p < 0.01 after false discovery rate correction) between homes with more females than males (female : male ratio > 0.5) and homes with more males than females (female : male < 0.5). (Online version in colour.)
We also found that the number of inhabitants and the female : male ratio of human occupants in the home predicted, albeit weakly, the relative abundances of those bacteria preferentially found within homes (electronic supplementary material, table S2). While the female : male effect was subtle and only 6% of homes had no women living in them (we had no homes with only women), we could still identify those bacterial taxa that are more common in homes with more women versus homes with less women. Interestingly, we found that Corynebacterium and Dermabacter (both skin-associated taxa, [52]) and Roseburia (faecal-associated, [55]) were relatively more abundant in homes with fewer women (figure 5c). This pattern is probably driven by differences between the skin biology (and perhaps to body size and hygiene practices) of men and women. In particular, it has been shown that men shed more bacteria into their surrounding environment than women [61,62], and also that Corynebacterium is relatively more abundant on men's skin than on women's skin [63]. In turn, Lactobacillus was relatively more abundant in homes with women than in homes without women (figure 5c). While there are a wide range of potential sources of Lactobacillus, we hypothesize that members of this particular genus are vaginally associated given that this taxon contains important members of the vaginal microbiome [54]. Members of the Lactobacillus genus have been reported to be protective against allergies and asthma [13,14]. Although additional sampling of residences is required to confirm whether these patterns are generally observed across homes, our results do demonstrate that we may be able to use information on the bacteria found in household dust to identify the sex of occupants—a finding that could be useful for forensic applications.
4. Conclusion
We show that the types of bacteria and fungi found in the settled dust collected from inside homes are, to some degree, predictable. Most of the fungi found in homes come from outside the homes with the indoor dust fungal communities varying predictably across climate and geographical regions. By contrast, the composition of the bacterial communities found in indoor dust was not predictable from the house location and was more strongly influenced by the number and types of occupants living in the homes. In particular, whether a house had dogs or cats had a significant influence on the types of bacteria we live within our homes. If you want to change the types of fungi you are exposed to in your home, then it is best to move to a different home (preferably one far away). If you want to change your bacterial exposures, then you just have to change who you live with in your home.
Supplementary Material
Acknowledgements
We thank the volunteers who participated in the Wild Life of Our Homes project for collecting dust samples.
Ethics
Enrolled participants were provided a written informed consent form approved by the North Carolina State University's Human Research Committee (Approval No. 2177) as well as instructions for sampling their home and a sampling kit.
Data accessibility
Data from this project can be freely accessed and downloaded from http://figshare.com/articles/1000homes/1270900 and from http://qiita.microbio.me/study/description/10269.
Authors' contributions
This study was originally conceived by R.R.D., N.F., S.L.M. and H.L.M. Sample collection was coordinated by H.L.M. and R.R.D. with the laboratory analyses coordinated by J.B.H. and N.F. Data processing and statistical analyses were conducted by A.B., B.J.R., K.P., E.B.L., J.M.M. and J.W.L. This manuscript was primarily written by A.B., N.F. and R.R.D. with these three individuals contributing equally to the writing process.
Competing interests
We declare we have no competing interests.
Funding
This work was supported by a grant from the A. P. Sloan Microbiology of the Built Environment Program (to N.F. and R.R.D.), with additional support from the US National Science Foundation (DEB0953331 to N.F.) and the Personal Genomes Project (to R.R.D.). A.B. was supported by a James S. McDonnell Postdoctoral Fellowship.
References
- 1.Qian J, Hospodsky D, Yamamoto N, Nazaroff WW, Peccia J. 2012. Size-resolved emission rates of airborne bacteria and fungi in an occupied classroom. Indoor Air 22, 339–351. ( 10.1111/j.1600-0668.2012.00769.x) [DOI] [PMC free article] [PubMed] [Google Scholar]
- 2.Adams RI, Miletto M, Taylor JW, Bruns TD. 2013. The diversity and distribution of fungi on residential surfaces. PLoS ONE 8, e78866 ( 10.1371/journal.pone.0078866) [DOI] [PMC free article] [PubMed] [Google Scholar]
- 3.Dunn R, Fierer N, Henley J, Leff J, Menninger H. 2013. Home life: factors structuring the bacterial diversity found within and between homes. PLoS ONE 8, e64133 ( 10.1371/journal.pone.0064133) [DOI] [PMC free article] [PubMed] [Google Scholar]
- 4.Prussin AJ, Garcia EB, Marr LC. 2015. Total concentrations of virus and bacteria in indoor and outdoor air. Environ. Sci. Technol. Lett. 2, 84–88. ( 10.1021/acs.estlett.5b00050) [DOI] [PMC free article] [PubMed] [Google Scholar]
- 5.Klepeis NE, Nelson WC, Ott WR, Robinson JP, Tsang AM, Switzer P, Behar JV, Hern SC, Engelmann WH. 2001. The National Human Activity Pattern Survey (NHAPS): a resource for assessing exposure to environmental pollutants. J. Expo. Anal. Environ. Epidemiol. 11, 231–252. ( 10.1038/sj.jea.7500165) [DOI] [PubMed] [Google Scholar]
- 6.Ludden C, Cormican M, Austin B, Morris D. 2013. Rapid environmental contamination of a new nursing home with antimicrobial-resistant organisms preceding occupation by residents. J. Hosp. Infect. 83, 327–329. ( 10.1016/j.jhin.2012.11.023) [DOI] [PubMed] [Google Scholar]
- 7.Flood CA. 1931. Observations on sensitivity to dust fungi in patients with asthma. J. Am. Med. Assoc. 96, 2094 ( 10.1001/jama.1931.02720510014004) [DOI] [Google Scholar]
- 8.Pope AM, Patterson R, Burge H (eds). 1993. Indoor allergens: assessing and controlling adverse health effects. Washington, DC: National Academy Press. [PubMed] [Google Scholar]
- 9.Douwes J, Thorne P, Pearce N, Heederik D. 2003. Bioaerosol health effects and exposure assessment: progress and prospects. Ann. Occup. Hyg. 47, 187–200. ( 10.1093/annhyg/meg032) [DOI] [PubMed] [Google Scholar]
- 10.Salo PM, Arbes SJ, Sever M, Jaramillo R, Cohn RD, London SJ, Zeldin DC. 2006. Exposure to Alternaria alternata in US homes is associated with asthma symptoms. J. Allergy Clin. Immunol. 118, 892–898. ( 10.1016/j.jaci.2006.07.037) [DOI] [PMC free article] [PubMed] [Google Scholar]
- 11.Strachan D. 1989. Hay fever, hygiene, and household size. Br. Med. J. 299, 1259–1260. ( 10.1136/bmj.299.6710.1259) [DOI] [PMC free article] [PubMed] [Google Scholar]
- 12.Hanski I, et al. 2012. Environmental biodiversity, human microbiota, and allergy are interrelated. Proc. Natl Acad. Sci. USA 109, 8334–8339. ( 10.1073/pnas.1205624109) [DOI] [PMC free article] [PubMed] [Google Scholar]
- 13.Ege MJ, et al. 2011. Exposure to environmental microorganisms and childhood asthma. N. Engl. J. Med. 364, 701–709. ( 10.1056/NEJMoa1007302) [DOI] [PubMed] [Google Scholar]
- 14.Fujimura KE, et al. 2014. House dust exposure mediates gut microbiome Lactobacillus enrichment and airway immune defense against allergens and virus infection. Proc. Natl Acad. Sci. USA 111, 805–810. ( 10.1073/pnas.1310750111) [DOI] [PMC free article] [PubMed] [Google Scholar]
- 15.Rook GA. 2013. Regulation of the immune system by biodiversity from the natural environment: an ecosystem service essential to health. Proc. Natl Acad. Sci. USA 110, 18 360–18 367. ( 10.1073/pnas.1313731110) [DOI] [PMC free article] [PubMed] [Google Scholar]
- 16.Shelton BG, Kirkland KH, Flanders WD, Morris GK. 2002. Profiles of airborne fungi in buildings and outdoor environments in the United States. Appl. Environ. Microbiol. 68, 1743–1753. ( 10.1128/AEM.68.4.1743-1753.2002) [DOI] [PMC free article] [PubMed] [Google Scholar]
- 17.Rintala H, Pitkäranta M, Toivola M, Paulin L, Nevalainen A. 2008. Diversity and seasonal dynamics of bacterial community in indoor environment. BMC Microbiol. 8, 56 ( 10.1186/1471-2180-8-56) [DOI] [PMC free article] [PubMed] [Google Scholar]
- 18.Täubel M, Rintala H, Pitkäranta M, Paulin L, Laitinen S, Pekkanen J, Hyvärinen A, Nevalainen A. 2009. The occupant as a source of house dust bacteria. J. Allergy Clin. Immunol. 124, 834–840.e47. ( 10.1016/j.jaci.2009.07.045) [DOI] [PubMed] [Google Scholar]
- 19.Lax S, et al. 2014. Longitudinal analysis of microbial interaction between humans and the indoor environment. Science 345, 1048–1052. ( 10.1126/science.1254529) [DOI] [PMC free article] [PubMed] [Google Scholar]
- 20.Dannemiller KC, Gent JF, Leaderer BP, Peccia J. In press. Influence of housing characteristics on bacterial and fungal communities in homes of asthmatic children. Indoor Air. ( 10.1111/ina.12205) [DOI] [PMC free article] [PubMed] [Google Scholar]
- 21.Fujimura KE, et al. 2010. Man's best friend? The effect of pet ownership on house dust microbial communities. J. Allergy Clin. Immunol. 126, 410–412.e13. ( 10.1016/j.jaci.2010.05.042) [DOI] [PMC free article] [PubMed] [Google Scholar]
- 22.Kettleson EM, Adhikari A, Vesper S, Coombs K, Indugula R, Reponen T. 2015. Key determinants of the fungal and bacterial microbiomes in homes. Environ. Res. 138, 130–135. ( 10.1016/j.envres.2015.02.003) [DOI] [PMC free article] [PubMed] [Google Scholar]
- 23.Gliniewicz A, Czajka E, Laudy AE, Kochman M, Grzegorzak K, Ziółkowska K, Sawicka B, Stypulkowska-Misiurewicz H, Pancer K. 2003. German cockroaches (Blattella germanica L.) as a potential source of pathogens causing nosocomial infections. Indoor Built Environ. 12, 55–60. ( 10.1177/1420326X03012001009) [DOI] [Google Scholar]
- 24.Kodama AM, McGee RI. 2010. Airborne microbial contaminants in indoor environments. Naturally ventilated and air-conditioned homes. Arch. Environ. Health 41, 306–311. ( 10.1080/00039896.1986.9936702) [DOI] [PubMed] [Google Scholar]
- 25.Amend AS, Seifert KA, Samson R, Bruns TD. 2010. Indoor fungal composition is geographically patterned and more diverse in temperate zones than in the tropics. Proc. Natl Acad. Sci. USA 107, 13 748–13 753. ( 10.1073/pnas.1000454107) [DOI] [PMC free article] [PubMed] [Google Scholar]
- 26.Kembel SW, Jones E, Kline J, Northcutt D, Stenson J, Womack AM, Bohannan BJ, Brown GZ, Green JL. 2012. Architectural design influences the diversity and structure of the built environment microbiome. ISME J. 6, 1469–1479. ( 10.1038/ismej.2011.211) [DOI] [PMC free article] [PubMed] [Google Scholar]
- 27.Adams RI, Miletto M, Lindow SE, Taylor JW, Bruns TD. 2014. Airborne bacterial communities in residences: similarities and differences with fungi. PLoS ONE 9, e91283 ( 10.1371/journal.pone.0091283) [DOI] [PMC free article] [PubMed] [Google Scholar]
- 28.Meadow JF, et al. 2014. Indoor airborne bacterial communities are influenced by ventilation, occupancy, and outdoor air source. Indoor Air 24, 41–48. ( 10.1111/ina.12047) [DOI] [PMC free article] [PubMed] [Google Scholar]
- 29.Emerson JB, Keady PB, Brewer TE, Clements N, Morgan EE, Awerbuch J, Miller SL, Fierer N. 2015. Impacts of flood damage on airborne bacteria and fungi in homes after the 2013 Colorado Front Range flood. Environ. Sci. Technol. 49, 2675–2684. ( 10.1021/es503845j) [DOI] [PubMed] [Google Scholar]
- 30.MacArthur RH. 1972. Geographical ecology: patterns in the distribution of species. New York, NY: Harper & Rowe Publishers. [Google Scholar]
- 31.Peay KG, Schubert MG, Nguyen NH, Bruns TD. 2012. Measuring ectomycorrhizal fungal dispersal: macroecological patterns driven by microscopic propagules. Mol. Ecol. 21, 4122–4136. ( 10.1111/j.1365-294X.2012.05666.x) [DOI] [PubMed] [Google Scholar]
- 32.Grantham NS, et al. 2015. Fungi identify the geographic origin of dust samples. PLoS ONE 10, e0122605 ( 10.1371/journal.pone.0122605) [DOI] [PMC free article] [PubMed] [Google Scholar]
- 33.Martin LJ, et al. 2015. Evolution of the indoor biome. Trends Ecol. Evol. 30, 223–232. ( 10.1016/j.tree.2015.02.001) [DOI] [PubMed] [Google Scholar]
- 34.Adams RI, Miletto M, Taylor JW, Bruns TD. 2013. Dispersal in microbes: fungi in indoor air are dominated by outdoor air and show dispersal limitation at short distances. ISME J. 7, 1262–1273. ( 10.1038/ismej.2013.28) [DOI] [PMC free article] [PubMed] [Google Scholar]
- 35.Thatcher T. 1995. Deposition, resuspension, and penetration of particles within a residence. Atmos. Environ. 29, 1487–1497. ( 10.1016/1352-2310(95)00016-R) [DOI] [Google Scholar]
- 36.Baek S-O, Kim Y-S, Perry R. 1997. Indoor air quality in homes, offices and restaurants in Korean urban areas—indoor/outdoor relationships. Atmos. Environ. 31, 529–544. ( 10.1016/S1352-2310(96)00215-4) [DOI] [Google Scholar]
- 37.Bowers RM, McLetchie S, Knight R, Fierer N. 2011. Spatial variability in airborne bacterial communities across land-use types and their relationship to the bacterial communities of potential source environments. ISME J. 5, 601–612. ( 10.1038/ismej.2010.167) [DOI] [PMC free article] [PubMed] [Google Scholar]
- 38.Barberán A, Ladau J, Leff JW, Pollard KS, Menninger HL, Dunn RR, Fierer N. 2015. Continental-scale distributions of dust-associated bacteria and fungi. Proc. Natl Acad. Sci. USA 112, 5756–5761. ( 10.1073/pnas.1420815112) [DOI] [PMC free article] [PubMed] [Google Scholar]
- 39.Flores G, Henley J, Fierer N. 2012. A direct PCR approach to accelerate analyses of human-associated microbial communities. PLoS ONE 7, e44563 ( 10.1371/journal.pone.0044563) [DOI] [PMC free article] [PubMed] [Google Scholar]
- 40.Caporaso JG, et al. 2012. Ultra-high-throughput microbial community analysis on the Illumina HiSeq and MiSeq platforms. ISME J. 6, 1621–1624. ( 10.1038/ismej.2012.8) [DOI] [PMC free article] [PubMed] [Google Scholar]
- 41.Edgar RC. 2013. UPARSE: highly accurate OTU sequences from microbial amplicon reads. Nat. Methods 10, 996–998. ( 10.1038/nmeth.2604) [DOI] [PubMed] [Google Scholar]
- 42.Wang Q, Garrity GM, Tiedje JM, Cole JR. 2007. Naive Bayesian classifier for rapid assignment of rRNA sequences into the new bacterial taxonomy. Appl. Environ. Microbiol. 73, 5261–5267. ( 10.1128/AEM.00062-07) [DOI] [PMC free article] [PubMed] [Google Scholar]
- 43.McDonald D, Price MN, Goodrich J, Nawrocki EP, DeSantis TZ, Probst A, Andersen GL, Knight R, Hugenholtz P. 2012. An improved Greengenes taxonomy with explicit ranks for ecological and evolutionary analyses of Bacteria and Archaea. ISME J. 6, 610–618. ( 10.1038/ismej.2011.139) [DOI] [PMC free article] [PubMed] [Google Scholar]
- 44.Abarenkov K, et al. 2010. The UNITE database for molecular identification of fungi--recent updates and future perspectives. New Phytol. 186, 281–285. ( 10.1111/j.1469-8137.2009.03160.x) [DOI] [PubMed] [Google Scholar]
- 45.Paulson JN, Stine OC, Bravo HC, Pop M. 2013. Differential abundance analysis for microbial marker-gene surveys. Nat. Methods 10, 1200–1202. ( 10.1038/nmeth.2658) [DOI] [PMC free article] [PubMed] [Google Scholar]
- 46.Clarke KR. 1993. Non-parametric multivariate analyses of changes in community structure. Austral Ecol. 18, 117–143. ( 10.1111/j.1442-9993.1993.tb00438.x) [DOI] [Google Scholar]
- 47.Anderson MJ. 2001. A new method for non-parametric multivariate analysis of variance. Austral Ecol. 26, 32–46. ( 10.1111/j.1442-9993.2001.01070.pp.x) [DOI] [Google Scholar]
- 48.Dufrêne M, Legendre P. 1997. Species assemblages and indicator species: the need for a flexible asymmetrical approach. Ecol. Monogr. 67, 345–366. ( 10.1890/0012-9615%281997%29067%5B0345%3ASAAIST%5D2.0.CO%3B2) [DOI] [Google Scholar]
- 49.Elith J, Leathwick JR, Hastie T. 2008. A working guide to boosted regression trees. J. Anim. Ecol. 77, 802–813. ( 10.1111/j.1365-2656.2008.01390.x) [DOI] [PubMed] [Google Scholar]
- 50.Bloom E, Grimsley LF, Pehrson C, Lewis J, Larsson L. 2009. Molds and mycotoxins in dust from water-damaged homes in New Orleans after hurricane Katrina. Indoor Air 19, 153–158. ( 10.1111/j.1600-0668.2008.00574.x) [DOI] [PubMed] [Google Scholar]
- 51.Schmidt O. 2006. Wood and tree fungi. Heidelberg, Germany: Springer. [Google Scholar]
- 52.Grice EA, Segre JA. 2011. The skin microbiome. Nat. Rev. Microbiol. 9, 244–253. ( 10.1038/nrmicro2537) [DOI] [PMC free article] [PubMed] [Google Scholar]
- 53.Moon B, Lo YM. 2014. Conventional and novel applications of edible mushrooms in today's food industry. J. Food Process. Preserv. 38, 2146–2153. ( 10.1111/jfpp.12185) [DOI] [Google Scholar]
- 54.Ravel J, et al. 2011. Vaginal microbiome of reproductive-age women. Proc. Natl Acad. Sci. USA 108(Suppl. 1) 4680–4687. ( 10.1073/pnas.1002611107) [DOI] [PMC free article] [PubMed] [Google Scholar]
- 55.Walter J, Ley R. 2011. The human gut microbiome: ecology and recent evolutionary changes. Annu. Rev. Microbiol. 65, 411–429. ( 10.1146/annurev-micro-090110-102830) [DOI] [PubMed] [Google Scholar]
- 56.Engel P, Moran NA. 2013. The gut microbiota of insects—diversity in structure and function. FEMS Microbiol. Rev. 37, 699–735. ( 10.1111/1574-6976.12025) [DOI] [PubMed] [Google Scholar]
- 57.Bowers RM, Clements N, Emerson JB, Wiedinmyer C, Hannigan MP, Fierer N. 2013. Seasonal variability in bacterial and fungal diversity of the near-surface atmosphere. Environ. Sci. Technol. 47, 12 097–12 106. ( 10.1021/es402970s) [DOI] [PubMed] [Google Scholar]
- 58.Esch RE, Hartsell CJ, Crenshaw R, Jacobson RS. 2001. Common allergenic pollens, fungi, animals, and arthropods. Clin. Rev. Allergy Immunol. 21, 261–292. ( 10.1385/CRIAI:21:2-3:261) [DOI] [PubMed] [Google Scholar]
- 59.Ritchie LE, Steiner JM, Suchodolski JS. 2008. Assessment of microbial diversity along the feline intestinal tract using 16S rRNA gene analysis. FEMS Microbiol. Ecol. 66, 590–598. ( 10.1111/j.1574-6941.2008.00609.x) [DOI] [PubMed] [Google Scholar]
- 60.Middelbos IS, Vester Boler BM, Qu A, White BA, Swanson KS, Fahey GC. 2010. Phylogenetic characterization of fecal microbial communities of dogs fed diets with or without supplemental dietary fiber using 454 pyrosequencing. PLoS ONE 5, e9768 ( 10.1371/journal.pone.0009768) [DOI] [PMC free article] [PubMed] [Google Scholar]
- 61.Noble WC, Habbema JDF, Van Furth R, Smith I, De Raay C. 1976. Quantitative studies on the dispersal of skin bacteria into the air. J. Med. Microbiol. 9, 53–61. ( 10.1099/00222615-9-1-53) [DOI] [PubMed] [Google Scholar]
- 62.Hewitt KM, Gerba CP, Maxwell SL, Kelley ST. 2012. Office space bacterial abundance and diversity in three metropolitan areas. PLoS ONE 7, e37849 ( 10.1371/journal.pone.0037849) [DOI] [PMC free article] [PubMed] [Google Scholar]
- 63.Fierer N, Hamady M, Lauber CL, Knight R. 2008. The influence of sex, handedness, and washing on the diversity of hand surface bacteria. Proc. Natl Acad. Sci. USA 105, 17 994–17 999. ( 10.1073/pnas.0807920105) [DOI] [PMC free article] [PubMed] [Google Scholar]
Associated Data
This section collects any data citations, data availability statements, or supplementary materials included in this article.
Supplementary Materials
Data Availability Statement
Data from this project can be freely accessed and downloaded from http://figshare.com/articles/1000homes/1270900 and from http://qiita.microbio.me/study/description/10269.