

Abstract
Pendrin (Slc26a4) is a Cl−/HCO3− exchanger expressed in renal intercalated cells and mediates renal Cl− absorption. With pendrin gene ablation, blood pressure and vascular volume fall, which increases plasma renin concentration. However, serum aldosterone does not significantly increase in pendrin-null mice, suggesting that pendrin regulates adrenal zona glomerulosa aldosterone production. Therefore, we examined pendrin expression in the adrenal gland using PCR, immunoblots, and immunohistochemistry. Pendrin protein was detected in adrenal lysates from wild-type but not pendrin-null mice. However, immunohistochemistry and qPCR of microdissected adrenal zones showed that pendrin was expressed in the adrenal medulla, rather than in cortex. Within the adrenal medulla, pendrin localizes to both epinephrine- and norepinephrine-producing chromaffin cells. Therefore, we examined plasma catecholamine concentration and blood pressure in wild-type and pendrin-null mice under basal conditions and then after 5 and 20 min of immobilization stress. Under basal conditions, blood pressure was lower in the mutant than in the wild-type mice, although epinephrine and norepinephrine concentrations were similar. Catecholamine concentration and blood pressure increased markedly in both groups with stress. With 20 min of immobilization stress, epinephrine and norepinephrine concentrations increased more in pendrin-null than in wild-type mice, although stress produced a similar increase in blood pressure in both groups. We conclude that pendrin is expressed in the adrenal medulla, where it blunts stress-induced catecholamine release.
Keywords: pendrin, chloride, epinephrine, norepinephrine, dopamine
pendrin, encoded by Slc26a4, is an aldosterone-sensitive, electroneutral, Na+-independent Cl−/HCO3− exchanger, expressed in the apical regions of type B and Non-A, non-B intercalated cells (2, 15, 29, 32, 41, 42), which are minority cell types found within the renal cortex. Aldosterone increases pendrin-mediated Cl− absorption and HCO3− secretion, which contributes to the pressor response that follows steroid hormone administration (39). During dietary NaCl restriction, pendrin-null (Slc26a−/−, Pds−/−) mice excrete more Na+ and Cl− and have lower blood pressure than wild-type mice (16, 40). As such, pendrin gene ablation reduces blood pressure (16, 23) due to the fall in circulating vascular volume, which follows the limited ability of these mutant mice to fully conserve urinary Na+ and Cl−.
Plasma renin concentration increases with pendrin gene ablation (16, 40), as expected when circulating vascular volume and blood pressure fall. However, pendrin gene ablation does not increase circulating aldosterone in proportion to the increase in circulating plasma renin concentration (16, 40, 42). The fall in the ratio of aldosterone to renin observed with pendrin gene ablation suggests that the adrenal zona glomerulosa of these mutant mice has a lower sensitivity to angiotensin II and thereby synthesizes less aldosterone in response to this peptide hormone. These data raise the possibility that pendrin is expressed in the adrenal cortex and has a role in modulating adrenal glomerulosa cell responsiveness. The aim of this study was to determine whether pendrin is expressed in the adrenal gland and whether it modulates adrenal function. The results show that pendrin is expressed in the adrenal gland but unexpectedly localizes to the adrenal medulla rather than the adrenal cortex, where it plays a role in restraining catecholamine production during stress.
METHODS
Animal Treatment
Animal and animal procedures.
Wild-type and pendrin-null mice (10) on a 129 S6SvEvTac background were bred in the Emory University vivarium. In all experiments, age- and sex-matched mice were compared. Unless otherwise stated, mice received a balanced NaCl-replete diet given as a gel (0.8 meq/day NaCl) (39) for 3 days prior to and during the experimental period. Male Sprague-Dawley rats, weighing 100–200 g, were purchased from Harlan.
Blood pressure measurements.
Blood pressure was measured in conscious mice by telemetry before, during, and after immobilization stress, using methods we have reported previously (16, 23). Mean arterial pressure (MAP) was calculated from the systolic and diastolic pressures, using the relationship (systolic + 2× diastolic)/3.
Treatment Models
Treatment 1: effect of NaCl intake on mouse renal and adrenal pendrin protein abundance.
For 7 days prior to their being euthanized, mice were ration-fed a gelled diet (27.0% sodium-deficient Harlan TD 90228 rodent chow, 72.1% water, 0.75% agar), which gave 0.03 meq/day NaCl. Mice received the gel diet alone or supplemented with NaCl to give 1.4 meq/day NaCl.
Treatment 2: effect of KCl intake on mouse renal and adrenal pendrin protein abundance.
For 7 days prior to their being euthanized, mice were ration-fed a gelled diet (27.0% Harlan TD 90228 rodent chow, 72.1% water, 0.75% agar, 1.2% Equal sweetener) supplemented with NaCl and KCl to give (in meq/day) 0.33 Na+, 0.37 Cl−, and 0.67 K+ (control) or 0.33 Na+, 4.07 Cl−, and 4.36 K+ (high KCl).
Treatment 3: effect of KHCO3 intake on mouse renal and adrenal pendrin protein abundance.
For 7 days prior to their being euthanized, mice were ration-fed a gelled diet (27.0% Harlan TD 90228 rodent chow, 72.1% water, 0.75% agar, 1.2% Equal sweetener) supplemented with NaCl and KHCO3 to give (in meq/day) 0.33 Na+, 0.37 Cl−, and 0.67 K+ (control) or 0.33 Na+, 0.37 Cl−, and 4.36 K+ (high KHCO3).
Treatment 4: pendrin immunostaining in rat adrenal gland following a NaCl-deficient diet.
Male Sprague-Dawley rats (100–200 g) were fed the NaCl-deficient diet as pellets (Harlan TD 90228 rodent chow) and drank water ad libitum for 1 wk and were then euthanized and perfusion- fixed in situ.
Treatment 5: effect of pendrin gene ablation on adrenal tyrosine hydroxylase abundance.
For 7 days prior to their being euthanized, wild-type and pendrin-null mice were ration-fed a gelled diet (27.0% Zeigler Brother's rodent chow #53881300, 72.1% water, 0.75% agar), supplemented with NaCl to give mice 0.8 meq/day NaCl.
Placement of Chronic Indwelling Catheters in the Jugular Vein and Blood Collection Before and After Immobilization Stress
Mice were anesthetized with 1–2.5% isoflurane/100% O2 and placed on a heating pad in the supine position. The hair over the neck was shaved and then swabbed with betadine (povidone iodine) alternating with 70% alcohol and then draped with sterile towels. Under a stereomicroscope, a 6- to 8-mm incision was made to expose ∼5 mm of the right external jugular vein, which was freed from the surrounding tissue by blunt dissection. Two silk 3-0 sutures were placed underneath the vein. The cephalic suture was tied around the vein to interrupt blood flow, whereas the caudal suture remained untied. The beveled tip of a 2-Fr silicone catheter (Dow corning CN 508-001) connected to PE-10 tubing was inserted into the jugular vein through an incision made between the two ligatures and then advanced 0.7 to 1 cm until the tip reached the right atrium. Catheter placement was confirmed by blood return through the catheter. If blood withdrawal was poor, the catheter was repositioned. Blood was returned in warm, sterile, heparinized saline (30 U/ml heparin). The caudal suture was tied around the cannulated vein to secure the catheter. The mouse was then repositioned on its right side, and a sharpened stainless steel guide cannula (18-G, 1.2 × 40 mm) was tunneled subcutaneously to the nape of the neck and pushed through the skin behind the ears. The catheter was then rapidly detached from the syringe, fitted through the guide cannula, exteriorized at the other end, and secured with an additional suture. The mouse was returned to the supine position. Cefazolin (20 mg/kg body wt sc) was given 2 h before and immediately after (30 U/ml) catheter insertion and then locked. The syringe was detached, and the exteriorized tubing was cut ∼1.5 cm from the skin and bent at a 180° angle. Silicone rubber tubing was slipped over the crimp to prevent air entry. The incision was closed with tissue adhesive (Vetbond, no. 1469; 3M Animal Care Products) and swabbed with betadine (povidone iodine). Over the next 2–3 days, the mouse was allowed to recover. Catheters were flushed daily with heparinized saline and then locked with heparinized saline (30 U/ml) containing cefazolin (4 mg/ml). To perform blood collections, the catheter was connected to 25 cm of polyurethane tubing (PU-033, SAI USA) that was passed through the lid of the cage and connected to a 1-ml syringe filled with sterile, heparinized saline. For the hour prior to blood sampling, the mouse was undisturbed. A 130- to 150-μl basal blood sample was taken while disturbance of the mouse was minimized. To generate an acute stress response, the mouse was removed from the cage and placed on a board in the prone position and immobilized with paper adhesive tape (immobilization stress). Blood samples (130–150 μl) were then taken after 5 and 20 min of immobilization stress and the mouse was then euthanized. After each blood collection, the mouse was slowly infused with 130–150 μl of normal saline warmed to 37°C. Blood was collected in EDTA-coated tubes (Microtainer CN #365973) containing 0.1% sodium metabisulfite and centrifuged at 2,000 g for 15 min. The resulting plasma was stored at −80°C until assayed.
Immunoblot Analysis
Immunoblots were performed of kidney and adrenal lysates, similar to methods reported previously (16, 19). One kidney and both adrenal glands were harvested from each mouse and placed in an ice-cooled buffer (0.3 M sucrose, 25 mM imidazole, pH 7.2, containing 1× Roche Complete Protease Inhibitor Cocktail). Tissue was immediately homogenized using an Omni THQ Tissue Homogenizer (Omni International) and then centrifuged at 1,000 g for 15 min at 4°C. Total protein was measured in the supernatant using the DC Protein Assay Kit (Bio-Rad, Hercules, CA) and then dissolved in Laemmli buffer. Aliquots containing equal amounts of protein were separated by SDS-PAGE on 8.5% acrylamide gels and then electroblotted to PVDF membranes (Immobilon; Millipore, Bedford, MA). Blots were blocked with Odyssey Blocking Buffer (LI-COR Biosciences) following the manufacturer's instructions and then incubated with primary antibody overnight at 4°C followed by incubation for 2 h at room temperature with Alexa fluor 680-linked anti-rabbit IgG (Molecular Probes). Pendrin protein was detected using a rabbit anti-rat pendrin antibody described previously (20). Tyrosine hydroxylase was detected using a rabbit anti-rat tyrosine hydroxylase antibody (Abcam, Cambridge, MA #ab112). In some experiments, equal protein loading and transfer were confirmed by labeling the same blot for γ-tubulin (SIGMA T3559). To correct for differences in protein loading between lanes, membranes were Coomassie stained as reported previously (44). Signals were visualized with an Odyssey Infrared Imaging System (LI-COR Biosciences). Immunoblot and Coomassie band densities were quantified using the software program Image J (NIH, available at http://rsb.info.nih.gov/). Pendrin band density was normalized to the density of band on the Coomassie membrane with the same mobility.
Immunohistochemistry
We used an anti-pendrin antibody raised in rabbits that recognizes the COOH-terminal 29 amino acids of the rat pendrin sequence (20). For double-labeling experiments, we used a rabbit anti-tyrosine hydroxylase (Abcam, ab112) diluted 1:20,000 and a rabbit anti-α-phenylethanolamine N-methyltransferase (α-PNMT) antibody, diluted 1:10,000 to 1:20,000, that was raised in rabbits and recognizes amino acids 44–58 of the mouse α-PNMT sequence (26) (a generous gift of Dr. James Powers).
Kidneys and adrenal glands from mice and rats were fixed in situ and embedded in paraffin or polyester wax [polyethylene glycol 400 distearate (Polysciences, Warrington, PA) and 10% 1-hexadecanol] as described previously (24). Pendrin immunoreactivity was detected using immunoperoxidase procedures. Blocking was done with 3% H2O2 in methanol for 30 min, followed by protein blocking using 1% bovine serum albumin, 0.2% gelatin, 0.05% saponin solution. The anti-pendrin antibody was diluted in PBS (1:1,000). Sections were rinsed with PBS supplemented with 0.1% BSA, 0.05% saponin, and 0.2% gelatin, and labeling was visualized with horseradish peroxidase-conjugated goat anti-rabbit secondary antibody (1:200, DAKO). Sections that labeled pendrin were visualized by diaminobenzidine (DAB) staining. Sections were washed with distilled water and counterstained with hematoxylin. In experiments using polyester wax-embedded tissue, the anti-pendrin primary antibody was diluted up to 1:50,000. Endogenous peroxidase activity was blocked by incubating the sections in 3% H2O2 in distilled water for 45 min. The sections were blocked for 15 min with Serum-Free Protein Block (Dako Cytomation) and then incubated at 4°C overnight with primary antibody. The sections were washed in PBS and incubated for 30 min with polymer-linked, peroxidase-conjugated goat anti-rabbit IgG (Vector ImmPRESS; Vector Laboratories, Burlingame, CA), again washed with PBS and then exposed to a DAB substrate kit (Vector) for 5 min. The sections were washed in distilled water, dehydrated with graded ethanols and xylene, mounted, and observed by light microscopy.
Double immunolabeling was done using sequential immunoperoxidase procedures in polyester wax-embedded tissue, as described previously (18). Tissue sections were labeled with the anti-pendrin antibody. After the DAB reaction, sections were washed in PBS and then blocked using 3% H2O2 in methanol. A second immunolabeling procedure was done on the same sections using the α-PNMT or the tyrosine hydroxylase antibodies as the primary antibody and Vector SG (Vector Laboratories, Burlingame, CA) for the peroxidase substrate, which produces a blue reaction product easily distinguished from the DAB brown reaction product. Sections were then washed with glass-distilled water, dehydrated with graded ethanols and xylene, mounted, and observed by light microscopy.
Identification of Pendrin mRNA in Human Tissues
Publicly accessible data from comprehensive transcriptomic profiling of human liver, kidney, and adrenal obtained using RNA-seq was downloaded from the Illumina Human Body Map 2.0 project (http://www.ncbi.nlm.nih.gov/geo/query/acc.cgi?acc=GSE30611). Fastq files from the sequencing output were aligned to the hg18 version of the human genome, and the resulting BAM files were converted to bigWig format and loaded into a custom session on the UCSC Genome Browser (www.genome.ucsc.edu).
Rat Adrenal Dissection and mRNA Preparation
Adrenal glands were rapidly removed and cleaned of surrounding fat. The capsule containing the zona glomerulosa was separated from the rest of the cortex and medulla by making a small incision in the capsule and squeezing the inner zones from the bottom to the top on a tissue paper humidified in PBS between the index finger and thumb. The capsule was immediately frozen, and the inner zones were placed on an ice-filled Petri dish. After sectioning about 1 mm of cortex at two opposed sides, inner zones were bisected and flipped 90°, and the medulla was punched out using a 2-mm diameter needle. Tissues were immediately frozen in a 1.5-ml microtube on dry ice.
Total RNA was prepared by homogenizing tissue in 1 ml of TRIzol reagent (Invitrogen, Hopkinton, MA), using a hand-held motorized homogenizer (Bio-Gen Pro200; Pro Scientific, Oxford, CT), for 5 s, setting 2, followed by purification using an RNeasy minikit and column DNase digestion (Qiagen, Valencia, CA) (39, 41). Aliquots of total RNA, ∼700 ng for capsule and inner cortical zones and 300 ng for the medulla, were subjected to DNase 1 treatment in solution to eliminate remaining traces of genomic DNA contamination. RNase-free DNase I (10 U/μl; Roche Applied Science, Indianapolis, IN) was diluted 10-fold in 1× Jumpstart PCR buffer. One hundred microliters of total RNA in nuclease-free H2O at 50–100 ng/μl was treated with 1 U DNase I and 1 mM MgCl2 at 37°C for 30 min, exactly followed by 75°C for precisely 10 min, cooled on ice, and stored at −80°C.
Quantitative PCR in Rat Adrenal Gland
Quantitative (q)PCR assays were performed as described previously (39, 41, 42). Target-specific qPCR quantitative assays were developed using Beacon Designer or AlleleID software (Premier Biosoft, Palo Alto, CA) based on the latest refseq sequence information available at the time from the NCBI. Real-time qPCR assay information is provided in Table 1. cDNA was synthesized in a 5-μl volume within a 384-well plate by the addition of 3 μl/well RT master mix consisting of 400 nM assay-specific reverse primer (from the qPCR assay), 500 μM deoxynucleotides, 1× Affinityscript buffer, and 1 U/μl Affinityscript reverse transcriptase (Agilent Technologies, Santa Clara, CA) for +RTase reactions or without for the −Rtase reactions, to a 384-well plate (Applied Biosystems) and followed by a 2-μl volume of sample (50 ng/μl). Each sample was assayed in triplicate wells plus a control well without reverse transcriptase (NAC) in the master mix to access DNA contamination level. Each plate also contained an assay-specific sDNA standard (synthetic PCR amplicon oligo) spanning a 5-log template concentration range (≈200 to 2E6 copies) in duplicate and two no-template PCR control wells (NTC). The oligo standards were added into RT master mix with reverse transcriptase. Each plate was covered with Biofilm A (Bio-Rad) and incubated in a DYAD (384-well block) thermocycler (Bio-Rad) for 30 min at 50°C followed by 72°C for 10 min.
Table 1.
Primers employed
| Gene Name | Slc26A4 | TH | RNA18S5 | Actb |
|---|---|---|---|---|
| Protein | Pendrin | Tyrosine hydroxylase | None | β-Actin |
| Species | rat | Rat | Human | Rat |
| Accession no. | NM_019214 | NM_012740 | NR_003286 | NM_031144 |
| Synonyms | Pds | The | RN18S1 | Actx |
| Forward Primer | 911+ CAGTCCCGATTCCTATAG | 1281+ CAAGATCAAACCTACCAG | 1335+ CGGCTTAATTTGACTCAACAC | 1032+ TACTGCCCTGGCTCCTAGC |
| Reverse Primer | 988− AATTTGCTTCCAAGTTGG | 1366− ATACGAGAGGCATAGTTC | 1401− ATCAATCTGTCAATCCTGTCC | 1113− AGAGCCACCAATCCACACA |
| Probe | 940+ FAM-ACAATTATCGCCACCGCCA-BHQ1 | 1338+ FAM-CCTTGGCGTCATTGAAGCTCTC-BHQ1 | 1359+ FAM-AAACCTCACCCGGCCCG-BHQ1 | 1060+ FAM-ATCAAGATCATTGCTCCTCCTGAGCGC-BHQ1 |
| Amplicon Length, bases | 78 | 86 | 67 | 82 |
| PCR Efficiency, % | 100 | 97 | 99 | 98 |
| LOQ, copies | 20 | 20 | 2000 | 20 |
| Exon Boundary | 7/8 | 13/14 | N/A | 5/6 |
| Splice Variants | All detected | None | None | All detected |
| m-Fold | None | None | None | None |
| BLAST | Specific | Specific | Specific | Specific* |
LOQ, limit of quantification.
Might detect γ-actin.
The complete PCR master mix (15 μl/well) was added directly to the 5-μl cDNA volume in the 384-well qPCR plate. Final concentrations for the PCR were 400 nM forward and reverse primers (IDT, Coralville, IA), 100 nM fluorogenic probe (Biosearch Technologies, Petaluma, CA), 5 mM MgCl2, and 200 mM deoxynucleotides, 1× JumpStart PCR buffer, 150 nM SuperROX dye (Biosearch Technologies) and 0.25 U JumpStart Taq polymerase per reaction (Sigma, St. Louis, MO). RT master mixes, all RNA samples, and DNA oligo standards were pipetted with a Tecan Genesis RSP 100 robotic workstation (Tecan US, Research Triangle Park, NC); PCR master mixes were pipetted utilizing a Biomek 2000 robotic workstation (Beckman, Fullerton, CA). Each assembled plate was then covered with optically clear film (Applied Biosystems) and run in a 7900 real-time qPCR instrument using the following cycling conditions: 95°C for 2 min, followed by 40 cycles of 95°C, 12 s, and 60°C for 30 s. The resulting data were analyzed using SDS 2.3 (7900) software (Applied Biosystems) with FAM reporter and ROX as the reference dye. Synthetic PAGE-purified DNA oligonucleotides were used as standards (sDNA) and encompassed at least the entire 5′-3′ PCR amplicon for the assay (Sigma-Genosys, The Woodlands, TX). Each oligo standard was diluted in 100 ng/μl E. coli tRNA-H2O (Molecular Biology Grade, RNase/DNase free; Roche Applied Science) and spanned a 5-log range in 10-fold decrements starting at 0.8 pg/reaction. Copy numbers were calculated based on the amount of sDNA used and amplicon length. In vitro transcribed RNA amplicon standards (sRNA) and sDNA standards have the same PCR efficiency and sensitivity when the reactions are performed as described above with PCR amplicons of fewer than 100 bases in length (G. L. Shipley, unpublished observations).
The final data were normalized to the geometric mean of 18S rRNA and β-actin values based on the observed low variability of these transcripts among biological groups (geNorm algorithm). Due to the high abundance of the 18S ribosomal RNA, a second set of experimental samples, diluted 100-fold, was made in 100 ng/μl E. coli tRNA-H2O for each sample to bring the Cq values in line with abundant mRNAs. The final data are presented as the molecules of unknown transcript/geometric mean of molecules of 18S rRNA and β-actin × 100, extrapolated from their respective standard curves (Vandesompele et al, Genome Biology, 2002- http://genomebiology.com/2002/3/7/research/0034.1). The final data are expressed as a percentage of the geometric mean of the normalizer transcripts (6, 38). Quantities for unknown samples were obtained from an internal assay-specific standard curve run on each 384-well plate, as described above. Samples with data points below the limit of quantification (LOQ) for the assay were not considered in the data analysis. Similarly, samples with DNA levels (−RTase) within 6 cycles (Cq) of the mean of the transcript signals (+RTase) were not considered in the data analysis.
Measurement of Catecholamines, Renin, Aldosterone, Electrolytes, and Arterial Blood Gases
Plasma levels of epinephrine and norepinephrine were quantified in 50 μl of plasma by use of reverse-phase liquid chromatography with electrochemical detection after partial purification by adsorption of catechols onto alumina (11). Plasma corticosterone levels were measured in 10 μl of plasma, using the DetecX Corticosterone Chemiluminescent Immunoassay Kit (Arbor Assays, Ann Arbor, MI) according to the manufacturer's instructions. Plasma renin and serum aldosterone concentrations were measured as described previously (40). Aldosterone measurements were performed at the the Cardiovascular Pharmacology Research Laboratory, University of Iowa College of Pharmacy. Serum electrolytes were measured using an iSTAT System (Abbot Point of Care, Princeton, NJ).
All procedures were approved by Emory University and the National Institute of Child Health and Human Development (NICHD) Animal Care and Use Committees.
Statistics
Data are presented as means ± SE. Each n used in the statistical analysis represents data from separate animals. To test for statistical significance between two groups, an unpaired Student's t-test was used. The criterion for statistical significance was P < 0.05.
RESULTS
Pendrin Gene Ablation Reduces the Aldosterone/Renin Ratio
Following moderate dietary NaCl restriction, we observed that pendrin gene ablation increased circulating renin concentration without changing serum aldosterone (16). Further experiments examined plasma aldosterone and renin concentration in pendrin-null and wild-type mice following a high K+ diet (see Treatment 2, methods), which stimulates aldosterone release through a mechanism distinct from that of NaCl restriction. As shown (Table 2), pendrin gene ablation reduced the ratio of aldosterone to renin. Since plasma renin concentration was either the same or higher, while serum aldosterone concentration was the same or lower in pendrin-null relative to wild-type mice given a high K+ diet, the reduced aldosterone/renin ratio observed with pendrin gene ablation is likely due to increased plasma renin concentration, reduced serum aldosterone concentration, or both. We conclude that, in response to dietary NaCl restriction (16) and K+ loading (Table 2), pendrin gene ablation increases circulating renin concentration more than aldosterone concentration.
Table 2.
Effect of pendrin gene ablation on serum electrolytes and aldosterone and plasma renin concentration in mice consuming a KCl-rich diet
| Wild Type | Pendrin Null | |
|---|---|---|
| Na+ (meq/l) | 134 ± 6.2 (n = 4) | 138 ± 0.3 (n = 3) |
| K+ (meq/l) | 3.7 ± 0.5 (n = 4) | 5.6 ± 0.5 (n = 3)* |
| Cl− (meq/l) | 97 ± 3 (n = 4) | 97 ± 0 (n = 3) |
| Aldosterone (nM) | 49.4 ± 5.7 (n = 7) | 52.6 ± 6.9 (n = 6) |
| Renin concentration (μg Ang I/ml/h) | 1.02 ± 0.15 (n = 5) | 2.97 ± 1.14 (n = 6) |
| Aldosterone/renin ratio (nM/μg Ang I/ml/h) | 43.1 ± 1.4 (n = 5) | 24.1 ± 4.6 (n = 6)* |
P < 0.05.
Pendrin Is Expressed in Human Adrenal Gland
The low aldosterone/renin ratio observed in pendrin-null mice following high dietary K+ intake suggests that pendrin is expressed in the adrenal glomerulosa and is necessary for a maximal aldosterone response. To explore this possibility, we mined publicly accessible transcriptomic data (Illumina Human Body Map 2.0 project) to determine whether pendrin mRNA is present in human adrenal gland (Fig. 1). As shown, pendrin mRNA is expressed in human kidney but not in liver, as expected on the basis of previous reports (29). Significantly, pendrin transcript was also detected in human adrenal gland at levels comparable to that found in human kidney.
Fig. 1.

Pendrin (Slc26a4) mRNA is expressed in human adrenal gland. UCSC Genome Browser tracks (gray bars at left) show, from top to bottom, the chromosomal location of SLC26A4 (pendrin) on chromosome 7 along with scale bar and transcript structure. Thick blue blocks denote exons; thin lines connecting these are introns. Expression in kidney, adrenal gland, and liver are shown. The latter 3 expression tracks are RNA-Seq read data converted to UCSC Genome Browser bigWig format and are all scaled to common y-axis height of 100. Slc26a4 was detected in kidney and adrenal gland but not in liver. RNA-Seq data used to create these 3 tracks were derived from the Illumina Human Body Map 2.0 project and can be found at http://www.ncbi.nlm.nih.gov/geo/query/acc.cgi?acc=GSE30611.
Pendrin Localizes to Chromaffin Cells Within Mouse Adrenal Medulla
To determine whether pendrin protein is expressed in the mouse adrenal gland, we examined pendrin protein abundance by immunoblot in adrenal lysates taken from wild-type and pendrin-null mice. Kidney lysates from wild-type and pendrin-null mice were employed as positive and negative controls. As shown (Fig. 2), we observed a band that migrated at 110 kDa, the expected mobility of pendrin (17), in renal and adrenal lysates from wild-type but not from pendrin-null mice.
Fig. 2.
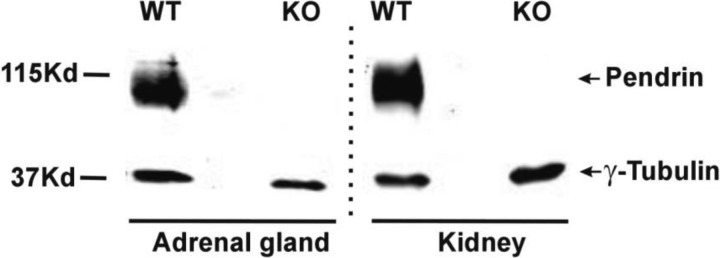
Pendrin is expressed in mouse adrenal gland. Pendrin band density was examined by immunoblot of mouse adrenal and kidney lysates. As shown, the anti-pendrin antibody detected a band that migrates at ∼115 kDa, the expected mobility of pendrin, in adrenal and kidney lysates from wild-type, but not pendrin-null mice. γ-Tubulin immunoreactivity was employed as a loading control. All lysates were run on the same gel. Dashed line indicates a region on the gel where lanes were excluded.
To determine the site of pendrin expression within the adrenal gland, pendrin immunolabeling was examined in mouse adrenal gland sections. As shown (Fig. 3A), pendrin labeling was not observed in the adrenal cortex as we expected but rather in the adrenal medulla. No pendrin labeling was observed in the adrenal medulla of pendrin-null mice (Fig. 3B), which confirmed immunostaining specificity. The intensity and subcellular distribution of pendrin immunoreactivity varied among cells in the adrenal medulla (Fig. 3, C and D). Many cells contained a single locus of intense immunoreactivity, whereas others had weaker, more diffuse cytoplasmic label. Occasional cells had accentuated immunoreactivity at the periphery of the cells, consistent with plasma membrane distribution (Fig. 3D).
Fig. 3.

Pendrin is expressed in chromaffin cells of the mouse adrenal medulla. Pendrin immunolabeling was observed in the adrenal medulla of wild-type (A), but not of pendrin-null mice (B). C: pendrin immunolabel in adrenal medulla of wild-type mice. D: inset from C at higher magnification. Open arrows mark areas of peripheral immunoreactivity consistent with plasma membrane labeling; closed arrows show cells with intense foci of immunolabeling within the cell cytoplasm. E: pendrin (brown) and tyrosine hydroxlase (TH; blue) double labeling. Virtually all pendrin-positive cells are also positive for TH. Occasional cells are positive for pendrin, but TH negative (arrows). F: pendrin (brown) and α-phenylethanolamine N-methyltransferase (α-PNMT; blue) double labeling. Pendrin immunoreactivity is present in both α-PNMT-positive (open arrows) and α-PNMT-negative cells (closed arrows). None of these images showed pendrin immunolabel in the adrenal cortex.
Further experiments explored the cell type(s) within the adrenal medulla that express(es) pendrin. To do so, tyrosine hydroxylase, the rate-limiting enzyme in catecholamine biosynthesis, was used as a chromaffin cell marker (7). Figure 3E shows that pendrin immunoreactivity was present almost exclusively in cells that were positive for tyrosine hydroxylase. Therefore, pendrin is expressed primarily within chromaffin cells of the adrenal medulla. However, occasional pendrin-positive, tyrosine hydroxylase-negative cells were observed (Fig. 3E). The identity of these cells is unclear but may represent entrapped cortical cells, sustentacular cells, endothelial cells, or neurons. To further explore the cell subtype(s) that express(es) pendrin, we used an enzyme that converts norepinephrine to epinephrine (α-PNMT), as a marker of epinephrine-producing chromaffin cells (30). As shown (Fig. 3F), pendrin label was present in cells that were both positive and negative for α-PNMT. Therefore, pendrin localizes to both epinephrine- and norepinephrine-producing chromaffin cells within the adrenal medulla.
Pendrin Protein and mRNA Are Expressed in the Rat Adrenal Medulla
Additional studies explored whether pendrin expression in the adrenal medulla is unique to mouse or whether it is observed in another species. Because dietary NaCl restriction increases pendrin abundance in kidney (27, 42), we examined pendrin labeling in adrenal gland sections taken from NaCl-restricted rats (Fig. 4, Treatment 4). As shown, in rat adrenal gland pendrin labeling was also observed in the medulla, but not in the cortex.
Fig. 4.
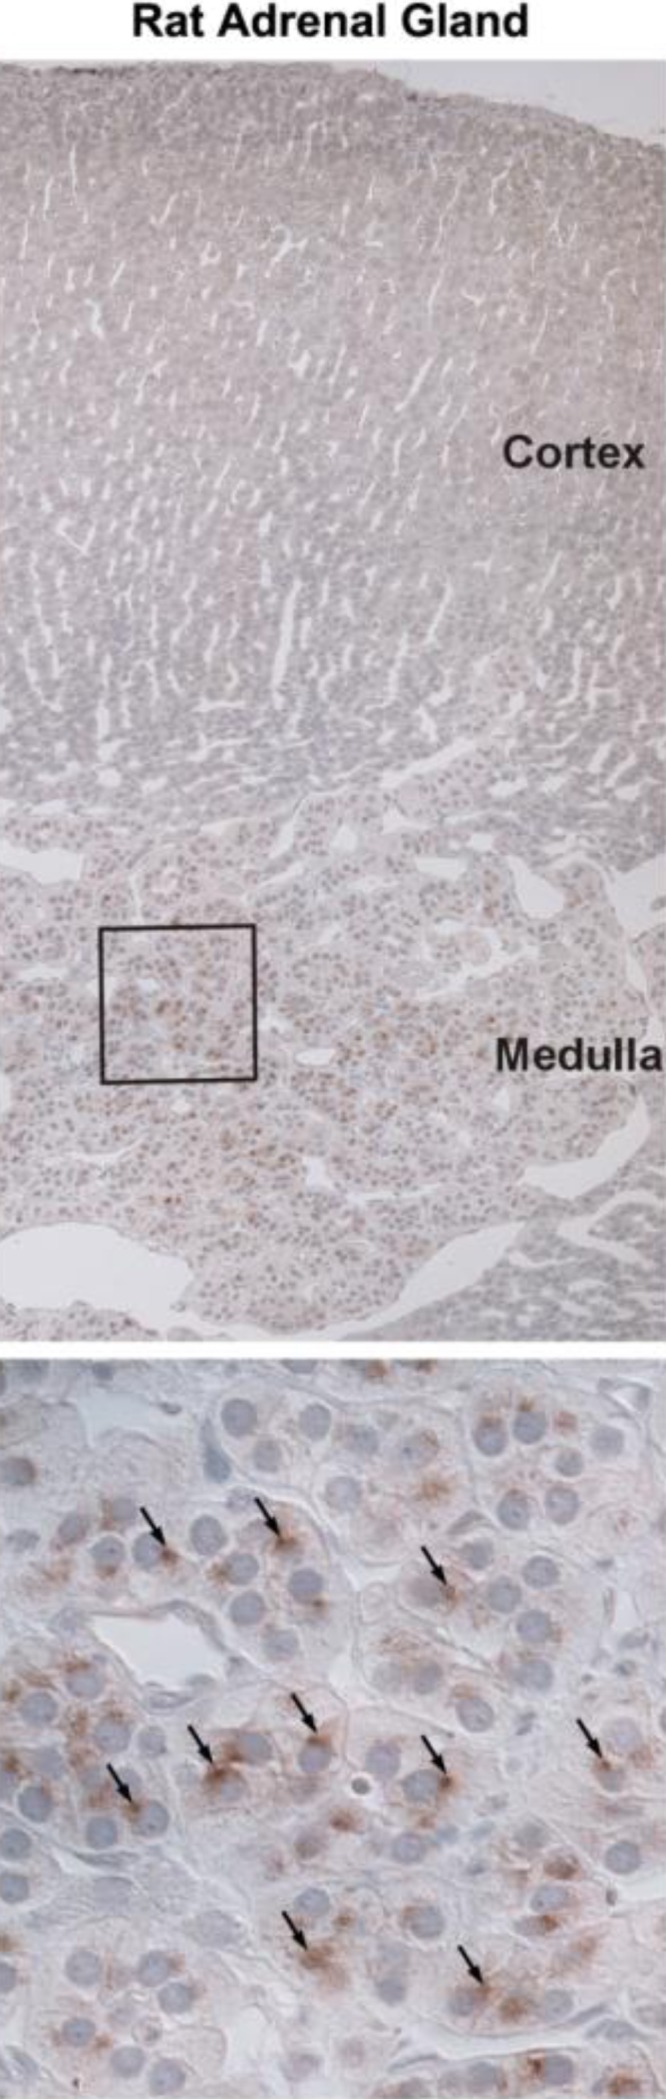
Pendrin is expressed in rat adrenal medulla. Sections of rat adrenal gland were labeled for pendrin. Top: sections at low magnification of rat adrenal gland labeled for pendrin. Bottom: area within the box at higher magnification. Arrows indicate pendrin immunolabel. As shown, pendrin labeling was observed in rat adrenal medulla but not cortex.
To confirm pendrin expression in the adrenal medulla, we examined pendrin mRNA levels in microdissected samples taken from the rat adrenal medulla, capsule/glomerulosa, and zona fasciculata. Tyrosine hydroxylase mRNA was used as a marker of adrenal medullary chromaffin tissue. As shown (Fig. 5), pendrin mRNA was highly expressed in the rat adrenal medulla, with much lower levels in other regions of the rat adrenal gland. Since similar low levels of pendrin and tyrosine hydroxylase mRNA were detected in samples taken from the zona fasciculata the pendrin mRNA detected in these samples was more likely due to contamination by chromaffin tissue than from pendrin mRNA actually expressed in this region.
Fig. 5.

Slc26a4 (pendrin) mRNA is expressed in rat adrenal medulla. Slc26a4 template molecules (mRNA) were quantified in samples taken from rat adrenal capsule, fasciculata, and medulla by punch biopsy. TH mRNA was quantified in the same samples as a marker of adrenal medullary chromaffin tissue. As shown, pendrin (Slc26a4) mRNA was much higher in adrenal medulla relative to fasciculata or glomerulosa. Groups were compared using one-way ANOVA with a Holm-Sidak posttest.
Regulation of Pendrin Protein Abundance Differs in Kidney and Adrenal Gland
Because aldosterone increases renal pendrin abundance (39), further experiments examined changes in pendrin abundance in kidney and adrenal gland in mice following increased intake of K+ (Treatments 2 and 3) or NaCl (Treatment 1), both of which reduced pendrin protein abundance in kidney (27, 34, 42). Pendrin abundance was semiquantified by immunoblot of kidney (Fig. 6) and adrenal gland lysates (Fig. 7) taken from mice in each treatment group. As shown, pendrin abundance in kidney fell with increased intake of NaCl or of K+, whether given as KCl or KHCO3. However, adrenal gland pendrin abundance was unaffected by changes in dietary intake of NaCl or K+. We conclude that the regulation of pendrin protein abundance differs in kidney and in adrenal gland.
Fig. 6.

Renal pendrin protein abundance decreases when dietary NaCl or K+ intake increases. Pendrin protein abundance was quantified by immunoblot of kidney lysates taken from mice given a high (1.4 meq/day) or low (0.03 meq/day) dietary intake of NaCl (HS or LS, Treatment 1). In other experiments, pendrin abundance was quantified in lysates taken from mice that received 0.67 or 4.36 meq/day K+ given as KCl or KHCO3 (Treatments 2 and 3). As shown, increasing dietary NaCl or K+ intake reduced pendrin band density. Groups were compared with a 2-tailed, Student's t-test. *P < 0.05.
Fig. 7.

Adrenal pendrin protein abundance does not fall with increased dietary K+ or NaCl intake. Pendrin protein abundance was quantified by immunoblot of adrenal lysates taken from mice given a HS or LS or K+ (Treatments 1–3). Pendrin band density was unaffected by changes in dietary NaCl or K+. Groups were compared with an unpaired, 2-tailed, Student's t-test.
Pendrin Gene Ablation Increases Stress-Induced Epinephrine and Norepinephrine Release
Because pendrin is expressed in epinephrine- and norepinephrine-producing chromaffin cells, we were prompted to measure serum catecholamine concentration in wild-type and pendrin-null mice bearing chronic indwelling catheters. Circulating catecholamine and corticosterone concentrations were quantified under basal conditions and then after 5 and 20 min of immobilization stress. As shown (Fig. 8), basal epinephrine and norepinephrine levels were similar in pendrin-null and wild-type mice. Circulating epinephrine and norepinephrine increased dramatically in both the wild-type and pendrin-null mice within the first 5 min of immobilization stress. However, after 20 min of immobilization stress epinephrine and norepinephrine levels were higher in pendrin-null than in wild-type mice. Differences in the production of dihydroxyphenylglycerol (DHPG), a metabolite of norepinephrine, did not reach statistical significance. Moreover, there were no differences between wild-type and pendrin-null mice in circulating dopamine or the dopamine metabolite 3,4-dihydroxyphenylacetic acid (DOPAC) either under basal conditions or following immobilization stress.
Fig. 8.

Pendrin gene ablation increases stress-induced catecholamine release. Blood was sampled for epinephrine and norepinephrine, the norepinephrine metabolite dihydroxyphenylglycerol (DHPG), and for dopamine and the dopamine metabolite 3,4-dihydroxyphenylacetic acid (DOPAC), before and 5 and 20 min after initiation of immobilization stress. Values were compared between pendrin-null and wild-type mice at each of these time points using an unpaired, 2-tailed, Student's t-test. After 20 min of immobilization stress, epinephrine and norepinephrine levels were significantly higher in pendrin-null than in wild-type mice. Wild-type, n = 6; pendrin-null, n = 5. *P < 0.05.
Because the adrenal gland produces corticosterone, we also explored the effect of pendrin gene ablation on circulating corticosterone levels under both basal conditions and then after immobilization stress (Fig. 9). As shown, corticosterone concentrations were similar in pendrin-null and wild-type mice under basal conditions and increased with stress in both groups. However, after 5 min of immobilization stress, plasma corticosterone concentration was higher in pendrin-null than in wild-type mice. We conclude that pendrin gene ablation increases stress-induced release of epinephrine, norepinephrine, and corticosterone, but not of dopamine.
Fig. 9.

Pendrin gene ablation increases stress-induced release of corticosterone. Blood was sampled for corticosterone before and 5 and 20 min after initiation of stress immobilization. Corticosterone values were compared between wild-type and pendrin-null mice at each of these time points using an unpaired Student's 2-tailed t-test. After 5 min of immobilization stress, corticosterone levels were higher in pendrin-null than in wild-type mice. Wild-type, n = 8; pendrin-null, n = 6. * P < 0.05.
Pendrin Gene Ablation Does Not Change Tyrosine Hydroxylase Protein Abundance
Because pendrin gene ablation increased the stress-induced release of catecholamines, we asked whether this occurs from increased abundance of tyrosine hydroxylase, the rate-limiting enzyme in the synthesis of epinephrine by the adrenal medulla. As shown (Fig. 10), tyrosine hydroxylase total protein abundance was similar in adrenal glands from unstressed wild-type and pendrin-null mice. We conclude that changes in tyrosine hydroxylase protein abundance cannot explain the increased stress-induced release of catecholamines that follows pendrin gene ablation.
Fig. 10.
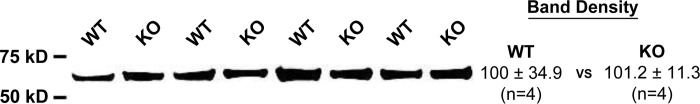
Pendrin gene ablation does not change adrenal TH protein abundance. TH protein abundance was quantified by immunoblot of adrenal lysates taken from wild-type (WT) and pendrin-null (KO) mice following 5 days of the NaCl-replete gelled diet described in Treatment 5. TH band density was unaffected by pendrin gene ablation. Groups were compared with an unpaired, 2-tailed, Student's t-test.
Immobilization Stress Increases Blood Pressure in Pendrin-Null and Wild-Type Mice
Because pendrin gene ablation modulates stress-induced catecholamine release, we asked whether pendrin gene ablation also modulates the pressor response to immobilization stress. To answer this question, we examined the effect of immobilization stress on heart rate and blood pressure in the wild-type and mutant mice (Fig. 11). Systolic, diastolic, and MAP blood pressures were lower in pendrin-null than in wild-type mice under basal conditions (Fig. 11, A–C), consistent with previous observations (16, 23). With immobilization stress, MAP increased rapidly by ∼16–26 mmHg in both wild-type and pendrin-null mice (Fig. 11E), although blood pressure remained lower in the pendrin-null than in wild-type mice after 20 min of immobilization stress (Fig. 11D). However, 30 min after relief of stress, MAP was similar in wild-type and pendrin-null mice. Pendrin-null and wild-type mice had similar heart rates under basal and stimulated conditions (Fig. 11, F–H). We conclude that although immobilization stress produces a similar increment in blood pressure in the pendrin-null and in wild-type mice, after termination of stress, blood pressure returns to basal levels more quickly in wild-type than in pendrin-null mice.
Fig. 11.

Effect of pendrin gene ablation on stress-induced changes in blood pressure. Systolic (A), diastolic (B), mean arterial pressure (MAP, C), and heart rate (F) were measured by telemetry in conscious wild-type (n = 5) and pendrin-null (n = 7) mice before, during 20 min of immobilization stress, and for 30 min after termination of stress (Recovery). Under basal conditions, blood pressure was lower in pendrin-null than in wild-type mice (A–D). MAP (C and D) increased in wild-type and pendrin-null mice with immobilization stress. However, the increment in blood pressure that followed immobilization stress was similar in wild-type and mutant mice (E). As such, blood pressure remained lower in pendrin-null than in wild-type mice after 20 min of stress (D). Thirty minutes after relief of stress (Recovery), systolic, diastolic, and MAP were similar in pendrin-null and wild-type mice (A–D). As such, blood pressure returned to basal levels 30 min after relief of stress in wild-type mice but remained elevated relative to baseline in pendrin-null mice (E). Both absolute heart rate and stress-induced increment in heart rate were similar in wild-type and pendrin-null mice under these treatment conditions (D–F).
DISCUSSION
The aim of this study was to determine whether pendrin is expressed in the adrenal gland and whether it modulates adrenal function. Our results show that pendrin is expressed in chromaffin cells of the adrenal medulla, where it modulates stress-induced catecholamine release. While stilbene-sensitive Na+-independent Cl−/HCO3− exchange has been observed in the rat adrenal cortex (33), our data indicate that this Cl−/HCO3− exchange process is not mediated by pendrin, since pendrin is expressed at very low levels in rat adrenal cortex and since pendrin is relatively resistant to stilbene inhibitors (8, 28).
Although we did not detect pendrin expression in the adrenal cortex, we observed that pendrin gene ablation increased the stress-induced release of corticosterone, a hormone produced in the adrenal cortex. The exact mechanism by which pendrin modulates stress-induced release of corticosterone remains unclear, although pendrin gene ablation likely increases stress-induced corticosterone release through the action of catecholamines. In this regard, peripheral catecholamines stimulate the the hypothalamus-pituitary-adrenal axis to increase adrenal cortical corticosterone release (5, 37). Moreover, epinephrine directly stimulates corticosterone production by the adrenal cortex (9). However, because the time courses for the pendrin-dependent, stress-induced increment in corticosterone and catecholamine concentrations are not identical, pendrin may alter stress-induced catecholamine release independent of epinephrine and norepinephrine.
Because pendrin is expressed in chromaffin cells within the adrenal medulla, we were prompted to explore the role of pendrin in adrenal medullary function. The time courses for epinephrine and norepinephrine responses to immobilization stress that we observed in wild-type mice are consistent with time courses reported previously in rats (22). In the rat and in wild-type mice, norepinephrine peaked 5 min after the initiation of immobilization stress and then remained stable for the next 15 min, whereas epinephrine concentration continued to rise over 20 min of immobilization stress (22). In pendrin-null mice, however, both catecholamines continued to increase over 20 min of immobilization stress. Moreover, after 20 min of stress, levels of both catecholamines were significantly higher in pendrin-null than in wild-type mice. The enhanced catecholamine response to immobilization stress that we observed with pendrin gene ablation suggests that the presence of pendrin blunts the responsiveness of the adrenal medulla to stress. Whether pendrin modulates chronic, stress-induced changes in catecholamine release remains to be determined.
Since immobilization stress fails to increase circulating epinephrine concentration following adrenalectomy (22), epinephrine is produced predominantly in the adrenal gland (1). Therefore, the enhanced epinephrine production observed in pendrin-null mice is most likely of adrenal origin. While norepinephrine is also produced in the adrenal medulla, nerve terminals are the primary site of norepinephrine synthesis and release into the circulation (22). The recent demonstration of pendrin mRNA expression in brain (http://mouse.brain-map.org/experiment/show/70302117) raises the possibility that ablation of a central modulatory action in pendrin-null mice may contribute to the enhanced catecholamine response to stress. Whether pendrin is expressed in central nuclei controlling sympathoadrenal activity or in noradrenergic nerve terminals remains to be determined.
How pendrin modulates catecholamine release is unclear. Since pendrin mediates Cl− uptake in kidney and since pendrin is probably expressed on the plasma membrane of adrenal medullary chromaffin cells, pendrin may modulate catecholamine release in the adrenal medulla through changes in Cl− uptake. If so, pendrin gene ablation might stimulate catecholamine release by reducing Cl− uptake in chromaffin tissue. However, previous studies have shown an opposite effect of Cl− uptake on epinephrine secretion by chromaffin cells (25). When chromaffin cell Cl− uptake is reduced through extracellular Cl− removal, epinephrine release falls. Therefore, the mechanism by which pendrin modulates epinephrine release remains to be determined. While catecholamine release may be modulated specifically by adrenal medullary pendrin expression, we cannot exclude the possibility that pendrin gene ablation modulates stress-induced catecholamine release through an indirect, extra-adrenal effect of pendrin gene ablation.
The present study is the first to show that pendrin gene ablation enhances stress-induced release of catecholamines, presumably through enhanced activation of the sympathetic nervous system. Epinephrine and norepinephrine can both increase blood pressure, although epinephrine raises blood pressure only at high concentrations (12). While it is well established that the sympathetic nervous system is critical in acute blood pressure regulation (3), its role in chronic blood pressure regulation is less well established (3). Epinephrine and norepinephrine also have different effects on heart rate, since epinephrine increases whereas norepinephrine decreases heart rate, due to activation of baroreceptors and the vagus nerve (12).
Pendrin gene ablation reduces blood pressure, whereas mice that overexpress pendrin have profound salt-sensitive hypertension (13). Since pendrin gene ablation increases catecholamine release in response to immobilization stress, we predict that pendrin overexpression will attenuate stress-induced catecholamine release. In this regard, some people with salt-sensitive hypertension have a blunted stress-induced release of norepinephrine, which is consistent with our predictions in this mouse model of salt-sensitive hypertension (43). Why catecholamine release is suppressed in salt-sensitive hypertension is unclear, but it is thought to mitigate the increase in blood pressure observed with increased dietary salt intake (43).
In addition to enhanced stress-induced catecholamine release, pendrin-null mice have enhanced vascular smooth muscle contractility in response to α-agonists, such as phenylephrine. (35). In particular, we observed that pendrin gene ablation increases the maximum force of contraction/cross-sectional area in the thoracic aorta in response to phenylephrine (35). Since epinephrine and norepinephrine are also α-agonists, enhanced contractile force in response to these catecholamines is expected in vascular smooth muscle of pendrin-null mice, which might change the stress-induced pressor response.
We (16) observed previously that following dietary NaCl restriction the increment in serum aldosterone relative to renin is blunted in pendrin-null mice. The present study demonstrates that the aldosterone/renin ratio is also lower in pendrin-null relative to wild-type mice when aldosterone production is stimulated through increased dietary K+ intake. The decline in this ratio could occur because plasma renin concentration increases, because plasma aldosterone concentration falls, or both. Since circulating aldosterone concentration is very high in both wild-type and pendrin-null mice after a high-K+ diet, it is unlikely that pendrin gene ablation significantly impairs aldosterone secretion. More likely, pendrin gene ablation reduces the aldosterone/renin ratio by increasing plasma renin concentration rather than by reducing aldosterone. Increasing dietary K+ increases serum K+ concentration while reducing plasma renin concentration or activity (4, 31). Because serum K+ is higher in pendrin-null than in wild-type mice following a high-K+ diet (Table 1), circulating renin concentration should be either unchanged or reduced in the mutant mice. Since plasma renin concentration is the same or increased in the pendrin-null mice, pendrin gene ablation may reduce the ratio of aldosterone to renin by limiting the ability to suppress renin release rather than limiting the ability to produce aldosterone. Why pendrin gene ablation increases plasma renin concentration, however, remains to be established. The enhanced stress-induced epinephrine and norepinephrine release observed in pendrin-null mice might stimulate renin production (14, 21, 36). However, other mechanisms are possible.
We conclude that pendrin is expressed in the adrenal medulla, where it modulates stress-induced release of catecholamines. The mechanism by which pendrin changes catecholamine release remains to be determined.
GRANTS
This study was supported by National Institute of Diabetes and Digestive and Kidney Diseases grants DK-46493 (to S. M. Wall), DK-085097 (to R. S. Hoover), and T32 DK-07656 (to Y. Lazo-Fernandez, B. M. Wynne,. and A. Y. Park). This work was also supported by the National Institute of Child Health and Human Development, Intramural Research Program (G. Aguilera and K. Pacak).
DISCLOSURES
No conflicts of interest, financial or otherwise, are declared by the author(s).
AUTHOR CONTRIBUTIONS
Author contributions: Y.L.-F., G.A., T.D.P., A.Y.P., W.H.B., R.L.S., J.W.V., K.P., A.O.O., C.L.E., Y.H.K., G.L.S., and B.M.W. performed experiments; Y.L.-F., G.A., W.H.B., R.L.S., J.W.V., K.P., C.L.E., Y.H.K., G.L.S., B.M.W., S.K.S., P.M.P., and S.M.W. analyzed data; Y.L.-F., G.A., R.L.S., J.W.V., K.P., Y.H.K., G.L.S., S.K.S., P.M.P., and S.M.W. interpreted results of experiments; Y.L.-F., G.A., T.D.P., A.Y.P., R.L.S., J.W.V., Y.H.K., B.M.W., S.K.S., and S.M.W. prepared figures; Y.L.-F., G.A., Y.H.K., G.L.S., R.S.H., P.M.P., and S.M.W. edited and revised manuscript; Y.L.-F., G.A., T.D.P., A.Y.P., W.H.B., R.L.S., J.W.V., K.P., A.O.O., C.L.E., Y.H.K., G.L.S., B.M.W., R.S.H., S.K.S., P.M.P., and S.M.W. approved final version of manuscript; G.A., J.W.V., A.O.O., G.L.S., P.M.P., and S.M.W. conception and design of research; G.L.S. and S.M.W. drafted manuscript.
ACKNOWLEGMENTS
We thank Drs. James F. Powers and Arthur S. Tischler for their helpful suggestions and for providing the α-PNMT antibody. We also thank Tanisha Thomas at the University of Florida College of Medicine Electron Microscopy Core for expert technical assistance with tissue processing and immunohistochemical experiments.
REFERENCES
- 1.Alberts B, Bray D, Lewis J, Raff M, Robert K, Watson JD. Molecular Biology of the Cell. New York: Garland, 1983. [Google Scholar]
- 2.Amlal H, Petrovic S, Xu J, Wang Z, Sun X, Barone S, Soleimani M. Deletion of the anion exchanger Slc26a4 (pendrin) decreases the apical Cl−/HCO3− exchanger activity and imipairs bicarbonate secretion in the kidney collecting duct. Am J Physiol Cell Physiol 299: C33–C41, 2010. [DOI] [PMC free article] [PubMed] [Google Scholar]
- 3.Biaggioni I. Sympathetic control of the circulation in hypertension: lessons from autonomic disorders. Curr Opin Nephrol Hypertens 12: 175–180, 2003. [DOI] [PubMed] [Google Scholar]
- 4.Brunner HR, Baer L, Sealey JE, Ledingham JGG, Laragh JH. The influence of potassium administration and of potassium deprivation on plasma renin in normal and hypertensive subjects. J Clin Invest 49: 2128–2138, 1970. [DOI] [PMC free article] [PubMed] [Google Scholar]
- 5.Bugajski J, Turon M, Gadek-Michalska A, Borycz JA. Catecholaminergic regulation of the hypothalamic-pituitary-adrenocortical activity. J Physiol Pharmacol 42: 93–103, 1991. [PubMed] [Google Scholar]
- 6.Bustin SA, Benes V, Garson JA, Hellemans J, Huggett J, Kubista M, Mueller R, Nolan T, Pfaffl MW, Shipley GL, Vandesompele J, Wittwer CT. The MIQE guidelines: minimum information for publication of quantitative real-time PCR experiments. Clin Chem 55: 611–622, 2009. [DOI] [PubMed] [Google Scholar]
- 7.Dagerlind A, Goldstein M, Hokfelt T. Most ganglion cells in the rat adrenal medulla are noradrenergic. Neuroreport 1: 137–140, 1990. [DOI] [PubMed] [Google Scholar]
- 8.Emmons C. Transport characteristics of the apical anion exchanger of rabbit cortical collecting duct β-cells. Am J Physiol Renal Physiol 276: F635–F643, 1999. [DOI] [PubMed] [Google Scholar]
- 9.Engeland WC, Gann DS. Splanchnic nerve stimulation modulates steroid secretion in hypophysectomized dogs. Neuroendocrinology 50: 124–131, 1989. [DOI] [PubMed] [Google Scholar]
- 10.Everett LA, Belyantseva IA, Noben-Trauth K, Cantos R, Chen A, Thakkar SI, Hoogstraten-Miller SL, Kachar B, Wu DK, Green ED. Targeted disruption of mouse Pds provides insight about the inner-ear defects encountered in Pendred syndrome. Hum Mol Genet 10: 153–161, 2001. [DOI] [PubMed] [Google Scholar]
- 11.Holmes C, Eisenhofer G, Goldstein DS. Improved assay for plasma dihydroxyphenylacetic acid and other catechols using high-performance liquid chromatography with electrochemical detection. J Chromatog B Biomed Appl 653: 131–138, 1994. [DOI] [PubMed] [Google Scholar]
- 12.Innes IR, Nickerson M. The Pharmacological Basis of Therapeutics. New York: Macmillan, 1975. [Google Scholar]
- 13.Jacques T, Picard N, Miller RL, Riemondy KA, Houillier P, Sohet F, Ramakrishnan SK, Busst CJ, Jayat M, Corniere N, Hassan H, Aronson PS, Hennings JC, Hubner CA, Nelson RD, Chambrey R, Eladari D. Overexpression of pendrin in intercalated cells produces chloride-sensitive hypertension. J Am Soc Nephrol 4: 1104–1113, 2013. [DOI] [PMC free article] [PubMed] [Google Scholar]
- 14.Johnson MD, Fahri ER, Troen BR, Barger AC. Plasma epinephrine and control of plasma renin activity: possible extrarenal mechanisms. Am J Physiol Heart Circ Physiol 236: H854–H859, 1979. [DOI] [PubMed] [Google Scholar]
- 15.Kim YH, Kwon TH, Frische S, Kim J, Tisher CC, Madsen KM, Nielsen S. Immunocytochemical localization of pendrin in intercalated cell subtypes in rat and mouse kidney. Am J Physiol Renal Physiol 283: F744–F754, 2002. [DOI] [PubMed] [Google Scholar]
- 16.Kim YH, Pech V, Spencer KB, Beierwaltes WH, Everett LA, Green ED, Shin WK, Verlander JW, Sutliff RL, Wall SM. Reduced ENaC expression contributes to the lower blood pressure observed in pendrin-null mice. Am J Physiol Renal Physiol 293: F1314–F1324, 2007. [DOI] [PubMed] [Google Scholar]
- 17.Kim YH, Pham TD, Zheng W, Hong S, Baylis C, Pech V, Beierwaltes WH, Farley DB, Braverman LE, Verlander JW, Wall SM. Role of pendrin in iodide balance: going with the flow. Am J Physiol Renal Physiol 297: F1069–F1079, 2009. [DOI] [PMC free article] [PubMed] [Google Scholar]
- 18.Kim YH, Verlander JW, Matthews SW, Kurtz I, Shin WK, Weiner ID, Everett LA, Green ED, Nielsen S, Wall SM. Intercalated cell H+/OH− transporter expression is reduced in Slc26a4 null mice. Am J Physiol Renal Physiol 289: F1262–F1272, 2005. [DOI] [PubMed] [Google Scholar]
- 19.Klein JD, Martin CF, Kent KJ, Sands JM. Protein kinase C-α mediates hypertonicity-stimulated increase in urea transporter phosphorylation in the inner medullary collecting duct. Am J Physiol Renal Physiol 302: F1098–F1103, 2012. [DOI] [PMC free article] [PubMed] [Google Scholar]
- 20.Knauf F, Yang CL, Thomson RB, Mentone SA, Giebisch G, Aronson PS. Identification of a chloride-formate exchanger expressed on the brush border membrane of renal proximal tubule cells. Proc Natl Acad Sci USA 98: 9425–9430, 2001. [DOI] [PMC free article] [PubMed] [Google Scholar]
- 21.Kolloch RE, Kruse HJ, Friedrich R, Ruppert M, Overlack A, Stumpe KO. Role of epinephrine-induced hypokalemia in the regulation of renin and aldosterone in humans. J Lab Clin Med 127: 50–56, 1996. [DOI] [PubMed] [Google Scholar]
- 22.Kvetnansky R, Sun CL, Lake CR, Thoa N, Torda T, Kopin IJ. Effect of handling and forced immobilization on rat plasma levels of epinephrine, norepinephrine, and dopamine-beta-hydroxylase. Endocrinology 103: 1868–1874, 1978. [DOI] [PubMed] [Google Scholar]
- 23.Pech V, Pham TD, Hong S, Weinstein AM, Spencer KB, Duke BJ, Walp E, Kim YH, Sutliff RL, Bao HF, Eaton DC, Wall SM. Pendrin modulates ENaC function by changing luminal HCO3−. J Am Soc Nephrol 21: 1928–1941, 2010. [DOI] [PMC free article] [PubMed] [Google Scholar]
- 24.Pech V, Thumova M, Kim YH, Agazatian D, Hummler E, Rossier BC, Weinstein AM, Nanami M, Wall SM. ENaC inhibition stimulates Cl− secretion in the mouse cortical collecting duct through an NKCC1-dependent mechanism. Am J Physiol Renal Physiol 303: F45–F55, 2012. [DOI] [PMC free article] [PubMed] [Google Scholar]
- 25.Pollard HB, Pazoles CJ, Creutz CE, Scott JH, Zinder O, Hotchkiss A. An osmotic mechanism for exocytosis from dissociated chromaffin cells. J Biol Chem 259: 1114–1121, 1984. [PubMed] [Google Scholar]
- 26.Powers JF, Brachold JM, Ehsani SA, Tischler AS. Up-regulation of ret by reserpine in the adult rat adrenal medulla. Neuroscience 132: 605–612, 2005. [DOI] [PubMed] [Google Scholar]
- 27.Quentin F, Chambrey R, Trinh-Trang-Tan MM, Fysekidis M, Cambillau M, Paillard M, Aronson PS, Eladari D. The Cl−/HCO3− exchanger pendrin in the rat kidney is regulated in response to chronic alterations in chloride balance. Am J Physiol Renal Physiol 287: F1179–F1188, 2004. [DOI] [PubMed] [Google Scholar]
- 28.Reimold FR, Heneghan JF, Stewart AK, Zelikovic I, Vandorpe DH, Shmukler BE, Alper SL. Pendrin function and regulation in Xenopus oocytes. Cell Physiol Biochem 28: 435–450, 2011. [DOI] [PMC free article] [PubMed] [Google Scholar]
- 29.Royaux IE, Wall SM, Karniski LP, Everett LA, Suzuki K, Knepper MA, Green ED. Pendrin, encoded by the pendred syndrome gene, resides in the apical region of renal intercalated cells and mediates bicarbonate secretion. Proc Natl Acad Sci USA 98: 4221–4226, 2001. [DOI] [PMC free article] [PubMed] [Google Scholar]
- 30.Schinner S, Bornstein SR. Cortical-chromaffin cell interactions in the adrenal gland. Endocr Pathol 16: 91–98, 2005. [DOI] [PubMed] [Google Scholar]
- 31.Sealey JE, Clark I, Bull MB, Laragh JH. Potassium balance and the control of renin secretion. J Clin Invest 49: 2119–2127, 1970. [DOI] [PMC free article] [PubMed] [Google Scholar]
- 32.Shcheynikov N, Yang D, Wang Y, Zeng W, Karniski LP, So I, Wall SM, Muallem S. Slc26a4 functions as an electroneutral Cl-/I-/HCO3- exchanger: role of Slc26a4 and Slc26a6 in I- and HCO3- secretion and in regulation of CFTR in the parotid duct. J Physiol 586: 3814–3824, 2008. [DOI] [PMC free article] [PubMed] [Google Scholar]
- 33.Shepherd RM, Williams GH, Quinn SJ. Regulation of intracellular pH in single rat zona glomerulosa cells. Am J Physiol Cell Physiol 262: C182–C190, 1992. [DOI] [PubMed] [Google Scholar]
- 34.Shibata S, Rinehart J, Zhang J, Moeckel G, Castaneda-Bueno M, Stiegler AL, Boggon TJ, Gamba G, Lifton RP. Mineralocorticoid receptor phosphorylation regulates ligand binding and renal response to volume depletion and hyperkalemia. Cell Metab 18: 660–671, 2013. [DOI] [PMC free article] [PubMed] [Google Scholar]
- 35.Sutliff RL, Walp ER, Kim YH, Walker LA, El-Ali AM, Ma JJ, Bonsall R, Ramosevac S, Eaton DC, Verlander JW, Hansen L, Gleason RL, Pham TD, Hong S, Pech V, Wall SM. Contractile force is enhanced in aortas from pendrin-null mice due to stimulation of angiotensin II-dependent signaling. PLos One 9: e105101, 2014. [DOI] [PMC free article] [PubMed] [Google Scholar]
- 36.Takagi M, Atarashi K, Matsuoka H, Sugimoto T. A biphasic effect of noradrenaline on renin release from rat juxtaglomerular cells in vitro is mediated by alpha 1- and beta-adrenoceptors. J Endocrinol 132: 133–140, 1992. [DOI] [PubMed] [Google Scholar]
- 37.Timmermans W, Xiong H, Hoogenraad CC, Krugers HJ. Stress and excitatory synapses: from health to disease. Neuroscience 248: 626–636, 2013. [DOI] [PubMed] [Google Scholar]
- 38.Vandesompele J, De Preter K, Pattyn F, Poppe B, Van Roy N, De Paepe A, Speleman F. Accurate normalization of real-time quantitative RT-PCR data by geometric averaging of multiple internal control genes. Genome Biol 3: RESEARCH0034, 2002. [DOI] [PMC free article] [PubMed] [Google Scholar]
- 39.Verlander JW, Hassell KA, Royaux IE, Glapion DM, Wang ME, Everett LA, Green ED, Wall SM. Deoxycorticosterone upregulates PDS (Slc26a4) in mouse kidney: role of pendrin in mineralocorticoid-induced hypertension. Hypertension 42: 356–362, 2003. [DOI] [PubMed] [Google Scholar]
- 40.Verlander JW, Kim YH, Shin W, Pham TD, Hassell KA, Beierwaltes WH, Green ED, Everett L, Matthews SW, Wall SM. Dietary Cl− restriction upregulates pendrin expression within the apical plasma membrane of type B intercalated cells. Am J Physiol Renal Physiol 291: F833–F839, 2006. [DOI] [PubMed] [Google Scholar]
- 41.Wall SM, Hassell KA, Royaux IE, Green ED, Chang JY, Shipley GL, Verlander JW. Localization of pendrin in mouse kidney. Am J Physiol Renal Physiol 284: F229–F241, 2003. [DOI] [PubMed] [Google Scholar]
- 42.Wall SM, Kim YH, Stanley L, Glapion DM, Everett LA, Green ED, Verlander JW. NaCl restriction upregulates renal Slc26a4 through subcellular redistribution: role in Cl− conservation. Hypertension 44: 982–987, 2004. [DOI] [PubMed] [Google Scholar]
- 43.Weber CS, Thayer JF, Rudat M, Sharma AM, Perschel FH, Buchholz K, Deter HC. Salt-sensitive men show reduced heart rate variability, lower norepinephrine and enhanced cortisol during mental stress. J Hum Hypertens 22: 423–431, 2008. [DOI] [PubMed] [Google Scholar]
- 44.Welinder C, Ekblad L. Coomassie staining as loading control in western blot analysis. J Proteome Res 10: 1416–1419, 2011. [DOI] [PubMed] [Google Scholar]