

Abstract
Abstract
Despite numerous studies, there is no consensus about whether mitochondrial function is altered with increased age. The novelty of the present study is the determination of mitochondrial function at submaximal activity rates, which is more physiologically relevant than the ex vivo functionality protocols used previously. Muscle biopsies were taken from 64 old or young male subjects (aged 60–70 or 20–30 years). Aged subjects were recruited as trained or untrained. Muscle biopsies were used for the isolation of mitochondria and subsequent measurements of DNA repair, anti-oxidant capacity and mitochondrial protein levels (complexes I–V). Mitochondrial function was determined by simultaneous measurement of oxygen consumption, membrane potential and hydrogen peroxide emission using pyruvate + malate (PM) or succinate + rotenone (SR) as substrates. Proton leak was lower in aged subjects when determined at the same membrane potential and was unaffected by training status. State 3 respiration was lower in aged untrained subjects. This effect, however, was alleviated in aged trained subjects. H2O2 emission with PM was higher in aged subjects, and was exacerbated by training, although it was not changed when using SR. However, with a higher manganese superoxide dismuthase content, the trained aged subjects may actually have lower or similar mitochondrial superoxide emission compared to the untrained subjects. We conclude that ageing and the physical activity level in aged subjects are both related to changes in the intrinsic functionality of the mitochondrion in skeletal muscle. Both of these changes could be important factors in determining the metabolic health of the aged skeletal muscle cell.
Key points
The present study utilized a novel method aiming to investigate mitochondrial function in human skeletal muscle at submaximal levels and at a predefined membrane potential.
The effect of age and training status was investigated using a cross-sectional design.
Ageing was found to be related to decreased leak regardless of training status.
Increased training status was associated with increased mitochondrial hydrogen peroxide emission.
Introduction
The mitochondrial theory of ageing suggests that increased mitochondrial production of reactive oxygen species (ROS) causes oxidative damage, which alters cellular function, leading to age associated pathologies (Harman, 1972). Skeletal and heart muscles appears to be most affected by age-induced oxidative damage (Meissner et al. 2006) and numerous studies have investigated the effect of age on human skeletal muscle mitochondrial function (Trounce et al. 1989; McCully et al. 1993; Boffoli et al. 1996; Brierley et al. 1996; Barrientos et al. 1996; Chretien et al. 1998; Kent-Braun & Ng, 2000; Tonkonogi et al. 2003; Petersen, 2003; Rasmussen et al. 2003a,b; Capel et al. 2005; Short et al. 2005; Lanza et al. 2005; Amara et al. 2007; Hütter et al. 2007; Lanza et al. 2007; Lanza & Nair, 2008; Larsen et al. 2012a,b; Conley et al. 2013; Gouspillou et al. 2014; Broskey et al. 2014). However, surprisingly few studies have investigated whether mitochondrial ROS production is altered with increased age (Tonkonogi et al. 2003; Capel et al. 2005; Hütter et al. 2007; Ghosh et al. 2011). Despite the vast amount of studies being conducted, there is still no consensus about whether the mitochondrial function is decreased or not in aged human skeletal muscle. This inconsistency was suggested to be influenced by training status (Brierley et al. 1996; Barrientos et al. 1996; Lanza & Nair, 2008; Larsen et al. 2012a), which is rarely accounted for. Therefore, further studies investigating the effect of ageing on skeletal muscle mitochondria where the degree of physical activity is accounted or controlled for are warranted.
There are several experimental approaches for determining mitochondrial function, ranging from in vivo determinations of ATP levels and creatine-phosphate resynthesis (using phosphorus magnetic resonance spectroscopy), ex vivo functionality measurements of mitochondria in permeabilized tissue and isolated mitochondria and in vitro assessments of mitochondria in intact or permeabilized cultured cells. The most common assay used to determine mitochondrial function is respiratory measurements. Traditional protocols determine State 2, State 3, uncoupled and/or State 4 respiration with the use of different types of substrates and inhibitors to isolate different pathways of the mitochondrion. These states represent the limits of mitochondrial capacity, representing conditions that are probably unphysiological. Alternatively, and more physiologically relevant, mitochondrial function can be determined under submaximal conditions where inhibitors, ADP or substrates are titrated to induce a stepwise increase or decrease in the measurement of interest. By combining measurements of membrane potential and respiration, modular kinetic analysis or top-down control analysis can be conducted (Amo & Brand, 2007). Thus, the functionality of the membrane potential generating module, ATP utilizing module and proton leak module, etc. can be determined. The informational value of this type of analysis is very high, although the data analysis is complex and the measurements require a relatively large amount of isolated mitochondria, comprising amounts that may not be available, for example, when using human biopsies. Alternatively, a more simplistic but still very informative measurement of coupling efficiency at submaximal respiratory rates can be calculated. Coupling efficiency is defined as the percentage of respiration that is coupled to ATP synthesis. This value can be calculated after establishing the kinetic relationship between membrane potential and coupled respiration, as well as membrane potential and proton leak respiration (Amo & Brand, 2007). For comparison between subjects, the coupling efficiency can be determined at the same membrane potential in all subjects.
The present study aimed to establish and apply measurements of submaximal mitochondrial function in human skeletal muscle biopsy samples. The novelty of the present study is the determination of the coupling efficiency at a predefined submaximal membrane potential in young and aged men, with the latter group stratified into two subgroups according to their training status. Furthermore, we also determined mitochondrial H2O2 emission during conventional State 2, 3 and 4 respiration, and under submaximal conditions, at a predefined membrane potential in all subjects.
Methods
Ethical approval
Subjects were informed orally and in writing about the purpose of the present study, the experimental procedures and all of the potential risks prior to them providing their written consent to participate. The study was approved by the local ethics committee of Frederiksberg and Copenhagen municipality (H-2-2009-121) and was performed in accordance with the Declaration of Helsinki.
Subject characteristics
Sixty-four males were recruited through advertisement in newspapers and on relevant webpages. Criteria for inclusion were: males, non-smokers, body mass index (BMI) in the range 20–28 kg m−2, stable body weight (±2 kg) over the past 6 months, age group 20–30 years (termed ‘young’) or age group 60–70 years (termed ‘aged’).
Exclusion criteria were: prescribed medication, family history of type 2 diabetes or cardiovascular disease. In the aged group of subjects, subjects were recruited as either physically active (PA), participating in moderate to hard physical aerobic training for a minimum of three times per week or physically inactive (PI), no participation in any organized types of aerobic training. All of the young subjects had an active lifestyle and only one was a highly trained athlete. Collectively, they were regarded as a representative group of young recreational active subjects.
Subject laboratory testing
Subjects reported to the laboratory on two occasions. On the first visit, subjects completed a questionnaire about general health and lifestyle, and about the degree of daily physical activity (International Physical Activity Questionnaire) (Craig et al. 2003). Bodyweight and height were measured, body composition was determined using a dual-energy X-ray absorptiometry scan (Lunar Prodigy Advance; Lunar, Madison WI, USA) and, finally, subjects completed an incremental cycle exercise test to determine maximal oxygen uptake ( ) (Oxycon Pro, Jaeger, Würzburg, Germany). On the second visit, subjects came to the laboratory after an overnight fast (12 h) and were instructed not to engage in any kind of physical training for 48 h prior to the visit. After a 30 min supine resting period, resting oxygen consumption (Oxycon Pro) and resting heart rate (Polar, Kempele, Finland) were determined. Subsequently, a resting blood sample was taken followed by a muscle biopsy taken from the vastus lateralis. The muscle biopsy (∼300 mg) was divided into two parts. One part (100–200 mg) was placed in ice-cold isolation buffer containing (mmol l−1): 100 sucrose, 100 KCl, 50 Tris-HCl, 1 KH2PO4, 0.1 EGTA and 0.2% BSA (pH 7.40) for mitochondrial isolation. The remaining part was frozen in liquid nitrogen and stored at –80°C for later analysis of enzyme activities, DNA repair enzymes and protein content (western blotting).
After a 30–60 min resting period, subjects completed an oral glucose tolerance test where blood samples were taken every 30 min for 120 min after ingesting 75 g of glucose dissolved in 400 ml of water. Blood samples were centrifuged and plasma was stored for later analysis of glucose (YSI STAT 2300; YSI Inc., Yellow springs, OH, USA) and insulin (enzyme-linked immunosorbent assay; Dako K6219; Elektrabox Diagnostics, Rodovre, Denmark) concentrations.
Finally, daily energy intake and the relative energy distribution from carbohydrate, lipid, protein and alcohol were calculated from a 3 day food registration. All subjects were told to carefully weigh and record all foods and drinks consumed. The recordings were processed using appropriate software (Dankost 3000; Dankost, Copenhagen, Denmark).
Western blotting
Approximately 20 mg of muscle tissue was homogenized in RIPA buffer with added phosphatase and protease inhibitors, comprising (mmol l−1): 20 β-glycerophosphate, 2 sodium orthovanadate, 10 pyrophosphate, 100 phenylmethylsulphonyl fluoride and Complete Mini EDTA free protease inhibitor tablet, in accordance with the manufacturer’s instructions. Samples were separated by SDS–PAGE and transferred to polyvinylidene difluoride membranes. The membranes were probed with antibodies against either the subunits of each of the five complexes driving the mitochondrial oxidative phosphorylation: complex I (the 20 kDa subunit encoded by NDUFB8), complex II (the 30 kDa subunit), complex III (the 43 kDa core protein 2 subunit), complex IV (the 22 kDa subunit II) and complex V (the 55 kDa subunit α), all mixed in the Mitoprofile Human Total OXPHOS Human WB Antibody Cocktail (ab110411; Abcam, Cambridge, MA, USA; dilution 1:210) or the manganous superoxide dismutase (MnSOD) (06-984; Millipore, Billerica, MA, USA; dilution 1:1000), catalase (AF3398; R&D Systems, Minneapolis, MN, USA; dilution 1:3000) and gluthathion peroxidase 1 (GPX1) (3206; Cell Signaling Technology, Beverly, MA, USA; dilution 1:500), followed by incubation with HRP-labelled secondary antibody (Dako, Glostrup, Denmark). The antigen–antibody complexes were visualized by electrochemiluminescence using a CCD system (LAS-4000; Luminescent Image Analyser; GE Healthcare, Little Chalfont, UK) and quantitated using ImageQuant TL 7.0.1.0 software (GE Healthcare). The WB calibrator homogenate was included three times on each gel. All of the other samples were measured relative to the mean value of the WB calibrator sample for each specific band.
Mitochondrial isolation
The major part of the muscle biopsy was used for mitochondrial isolation as described previously (Tonkonogi & Sahlin, 1997) using protease (0.2 mg ml−1 protease; Subtilisin Carlsberg; EC 232-752-2, type VIII; Sigma, St Louis, MO, USA) and different centrifugation steps to isolate the mitochondria from the rest of the cellular compartments. The resulting pellet was dissolved and resuspended in a suspension medium containing (mmol l−1): 225 mannitol, 75 sucrose, 10 Tris, 0.1 EDTA and 0.2% BSA (pH 7.40). Part of the mitochondrial suspension was used for the functional assays and the remaining part was frozen in liquid nitrogen and stored at –80˚C for later assay of citrate synthase (CS) activity (as described above) and total protein (BCA protein assay; Sigma) as markers of mitochondrial content.
Protocol for determination of intrinsic mitochondrial function
Mitochondrial respiration, H2O2 emission and membrane potential were determined simultaneously but in separate cuvettes/chambers. Except for some method-specific measurements (described below), the protocols for these three assays were identical (for representative traces, see Fig. 1). Mir05 was used as assay buffer, comprising (mmol l−1): 110 sucrose, 60 potassium lactobionate, 0.5. EGTA, 3 MgCl2·6H2O, 20 taurine, 10 KH2PO4, 20 Hepes and 1 g/l BSA (pH 7.1) at 37°C; and two protocols of substrate combinations were used: pyruvate + malate (PM protocol; both 5 mmol l−1) or succinate + rotenone (SR protocol; 10 mmol l−1 and 2 μmol l−1, respectively). The use of selective substrates and an inhibitor of complex I obviously only activates parts of the mitochondrial enzymatic pathway and may appear less physiologically relevant. However, the submaximal conditions will vary the reduced state of the involved enzymes, thereby mimicking the physiological state. The use of specific substrates and inhibitors will enable the pinpointing of specific pathways that are affected differently in the aged and trained state.
Figure 1.
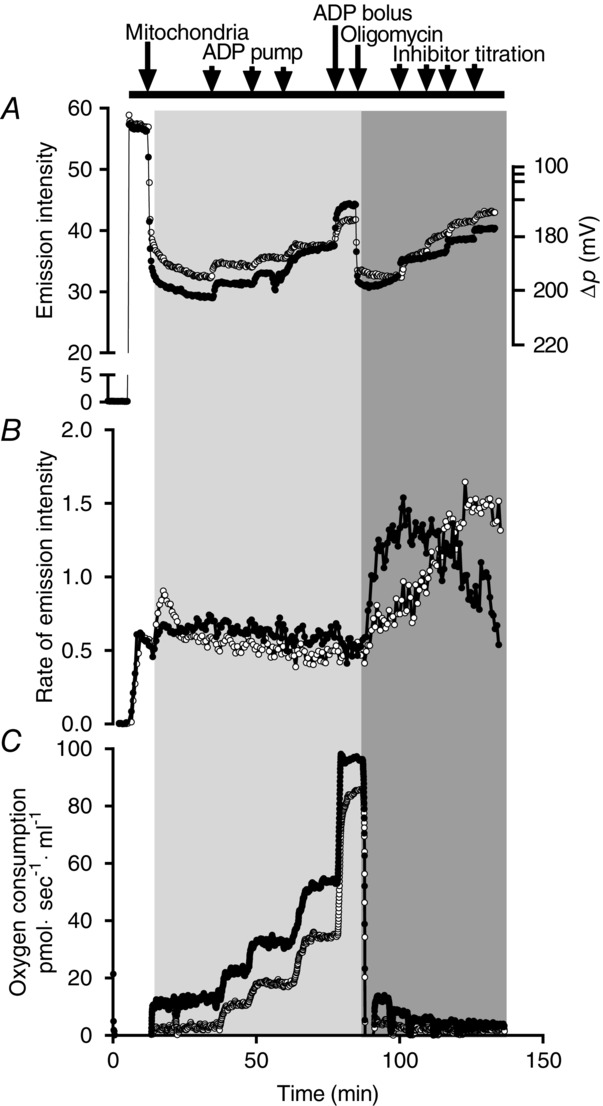
Protocol and representative traces
Mitochondrial membrane potential using TMRM (A), Rate of H2O2 emission using Amplex Red, HRP and SOD (B) and respiration (C). Black filled circles (•) indictate when using SR (with malonate as an inhibitor) and open circles (○) indictate when using PM (with rotenone as an inhibitor). The light grey area represents the phosphorylating part of the protocol and the darker grey area represents the non-phosphorylating part. Traces are from an aged trained subject.
The common parts of the protocols were: after establishing stable rates (oxygen consumption and H2O2 emission) and levels (membrane potential), and in the presence of substrates and mitochondria (defined here as ‘State 2’), submaximal activity was induced by continuous ADP infusion using microdialysis pumps (CMA Microdialysis, Kista, Sweden). Subsequently, three steps (0.2, 0.4 and 0.8 μl min−1) of ADP infusion were assessed before a bolus of ADP was added (corresponding to 1 mmol l−1 ADP) to induce maximal mitochondrial activity (State 3). This part of the protocols is termed the phosphorylating part. Subsequently, oligomycin (0.1 μg l−1) was added to induce State 4o followed by three titration steps of either malonate (SR protocol, 1.6 mmol l−1 per step) or rotenone (PM protocol, 6 nmol l−1 per step). This part of the protocol (oligomycin and inhibitor titration) was termed the non-phosphorylating part. All three inhibitory steps resulted in partial inhibition of mitochondrial activity and thus caused a stepwise decrease (respiration, membrane potential and succinate H2O2 emission) or increase (pyruvate H2O2 emission) in the signal. Protocols were ended by adding a bolus of malonate (8 mmol l−1) or rotenone (0.3 μmol l−1) to completely block electron entry through complex II or I, respectively. As seen in Fig. 1B, titration of rotenone to the PM protocol caused a stepwise increased mitochondrial H2O2 emission. At saturating rotenone concentrations, maximal H2O2 emission was obtained defined as PM H2O2 max. H2O2 max during the SR protocol was obtained after the addition of oligomycin (State 4o).
Specific for mitochondrial respiration
The respiratory analysis (Oxygraph O2k; Oroboros Instruments, Innsbruck, Austria) was also used as a quality control measurement by calculating the respiratory control index (RCI = State 3 divided with State 4o). RCI values below 5 when using SR and below 7 when using PM were categorized as being of poor quality. If RCI was low in both protocols, the specific subject were excluded from all other analysis.
Specific for mitochondrial H2O2 emission
H2O2 emission was determined fluorometrically (Xenius XC; SAFAS, Monaco) using Amplex Red (50 μmol l−1) at excitation wavelength 560 nm and emission wavelength 590 nm, catalysed by HRP (5 U ml−1) with the addition of exogenous superoxide dismutase (SOD; 5 KU ml−1) as described previously (Quinlan et al. 2013). Pilot experiments confirmed that these concentrations of Amplex Red, HRP and SOD did not alter State 2, 3 or 4o respiration (data not shown). The background rate was determined before the addition of mitochondria and subtracted from all other values (described below) and a correction coefficient was applied to correct for the non-linear relationship between resurofin accumulation and H2O2 concentration (described below). Emission rate was converted to H2O2 production by use of a standard curve.
Specific for determination of mitochondrial membrane potential
Inner mitochondrial membrane potential was determined using tetramethylrhodamine methyl ester (TMRM) at excitation wavelength 554 nm and emission wavelength 574 nm (Xenius XC, SAFAS, Monaco). The TMRM concentration was 0.56 μmol l−1, which, according to previous studies (Scaduto & Grotyohann, 1999), does not interfere with the mitochondrial respiratory function. This concentration is relatively low compared to that used previously (Orr et al. 2012), which raised concerns about whether the concentration would be sufficiently high to be in quench mode. However, pilot experiments using human isolated mitochondria disproved our concern because the TMRM signal showed the expected response to substrates and inhibitors (data not shown). The membrane potential protocol was finalized by adding 1 mmol l−1 NaOH to collapse the membrane potential [carbonyl cyanide-4-(trifluoromethoxy)phenylhydrazone (FCCP) gave the same result]. This value was defined as the zero membrane potential point.
Absolute values of the membrane potential were calculated as described by Scaduto & Grotyohann (1999). Briefly, for each rate, total TMRM uptake per mitochondrion were calculated as TMRM mg protein–1 (termed [TMRM]t). This value was used to calculate the concentration of free TMRM in the matrix [termed (TMRM)m] in units of nmol μl−1 using the rearranged equation from Scaduto & Grotyohann (1999):
where (TMRM)o is the TMRM concentration outside the mitochondria, and Ko and Ki are the binding partition coefficients outside and inside the mitochondria, respectively. In the present study, Ki and Ko values (25 and 95) were adopted from the study by Scaduto & Grotyohann (1999) where these values were determined in rat heart muscle mitochondria. After determining the (TMRM)m, the absolute membrane potential (mV) was calculated using the Nernst equation (37°C):
Enzyme activities
CS activity was measured in the mitochondrial rich suspension buffer using spectrophotometry. The thawed mitochondria rich suspension was spun down at 4°C to ensure that no material was left on the sides of the plastic tubes. The resulting pellet was diluted 50 times in a solution containing (final concentration in mmol l−1): 0.3 KH2PO4, 0.05% BSA and 0.01% Triton X-100 (pH 7.7). This homogenate was then diluted 50 times in an assay buffer containing (final concentration in mmol l−1): 0.33 acetyl-CoA, 0.6 oxaloacetate, 0.157 5,5′-dithiobis-(2-nitrobenzoic acid) (DTNB) and 30 Tris-HCl (pH 8.0). The change in DTNB to 2-nitro-5-thiobenzoic acid (TNB) at 37°C was started with the addition of oxaloacetate and measured spectrophotometrically at 415 nm (Srere, 1969) on an automatic analyser (Cobas 6000, C 501; Roche Diagnostics, Mannheim, Germany).
In addition, CS activity and β-hydroxyacyl-CoA dehydrogenase (HAD) activities were measured in muscle homogenate using spectrophotometry, as described previously (Srere, 1969; Lowry & Passonneau, 1972) but with some modifications. Briefly, ∼2 mg of dry weight were homogenized in 600 μl of phosphate buffer (in 0.3 mol l−1 K2HPO4, 0.05% BSA, pH 7.7) for 2 min on a Tissue lyser (Qiagen, Venlo, Limburg, Netherlands). Samples were incubated with 1% Triton X-100 (final concentration) for 15 min on ice and then stored at −80°C for later analysis.
Specific for CS analysis
The muscle homogenate was diluted 50 times in a CS activity specific assay buffer (mmol l−1): 0.33 acetyl-CoA, 0.6 oxaloacetate, 0.157 DTNB and 39 Tris-HCl (pH 8.0). The change in DTNB to TNB at 37°C was measured spectrophotometrically at 415 nm (Cobas 6000, C 501; Roche Diagnostics).
Specific for HAD analysis
The homogenate was diluted 70 times in a HAD activity specific assay buffer containing (mmol·l−1): 0.33 acetoacetyl-CoA, 0.18 NADH, 0.04 EDTA, 27 imidazole (pH 7.0). The changes in NADH at 37°C were measured spectrophotometrically at 340 nm on an automatic analyser (Cobas 6000, C 501; Roche Diagnostics).
Enzyme activities are expressed as micromoles substrate per minute per gram wet weight of muscle tissue or per μl mitochondrial rich suspension buffer.
Myosin heavy chain analysis
From the western blot homogenates, ∼25 μg of total protein were separated for 48 h at 10°C by SDS-PAGE with 8.35% polyacrylamide and 30% glycerol. Gels were stained with Coomassie Blue and the ratio of the three myosin heavy chain isoforms I, IIA and IIX was determinated by densitometry using a CCD system (LAS-4000; GE Healthcare) and quantified using ImageQuant TL, version 7.0.1.0 (GE Healthcare) as described previously (Andersen & Aagaard, 2000).
Activity of mitochondrial DNA (mtDNA) repair enzymes
Mitochondrial purification
Mitochondria were isolated from ∼80–100 mg wet weight. All sample handling was performed on ice, and all centrifugation was conducted at 4°C. Muscle samples were fragmented using a scalpel and transferred to a glass/Teflon homogenizer with 10 ml of ATP buffer (mmol l−1): 100 KCl, 50 Tris base, 5 MgSO4, 1 EDTA, 1 ATP and 0.5% w/v BSA (pH 7.4). The nuclear fraction was isolated by centrifugation in glass tubes at 1000 g for 20 min. The extranuclear fraction was further clarified by centrifugation at 1000 g for 20 min, to avoid contamination by nuclear DNA repair enzymes, after which cytosolic and mitochondrial fractions were separated by centrifugation at 10,000 g for 10 min. The mitochondrial pellets was gradually resuspended in 1.4 ml of KCl buffer (mmol l−1): 100 KCl, 50 Tris base, 5 MgSO4 and 1 EDTA (pH 7.4) to wash away ATP, then centrifuged at 6700 g for 10 min in 1.5 ml tubes. The pellet was resuspended in 200 μl of lysis buffer (mmol l−1): 400 KCl, 1 EDTA, 10 Tris HCl, 1 dithiothreitol, 0.25 phenylmethylsulphonyl fluoride, 1 × Roche protease inhibitor cocktail, 0.1% w/v NP-40 and 20% v/v glycerol (pH 7.8). Incubation for 90 min in rotator at 4°C, was followed by sonication at 1.7 W for three cycles of 5 s of sonication/30 s on ice. The lysate was centrifuged at 150,000 g for 1 h, then dialysed against dialysis buffer (mmol l−1): 100 KCl, 1 EDTA, 5 Hepes KOH, 12 MgCl2, 1 dithiothreitol and 17% v/v glycerol (pH 7.5,) in a 10 kDa cut-off cassette overnight at 4°C. Dialysed samples were centrifuged at 16,000 g for 10 min, and the supernatant was collected and frozen in liquid nitrogen and stored at −80°C for DNA repair assays. Purity of mitochondrial samples was verified by western blotting against COXIV (present only in mitochondrial fraction) and proliferating cell nuclear antigen (absent from mitochondrial fraction) using antibodies (PC10 and H84, respectively) from Santa Cruz Biotechnologies Inc. (Dallas, TX, USA).
Incision assays
For the protocol used to measure apurinic/apyrimidinic endonuclease 1 (APE1) incision activity: one strand of the target substrate (a 28 bp dimer containing tetrahydrofuran as an AP site) was labelled 5’ with 32P; 1 pmol l−1 labelled substrate was then incubated with 100 ng of protein from mitochondrial lysate, in APE1 incision buffer (mmol l−1): 52.5 Hepes-KOH, 60 KCl, 0.1 EDTA, 11.2 ; MgCl2, 100 mg l−1 BSA, 11.7% v/v glycerol and 0.05% w/v Triton X-100 (pH 7.5) at 37°C for 30 min. Reactions were stopped with formamide and the samples were heated to 90°C for 10 min, then run on a 20% denaturing PAGE gel. Activity was quantified as the signal intensity of the cleaved substrate vs. total (cleaved and uncleaved) substrate signal. Purified enzyme was used as a positive control, and incubation without protein was used as a negative control.
The same assay was used to measure 8-oxoguanine DNA glycosylase 1 (OGG1) activity, with changes aiming to accommodate lower enzymatic activity: labelled substrate was incubated 24 h at 37°C (in a PCR machine), with 1 μg of protein. The OGG1 reaction buffer contained (mmol l−1): 72.5 Hepes-KOH, 75 NaCl, 10 KCl, 10.1 EDTA, 5 EGTA, 11.7% v/v glycerol and 0.05% w/v Triton X-100 (pH 7.5). The labelled substrate contained an 8-oxo-G site in place of tetrahydrofuran.
Data processing
Numerous studies have conducted functional analysis similar to the one described in the present study (Ciapaite et al. 2005; Amo & Brand, 2007; Affourtit et al. 2012); however, these previous studies were conducted using rodent tissues (skeletal muscle and liver tissue) with a high amount of available tissue and therefore large quantities of isolated mitochondria. In the present study, we used tissue from human skeletal muscle, which limits the final amount of isolated mitochondria (∼1 mg of protein in total). This limited amount of mitochondria combined with the relatively complex nature of the protocols presented a number of technical challenges, for which we attempted to compensate. A description of these is provided below.
Measurement of mitochondrial content
In previous experiments, we (unpublished data) and others (Wibom et al. 1990) have observed that, as soon as the mitochondria are isolated, they start to loose respiratory capacity. For this reason, we prioritized not to spend time on assessing mitochondrial content prior to the measurements but, instead, re-suspended the final mitochondrial pellet to an approximate concentration that was similar between all subjects. A small aliquot of the mitochondria rich suspension buffer was frozen in liquid nitrogen and stored for later analysis of mitochondrial content. We have previously shown that CS activity is a good marker of mitochondrial content (Larsen et al. 2012c) and have used this measure as a nominator for mitochondrial respiration and H2O2 production in previous studies (Hey-Mogensen et al. 2010, 2011). However, in the literature, it is much more common to use the amount of total protein and this value is also essential for calculating the mitochondrial membrane potential (Scaduto & Grotyohann, 1999). For this reason, we determined both protein content and CS activity in the mitochondria rich suspension buffer. In accordance with previous studies (Figueiredo et al. 2009), we found a larger variation in the protein measurements than in the CS activity measurements. This is probably the result of a higher susceptibility of the protein measure to contamination by non-mitochondrial protein, especially in small-scale isolation procedures. Accordingly, we correlated these two measurements with data from the present and an unpublished study (n = 203, r2 = 0.4157). Ten outliers were excluded using the ROUT method with a false discovery rate <1% (Motulsky & Brown, 2006). A linear curve fit was subsequently determined based on the final relationship and the resulting equation [mg protein = 0.000261· (CS act) + 1.49] was used to convert the measured CS activity to mg protein.
Amplex Red background correction
In the presence of a peroxidase, Amplex Red causes a small background rate, even in absence of biological material. In our hands, when using Mir05 as assay medium, this background rate corresponds to ∼30 pmol H2O2 min–1. The addition of mitochondria quenches this background rate (St-Pierre, 2002). Whether this is a result of a change in the optical properties with the addition of the mitochondria or the result of mitochondrial scavenging of the potential presence of minute amounts of H2O2 in the buffer is unknown. We do note that the H2O2 emission rate in the presence of isolated mitochondria slowly decreases over time, which we assume is because of depletion of endogenous mitochondrial substrates. Full depletion is reached after ∼10–15 min.
Even though the most correct background rate (to be subtracted from the rates of interest) would be the rate in the presence of substrate-depleted mitochondria, we aimed to avoid the waiting period where mitochondria (as described above) might lose functionality. Instead, we used the background rate without mitochondria. This meant that, after background correction, H2O2 emission rates became negative during ADP infusion in five subjects. Because the overall purpose of the present study was a comparison of the different groups and not an investigation of the absolute H2O2 emission, we reasoned that this would have no significant influence on our conclusion.
Correction for non-linear Resurofin–H2O2 relationship
The relationship between resurofin and H2O2 is not linear (Brotea & Thibert, 1988; Mohanty et al. 1997). It was suggested that it is the result of resurofin generating an optical inner filter or, at high concentrations, resurofin reacting directly with H2O2, generating a non-fluorescent compound (Brotea & Thibert, 1988; Mohanty et al. 1997). This will underestimate the mitochondrial H2O2 if the conversion factor from the fluorescence signal to H2O2 production is based on a linear relationship, especially if the H2O2 production is determined at high resurofin concentrations.
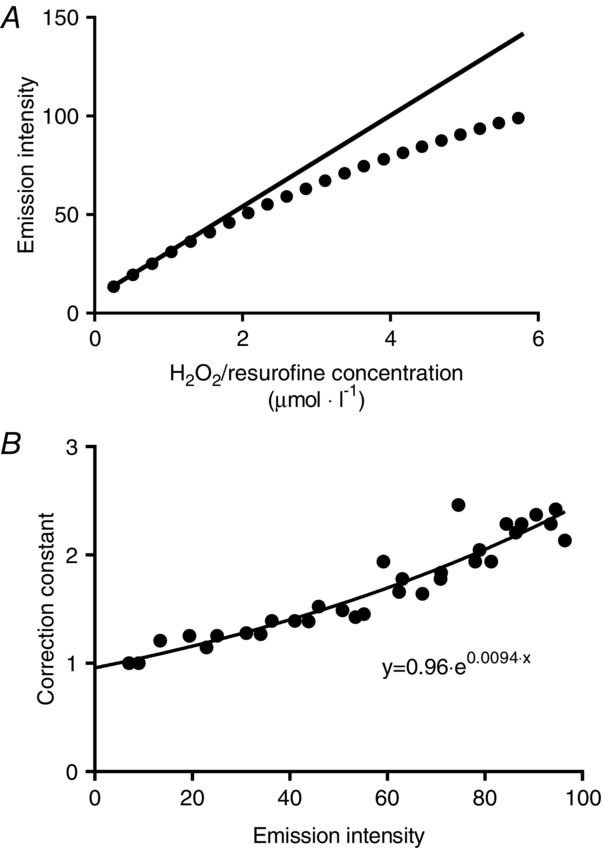
The non-linear relationship between resurofin and H2O2 concentration in our system can be seen in Fig.2A. Validation experiments confirmed that this non-linear relationship was not the result of H2O2 stock decay or time exposure of the H2O2 detection system (Amplex Red, HRP and SOD) to the cuvette conditions (37°C, stirring and ongoing excitation, as well as potential photo oxidation). In the initial part of the curve shown in Fig.2A, the ratio between the delta change in the emission intensity and the added H2O2 is constant. The ratio in this part of the curve was defined and assumed to be the ‘true ratio’. The fold difference between the true ratio and the ratios at higher H2O2/resurofin concentration was plotted against the corresponding emission intensity. This relationship followed an exponential fit and the resulting equation [correction constant = 0.96·e(0.0094·EMI)] (Fig.2B) was used to calculate a correction constant to account for the non-linear relationship between H2O2/resurofin concentration and the emission intensity. Correction constants were calculated for all rates and multiplied, based on the emission intensity at the given rate.
Figure 2.
Conversion factor calculation
Example of the non-linearity in the relationship between H2O2/resurofin concentration and the resulting emission intensity (A) and the relationship between the correction constant and the emission intensity (B). The resulting equation in (B) was used to correct all H2O2 emission data for the non-linearity shown in (A).
Data analysis
Mitochondrial respiration and H2O2 emission at submaximal membrane potentials
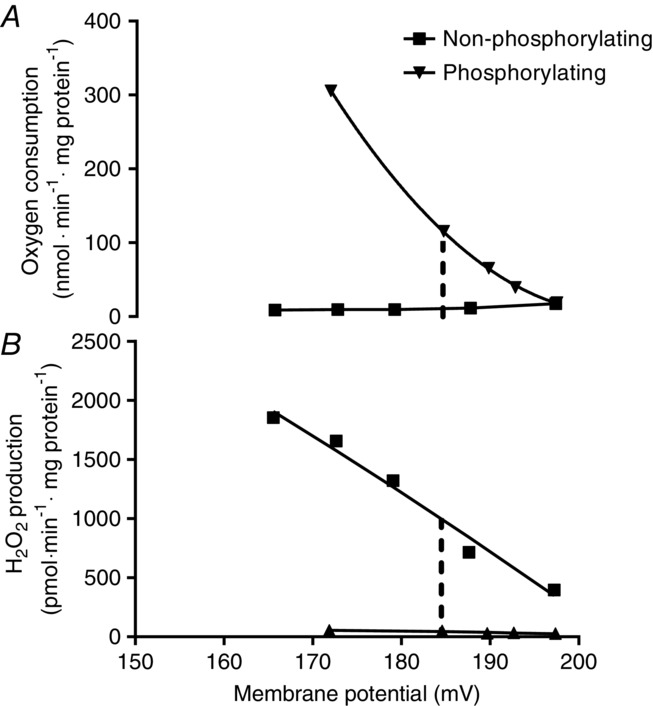
Respiration and H2O2 emission were both related to the corresponding values of membrane potential for all steps of the protocol (see representative curves in Fig. 3). The rationale for this was that we aimed to normalize for the proton motive force, which drives protons through the ATP-synthase and leak pathways, between all subjects. The rationale for relating the H2O2 emission to the membrane potential was based on the assumption that the membrane potential would represent the overall reduced state of the mitochondrion, especially during the phosphorylating part of the protocol. The resulting curves all fitted well to a second-order polynomial fit. The individual curve fit equations were used to calculate the phosphorylating and non-phosphorylating respiration and H2O2 emission, at a predefined absolute membrane potential (175 mV). For characterization of mitochondrial leak and proton pumping through ATP synthesis (ATP-production related respiration), these values were considered as the most interesting. However, with regard to physiological relevance, this value does not take into account the individual variation in the membrane potential range between human subjects. Therefore, we also calculated respiration and H2O2 emission at a predefined relative membrane potential corresponding to 50% of the range between State 2 and State 3 (phosphorylating range). The relative value was regarded as the most physiologically relevant value.
Figure 3.
Representative data on respiration, H2O2 emission and membrane potential
Relationship between respiration and H2O2 emission to the corresponding values of membrane potential when using PM (Fig. 1). These curves were generated for the calculation of submaximal respiration (A) and H2O2 emission (B) at 50% of the available phosphorylating membrane potential (in this case 186 mV). Traces show respiration and H2O2 emission under phosphorylating (ADP pump infusion, ▾) and non-phosphorylating (oligomycin+inhibitor, which in this case is rotenone, ■) conditions. Data are from an aged trained subject.
Two respiratory components were calculated at the submaximal membrane potentials: leak-respiration, which is the non-phosphorylating respiration, and ATP-production related respiration, which is the leak-respiration subtracted from the total-respiration determined at every ADP stimulated respiration. These two values were used to calculate the coupling efficiency, which is defined as the percentage of the total respiration used for ATP production.
Unfortunately, the data from the ADP-pump stimulated H2O2 emission had to be excluded for technical reasons, where a miscalculation made it invalid to correlate the data to the membrane potential. For this reason, only the non-phosphorylating part of the data were used to calculate the H2O2 emission at the submaximal membrane potential.
Chemicals
All chemicals and reagents were purchased from Sigma, except Amplex Red, which was obtained from Life Technologies (Grand Island, NY, USA).
Statistical analysis
When testing for the effect of age, the young group was compared with both aged groups combined using one-way ANOVA. When testing for the effect of training status, the aged untrained group was compared with the aged trained group using one-way ANOVA (Prism, version 6.1; Graphpad Software Inc., La Jolla, CA, USA). When relevant (as stated in the text), one-way ANOVA with repeated measurements was used to test for potential changes in different respiratory states within subjects. P < 0.05 was considered statistically significant. All data are reported as the mean ± SEM.
Results
Subject inclusion and exclusion
Twenty-four young and 29 aged subjects were included in the data analysis. The exclusion of the remaining subjects was either a result of limited tissue availability (n = 4), subjects not completing muscle biopsy sampling (n = 3) or low mitochondrial quality (n = 4). The characteristics of the included subjects are provided in Table1.
Table 1.
Subject characteristics
| Young | Aged | Trained | Untrained | ||
|---|---|---|---|---|---|
| Age | (years) | 23.2 ± 0.3# | 65.1 ± 0.6 | 63.9 ± 0.8* | 66.4 ± 0.9 |
| Height | (cm) | 183 ± 1 | 179 ± 1 | 180 ± 2 | 179 ± 2 |
| Weight | (kg) | 76.5 ± 1.5 | 79.2 ± 1.8 | 77.8 ± 2.1 | 80.7 ± 3.1 |
| Fat mass | (%) | 17.6 ± 0.8# | 25.2 ± 1.3 | 20.6 ± 1.4* | 29.7 ± 1.5 |
| BMI | (kg m−2) | 22.9 ± 0.4# | 24.6 ± 0.4 | 24.0 ± 0.5 | 25.3 ± 0.6 |
 |
(l min−1) | 3901 ± 100# | 2928 ± 118 | 3286 ± 133* | 2517 ± 132 |
| (ml min−1 kg−1) | 51.2 ± 1.2# | 37.1 ± 1.5 | 42.4 ± 1.5* | 30.8 ± 1.7 | |
| Maximum heart rate | (beats min–1) | 192 ± 2# | 163 ± 2 | 167 ± 3 | 159 ± 4 |
| Resting heart rate | (beats min–1) | 58 ± 2 | 58 ± 2 | 55 ± 2* | 64 ± 3 |
Resting 
|
(l min−1) | 253 ± 6 | 237 ± 6 | 238 ± 8 | 237 ± 11 |
| Fasting plasma glucose | (mmol l−1) | 5.1 ± 0.1 | 5.6 ± 0.1 | 5.7 ± 0.1 | 5.5 ± 0.2 |
| 120 min of plasma glucose | (mmol l−1) | 5.5 ± 0.3 | 6.7 ± 0.4 | 6.0 ± 0.5 | 7.4 ± 0.5 |
| Fasting plasma insulin | (pmol l−1) | 43 ± 16 | 87 ± 35 | 78 ± 52 | 97 ± 47 |
| 120 min of plasma insulin | (pmol l−1) | 108 ± 11 | 231 ± 48 | 145 ± 56 | 329 ± 74 |
| Daily energy intake | (MJ) | 11.0 ± 0.7 | 10.4 ± 0.5 | 11.1 ± 0.7 | 10.0 ± 0.6 |
| Carbohydrate intake | (%) | 49.8 ± 1.7 | 50.1 ± 1.6 | 52.6 ± 2.7 | 47.6 ± 1.7 |
| Lipid intake | (%) | 32.9 ± 1.6 | 29.9 ± 1.3 | 28.0 ± 2.2 | 31.7 ± 1.3 |
| Protein intake | (%) | 15.1 ± 0.7 | 16.1 ± 0.8 | 17.4 ± 1.4 | 14.8 ± 0.6 |
| Alcohol intake | (%) | 2.2 ± 0.8 | 3.9 ± 1.0 | 1.9 ± 0.8* | 5.9 ± 1.7 |
| Physical activity | |||||
| Hard exercise | Days week–1 | 2.9 ± 0.3 | 2.6 ± 0.4 | 3.4 ± 0.4* | 1.9 ± 0.5 |
| Hours occurrence–1 | 0.9 ± 0.2 | 0.9 ± 0.2 | 0.9 ± 0.1 | 1.0 ± 0.4 | |
| Moderate exercise | Days week–1 | 4.0 ± 0.5 | 3.3 ± 0.4 | 4.0 ± 0.6* | 2.5 ± 0.5 |
| Hours occurrence–1 | 1.1 ± 0.2 | 1.1 ± 0.2 | 1.6 ± 0.4* | 0.7 ± 0.2 |
 , maximal oxygen uptake. Data are the mean ± SEM from 24 young recreationally active men, 14 middle-aged untrained men and 15 middle-aged trained men.
Significantly different from young untrained group (P < 0.05).
Significantly different from aged group (P < 0.05).
None of the subjects had any signs of hyperglycaemia (fasting plasma glucose >7 mmol l−1). Two of the aged trained and five of the aged untrained subjects showed signs of impaired glucose tolerance (blood glucose >7.8 mmol l−1, 120 min after a 75 g glucose challenge) (Table1). The two trained subjects and two of the untrained subjects had the oral glucose tolerance test repeated (local physician) and there were no signs of impaired glucose tolerance. All seven subjects were included in the data analysis, assuming that this is a reflection of normal variation in the population.
Anthropometry and lifestyle characteristics
Compared to aged subjects, young subjects had a significantly lower fat mass (P < 0.001) and BMI (P = 0.003), as well as significantly higher  (P < 0.001) and maximum heart rate (P < 0.001). Although we attempted to match the two aged groups, trained subjects had a significantly lower age (P = 0.04) and lower alcohol consumption. As expected, aged trained subjects had a lower fat mass (P < 0.001), a lower resting heart rate (P = 0.01), higher
  (P < 0.001) and a higher physical activity level (all P < 0.05) compared to aged untrained subjects.
Muscle characteristics
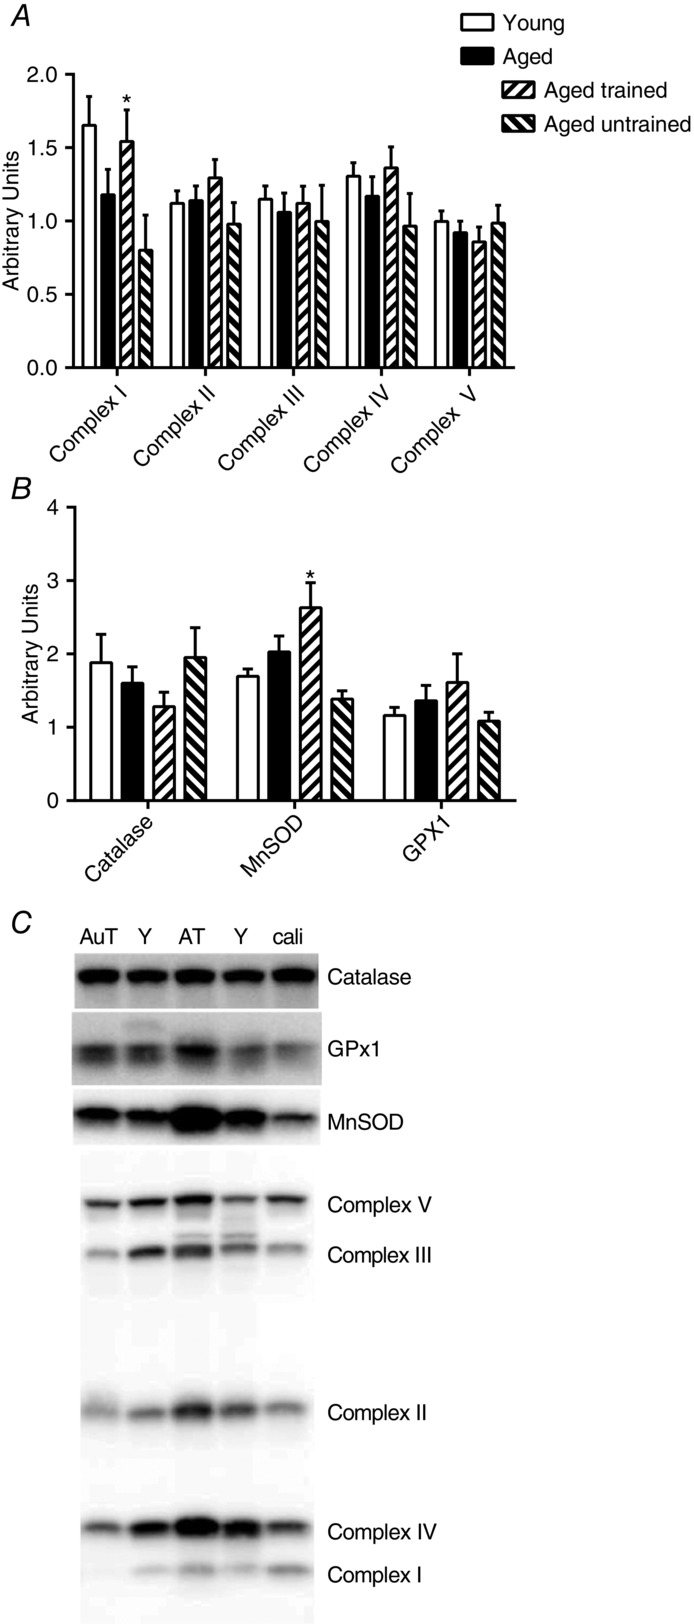
There was no significant difference between young and aged subjects with respect to CS and HAD activity (Table2), nor any of the mitochondrial electron transport chain protein complexes (Fig. 4A). Furthermore, there was no age difference in any of the scavengers (Fig. 4B), nor in fibre type distribution (Table2).
Table 2.
Skeletal muscle characteristics
| Young | Aged | Trained | Untrained | ||
|---|---|---|---|---|---|
| CS activity | (μmol min−1 mg dry weight−1) | 157 ± 7 | 163 ± 9 | 184 ± 12* | 135 ± 10 |
| HAD activity | (μmol min−1 mg dry weight −1) | 100 ± 5 | 108 ± 5 | 113 ± 8 | 101 ± 6 |
| OGG1 | Incision activity (%) | 2.4 ± 0.3 | 2.6 ± 0.1 | ||
| APE1 | Incision activity (%) | 14.4 ± 7.6 | 12.1 ± 1.4 | ||
| Fibre type distribution | |||||
| Type 1 | (%) | 49.0 ± 2.4 | 52.3 ± 3.4 | 60.9 ± 4.0* | 43.8 ± 4.1 |
| Type 2a | (%) | 40.6 ± 2.0 | 37.0 ± 2.4 | 30.8 ± 2.8* | 43.1 ± 3.0 |
| Type 2x | (%) | 10.3 ± 0.9 | 10.7 ± 1.5 | 8.3 ± 2.2 | 13.1 ± 1.9 |
Data are the mean ± SEM.
Significant effect of training within the same age group (P < 0.05).
Figure 4.
Muscle analyses
Whole muscle protein content of mitochondrial complex I–V (A), catalase, MnSOD and glutathion peroxidase (GPx1) (B) and representative western blots (C). Data in (A) and (B) are the mean ± SEM. Young (Y), aged untrained (AuT), aged trained (AT) and the calibration lane (cali) are shown in (C). *Significant effect of training status within the aged group of subjects (P < 0.05).
Increased training status in aged subjects was related to higher CS activity (P = 0.007), complex I protein content (P = 0.03), MnSOD protein content (P = 0.002) and higher type I fibre type distribution (P = 0.007).
To further understand whether age might regulate mitochondrial DNA repair activities, we measured the activities of the base excision repair enzymes APE1 and OGG1 in isolated mitochondria. As a result of limited tissue availability, this was only determined in four young and eleven aged subjects. These analyses, however, showed no change in the activities of these enzymes with age (Table2).
Mitochondrial characteristics
Differences between State 2, 3 and 4o in PM
For the most part, the protocols followed an expected pattern (see representative traces in Fig. 1). Notable findings when using PM were: lower State 4o than State 2 respiration in the young (P < 0.001), higher State 4o H2O2 emission than State 2 in all four groups (Fig. 5B, all groups P < 0.001), no difference in H2O2 emission between State 2 and State 3 (Fig. 5B) and, finally, no significant difference between State 2 and State 4 in mitochondrial membrane potential (Fig. 5C).
Figure 5.
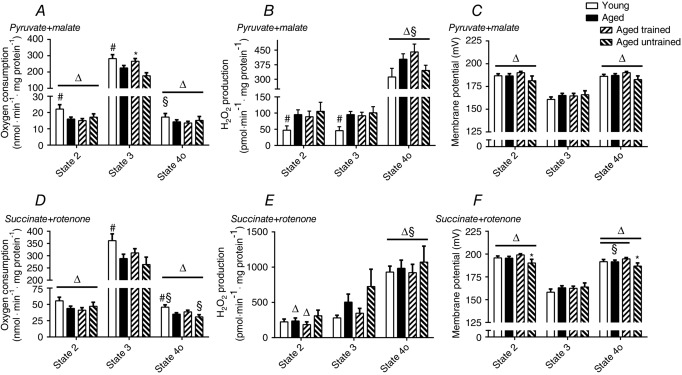
Respiration, H2O2 emission and membrane potential during State 2, 3 and 4o
Respiration (A and D), H2O2 emission (B and E) and membrane potential (C and F) during State 2, 3 and 4o. (A), (B) and (C) are when using PM and (D), (E) and (F) are when using SR. All measurements are related to mg of mitochondrial protein. Data are the mean ± SEM. The aged bar represents pooled data from the trained and untrained group of aged subjects. #Significant effect of age (P < 0.05). *Significant effect of training status within the aged group of subjects (P < 0.05). § and Δ indicate a significant difference from State 2 and State 3, respectively. Lines related to the symbols indicate the group to which the symbol applies.
Differences between State 2, 3 and 4o in SR
When using SR, notable findings were that State 4o respiration was significantly lower than State 2 in young subjects (P = 0.005) and in aged untrained subjects (P < 0.001) but not in aged trained subjects (P = 0.9) or when the aged groups were combined (P = 0.12). H2O2 emission was significantly higher in State 4 than State 2 in all groups (P < 0.001) and State 2 H2O2 emission was lower than State 3 H2O2 emission in the aged group when combined (P = 0.008) and in aged trained subjects (P = 0.01). In all groups, State 2 membrane potential was significantly higher than State 4 membrane potential (P < 0.05), except in aged untrained subjects where only a trend towards significance was found (P = 0.07).
RCI values were high, confirming that mitochondria were of sufficient high quality. SR: young 8.0 ± 0.2, aged 8.0 ± 0.3, aged trained 8.2 ± 0.6, aged untrained 7.9 ± 0.4. PM: young 19 ± 1, aged 17 ± 1, aged trained 20 ± 1, aged untrained 14 ± 2. The trained aged subjects had significantly higher PM RCI values compared to the aged untrained subjects (P = 0.001).
Membrane potential
State 2, 3 and 4o
The membrane potential showed small variations and there was no significant difference between young and aged subjects (Fig. 5F and C). Lower training status in aged subjects was related to a significantly lower membrane potential during SR State 2 (P = 0.02) and State 4o (P = 0.02; Fig. 5F) and a tendency towards lower membrane potential in PM State 2 (P = 0.07) and State 4o (P = 0.052; Fig. 5C) compared to trained subjects.
50% of the phosphorylating range
The average membrane potential at 50% of the phosphorylating range was not different between young and aged subjects or between the trained and untrained aged subjects (mV): SR: young 178 ± 2, aged 180 ± 2, aged trained 181 ± 2, aged untrained 177 ± 4; PM: young 173 ± 2, aged 175 ± 2, aged trained 177 ± 2, aged untrained 173 ± 4).
Respiration
State 2, 3 and 4o
Ageing was related to significantly lower State 2 and State 3 respiration when using PM and lower State 3 and State 4o when using SR (Fig. 5A and D). Higher training status in aged subjects resulted in a significantly higher State 3 respiration but only when using PM (Fig. 5A) compared to untrained subjects.
Fixed relative membrane potential
When calculating the ATP-production related respiration, leak-related respiration and coupling efficiency at a predefined relative membrane potential (Fig. 6A and C), there were no differences between young and aged subjects or within the aged group when comparing training status. This was seen regardless of which substrate combination was used.
Figure 6.
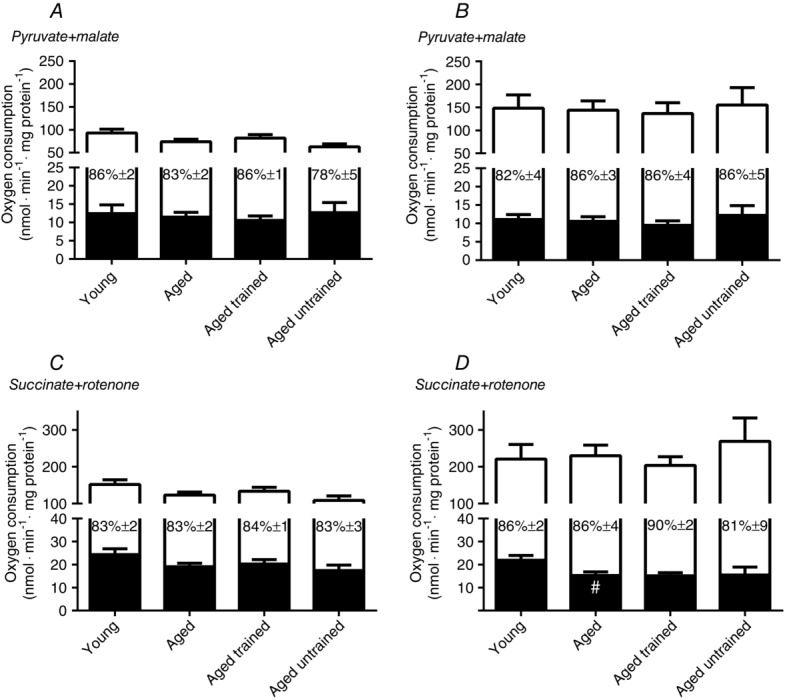
Respiration at fixed relative and absolute membrane potential
ATP production related respiration (white part of the bars) and leak-related respiration (black part of the bars) at 50% of the available phosphorylating membrane potential (A and C) and at a predefined absolute (175 mV) membrane potential (B and D). (A) and (B) are when using PM and (C) and (D) are when using SR. Values within the bars are the coupling efficiency defined as the percentage of respiration used for ATP generation. All measurements are related to mg of mitochondrial protein. Data are the mean ± SEM. The aged bar represents pooled data from the trained and untrained group of aged subjects. #Significant difference between aged and young (P < 0.05).
Fixed absolute membrane potential
When determined at a predefined absolute membrane potential (Fig. 6B and D), aged subjects had a significantly (P = 0.02) lower leak-respiration in the SR protocol (Fig. 6D) compared to young subjects.
H2O2 emission
State 2, 3 and 4o
When using PM, young subjects had a significantly lower H2O2 emission compared to aged subjects during State 2 (P = 0.02) and State 3 (P = 0.003) and there was a tendency for a lower H2O2 production during State 4o (P = 0.09; Fig. 5B) and lower PM H2O2 max (young 1110 ± 128 vs. aged 1411 ± 104 pmol min−1 mg protein−1, P = 0.07). There was no effect of increased training status within the aged group of subjects in State 2 and 3, although there was a tendency for State 4o (P = 0.10; Fig. 5B) and PM H2O2 max (P = 0.06) to be higher in trained subjects compared to untrained subjects (trained 1573 ± 125 vs. untrained 1185 ± 156 pmol min−1 mg protein−1).
When using SR, there was a tendency (P = 0.08) for young subjects to have a lower State 3 H2O2 production compared to the aged group, although there was no difference between young and aged in State 2 or State 4o. Training status was not related to any significant change in mitochondrial H2O2 production when using SR. There was a tendency (P = 0.10) for a higher State 3 H2O2 production in aged untrained subjects when using SR (Fig.5E) compared to trained subjects; however, this was primarily a result of three subjects having very high values. No other respiratory parameters were abnormal in these three subjects.
Fixed relative membrane potential
There were no significant differences between age groups when calculating the non-phosphorylating H2O2 production at a relative (Fig. 7A and C) membrane potential. However, aged subjects tended (P = 0.07) to have a higher H2O2 production in the SR protocol at a predefined relative membrane potential (Fig. 7C). Aged trained subjects had a significantly higher PM H2O2 production than untrained aged subjects (P = 0.02; Fig. 7A)
Figure 7.
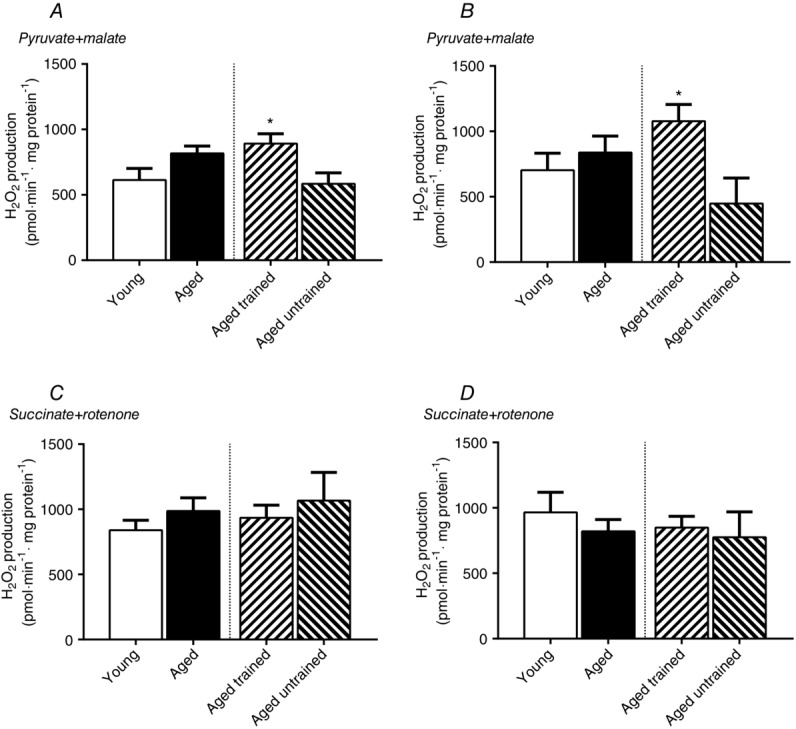
H2O2 emission at fixed relative and absolute membrane potential
H2O2 emission during non-phosphorylating conditions at 50% (A and C) of the available phosphorylating membrane potential and at a predefined absolute (175 mV) membrane potential (B and D). (A) and (B) represent data when using PM and (C) and (D) represent data when using SR. All measurements are related to mg of mitochondrial protein. Data are the mean ± SEM. The aged bar represents pooled data from the trained and untrained group of aged subjects. *Significant effect of training status within the aged group of subjects (P < 0.05).
Fixed absolute membrane potential
There were no significant differences between age groups when calculating the non-phosphorylating H2O2 production at an absolute membrane potential (Fig. 7B and D). Aged trained subjects had a significantly higher H2O2 production than untrained aged subjects in the PM protocol (P = 0.01; Fig. 7B).
Discussion
The purpose of the present study was 2-fold. First, we aimed to establish a measurement of the qualitative submaximal mitochondrial function at submaximal activities in human skeletal muscle biopsies. Second, we applied this technique partly to investigate the effect of age on mitochondrial function and partly to investigate the effect of physical fitness in aged subjects on mitochondrial function. A main result of the present study is the demonstration of feasibility of the methods in human muscle samples. Another main finding is that ageing and training status are indeed related to several alterations in mitochondrial function. When proton leak was determined at a predefined absolute membrane potential, aged subjects had a lower leak compared to young men. However, there was no effect on coupling efficiency and ATP-production related respiration. State 3 was lower in aged subjects regardless of which substrate was used, a difference that is probably influenced by lower training status in the aged group because the trained aged subjects had significantly higher State 3 compared to the untrained subjects. H2O2 emission was lower in young subjects when determined during State 2 and State 3 and was found to be higher in trained subjects when determined at submaximal membrane potentials (non-phosphorylating part of the protocol). Interestingly, this effect was only seen when using PM as substrate and not when using SR, suggesting that both ageing and training may have specific effects on certain ROS producing sites.
Effect of age on mitochondrial respiratory function
Numerous studies have investigated the effect of age on ex vivo human skeletal muscle mitochondrial function. Most have used isolated mitochondria (Trounce et al. 1989; Cooper et al. 1992; Boffoli et al. 1994; Brierley et al. 1996; Barrientos et al. 1996; Chretien et al. 1998; Rasmussen et al. 2003a,b; Capel et al. 2004; Short, 2005; Lanza et al. 2005) and few have used permeabilized fibres (Tonkonogi et al. 2003; Hütter et al. 2007; Larsen et al. 2012b). With regard to the effect of ageing on ex vivo mitochondrial respiration, the area is still very ambiguous. Around half of the studies have showed decreased respiration with increased age (Trounce et al. 1989; Cooper et al. 1992; Boffoli et al. 1994; Tonkonogi et al. 2003; Short, 2005), with the remainder showing no effect on increased age (Chretien et al. 1998; Rasmussen et al. 2003a,c; Capel et al. 2005; Hütter et al. 2007). Most of the ex vivo studies have assessed mitochondrial function as State 2, 3, 4, 4o or FCCP uncoupled respiration. In the present study, we also determined State 2, 3 and 4o (Fig. 5); however, the novelty of the present study was the assessment of the ATP-production related respiration, leak-related respiration and the coupling efficiency at submaximal respiratory rates. Two submaximal membrane potentials were used as nominating factors for comparison between subjects. This included predefined absolute potential (175 mV) and a predefined relative potential (50% of the range between State 2 and State 3). The respiration at the absolute potential allows for a comparison of the groups under conditions where the mitochondria are exposed to the same proton motive force. When comparing groups at the same relative membrane potential, individual variation in the membrane potential range is accounted for, which is more physiologically relevant, assuming that the range and regulation seen ex vivo is similar to what actually occurs in vivo.
We found that ageing was not related to any respiratory changes when determined at the same relative membrane potential (Fig. 6A and C) but a lower leak in aged vs. young subjects was seen at the absolute membrane potential during the SR protocol but not during the PM protocol (Fig. 6D). This difference in leak seen at the same absolute membrane potential suggests that the leakiness of the membrane for protons decreases with age, an effect that appears to be affected by the substrate stimulating the mitochondrion.
Only a few studies have determined ex vivo leak respiration in aged human skeletal muscle and these studies did not find any difference between aged and young subjects (Barrientos et al. 1996; Rasmussen et al. 2003a,b). In these three studies, leaks were evaluated as either State 4 or the P/O ratio. Both of these measurements have been defined as leak or efficiency measurements. However, in these studies, the membrane potential was not controlled for and it is therefore difficult to assess the true comparison. Furthermore, the P/O ratio is determined during State 3 where the membrane potential is low and leak will therefore be correspondingly low and play a minute role. Another discrepancy between our study and the studies by Barrientos et al. (1996) and Rasmussen et al. (2003a,b) is the difference in temperature. The previous studies used 25°C (Rasmussen et al. 2003a,b) or 30°C (Barrientos et al. 1996), whereas 37°C was used in the present study. The leakiness of the inner mitochondrial membrane is highly dependent on the temperature (Abele et al. 2002; Ulrich & Marsh, 2009). Because we determined our leak measurements at a more physiologically relevant temperature, we regard our measurements to be more relevant and more valid for extrapolation to the in vivo condition.
It is interesting to note that the higher leak seen with increased age was only seen when using SR as a substrate combination (Fig. 6). Previous studies have shown that the relationship between leak respiration and membrane potential is highly substrate specific (Tahara et al. 2009). To our knowledge, the exact mechanism behind this remains unknown.
Albeit less physiologically relevant but interesting for the characterization of the effect of ageing, we also determined State 2, 3 and 4o respiration (Fig. 5A and D). State 3 respiration was lower in aged compared to young subjects (both substrates). A lower State 3 respiration with age is in accordance with most studies (Trounce et al. 1989; Cooper et al. 1992; Boffoli et al. 1996; Short, 2005; Lanza & Nair, 2008) but not all of them (Barrientos et al. 1996; Rasmussen et al. 2003a,b). However, the training status of the aged individuals is a confounding factor. In the present study, State 3 respiration was higher in trained vs. the untrained, aged individuals. Thus, what is assumed to be an effect of age is rather an effect of a lower degree of aerobic fitness in aged individuals.
Effect of age on mitochondrial H2O2 emission
Only a few studies have determined the effect of age on mitochondrial ROS production in human skeletal muscle (Tonkonogi et al. 2003; Capel et al. 2005; Ghosh et al. 2011). Capel et al. (2005) have reported increased glutamate, malate and succinate induced H2O2 production in elderly subjects but only in the absence of rotenone. Tonkonogi et al. (2003) found that H2O2 production from isolated mitochondria using PM was not different between young and middle-aged subjects when data were expressed relative to CS activity. Ghosh et al. (2011) found that younger subjects had higher mitochondrial H2O2 production than elderly subjects regardless of whether the elderly subjects had normal or impaired glucose tolerance.
In the present study, we aimed to determine H2O2 emission under both phosphorylating and non-phosphorylating conditions. Unfortunately, we were unable to use the data from the submaximal phosphorylating part of the protocols, which would have been the most physiologically relevant part. Data from the non-phosphorylating part (including State 4o) of the protocol and from the State 2 and State 3 are unphysiological but still interesting from a characteristics point of view. Furthermore, for comparison between studies, these measurements, namely State 2 and State 4o, are even more relevant because all of the studies conducted so far have determined mitochondrial H2O2 emission under complex V inactivated conditions.
Under non-phosphorylating submaximal conditions, we found no significant difference between young and aged subjects in H2O2 emission either when determined at the same relative (Fig. 7A and C) or absolute membrane potential (Fig. 7B and D). When H2O2 was determined during more conventional State 2, 3 and 4o, there was no effect of age on H2O2 emission when using SR (Fig.5E). However, with PM, young subjects had significantly lower State 2 and State 3 and a tendency for a lower emission during State 4o (Fig. 5B) and PM H2O2 max. This difference between substrates suggests that the ageing process may affect ROS producing sites differently. The main difference between the PM and the SR stimulated H2O2 emission is the inclusion of the NADH/NAD isopotential linked sites [pyruvate-dehydrogenase (PDH), 2-oxogluterate-dehydrogenase (OGDH) and the flavin-protein within complex I (IF)] when using PM. Unfortunately, we are unable to distinguish between these three sites to pinpoint more specifically which site(s) are responsible for the age difference. However, it is important to note that we did not find any difference between young and aged subjects in complex I protein content (Fig.4A). A recent study has shown that, when mimicking in vivo, resting, mild and intense exercise conditions, IF is one of the most significant contributors to the overall mitochondrial H2O2 production (∼40%) (Goncalves et al. 2014). By contrast, OGDH only contributes under intense exercise conditions (13%) and does not contribute during rest or mild exercise, and PDH does not contribute under any conditions at all (Goncalves et al. 2014). If the age-induced changes in mitochondrial H2O2 production reported in the present study when using PM are also a result of changes in IF H2O2 production, this could have significant effects on the physiological condition. On the other hand, if differences were the result of alteration in PDH and/or OGDH H2O2 production, this would have very small, if any, effect on the physiological condition. In support of the latter possibility, we found no effect of ageing on the mtDNA repair enzymes OGG1 and APE1. Both enzymes are known to be up-regulated in response to increased ROS production (Pines et al. 2005; Pang et al. 2012).
We conclude that ageing is indeed related to increased mitochondrial H2O2 emission but only to specific NADH-isopotential linked sites. Further studies are needed to investigate whether this difference is caused by a change in IF ROS production, which is the dominant ROS producing site under physiological conditions.
A finding that merits attention is the approximately 3-fold difference in mitochondrial H2O2 emission between State 2 and State 4o regardless of substrate combination (Fig. 5B and E). We would have expected no difference in H2O2 emission between these two states because the difference in respiration and membrane potential is minute. A plausible explanation is the presence of ATPase contamination during State 2, which would enable ATP-ADP recycling. ATP-ADP recycling should increase respiration and decrease membrane potential, thereby decreasing ROS production. The membrane potential was either not different in PM or lower in SR when comparing State 4o with State 2 (Fig. 5C and F) and respiration was significantly lower during State 4o compared to State 2 in young subjects and in aged untrained subjects when using SR. Hence, these data do not give full support for the presence of contaminating ATPases. However, the relatively long protocol may induce a small degree of uncoupling and a decreased ability to sustain a high membrane potential (Fig. 1). This would mask the potential difference in respiration and membrane potential between State 2 and State 4o induced by contaminating ATPases. If contaminating ATP-ases can explain the 3-fold higher H2O2 emission during State 4o, it is interesting to note that the large change in H2O2 emission occurs for a very small change in respiration and membrane potential. Indeed, because there is no difference between State 2 and State 3 in H2O2 emission, this suggests that the whole range of H2O2 production occurs within the first few percentage points of the mitochondrial respiratory range. This also questions how much mitochondrial ROS production actually varies under physiological conditions, where it is highly unlikely that the respiratory rate ever is within this lower part of the range as a result of the constant need for mitochondrial ATP production.
Effect of training on mitochondrial function in aged subjects
In the present study, we also investigated and the effect of physical training status on mitochondrial function in aged subjects. This was carried out primarily to account for this potentially confounding factor (Brierley et al. 1996; Barrientos et al. 1996; Lanza & Nair, 2008; Larsen et al. 2012a). We found that there was no effect of training status on any of the mitochondrial respiration measurements under submaximal conditions (Fig. 6). This suggests that the decreased leak respiration seen in aged subjects when using SR (Fig. 6D) is not a result of decreased training status. When mitochondrial function was evaluated as State 2, 3 and 4o, increased training status was related to increased State 3 respiration when using PM. As described above, this suggests that the lower ageing related State 3 respiration when using PM is probably a result of a lower training status with increased age.
Surprisingly, increased training status was related to increased mitochondrial H2O2 emission when using PM both at the same absolute and relative submaximal membrane potential. Furthermore, there was a tendency for H2O2 emission to be higher during State 4o and PM H2O2 max also tended to be increased with training but there was no difference when determined during State 2 and State 3. These results show that, under non-phosphorylating conditions (submaximal rates, State 4o and PM H2O2 max), training increases the H2O2 that originates from PDH, OGDH and/or IF. However, under phosphorylating conditions, and more physiologically relevant conditions, there is no effect of training on the PM stimulated H2O2 emission. Interestingly, there was no effect of training on H2O2 emission when using SR. Overall, these results suggest that different ROS producing sites responds differently to increased training status and that a potential adaptation appears to be specific to the non-phosphorylating condition. This complexity of the adaptation to training in mitochondrial H2O2 emission probably also explains why there is a large discrepancy between studies that have investigated this issue. Previous studies have shown a training-induced increase in state 2 H2O2 emission when using SR and PM+rotenone in elderly human subjects (Ghosh et al. 2011). Another study has shown a training-induced increase in State 2 and 3 H2O2 emission in rat skeletal muscle when using PM but not when using SR (Venditti et al. 1999). In the present study, however, mitochondrial content was not accounted for, which may explain part of the increased H2O2 emission (Venditti et al. 1999). Finally, in a study using obese and type 2 diabetics, there was no significant effect of training when State 4o H2O2 emission was stimulated by SR both with and without anti-mycin A (Hey-Mogensen et al. 2010).
In addition to mitochondrial H2O2 emission, we also measured the capacity of different scavengers (Fig. 4B). In accordance with a previous study (Powers et al. 1994) but not all studies (Laughlin et al. 1990; Leeuwenburgh et al. 1994), we found no difference in catalase protein content in response to training. Glutathione peroxidase was also unaffected by training. Interestingly, however, trained subjects had a significantly higher MnSOD protein content (Fig. 4B). The trained subjects had 90% higher MnSOD content and 36% higher CS activity (Table2), suggesting that the higher MnSOD is not only caused by an up-regulation in mitochondrial content, but also by increased MnSOD content per mitochondrion. Most but not all studies have shown up-regulation of MnSOD in response to training (Powers & Jackson, 2008). To our knowledge, only one study has previously determined the effect of aerobic training on MnSOD content in aged human subjects (Oliveira et al. 2012). In accordance with the present study, MnSOD was increased in response to an increased aerobic training status training (Oliveira et al. 2012).
Superoxide has two fates within the mitochondrion. It can react with matrix compounds and cause oxidative stress or be converted into H2O2 by MnSOD. Increased MnSOD per mitochondria would increase the proportion of the superoxide that is converted to the less reactive H2O2 and thereby protect the mitochondrion against oxidative damage. Because the Amplex Red/HRP technique only detects the H2O2 released from the mitochondrion, the training induced increase in MnSOD should, at the same as mitochondrial superoxide production, result in increased mitochondrial H2O2 emission. The higher H2O2 emission observed under submaximal conditions, State 4o and H2O2 max when using PM could therefore be explained by the higher MnSOD seen in the trained subjects (Fig. 5A and B). If the higher MnSOD in the trained subjects explains the higher H2O2 emission during PM, this also implies that the superoxide production during this protocol could potentially be lower in the trained subjects because there was no difference in H2O2 emission when using SR.
Conclusions
The present study provides an analysis of submaximal mitochondrial function in human skeletal muscle biopsies. The advantage of our protocol is that respiration and ROS emission can be assessed at a predefined membrane potential, thereby accounting for this depending variable between all subjects. The methods were applied on biopsies obtained from healthy subjects of young and older age, with the latter subdivided into those with high and low levels of physical activity. We conclude that ageing per se does not affect ATP generating respiration, whereas leak respiration at the same absolute membrane potential (175 mV) is lower in aged vs. young subjects, an effect that is unaffected by training status. Another conclusion is that mitochondrial H2O2 emission is not age-dependent but is affected by training status in aged subjects. This effect, however, depends on which substrate is used and under which condition (phosphorylating or non-phosphorylating) this is assessed. Furthermore, for evaluating the production of the original superoxide, the scavenger system should also be taken into account and, in the present study, trained subjects had an increased MnSOD content. Therefore, our results suggest that increased training status results in either no change in superoxide production (PM) or decreased superoxide production (SR), which, when taking the difference in MnSOD into account, results in either a higher or no difference in H2O2 emission, respectively. In a broader perspective, our findings confirm that ageing and physical fitness levels in the ageing population are indeed related to adaptations in intrinsic mitochondrial function. With the present data, we can only speculate about the physiological outcome of these adaptations. However, it is well known that training and ageing are both related to changes in the metabolic health of skeletal muscle, such as increased oxidative capacity, insulin sensitivity and choice of substrate, etc. Therefore, the functional adaptations observed in the present study could be the key link between ageing, physical training and the metabolic health of skeletal muscle.
Acknowledgments
The authors wish to thank Regitze Kraunsøe, Katrine Qvist and Thomas Nyegaard Beck for excellent laboratory and technical assistance. Merete Hansen, Emilie Sarah Gregers Hansen, Johannes Grand, Helene Pape Pedersen and Anja Birk Kuhlman are thanked for conducting the muscle biopsy sampling, and Jonas van Cuyl Kuylenstierna is thanked for analysing the 3-day food registrations. Finally, Casey Quinlan is thanked for valuable input with regard to interpretation of the mitochondrial H2O2 emission data.
Glossary
- APE1
apurinic/apyrimidinic endonuclease 1
- BMI
body mass index
- CS
citrate synthase
- DNTB
5,5′-dithiobis-(2-nitrobenzoic acid)
- FCCP
carbonyl cyanide-4-(trifluoromethoxy)phenylhydrazone
- GPX1
gluthathione peroxidase 1
- HAD
β-hydroxyacyl-CoA dehydrogenase
- IF
flavin-protein within complex I
- mnSOD
manganese superoxide dismuthase
- mtDNA
mitochondrial DNA
- OGDH
2-oxogluterate-dehydrogenase
- OGG1
8-oxoguanine DNA glycosylase 1
- PDH
pyruvate-dehydrogenase
- PM
pyruvate + malate
- ROS
reactive oxygen species
- RCI
respiratory control index
- SOD
superoxide dismutase
- SR
succinate + rotenone
- TMRM
tetramethylrhodamine methyl ester
- TNB
2-nitro-5-thiobenzoic acid
Additional information
Competing interests
The funding sources had no involvement in the study design, in the collection, analysis and interpretation of data, in the writing of the report or in the decision to submit the article for publication. The authors have no competing interests to declare.
Author contributions
All measurements were performed at Xlab, Centre for Healthy Aging, Department of Biomedical Sciences, University of Copenhagen, Denmark, except for measurements of mtDNA repair enzymes, which were determined at the Centre for Healthy Aging, Department of Cellular and Molecular Medicine, University of Copenhagen, Denmark. MHM contributed to the conception and design of the experiments, data collection and provision of patients, analysis, interpretation of the data, and manuscript writing. MG contributed to the design, data collection and analysis, interpretation, and writing of the manuscript. MBJ contributed to the data collection, analysis and revision of the manuscript. MTL and CNH contributed to data collection, analysis and revision of the manuscript. MSK and VB contributed to the analysis and revision of the manuscript. FD contributed to conception and design of the experiments, financial and administrative support, provision of study materials, data collection, analysis and interpretation, and manuscript writing. All authors approved the final version of this manuscript submitted for publication. All persons designated as authors qualify for authorship, and all those who qualify for authorship are listed.
Funding
The work was supported financially by The Danish council for Independent Research – Medical Sciences, The AP Møller Foundation – Fonden til Lægevidenskabens Fremme and the Nordea Foundation (Centre for Healthy Aging).
References
- Abele D, Heise K, Pörtner HO. Puntarulo S. Temperature-dependence of mitochondrial function and production of reactive oxygen species in the intertidal mud clam Mya arenaria. J Exp Biol. 2002;205:1831–1841. doi: 10.1242/jeb.205.13.1831. [DOI] [PubMed] [Google Scholar]
- Affourtit C, Quinlan CL. Brand MD. Measurement of proton leak and electron leak in isolated mitochondria. Methods Mol Biol. 2012;810:165–182. doi: 10.1007/978-1-61779-382-0_11. [DOI] [PubMed] [Google Scholar]
- Amara CE, Shankland EG, Jubrias SA, Marcinek DJ, Kushmerick MJ. Conley KE. Mild mitochondrial uncoupling impacts cellular aging in human muscles in vivo. Proc Natl Acad Sci USA. 2007;104:1057–1062. doi: 10.1073/pnas.0610131104. [DOI] [PMC free article] [PubMed] [Google Scholar]
- Amo T. Brand MD. Were inefficient mitochondrial haplogroups selected during migrations of modern humans? A test using modular kinetic analysis of coupling in mitochondria from cybrid cell lines. Biochem J. 2007;404:345–351. doi: 10.1042/BJ20061609. [DOI] [PMC free article] [PubMed] [Google Scholar]
- Andersen JL. Aagaard P. Myosin heavy chain IIX overshoot in human skeletal muscle. Muscle Nerve. 2000;23:1095–1104. doi: 10.1002/1097-4598(200007)23:7<1095::aid-mus13>3.0.co;2-o. [DOI] [PubMed] [Google Scholar]
- Barrientos A, Casademont J, Rötig A, Miró O, Urbano-Márquez A, Rustin P. Cardellach F. Absence of relationship between the level of electron transport chain activities and aging in human skeletal muscle. Biochem Biophys Res Commun. 1996;229:536–539. doi: 10.1006/bbrc.1996.1839. [DOI] [PubMed] [Google Scholar]
- Boffoli D, Scacco SC, Vergari R, Persio MT, Solarino G, Laforgia R. Papa S. Ageing is associated in females with a decline in the content and activity on the b-c1 complex in skeletal muscle mitochondria. Biochim Biophys Acta. 1996;1315:66–72. doi: 10.1016/0925-4439(95)00107-7. [DOI] [PubMed] [Google Scholar]
- Boffoli D, Scacco SC, Vergari R, Solarino G, Santacroce G. Papa S. Decline with age of the respiratory chain activity in human skeletal muscle. Biochim Biophys Acta. 1994;1226:73–82. doi: 10.1016/0925-4439(94)90061-2. [DOI] [PubMed] [Google Scholar]
- Brierley EJ, Johnson MA, James OF. Turnbull DM. Effects of physical activity and age on mitochondrial function. QJM. 1996;89:251–258. doi: 10.1093/qjmed/89.4.251. [DOI] [PubMed] [Google Scholar]
- Broskey NT, Greggio C, Boss A, Boutant M, Dwyer A, Schlueter L, Hans D, Gremion G, Kreis R, Boesch C, Canto C. Amati F. Skeletal muscle mitochondria in the elderly: effects of physical fitness and exercise training. J Clin Endocrinol Metab. 2014;99:1852–1861. doi: 10.1210/jc.2013-3983. [DOI] [PubMed] [Google Scholar]
- Brotea GP. Thibert RJ. Fluorometric determination of hydrogen peroxide using resorufin and peroxidase. Microchem J. 1988;37:368–376. [Google Scholar]
- Capel F, Buffière C, Patureau Mirand P. Mosoni L. Differential variation of mitochondrial H2O2 release during aging in oxidative and glycolytic muscles in rats. Mech Ageing Dec. 2004;125:367–373. doi: 10.1016/j.mad.2004.02.005. [DOI] [PubMed] [Google Scholar]
- Capel F, Rimbert V, Lioger D, Diot A, Rousset P, Mirand PP, BOIRIE Y, Morio B. Mosoni L. Due to reverse electron transfer, mitochondrial H2O2 release increases with age in human vastus lateralis muscle although oxidative capacity is preserved. Mech Ageing Dev. 2005;126:505–511. doi: 10.1016/j.mad.2004.11.001. [DOI] [PubMed] [Google Scholar]
- Chretien D, Gallego J, Barrientos A, Casademont J, Cardellach F, Munnich A, Rötig A. Rustin P. Biochemical parameters for the diagnosis of mitochondrial respiratory chain deficiency in humans, and their lack of age-related changes. Biochem J. 1998;329:249–254. doi: 10.1042/bj3290249. [DOI] [PMC free article] [PubMed] [Google Scholar]
- Ciapaite J, Van Eikenhorst G, Bakker SJL, Diamant M, Heine RJ, Wagner MJ, Westerhoff HV. Krab K. Modular kinetic analysis of the adenine nucleotide translocator-mediated effects of palmitoyl-CoA on the oxidative phosphorylation in isolated rat liver mitochondria. Diabetes. 2005;54:944–951. doi: 10.2337/diabetes.54.4.944. [DOI] [PubMed] [Google Scholar]
- Conley KE, Jubrias SA, Cress ME. Esselman P. Exercise efficiency is reduced by mitochondrial uncoupling in the elderly. Exp Physiol. 2013;98:768–777. doi: 10.1113/expphysiol.2012.067314. [DOI] [PubMed] [Google Scholar]
- Cooper JM, Mann VM. Schapira AH. Analyses of mitochondrial respiratory chain function and mitochondrial DNA deletion in human skeletal muscle: effect of ageing. J Neurol Sci. 1992;113:91–98. doi: 10.1016/0022-510x(92)90270-u. [DOI] [PubMed] [Google Scholar]
- Craig CL, Marshall AL, Sjöström M, Bauman AE, Booth ML, Ainsworth BE, Pratt M, Ekelund U, Yngve A, Sallis JF. Oja P. International physical activity questionnaire: 12-country reliability and validity. Med Sci Sports Exerc. 2003;35:1381–1395. doi: 10.1249/01.MSS.0000078924.61453.FB. [DOI] [PubMed] [Google Scholar]
- Figueiredo PA, Powers SK, Ferreira RM, Appell HJ. Duarte JA. Aging impairs skeletal muscle mitochondrial bioenergetic function. J Gerontol A Biol Sci Med Sci. 2009;64A:21–33. doi: 10.1093/gerona/gln048. [DOI] [PMC free article] [PubMed] [Google Scholar]
- Ghosh S, Lertwattanarak R, Lefort N, Molina-Carrion M, Joya-Galeana J, Bowen BP, Garduno-Garcia JDJ, Abdul-Ghani M, Richardson A, DeFronzo RA, Mandarino L, Van Remmen H. Musi N. Reduction in reactive oxygen species production by mitochondria from elderly subjects with normal and impaired glucose tolerance. Diabetes. 2011;60:2051–2060. doi: 10.2337/db11-0121. [DOI] [PMC free article] [PubMed] [Google Scholar]
- Goncalves RLS, Quinlan CL, Perevoshchikova IV, Hey-Mogensen M. Brand MD. Sites of superoxide and hydrogen peroxide production by muscle mitochondria assessed ex vivo under conditions mimicking rest and exercise. J Biol Chem. 2014;290:209–227. doi: 10.1074/jbc.M114.619072. [DOI] [PMC free article] [PubMed] [Google Scholar]
- Gouspillou G, Bourdel-Marchasson I, Rouland R, Calmettes G, Biran M, Deschodt-Arsac V, Miraux S, Thiaudiere E, Pasdois P, Detaille D, Franconi J-M, Babot M, Trézéguet V, Arsac L. Diolez P. Mitochondrial energetics is impaired in vivo in aged skeletal muscle. Aging Cell. 2014;13:39–48. doi: 10.1111/acel.12147. [DOI] [PMC free article] [PubMed] [Google Scholar]
- Harman D. The biologic clock: the mitochondria? J Am Geriatr Soc. 1972;20:145–147. doi: 10.1111/j.1532-5415.1972.tb00787.x. [DOI] [PubMed] [Google Scholar]
- Hey-Mogensen M, Hojlund K, Vind BF, Wang L, Dela F, Beck-Nielsen H, Fernstrom M. Sahlin K. Effect of physical training on mitochondrial respiration and reactive oxygen species release in skeletal muscle in patients with obesity and type 2 diabetes. Diabetologia. 2010;53:1976–1985. doi: 10.1007/s00125-010-1813-x. [DOI] [PubMed] [Google Scholar]
- Hey-Mogensen M, Jeppesen J, Madsen K, Kiens B. Franch J. Obesity augments the age-induced increase in mitochondrial capacity for H2O2 release in Zucker fatty rats. Acta Physiologica. 2011;204:354–361. doi: 10.1111/j.1748-1716.2011.02347.x. [DOI] [PubMed] [Google Scholar]
- Hütter E, Skovbro M, Lener B, Prats C, Rabøl R, Dela F. Jansen-Dürr P. Oxidative stress and mitochondrial impairment can be separated from lipofuscin accumulation in aged human skeletal muscle. Aging Cell. 2007;6:245–256. doi: 10.1111/j.1474-9726.2007.00282.x. [DOI] [PubMed] [Google Scholar]
- Kent-Braun JA. Ng AV. Skeletal muscle oxidative capacity in young and older women and men. J Appl Physiol. 2000;89:1072–1078. doi: 10.1152/jappl.2000.89.3.1072. [DOI] [PubMed] [Google Scholar]
- Lanza IR. Nair KS. Muscle mitochondrial changes with aging and exercise. Am J Clin Nutr. 2008;89:467S–471S. doi: 10.3945/ajcn.2008.26717D. [DOI] [PMC free article] [PubMed] [Google Scholar]
- Lanza IR, Befroy DE. Kent-Braun JA. Age-related changes in ATP-producing pathways in human skeletal muscle in vivo. J Appl Physiol. 2005;99:1736–1744. doi: 10.1152/japplphysiol.00566.2005. [DOI] [PubMed] [Google Scholar]
- Lanza IR, Larsen RG. Kent-Braun JA. Effects of old age on human skeletal muscle energetics during fatiguing contractions with and without blood flow. J Physiol. 2007;583:1093–1105. doi: 10.1113/jphysiol.2007.138362. [DOI] [PMC free article] [PubMed] [Google Scholar]
- Larsen RG, Callahan DM, Foulis SA. Kent-Braun JA. Age-related changes in oxidative capacity differ between locomotory muscles and are associated with physical activity behavior. Appl Physiol Nutr Metab. 2012;37:88–99. doi: 10.1139/h11-135. [DOI] [PMC free article] [PubMed] [Google Scholar]
- Larsen S, Hey-Mogensen M, Rabol R, Stride N, Helge JW. Dela F. The influence of age and aerobic fitness: effects on mitochondrial respiration in skeletal muscle. Acta Physiol (Oxf) 2012;205:423–432. doi: 10.1111/j.1748-1716.2012.02408.x. [DOI] [PubMed] [Google Scholar]
- Larsen S, Nielsen J, Hansen CN, Nielsen LB, Wibrand F, Stride N, Schroder HD, Boushel R, Helge JW, Dela F. Hey-Mogensen M. Biomarkers of mitochondrial content in skeletal muscle of healthy young human subjects. J Physiol. 2012;590:3349–3360. doi: 10.1113/jphysiol.2012.230185. [DOI] [PMC free article] [PubMed] [Google Scholar]
- Laughlin MH, Simpson T, Sexton WL, Brown OR, Smith JK. Korthuis RJ. Skeletal muscle oxidative capacity, antioxidant enzymes, and exercise training. J Appl Physiol. 1990;68:2337–2343. doi: 10.1152/jappl.1990.68.6.2337. [DOI] [PubMed] [Google Scholar]
- Leeuwenburgh C, Fiebig R, Chandwaney R. Ji LL. Aging and exercise training in skeletal muscle: responses of glutathione and antioxidant enzyme systems. Am J Physiol. 1994;267:R439–R445. doi: 10.1152/ajpregu.1994.267.2.R439. Integr Comp Physiol. [DOI] [PubMed] [Google Scholar]
- Lowry OH. Passonneau JV. New York, NY: Academic Press; 1972. A Flexible System of Enzymatic Analysis. [Google Scholar]
- McCully KK, Fielding RA, Evans WJ, Leigh JS. Posner JD. Relationships between in vivo and in vitro measurements of metabolism in young and old human calf muscles. J Appl Physiol. 1993;75:813–819. doi: 10.1152/jappl.1993.75.2.813. [DOI] [PubMed] [Google Scholar]
- Meissner C, Bruse P. Oehmichen M. Tissue-specific deletion patterns of the mitochondrial genome with advancing age. Exp Gerontol. 2006;41:518–524. doi: 10.1016/j.exger.2006.03.010. [DOI] [PubMed] [Google Scholar]
- Mohanty JG, Jaffe JS. Schulman ES. A highly sensitive fluorescent micro-assay of H2O2 release from activated human leukocytes using a dihydroxyphenoxazine derivative. J Immunuol Methods. 1997;202:133–141. doi: 10.1016/s0022-1759(96)00244-x. [DOI] [PubMed] [Google Scholar]
- Motulsky HJ. Brown RE. Detecting outliers when fitting data with nonlinear regression – a new method based on robust nonlinear regression and the false discovery rate. BMC Bioinformatics. 2006;7:123. doi: 10.1186/1471-2105-7-123. [DOI] [PMC free article] [PubMed] [Google Scholar]
- de Oliveira VN, Bessa A, Jorge MLMP, Oliveira RJDS, de Mello MT, De Agostini GG, Jorge PT. Espindola FS. The effect of different training programs on antioxidant status, oxidative stress, and metabolic control in type 2 diabetes. Appl Physiol Nutr Metab. 2012;37:334–344. doi: 10.1139/h2012-004. [DOI] [PubMed] [Google Scholar]
- Orr AL, Quinlan CL, Perevoshchikova IV. Brand MD. A refined analysis of superoxide production by mitochondrial sn-glycerol 3-phosphate dehydrogenase. J Biol Chem. 2012;287:42921–42935. doi: 10.1074/jbc.M112.397828. [DOI] [PMC free article] [PubMed] [Google Scholar]
- Pang J, Xi C, Dai Y, Gong H. Zhang T-M. Altered expression of base excision repair genes in response to high glucose-induced oxidative stress in HepG2 hepatocytes. Med Sci Monit. 2012;18:BR281–BR285. doi: 10.12659/MSM.883206. [DOI] [PMC free article] [PubMed] [Google Scholar]
- Petersen KF. Mitochondrial dysfunction in the elderly: possible role in insulin resistance. Science. 2003;300:1140–1142. doi: 10.1126/science.1082889. [DOI] [PMC free article] [PubMed] [Google Scholar]
- Pines A, Perrone L, Bivi N, Romanello M, Damante G, Gulisano M, Kelley MR, Quadrifoglio F. Tell G. Activation of APE1/Ref-1 is dependent on reactive oxygen species generated after purinergic receptor stimulation by ATP. Nucleic Acids Res. 2005;33:4379–4394. doi: 10.1093/nar/gki751. [DOI] [PMC free article] [PubMed] [Google Scholar]
- Powers SK. Jackson MJ. Exercise-induced oxidative stress: cellular mechanisms and impact on muscle force production. Physiol Rev. 2008;88:1243–1276. doi: 10.1152/physrev.00031.2007. [DOI] [PMC free article] [PubMed] [Google Scholar]
- Powers SK, Criswell D, Lawler J, Martin D, Ji LL, Herb RA. Dudley G. Regional training-induced alterations in diaphragmatic oxidative and antioxidant enzymes. Respir Physiol. 1994;95:227–237. doi: 10.1016/0034-5687(94)90118-x. [DOI] [PubMed] [Google Scholar]
- Quinlan CL, Perevoschikova IV, Goncalves RLS, Hey-Mogensen M. Brand MD. The determination and analysis of site-specific rates of mitochondrial reactive oxygen species production. Meth Enzymol. 2013;526:189–217. doi: 10.1016/B978-0-12-405883-5.00012-0. [DOI] [PMC free article] [PubMed] [Google Scholar]
- Rasmussen UF, Krustrup P, Kjær M. Rasmussen HN. Experimental evidence against the mitochondrial theory of aging. A study of isolated human skeletal muscle mitochondria. Exp Gerontol. 2003;38:877–886. doi: 10.1016/s0531-5565(03)00092-5. [DOI] [PubMed] [Google Scholar]
- Rasmussen UF, Krustrup P, Kjær M. Rasmussen HN. Experimental evidence against the mitochondrial theory of aging A study of isolated human skeletal muscle mitochondria. Exp Gerontol. 2003;38:877–886. doi: 10.1016/s0531-5565(03)00092-5. [DOI] [PubMed] [Google Scholar]
- Rasmussen UF, Krustrup P, Kjær M. Rasmussen HN. Human skeletal muscle mitochondrial metabolism in youth and senescence: no signs of functional changes in ATP formation and mitochondrial oxidative capacity. Pflügers Arch. 2003;446:270–278. doi: 10.1007/s00424-003-1022-2. [DOI] [PubMed] [Google Scholar]
- Scaduto RC., Jr Grotyohann LW. Measurement of mitochondrial membrane potential using fluorescent rhodamine derivatives. Biophys J. 1999;76:469–477. doi: 10.1016/S0006-3495(99)77214-0. [DOI] [PMC free article] [PubMed] [Google Scholar]
- Short KR. Changes in myosin heavy chain mRNA and protein expression in human skeletal muscle with age and endurance exercise training. J Appl Physiol. 2005;99:95–102. doi: 10.1152/japplphysiol.00129.2005. [DOI] [PubMed] [Google Scholar]
- Short KR, Bigelow ML, Kahl J, Singh R, Coenen-Schimke J, Raghavakaimal S. Nair KS. Decline in skeletal muscle mitochondrial function with aging in humans. Proc Natl Acad Sci USA. 2005;102:5618–5623. doi: 10.1073/pnas.0501559102. [DOI] [PMC free article] [PubMed] [Google Scholar]
- Srere PA. Citrate synthase. Methods Enzymol. 1969;13:3–5. [Google Scholar]
- St-Pierre J. Topology of superoxide production from different sites in the mitochondrial electron transport chain. J Biol Chem. 2002;277:44784–44790. doi: 10.1074/jbc.M207217200. [DOI] [PubMed] [Google Scholar]
- Tahara EB, Navarete FDT. Kowaltowski AJ. Tissue-, substrate-, and site-specific characteristics of mitochondrial reactive oxygen species generation. Free Radic Biol Med. 2009;46:1283–1297. doi: 10.1016/j.freeradbiomed.2009.02.008. [DOI] [PubMed] [Google Scholar]
- Tonkonogi M. Sahlin K. Rate of oxidative phosphorylation in isolated mitochondria from human skeletal muscle: effect of training status. Acta Physiol Scand. 1997;161:345–353. doi: 10.1046/j.1365-201X.1997.00222.x. [DOI] [PubMed] [Google Scholar]
- Tonkonogi M, Fernström M, Walsh B, Ji LL, Rooyackers O, Hammarqvist F, Wernerman J. Sahlin K. Reduced oxidative power but unchanged antioxidative capacity in skeletal muscle from aged humans. Pflügers Arch. 2003;446:261–269. doi: 10.1007/s00424-003-1044-9. [DOI] [PubMed] [Google Scholar]
- Trounce I, Byrne E. Marzuki S. Decline in skeletal muscle mitochondrial respiratory chain function: possible factor in ageing. Lancet. 1989;1:637–639. doi: 10.1016/s0140-6736(89)92143-0. [DOI] [PubMed] [Google Scholar]
- Ulrich PN. Marsh AG. Thermal sensitivity of mitochondrial respiration efficiency and protein phosphorylation in the clam Mercenaria mercenaria. Mar Biotechnol. 2009;11:608–618. doi: 10.1007/s10126-009-9177-2. [DOI] [PubMed] [Google Scholar]
- Venditti P, Masullo P. Di Meo S. Effect of training on H(2)O(2) release by mitochondria from rat skeletal muscle. Arc Biochem Biophys. 1999;372:315–320. doi: 10.1006/abbi.1999.1494. [DOI] [PubMed] [Google Scholar]
- Wibom R, Lundin A. Hultman E. A sensitive method for measuring ATP-formation in rat muscle mitochondria. Scand J Clin Lab Invest. 1990;50:143–152. doi: 10.1080/00365519009089146. [DOI] [PubMed] [Google Scholar]