Significance
Many transcription factors and DNA repair/modifying enzymes must first locate the target sites through stochastic scanning of DNA in the vast presence of nonspecific sites. In this work, we demonstrate that target search by these proteins can be accelerated via engineering based on structural dynamic knowledge of the DNA-scanning process. Our biophysical data for the Egr-1 zinc-finger protein and its nuclease derivatives reveal kinetic and thermodynamic roles of the conformational equilibrium between two modes in the DNA-scanning process: one suitable for search and the other for recognition. We found that optimizing the balance between the search and recognition modes improves efficiency in zinc-finger proteins’ target search. This finding can help advance zinc-finger technology for artificial gene regulation and genome editing.
Keywords: protein–DNA interactions, DNA scanning, target search, kinetics, dynamics
Abstract
Although engineering of transcription factors and DNA-modifying enzymes has drawn substantial attention for artificial gene regulation and genome editing, most efforts focus on affinity and specificity of the DNA-binding proteins, typically overlooking the kinetic properties of these proteins. However, a simplistic pursuit of high affinity can lead to kinetically deficient proteins that spend too much time at nonspecific sites before reaching their targets on DNA. We demonstrate that structural dynamic knowledge of the DNA-scanning process allows for kinetically and thermodynamically balanced engineering of DNA-binding proteins. Our current study of the zinc-finger protein Egr-1 (also known as Zif268) and its nuclease derivatives reveals kinetic and thermodynamic roles of the dynamic conformational equilibrium between two modes during the DNA-scanning process: one mode suitable for search and the other for recognition. By mutagenesis, we were able to shift this equilibrium, as confirmed by NMR spectroscopy. Using fluorescence and biochemical assays as well as computational simulations, we analyzed how the shifts of the conformational equilibrium influence binding affinity, target search kinetics, and efficiency in displacing other proteins from the target sites. A shift toward the recognition mode caused an increase in affinity for DNA and a decrease in search efficiency. In contrast, a shift toward the search mode caused a decrease in affinity and an increase in search efficiency. This accelerated site-specific DNA cleavage by the zinc-finger nuclease, without enhancing off-target cleavage. Our study shows that appropriate modulation of the dynamic conformational ensemble can greatly improve zinc-finger technology, which has used Egr-1 (Zif268) as a major scaffold for engineering.
Artificial transcription factors and DNA-modifying enzymes have gained popularity as powerful means for artificial gene regulation and genome editing (1–7). Successful applications were reported on artificial zinc-finger (ZF) proteins engineered to exhibit a desired sequence specificity in binding to DNA (1–5). Artificial ZF transcription factors, comprising engineered ZFs and transactivation or repression domains, are used to regulate particular genes (1–3). ZF nucleases (ZFNs), comprising engineered ZFs and a FokI nuclease domain (ND), can site-specifically cleave DNA at particular sequences and allow for genome editing in vivo (4, 5). ZFN-based gene therapy for HIV infection is currently under phase 2 clinical trials, yielding some successful cases (8). Other studies suggested that ZF-based gene control could also be therapeutically effective for hemophilia (9) and Parkinson’s disease (10). For the success of these technologies, however, two issues, toxicity and low efficiency, should be resolved (4, 5, 11). Regarding the latter issue, some studies (11–14) suggest that, despite high affinities for target DNA, the artificial proteins do not necessarily exhibit suitable kinetic properties, which can diminish the usefulness of these technologies.
When we consider the kinetic properties of DNA-binding proteins, we should remember that these proteins must locate their target sites on DNA in the vast presence of nonspecific but structurally similar sites among billions of base pairs in the nucleus. In the past four decades, many theoreticians and experimentalists studied kinetic mechanisms whereby natural proteins efficiently locate their targets on DNA (15–22). A major finding in the field was that nonspecific association with DNA plays a major role in target search by these proteins. Nonspecific sites near targets on DNA can accelerate the target association process by creating an antenna that directs the protein to its target through 1D diffusion on DNA (i.e., sliding). In contrast, nonspecific sites far outside the antenna on the same DNA or sites on different DNA molecules can effectively trap proteins because sliding or hopping from such sites does not directly lead to target association (19, 20). This trapping effect should be particularly strong in vivo because of extremely high DNA density (∼100 mg/mL) (23) in the nuclei.
Given these effects, rapidity in target search and stability in DNA binding are two opposing factors for sequence-specific DNA-binding proteins (19, 24, 25), and yet both are required for some proteins to perform their function. This situation is often called the speed-stability paradox (19, 24, 25). In our previous work (26–28), we studied how the inducible transcription factor Egr-1 (also known as Zif268) can overcome this paradox. The Egr-1 protein recognizes its 9-bp target sequence via three ZFs and plays important roles in the brain and cardiovascular system (29, 30). Egr-1 is induced by cellular stimuli such as synaptic signals or vascular stress and activates particular genes within its relatively short lifetime (∼0.5–1 h) (29). Our previous study suggested the presence of dynamic transitions between conformationally different states of Egr-1 during the DNA-scanning process: one allowing for rapid translocation on DNA (the search mode) and the other allowing for highly specific recognition (the recognition mode) (28). This finding is consistent with the conformational switch model (19, 25, 31–33), which some theoreticians proposed to resolve the speed-stability paradox, originally on the basis of experimental data for the Escherichia coli lac repressor (34, 35).
In our current study, using NMR, stopped-flow fluorescence, biochemical, and computational methods, we demonstrate that the kinetic properties of ZF proteins can be improved by appropriately modulating the dynamic conformational ensemble in the DNA-scanning process. Our mutagenesis data on the Egr-1 ZF DNA-binding domain (ZF-DBD) and its ZFN derivative reveal the kinetic and thermodynamic roles of the search and recognition modes in target search. This work highlights the importance of structural dynamic knowledge of the DNA-scanning process at the molecular and atomic levels in engineering of transcription factors and DNA-modifying enzymes. The insight from this work should be applicable to many artificial ZF proteins because Egr-1 (Zif268) has been used as a major scaffold for ZF technology.
Results
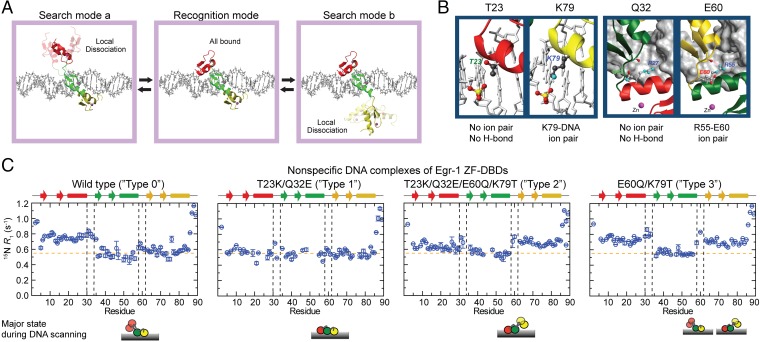
Our previous NMR and computational investigations on nonspecific and specific DNA complexes of Egr-1 suggested that, while scanning DNA, Egr-1 undergoes the dynamic conformational equilibrium between the search and recognition modes (28). We consider the conformational ensemble involving three major states in the DNA-scanning process as shown in Fig. 1A. In the recognition mode, all three ZFs are bound to DNA. In the search modes, a ZF is locally dissociated from DNA and the other two ZFs are nonspecifically bound to DNA (two different search modes, a and b, are defined as shown in Fig. 1A). Our previous studies suggested that the interdomain dynamics could harness the rapid conformational switch between the search and recognition modes, thereby allowing Egr-1 to overcome the speed-stability paradox (24, 28). Our current work is based on a hypothesis that the balance between the search and recognition modes is a major determinant of the kinetic efficiency in target DNA search by ZF proteins.
Fig. 1.
Modulation of the search and recognition modes during DNA scanning by the Egr-1 ZF-DBD. (A) Search and recognition modes. (B) Mutation sites used to modulate the balance between the search and recognition modes. (C) Backbone amide 15N R1 relaxation rates measured at the 1H frequency of 800 MHz for the nonspecific complexes of the wild-type and mutant proteins of Egr-1 ZF-DBD with 28-bp DNA duplex, dGTACCGATTGCAGATTCCGAACCTTCAG, which contains neither specific nor semispecific sequences.
Shifting the Conformational Equilibrium During DNA Scanning via Ion-Pair Engineering.
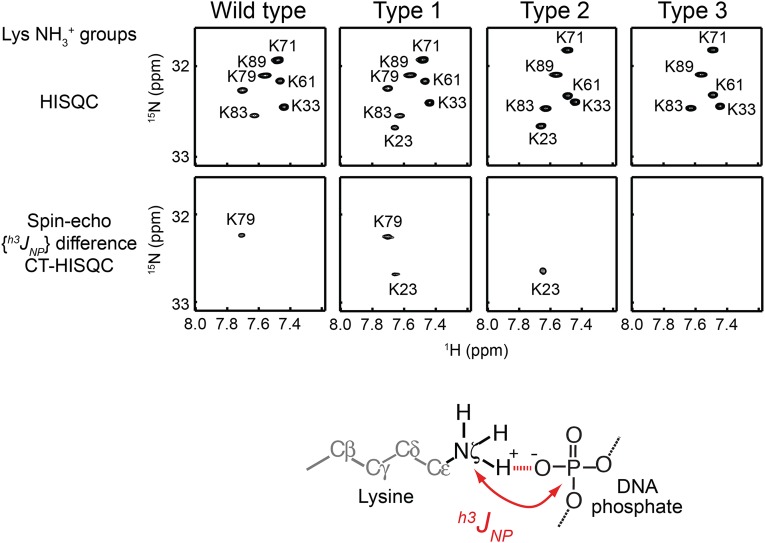
To test the abovementioned hypothesis, we shifted the equilibrium between the search and recognition modes and examined the kinetic consequences of the shifts. For this strategy, we used mutagenesis to modulate (i) nonspecific interactions between a ZF and DNA and (ii) interdomain interactions between ZFs. Weakening these interactions can shift the conformational equilibrium toward the search mode, whereas strengthening these interactions can shift it toward the recognition mode. To maintain the proteins’ original specificity to the target sequence, the mutations are limited to residues that are not in contact with bases of the DNA. Previously, we found that weaker ZF-DNA and ZF-ZF interactions cause local dissociation of ZF1 from DNA, while ZF2 and ZF3 are nonspecifically bound to DNA (28). Based on this finding, we modulated ZF-DNA and ZF-ZF interactions via engineering of the ion pairs at the ZF-DNA and ZF-ZF interfaces (Fig. 1B). The ZF-DNA interactions were modulated via mutations of T23 and K79. Although T23 and K79 are located at corresponding positions of ZF1 and ZF3, respectively, K79 of ZF3 forms an intermolecular ion pair with DNA phosphate and T23 of ZF1 does not. Therefore, the intermolecular ion pair with DNA can be added or removed from the ZF-DNA interfaces by the T23K or K79T mutation. We confirmed it by using an NMR method that was recently developed in our laboratory (36) for measuring scalar coupling between lysine side-chain 15N and DNA 31P nuclei across a hydrogen bond (Fig. S1). The ZF-ZF interactions were modulated via mutations of Q32 and E60. The ZF2-ZF3 interface involves an ion pair of R55 and E60, stabilizing the interface via the hydrogen bonds and electrostatic interactions (37), whereas the ZF1-ZF2 interface lacks such ionic interactions between corresponding residues Q32 and R27 (Fig. 1B). Therefore, the ZF-ZF interfaces can be stabilized or destabilized by the Q32E or E60Q mutation.
Fig. S1.
Engineering of intermolecular ion pairs between ZF and DNA as analyzed by 15N-31P scalar coupling h3JNP across a hydrogen bond. h3JNP data for the lysine side-chain NH3+ groups in the specific DNA complex of the Egr-1 ZF-DBDs were analyzed. The 1H-15N HISQC (63) and spin-echo h3JNP modulation difference constant-time HISQC (36) spectra for lysine NH3+ groups of each Egr-1 ZF-DBD bound to 12-bp target DNA are shown. The NH3+ resonances of this complex were assigned as previously (64). The spin-echo h3JNP modulation difference constant-time HISQC spectra show signals only for lysine NH3+ groups that form a hydrogen bond with DNA phosphate and exhibit sizable 15N-31P coupling across the hydrogen bond of the intermolecular ion pair (36). Because of the K79T mutation, the type 2 and type 3 mutant complexes do not show signals from K79. Because of the T23K mutation, type 1 and type 2 mutant complexes do show additional signals from K23. The presence of the h3JNP coupling for the K23 NH3+ group represents direct evidence of the intermolecular ion pair artificially introduced for the type 1 and type 2 mutant complexes (Fig. 1B).
By combining these mutations, we shifted the equilibrium between the search and recognition modes. We generated the T23K/Q32E double mutant (referred to as “type 1”) to shift toward the recognition mode, the T23K/Q32E/E60Q/K79T quadruple mutant to shift toward the search mode b (“type 2”), and the E60Q/K79T mutant (“type 3”) to enhance both the search modes a and b. Our previous NMR 15N relaxation, residual dipolar coupling (RDC), and paramagnetic relaxation enhancement (PRE) data clearly indicated that ZF1 is mainly dissociated from DNA, whereas ZF2 and ZF3 remain bound to DNA in the nonspecific DNA complex of wild-type (“type 0”) Egr-1 ZF-DBD (28). Because the most remarkable signature for this local dissociation was the 15N R1 relaxation data, we used 15N R1 relaxation to investigate the impact of these mutations on the conformational equilibrium between the search and recognition modes. Local dissociation of a ZF in the search modes should shorten the domain’s rotational correlation time because of the independent tumbling and thereby increases its overall 15N R1 relaxation rates. The nonspecific DNA complexes of the four constructs showed clearly different 15N R1 profiles, as shown in Fig. 1C. ZF1 in the type 0 and type 3 complexes showed clearly elevated 15N R1 rates, suggesting a major presence of the search mode a; ZF3 of the type 2 and type 3 complexes exhibited elevated 15N R1 rates, suggesting a major presence of the search mode b. No ZF showed elevated 15N R1 rates for the type 1 complex, suggesting a major presence of the recognition mode during DNA scanning.
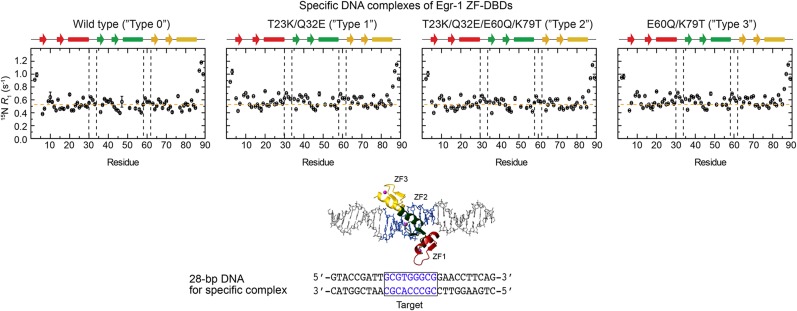
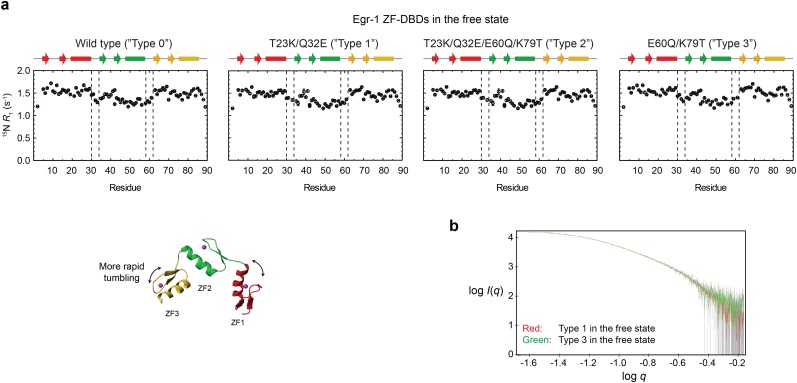
In contrast, these mutations did not affect the 15N R1 relaxation profiles for the specific complexes with the target DNA (Fig. S2), indicating that the mutant proteins are also locked in the recognition mode when they are bound to the target. Although one might expect that the mutations would impact the interdomain dynamics in the free state, our 15N R1 relaxation data for the Egr-1 ZF-DBDs in the free state showed otherwise (Fig. S3A). This was also supported by small-angle X-ray scattering (SAXS) data (Fig. S3B). The ZF-ZF packing in the free state might be too loose because of the lack of the C-terminal capping of ZFs’ α-helices in the absence of DNA (38). Our NMR data indicate that the mutations affect the interdomain dynamics only for nonspecific complexes and successfully shift the equilibrium between the search and recognition modes during the DNA-scanning process.
Fig. S2.
15N longitudinal relaxation rates R1 measured at the 1H frequency of 800 MHz for protein backbone amide groups of the specific complexes of Egr-1 ZF-DBDs with 28-bp DNA containing a target sequence. In contrast to the data for the nonspecific complexes shown in Fig. 1C, these specific complexes exhibit virtually the same 15N R1 profiles for the four constructs of Egr-1 ZF-DBDs.
Fig. S3.
Impact of the T23K, Q32E, E60Q, and K79T mutations on the interdomain dynamics of the free Egr-1 ZF-DBD. (A) 15N longitudinal relaxation rates R1 measured for protein backbone amide groups of the Egr-1 ZF-DBDs. For all four constructs of types 0–3, ZF1 and ZF3 exhibited larger R1 rates than ZF2, presumably because of less restricted domain motions (i.e., one linkage vs. two linkages). It should be noted that the 15N R1 profiles are similar for all of the four proteins in the free state. (B) SAXS data for the type 1 (red) and type 3 (green) mutant proteins in the free state. The SAXS data were collected with a Rigaku BioSAXS-1000 instrument using 4 mg/mL protein in the same buffer as that used for the NMR experiments. Intensity I is plotted as a function of the scattering vector q with logarithmic scales for both axes. The SAXS data for these proteins were statistically identical. These NMR and SAXS data indicate that the mutations do not significantly impact the interdomain dynamics of the Egr-1 ZF-DBD in the free state.
Trade-Off Between Search Efficiency and Binding Affinity.
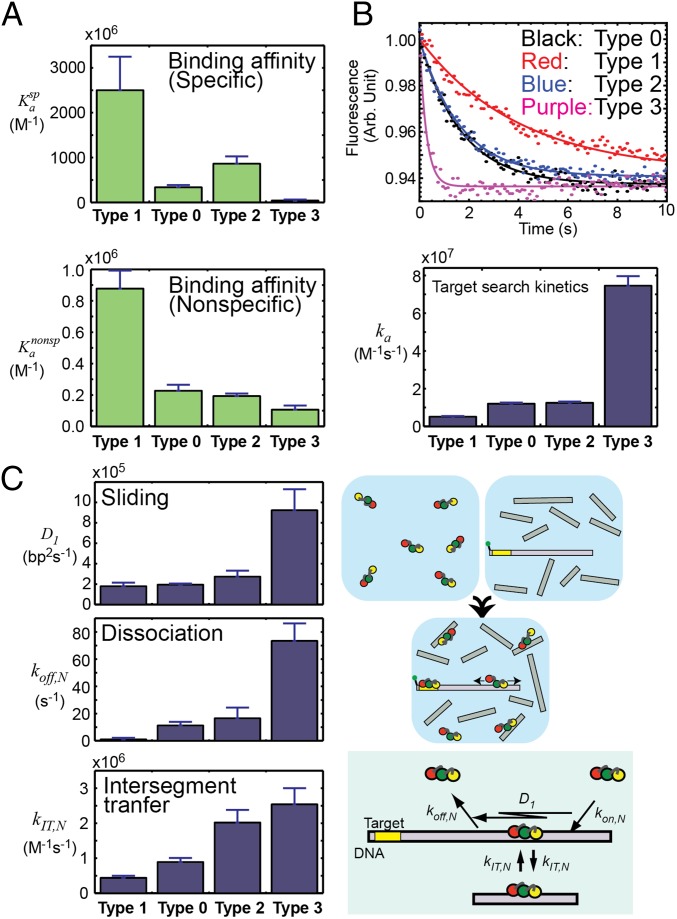
Taking advantage of these shifts, we examined the roles of the search and recognition modes during DNA scanning by Egr-1 ZF-DBD. Using fluorescence methods (26, 27), we compared the four types of Egr-1 ZF-DBDs in terms of the binding affinities and search kinetics. Fig. 2A shows binding affinities measured for specific and nonspecific DNA duplexes (also see Table S1 for the dissociation constants). The type 1 construct, which is primarily in the recognition mode during DNA scanning, exhibited the strongest affinities among the four constructs. The type 3 construct, for which both search modes a and b are enhanced, exhibited the weakest affinities. We also compared the target search kinetics by the stopped-flow fluorescence assay in which the protein was mixed at 150 mM KCl with a solution of 5′-fluorescein amidite (FAM)-labeled 143-bp DNA (2.5 nM) and sonicated calf thymus DNA (56 μM base pairs) as competitors in large excess (Fig. 2B). By monoexponential fitting to the fluorescence time-course data, we measured apparent pseudo-first-order rate constants kapp at distinct concentrations of the protein, from which the apparent second-order rate constants ka for the target association were determined (27) (Fig. 2B). The protein-concentration dependence data ensured that contribution of the backward first-order process to kapp (26, 27, 39) was negligible for each construct of Egr-1 ZF-DBD. The target search by the type 3 construct was fastest among the four constructs, and that by the type 1 construct was slowest. A shift of the conformational equilibrium toward the recognition mode resulted in higher affinities for both specific and nonspecific DNA sites but a lower efficiency in target search. This represents a kinetic defect in target search at the expense of high affinity, which renders the protein trapped on nonspecific DNA before reaching the target. In contrast, a shift toward the search modes resulted in lower affinities for DNA but a higher efficiency in target search (Figs. 2 A and B). As a result, the target search by the type 3 construct was 15-fold faster than that by type 1 construct in the stopped-flow assays.
Fig. 2.
Trade-off between target search efficiency and binding affinity of Egr-1 ZF-DBD. Data for the four constructs of Egr-1 ZF-DBD are compared. (A) Affinities for specific and nonspecific 12-bp DNA duplexes at 150 mM KCl. Association constants in M−1 are shown. Also see Table S1. (B) Target search kinetics analyzed by the stopped-flow fluorescence assay in which the protein was mixed at 150 mM KCl with a solution of fluorescence-labeled DNA (2.5 nM) and sonicated calf thymus DNA (56 μM base pairs) as competitors in large excess. (C) One-dimensional diffusion coefficient D1 for sliding, the dissociation rate constant koff,N for dissociation from nonspecific DNA, and the kinetic rate constant kIT,N for intersegment transfer between two nonspecific sites on district DNA duplexes. These kinetic parameters for translocation of the protein on DNA were measured as previously described (26, 27).
Table S1.
Dissociation constants (Kd) measured for the specific and nonspecific complexes of Egr-1 ZF-DBDs with 12-bp DNA duplexes at 150 mM KCl
| Egr-1 ZF-DBD | Kdspecific, nM | Kdnonspecific, nM |
| Type 1 | 0.4 ± 0.1 | (1.1 ± 0.2) × 103 |
| Type 0 | 3.0 ± 0.4 | (4.4 ± 0.8) × 103 |
| Type 2 | 1.2 ± 0.2 | (5.2 ± 0.4) × 103 |
| Type 3 | 32.8 ± 6.4 | (9.4 ± 0.2) × 103 |
Note that Fig. 2A shows the association constants (1/Kd), so that the larger values represent stronger binding. Data are sorted according to Kdnonspecific.
Impact on Protein Sliding, Dissociation, and Intersegment Transfer.
To understand how the shifts toward the search modes accelerate the target search, we investigated kinetics of translocation of the type 0–3 Egr-1 ZF-DBD proteins on nonspecific DNA. For this purpose, we used the stopped-flow-based assays together with a discrete-state stochastic kinetic model for protein translocation on DNA, which we previously developed (26, 27). In these assays, the time courses of the FAM fluorescence were monitored upon mixing the Egr-1 ZF-DBD protein with FAM-labeled probe DNA (2.5 nM) and nonspecific 28-bp DNA (1–16 μM) as competitor in large excess. The probe DNA duplexes used were 33, 48, 63, 88, 113, and 143 bp (sequences shown in ref. 26), each containing a single target sequence (GCGTGGGCG) near the 5′-terminal FAM probe. From these kinetic data, we determined the 1D diffusion coefficients D1 for sliding on DNA, the rate constants koff,N for dissociation from a nonspecific site on DNA, and the rate constants kIT,N for intersegment transfer between two nonspecific sites on distinct DNA duplexes (Fig. 2C). The data for the four constructs show that the shifts toward the search modes causes the faster dissociation, sliding, and intersegment transfer, which collectively accelerates the target search; the shift toward the recognition mode causes the opposite effects. These data suggest that the balance between the search and recognition modes during DNA scanning is an important determinant of the kinetic and thermodynamic properties of the ZF-DBD.
Computational Analysis of the Impact on Intersegment Transfer.
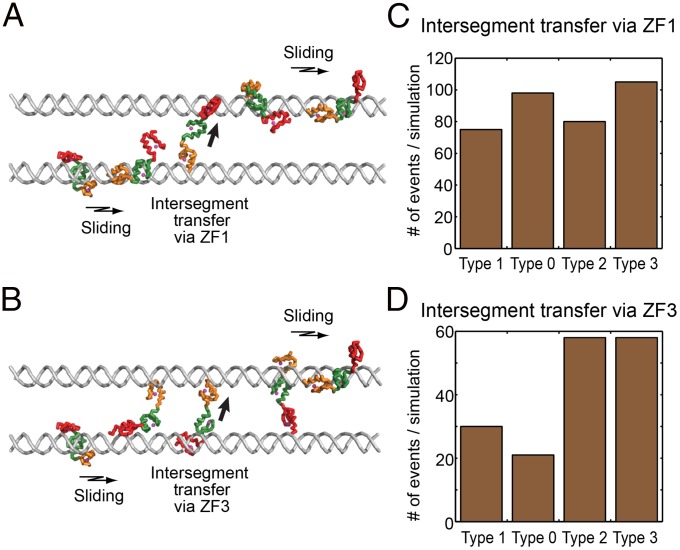
Our previous studies on the target DNA search process of Egr-1 demonstrated the importance of intersegment transfer (also known as direct transfer) between two nonspecific DNA sites (26–28). Efficient intersegment transfer was also experimentally observed for some other proteins (40–44). To gain further insight into the role of the search modes, we also conducted coarse-grained molecular dynamics simulations for investigating the intersegment transfer processes. This computational approach is well established and was previously used for several proteins, including Egr-1 (28, 45–47). In these simulations, two B-form DNA duplexes (100 bp) were placed in parallel with an interaxial distance of 60 Å, and we monitored how protein translocates on DNA for the four types of Egr-1 ZF-DBD constructs. The trajectories of these simulations showed that intersegment transfer can occur via the “monkey-bar” mechanism (45, 47) in two distinct manners: one is via ZF1, which captures the second DNA, whereas the other domains remain on the initial DNA (Fig. 3A); and the other via ZF3 (Fig. 3B). Each case involves an intermediate with a protein molecule transiently bridging two DNA duplexes via different ZFs. For the type 0 and type 3 constructs, where the search mode a is enhanced, intersegment transfer via ZF1 occurred more frequently than for the type 1 and type 2 constructs (Fig. 3C). Likewise, for the type 2 and type 3 constructs, for which the search mode b is enhanced, intersegment transfer via ZF3 occurred more frequently than for the type 0 and type 1 constructs (Fig. 3D). The coarse-grained simulations show that the different Egr-1 ZF-DBD constructs have different linear diffusion coefficients of the following order D1(type 3) ∼ D1(type 0) > D1(type 2) > D1(type 1). These computational data suggest that the shifts toward the search modes a and b enhance intersegment transfers via ZF1 and ZF3, respectively, by increasing the probability of forming intermediates with a protein molecule bridging two DNA duplexes via multiple ZFs.
Fig. 3.
Intersegment transfer observed in coarse-grained dynamics simulations for the four types of Egr-1 ZF-DBD constructs. (A) Snapshots for type 0 Egr-1 ZF-DBD. Intersegment transfer takes place mostly via ZF1. (B) Snapshots for type 3 Egr-1 ZF-DBD. Intersegment transfer takes place via both ZF1 and ZF3. (C) Frequency of intersegment transfer via ZF1. (D) Frequency of intersegment transfer via ZF3. The number of intersegmental transfer events was probed at salt concentration of 75 mM.
Improvement of ZFN via Optimizing Balance Between the Search/Recognition Modes.
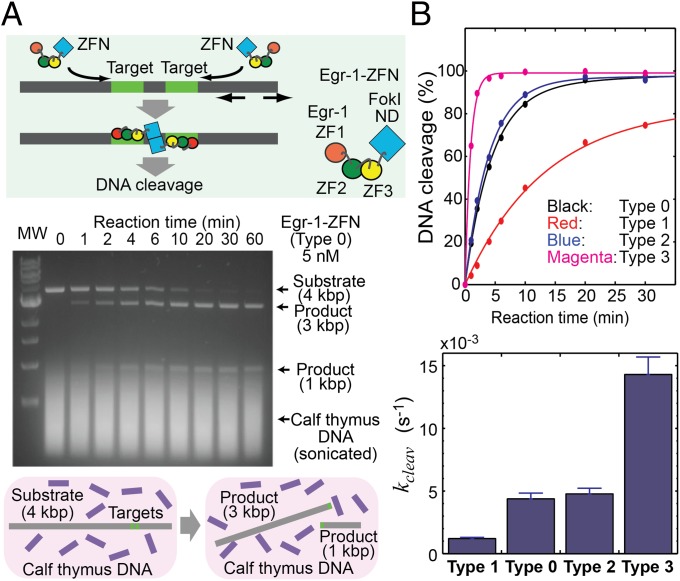
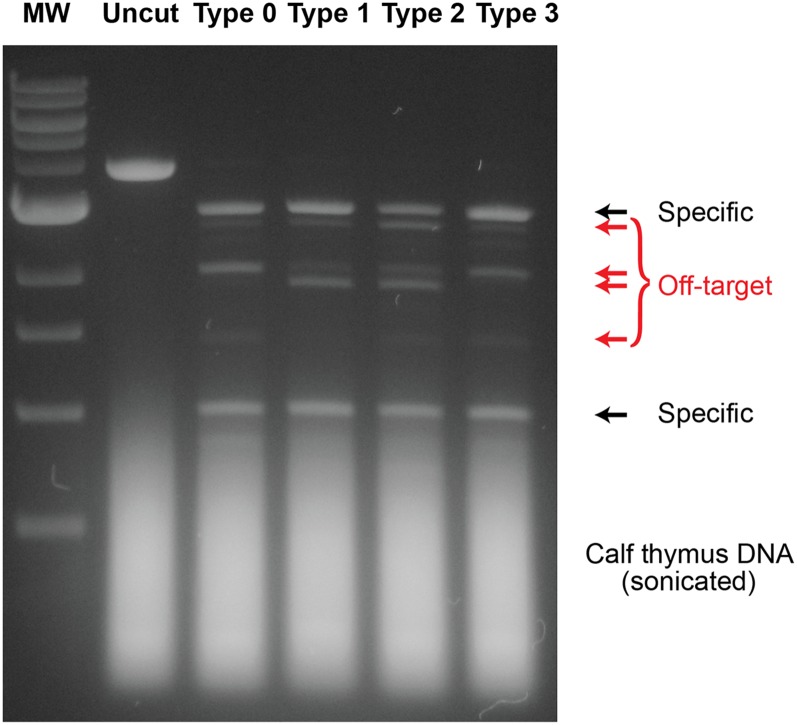
We examined whether these shifts of the conformational equilibrium also influence the kinetics of sequence-specific DNA cleavage by ZFNs. ZFNs are fusion proteins of a ZF-DBD with the FokI ND, and cleave double-stranded DNA in a sequence-specific manner via dimer formation of FokI ND at two target sites separated by several base pairs (4, 5). We constructed ZFNs comprising type 0, 1, 2, or 3 Egr-1 ZF-DBD and FokI ND and compared the kinetics of their sequence-specific DNA cleavage at physiological ionic strength (150 mM KCl). In our in vitro kinetic assays of ZFN, we monitored the site-specific cleavage of a 4-kbp linear DNA (1 nM; containing a target cleavage site for Egr-1 ZFN) in the presence of sonicated calf thymus DNA (56 μM base pairs) in large excess. This reaction produces 3- and 1-kbp DNA fragments (Fig. 4A; also see Fig. S4). With FokI ND’s catalytic rate constant (kcat) taken into consideration (48), the target search process should be the rate-limiting step for the sequence-specific DNA-cleavage reaction under our experimental conditions. Fig. 4B shows the observed rates for the sequence-specific DNA cleavage by 5 nM Egr-1 ZFNs in this assay. Despite its highest affinity, the type 1 Egr-1 ZFN exhibited the slowest DNA cleavage among the four constructs. In contrast, despite its lowest affinity, the type 3 Egr-1 ZFN exhibited the fastest DNA cleavage. The site-specific DNA cleavage by the type 3 Egr-1 ZFN was 14-fold faster than that by the type 1 Egr-1 ZFN, and these results are consistent with the abovementioned results from the stopped-flow assays for the Egr-1 ZF-DBDs. At a higher concentration of ZFN and a longer reaction time, we observed off-target DNA cleavage but virtually to the same degree for all four ZFN constructs (Fig. S5). Although high affinities are pursued in ZF engineering (1–3), our data show that a high affinity does not warrant kinetically optimal ZF proteins because they can be trapped at nonspecific sites more strongly, which hampers target search. This is also consistent with some previous reports that ZFNs containing a larger number of ZFs are less active in sequence-specific DNA cleavage (13, 14).
Fig. 4.
Enhancement of sequence-specific DNA-cleavage efficiency of Egr-1 ZFN by improving the target search efficiency. (A) Site-specific DNA cleavage by Egr-1 ZFN (type 0). The corresponding data for the other constructs are shown in Fig. S4. Reaction mixtures quenched at different times were subjected to 0.9% agarose/TBE gel electrophoresis. (B) Time courses of the site-specific DNA cleavage and the DNA-cleavage rates for the type 0, 1, 2, and 3 Egr-1 ZFNs.
Fig. S4.
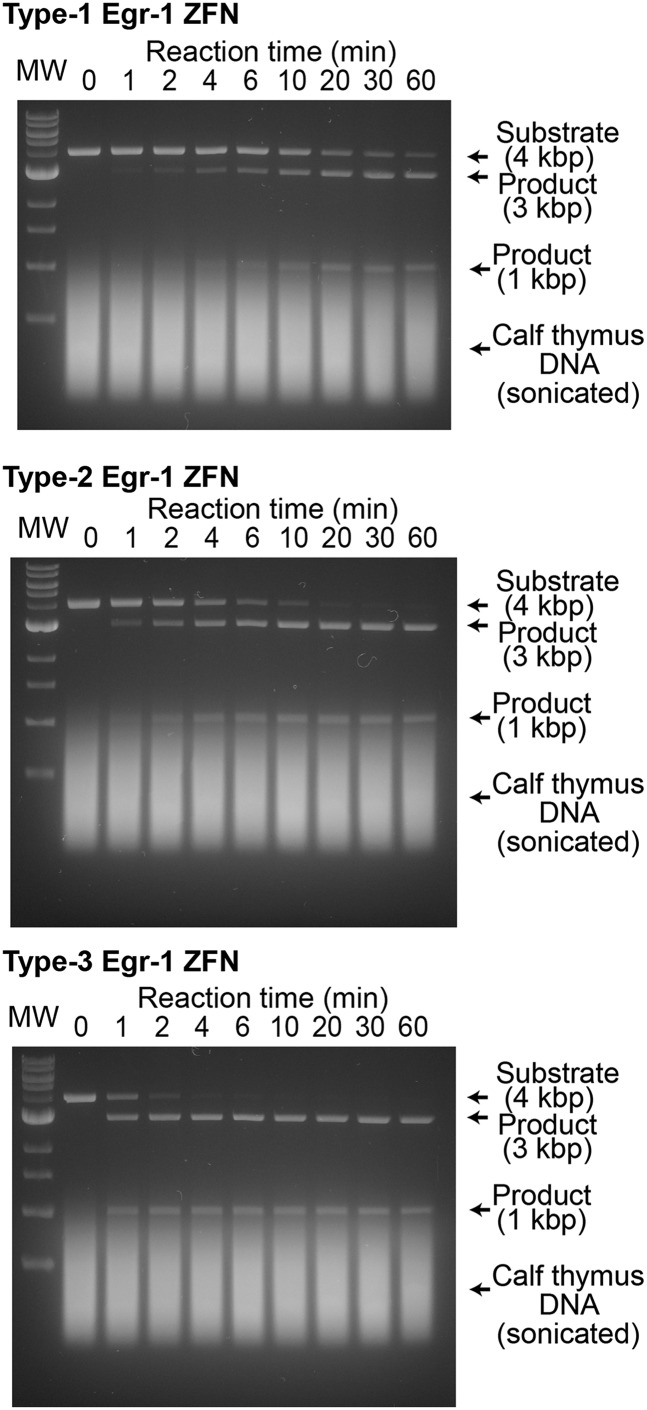
Sequence-specific DNA cleavage by type 1, 2, and 3 Egr-1 ZFNs. The corresponding data for type 0 Egr-1 ZFN is shown in Fig. 4A. Each assay of site-specific DNA cleavage by Egr-1 ZFN (5 nM) was carried out at 22 °C for a 900-μL solution of this linear 4-kbp substrate DNA (1 nM) in a buffer of 20 mM Tris⋅HCl (pH 7.5), 150 mM KCl, 0.1 mM ZnCl2, 1 mM MgCl2, 2 mM β-mercaptoethanol, 5% glycerol, and 37 μg/mL competitor DNA (corresponding to 56 μM base pairs). Sonicated calf thymus DNA (average length, ∼0.5 kbp) was used as the competitor. A 100-μL aliquot of the reaction mixture was sampled and quenched at distinct time points (0, 1, 2, 4, 6, 10, 20, 30, and 60 min). The lanes marked “MW” are for the molecular weight makers (NEB 1-kb DNA ladder) including 0.5, 1.0, 1.5, 2.0, 3.0, 4.0, 5.0, 6.0, 8.0, and 10.0-kbp DNA. Results of the kinetic analysis are shown in Fig. 4B.
Fig. S5.
Off-target DNA cleavage by type 0, 1, 2, and 3 Egr-1 ZFNs at a high concentration. This experiment was performed using the same experimental conditions as those used for Fig. 4 and Fig. S4, except that 50 nM Egr-1 ZFN was used instead of 5 nM. The reaction time was 60 min for each. DNA bands indicated by red arrows correspond to the products of the off-target DNA cleavage.
Target Search Requiring Displacement of Other Proteins.
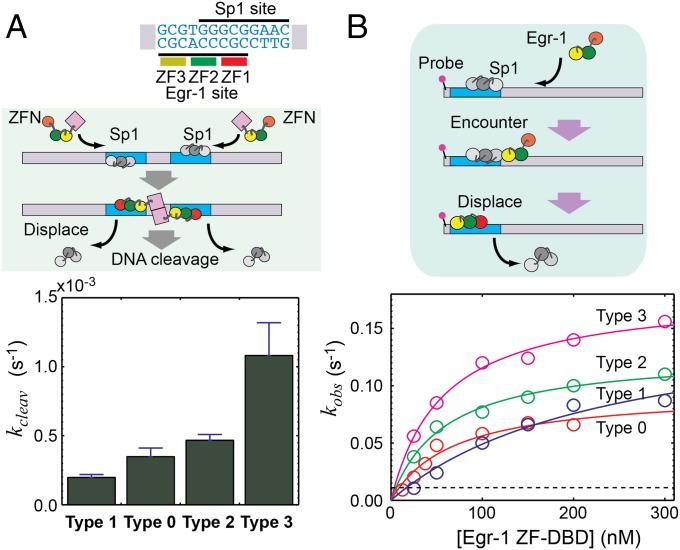
The results shown above were obtained from assays in the absence of other proteins. In the nuclei, however, many different proteins compete for particular sites on DNA. For example, upon cellular stimuli such as neuronal signals and vascular stress, the inducible transcription factor Egr-1 displaces the constitutive transcription factor Sp1 (which binds to DNA via 3 ZFs) from their overlapping target sites in some gene promoters (29, 49, 50). To investigate the extent to which the shifts of the search/recognition modes influence Egr-1’s target search kinetics in the presence of Sp1, we also conducted the kinetic assays for the four Egr-1 ZFNs using the Egr-1–Sp1 overlapping sites that Sp1 ZF-DBD initially occupied (Fig. 5A). In this assay, unless Sp1 is displaced from the overlapping sites, the Egr-1 ZFNs would not be able to carry out the site-specific DNA cleavage. Interestingly, the type 3 Egr-1 ZFN exhibited the fastest sequence-specific DNA cleavage in this assay as well. To gain more insight into the displacement process, we also conducted stopped-flow experiments using 5′-FAM–labeled 117-bp DNA that contains Egr-1/Sp1 overlapping target sites to which Sp1 ZF-DBD was initially bound. The presence of Sp1 ZF-DBD at the overlapping target site made the target association of Egr-1 ZF-DBDs >100-fold slower. For all constructs of Egr-1 ZF-DBDs, the target association kinetics in the presence of Sp1 ZF-DBD showed hyperbolic (rather than linear) dependence on the concentration of Egr-1 ZF-DBD (Fig. 5B). This suggests that the rate-limiting step at high concentrations is a first-order process, which is likely to be the displacement of Sp1 by Egr-1 upon formation of the encounter complex. In this case, the asymptote of the hyperbolic dependence corresponds to the first-order rate constant kdisp for displacement of Sp1 ZF-DBD by Egr-1 ZF-DBD nonspecifically bound to DNA. Interestingly, the kdisp constant for each construct of Egr-1 ZF-DBD was significantly larger than the rate constant for spontaneous dissociation of Sp1 from its target in the absence of Egr-1 (Fig. 5B; also see Fig. S6 and Table S2). These results suggest that in the displacement process, Egr-1 enhances Sp1’s dissociation from the overlapping target site, rather than passively awaiting its spontaneous dissociation. The first-order rate constants kdisp were comparable for the four constructs of Egr-1 ZF-DBDs. Nonetheless, especially at relatively low concentrations, the overall displacement process for type 3 Egr-1 ZF-DBD was significantly faster than those for the other three constructs, largely because this construct can reach the overlapping target sites more rapidly than the other constructs do.
Fig. 5.
Displacement of the Sp1 ZF-DBD from the overlapping target sites. (A) Kinetics of the site-specific DNA cleavage by Egr-1 ZFNs in the presence the Sp1 ZF-DBD bound to the overlapping target sites. This assay was conducted using the Egr-1 ZFN (5 nM), 28-bp nonspecific competitor DNA (2,000 nM), and 4-kbp substrate DNA (1 nM) containing Egr-1/Sp1 overlapping sites, which Sp1 ZF-DBD (200 nM) initially occupied. (B) Kinetics of the Egr-1 ZF-DBDs' target association that requires displacement of Sp1 ZF-DBD from the overlapping target site. Apparent pseudo-first-order rate constants are plotted as a function of the concentrations of Egr-1 ZF-DBDs. Solid lines represent the best-fit curves obtained by hyperbolic fitting (see Materials and Methods). A dotted line represents the value of the rate constant for Sp1’s spontaneous dissociation from the overlapping site in the absence of Egr-1 ZF-DBDs (Fig. S6).
Fig S6.
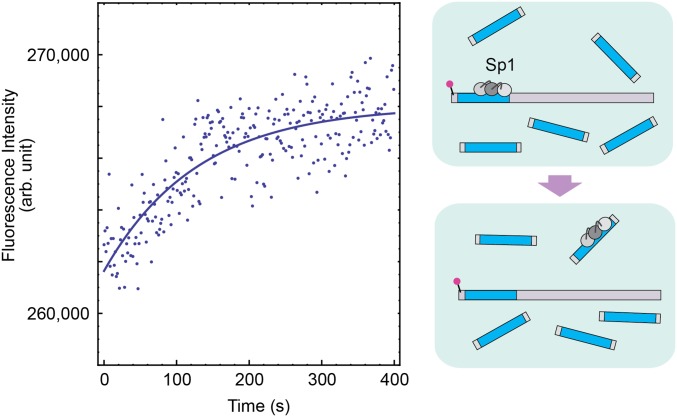
Kinetics of dissociation of Sp1 ZF-DBD from the FAM-labeled 117-bp DNA in the absence of Egr-1 ZF-DBD. In this experiment, the FAM fluorescence was monitored immediately after a solution of the FAM-labeled 117-bp DNA (5 nM) and Sp1 ZF-DBD (50 nM) was mixed with a solution of unlabeled 28-bp DNA containing the overlapping target sites (2,000 nM). Before mixing these two solutions, the target site of the FAM-labeled 117-bp DNA was initially bound to Sp1 ZF-DBD. Once dissociated from the FAM-labeled DNA, Sp1 ZF-DBD binds to the unlabeled 28-bp DNA. This transfer via dissociation increases the FAM fluorescence intensity. In fact, this increase was of the same magnitude as the fluorescence quenching observed upon Sp1’s binding to the probe DNA. Compared with the change upon binding of Egr-1 ZF-DBD to the Egr-1 target site on the same DNA, the change in fluorescence intensity upon binding of Sp1 is relatively small because the Sp1 site is apart by 5 bp from the 5′ terminus to which FAM is attached. The buffer conditions were the same as those used for Fig. 5B. By monoexponential fitting for the data of 9 replicates, the rate constant koff,Sp1 for spontaneous dissociation of Sp1 from the overlapping Egr-1/Sp1 target site was determined to be 0.011 ± 0.001 s−1.
Table S2.
Kinetic data for displacement of Sp1 ZF-DBD by Egr-1 ZF-DBDs
| Egr-1 ZF-DBD | kdisp (s−1)* | kdisp/koff,Sp1† | kdisp/Aen, M−1 s−1‡ |
| Type 1 | 0.17 ± 0.04 | 15 ± 4 | (0.7 ± 0.1) × 106 |
| Type 0 | 0.09 ± 0.01 | 9 ± 1 | (1.4 ± 0.3) × 106 |
| Type 2 | 0.13 ± 0.01 | 12 ± 1 | (2.2 ± 0.2) × 106 |
| Type 3 | 0.18 ± 0.01 | 16 ± 2 | (3.2 ± 0.3) × 106 |
Values of the first-order rate constant for displacement kdisp were obtained from the data shown in Fig. 5B via nonlinear least-squares fitting with kobs = kdisp Ptot/(Aen + Ptot), where Ptot represents a total concentration of Egr-1 ZF-DBD, and Aen represents an apparent steady-state constant for the encounter complex.
The parameter koff,Sp1 represents the rate constant for Sp1 ZF-DBD’s spontaneous dissociation from the overlapping target site (Fig. S6). The ratio kdisp/koff,Sp1 corresponds to enhancement of Sp1 ZF-DBD’s dissociation by Egr-1 ZF-DBD.
This corresponds to the second-order rate constant for the overall process at relatively low concentrations of Egr-1 ZF-DBD (i.e., Ptot << Aen).
Discussion
Since Riggs et al. discovered amazingly rapid target location by the E. coli lac repressor in 1970 (51), the mechanisms that allow DNA-binding proteins to efficiently locate their target DNA sites have been studied both experimentally and theoretically (15–22). Despite its long history over four decades, the field has remained descriptive, lacking the maturity required to enable engineering to improve the kinetic properties of natural or artificial proteins. Our current work breaks through this situation, demonstrating that improving the kinetic properties of ZF proteins is possible via engineering based on structural dynamic knowledge of the DNA-scanning process at molecular and atomic levels. Our key approach is modulation of the dynamic conformational ensemble in molecular recognition process, which has been proposed as a potentially effective strategy for protein engineering in general (52). As demonstrated above, this strategy is effective for engineering of ZF proteins to improve their kinetic properties. Although our current work is limited to Egr-1 ZF-DBD and its ZFN derivatives, we expect that our strategy is directly applicable to many artificial ZF proteins because Egr-1 (Zif268) has been used as a major scaffold for ZF technology (1–3). It is also noteworthy that interdomain dynamics are known for other natural C2H2-type ZF proteins (53–55). Although conventional engineering of artificial proteins as ZFN and TALEN (4, 5, 7, 8) focuses on affinity and specificity, a simplistic pursuit of these properties can lead to kinetically deficient proteins that are easily trapped at nonspecific sites on DNA, as seen for our type 1 constructs. Understanding DNA-scanning mechanisms at molecular and atomic levels enables creation of proteins that locate their target sites more rapidly. In fact, we found that the sequence-specific DNA cleavage by the type 3 Egr-1 ZFN was 14-fold faster than that by the type 1 construct, which exhibits the highest affinity for the target. Balanced design in terms of target search efficiency and binding affinity may greatly improve genome editing and gene control by artificial proteins and boost the applications of such proteins to basic science, therapeutics, and biotechnologies.
Materials and Methods
Preparation of ZF Proteins.
The human Egr-1 ZF-DBD comprising three ZF domains (Egr-1 residues 335–423) was prepared as described previously (26–28, 56). Numbering of the DBD residues used in this paper is according to Pavletich and Pabo (37). The synthetic gene of the Egr-1 ZFN comprising Egr-1 ZF-DBD and FokI ND was expressed as a GST-fusion protein in E. coli. The GST-fusion proteins of Egr-1 ZFNs were purified via a glutathione–Sepharose FF column (GE Healthcare). After cleavage of the fusion protein by HRV-3C protease (Genway), Egr-1 ZFN was further purified via a HiTrap heparin HP column (GE Healthcare). The plasmids for the mutant Egr-1 ZF proteins were prepared using the QuikChange Lightning mutagenesis kit (Stratagene). The mutant Egr-1 proteins were expressed in E. coli and purified using the same methods as those for the wild-type proteins. Complete amino acid sequences of the Egr-1 ZF-DBD and ZFN constructs are given in Fig. S7. The human Sp1 ZF-DBD (Sp1 residue 616–709) comprising three ZFs was expressed in E. coli strain BL21(DE3) via a pET-49b–derivative plasmid and chromatographically purified using cation-exchange and size-exclusion chromatography as described (57). For Egr-1 ZF-DBDs, protein concentrations were measured with Pierce BCA Protein Assay kit (ThermoFisher) (Pierce Biotechnology) using bovine serum albumin as standard. For the other proteins, concentrations were measured with UV absorbance at 280 nm together with the extinction coefficients of 28,880 cm−1 M−1 for Egr-1 ZFNs and 14,000 cm−1 M−1 for Sp1 ZF-DBDs.
Fig S7.
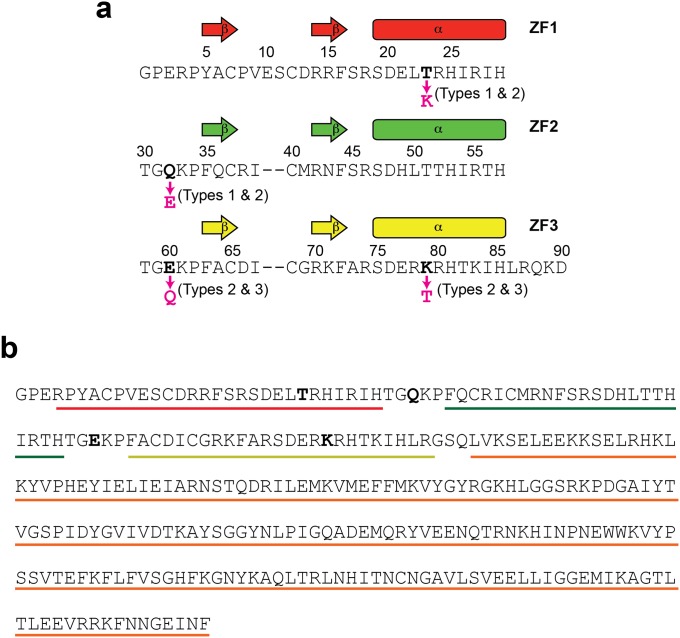
The Egr-1 ZF protein constructs used in this study. (A) The amino acid sequence of the Egr-1 ZF-DBD constructs. Each construct is a 91-residue protein containing 3 ZFs. The first two residues are from the expression vector. The residue numbering is according to Pavletich and Pabo (37). The sequences of individual ZFs are aligned, and the mutation sites for type 1, 2, and 3 mutant proteins are indicated. (B) The amino acid sequence of the type 0 Egr-1 ZFN. Regions of Egr-1 ZF1, ZF2, ZF3, and FokI ND are indicated by red, green, yellow, and orange lines, respectively. The mutation sites for type 1, 2, and 3 constructs are shown in bold.
NMR Spectroscopy for Nonspecific and Specific DNA Complexes of Egr-1 ZF-DBDs.
NMR experiments were performed using Bruker Avance III spectrometers equipped with a cryogenic probe operated at the 1H frequency of 800 MHz. NMR samples of the specific and nonspecific complexes of 2H/15N-labeled Egr-1 ZF-DBDs with 28-bp DNA duplexes were prepared as described previously (28). For each sample of the complexes, the molar ratio of protein to DNA was 1:2 to ensure the DNA-bound states of the isotope-labeled proteins. For the nonspecific and specific DNA complexes of the wild-type Egr-1 ZF-DBD, resonances were assigned using 1H/13C/15N triple resonance spectra (28). Based on the assignment for the wild-type complexes, backbone 1H and 15N resonances of the mutant complexes were assigned using 3D F1-15N–edited NOESY and 3D F1/F2 double 15N-edited NOESY spectra. Backbone amide 15N relaxation parameters were measured for the complexes as described (58). Information about NMR experiments to analyze the intermolecular ion pairs of lysine side-chain NH3+ and DNA phosphate groups is given in the legend of Fig. S1.
Kinetic Studies of Association, Dissociation, Sliding, and Intersegment Transfer of Egr-1 ZF-DBDs.
The target search kinetics of Egr-1 ZF-DBDs were measured at 20 °C using an ISS PC-1 spectrofluorometer equipped with an Applied Photophysics Rx.2000 stopped-flow device as described (26, 27). In this assay, the time courses of the FAM fluorescence were monitored upon mixing two solutions: (i) the Egr-1 ZF protein (20–250 nM); and (ii) FAM-labeled probe DNA (2.5 nM) and competitor DNA (28–448 μM base pairs) in large excess. As the competitor DNA, sonicated calf thymus DNA (56 μM base pairs) was used for Fig. 2A, and 28-bp nonspecific DNA (the sequence given in the legend for Fig. 1C) was used for Fig. 2B. The buffer contained 10 mM Tris⋅HCl (pH 7.5), 200 nM ZnCl2, and KCl (150 mM for Fig. 2A; 80 mM KCl for Fig. 2B). We previously reported results for the wild-type Egr-1 ZF-DBD under the same conditions as well as at other ionic strengths (40–400 mM KCl) (27). By monoexponential fitting to the fluorescence time-course data, apparent pseudo-first-order rate constants kapp were measured at distinct concentrations of the protein, from which the apparent second-order rate constants ka for the target association were determined (27). The sliding length λ and 1D diffusion coefficient D1 for sliding were determined using the rate constants ka using 33-, 48-, 63-, 83-, 113-, and 143-bp probe DNA (2.5 nM) and 28-bp competitor DNA (2 μM) as described (27). To analyze intersegment transfer between two nonspecific sites on distinct DNA duplexes, we measured the rate constants ka using 113-bp probe DNA (2.5 nM) and 28-bp competitor DNA at various concentrations (1–16 μM) as described (27). Affinities for DNA were measured at various concentrations of KCl using fluorescence anisotropy of tetramethylrhodamine (TAMRA) tethered to the 3′ terminus of DNA as previously described for wild-type Egr-1 ZF-DBD (26). When direct measurement was difficult at 150 mM KCl, the equilibrium constants Ka were measured at several different concentrations of KCl, and the data were extrapolated to Ka at 150 mM KCl under the assumption of a linear relationship between log[KCl] and logKa based on the counterion condensation theory (59).
Coarse-Grained Molecular Dynamics Simulations of Intersegment Transfer.
The coarse-grained molecular dynamics simulations of the intersegment transfer between two DNA duplexes were performed for type 0–3 Egr-1 ZF-DBDs using a reduced model (45, 60) that allows sampling of long time-scale processes. In these simulations, two 100-bp DNA duplexes in B-form were placed in parallel with a distance of 60 Å. DNA was modeled with three beads per nucleotide, representing the phosphate, sugar, and base. Each bead was located at the geometric center of the group it represents and a negative point charge was assigned to beads representing the DNA phosphate groups. The DNA remained in-place and rigid throughout the simulations. The protein was represented by a single bead for each residue located at the Cα of that residue. Unlike the DNA, the protein remained flexible during the simulations but was simulated at temperature where folding and unfolding events are unlikely. Nonspecific protein–DNA interactions were modeled by electrostatic interactions between all charged residues of the protein and the phosphate beads of the DNA using the Debye–Hückel potential, which accounts for the ionic strength of a solute immersed in aqueous solution. The mutants were modeled by introducing or eliminating charges at the corresponding Cα beads. For example, mutant type 1 was studied by adding point charges of +1 and −1 to the Cα beads of sites 23 and 32, respectively. The type 1 mutant was also studied adding a contact between the Ca beads of Q32 and R27. This contact is expected to be formed by the Q32E mutation. Similar results were observed when having a negative charge at Q32 or by adding a contact (the +1 on T23 was modeled in both cases). Similar modeling scheme was used to model mutants types 2 and 3. Further details of the simulations and the analyses can be found in previous publications of Levy and coworkers (28, 31, 45–47, 60).
Kinetic Analysis of DNA Cleavage by Egr-1 ZFNs.
The target sequence of Egr1-ZFN (CGCCCACGCTTTAAAGCGTGGGCGA; Egr-1 recognition sites underlined) was inserted into the pCR-TOPO-2.1 vector using the TOPO TA Cloning kit (Invitrogen). The resultant plasmid was amplified using a 50-mL LB medium culture of the E. coli strain Top10 and purified with the Qiagen Plasmid Midi kit. The circular plasmid was linearized by the restriction enzyme BglII (New England Biolab) and purified via Qiagen spin columns. Each assay of site-specific DNA cleavage by Egr-1 ZFNs was carried out at 22 °C for a 900-μL solution of this linear 4-kbp substrate DNA (1 nM) in a buffer containing 20 mM Tris⋅HCl (pH 7.5), 150 mM KCl, 0.1 mM ZnCl2, 1 mM MgCl2, 2 mM β-mercaptoethanol, 5% (vol/vol) glycerol, and 37 μg/mL competitor DNA (corresponding to 56 μM of base pairs). Sonicated calf thymus DNA (average length ∼0.5 kbp) was used as the competitor for Fig. 4 A and B and Fig. S4, whereas 28-bp nonspecific DNA was used for Fig. 5A. The sequence-specific DNA-cleavage reaction, which should produce 3-kbp and 1-kbp fragments from the 4-kbp substrate, was initiated by adding 5 nM Egr-1 ZFN. A 100-μL aliquot of the reaction mixture was sampled at distinct time points (typically, 0, 1, 2, 4, 6, 10, 20, 30, and 60 min), and the reaction of each aliquot was quenched by adding 500 μL of Buffer PB (Qiagen), which denatures proteins. DNA was isolated from the quenched reaction mixtures using Qiagen spin columns. The DNA samples mixed with EZ-Vision (Amresco) were subjected to 0.9% agarose gel electrophoresis with TBE buffer (Invitrogen). DNA in the gel was visualized with fluorescence from the EZ-Vision dye using a uniform UV transilluminator, and band intensities of the 4-kbp substrate and the 3-kbp product were quantified using ImageJ software. The band of the 1-kbp product was not analyzed because of overlap with smeared bands of sonicated calf thymus DNA. The time-course data of the relative population of the 3-kbp product were analyzed via nonlinear least-squares fitting with a biexponential function. The initial apparent pseudo-first-order rate constant (i.e., the first derivative of the fitting function at time 0) was determined and compared for the four constructs of Egr-1 ZFNs. MATLAB software (MathWorks) was used for the kinetic analysis. Off-target DNA cleavage (Fig. S5) was analyzed using the same experimental conditions except that 50 nM Egr-1 ZFN (instead of 5 nM) and longer reaction times were used.
Kinetic Assays of Sp1 Displacement by Egr-1 ZF-DBD.
For the kinetics analysis of Sp1 displacement by Egr-1 ZF-DBDs, we used a 5′-FAM–labeled 117-bp DNA with a 5′-terminal sequence, FAM-AGCGTGGGCGGAACCT, which contains overlapping Egr-1 (bold) and Sp1 (underlined) sites. This 117-bp DNA for the fluorescence experiments was made using PCR with the pUC-19 plasmid (as a template), a 5′-FAM–labeled 37-mer primer that hybridizes with positions 1160–1180 of pUC-19, and a reverse primer dAGATACTACATACCTCGCTCTGCTAAT. The overlapping Egr1 and Sp1 target sites were included in the FAM-labeled 37-mer primer. By another primer design, the Egr-1 and Sp1 sites can in principle be separated for investigating the process whereby Egr-1 bypasses Sp1 as an obstacle, although we did not use such constructs in this work. The FAM-labeled 117-bp DNA duplex was purified as described previously (26). The kinetics of Sp1 displacement by Egr-1 ZF-DBD were measured at 20 °C in a buffer of 10 mM Tris⋅HCl (pH 7.5), 80 mM KCl, and 200 nM ZnCl2. Egr-1 ZF-DBD (20–400 nM) was added to a preequilibrated solution of 28-bp nonspecific competitor DNA (2,000 nM), the 5′-FAM–labeled 117-bp DNA (5 nM), and Sp1 ZF-DBD (50 nM). Under these conditions, Sp1 initially occupied the overlapping target site before adding Egr-1. Changes in FAM fluorescence intensity were monitored as a function of time upon the addition of Egr-1 ZF-DBD, which eventually displaced Sp1 from the overlapping sites and bound to the target. Pseudo-first-order rate constants kapp for the target association of Egr-1 ZF-DBD were measured at several concentrations of Egr-1 ZF-DBD. The first-order rate constant kdisp for displacement of Sp1 ZF-DBD by Egr-1 ZF-DBD (i.e., transition from the encounter ternary complex to the final specific DNA complex of Egr-1) was determined from the Egr-1-concentration dependence of kapp data via nonlinear least-squares fitting with , where kdisp is a first-order rate constant for displacement, Ptot is the total concentration of Egr-1 ZF-DBD, and Aen corresponds to an apparent steady-state constant for an encounter complex and is independent of Ptot and kdisp. This hyperbolic expression assumes a first-order process from the encounter complex (target DNA-Sp1⋅⋅⋅Egr-1) to the final binary complex (target DNA–Egr-1) and can be derived in a manner similar to that for the Michaelis–Menten kinetics (61, 62). The first-order rate constant kdisp corresponds to the asymptote of the Ptot dependence of kapp constants. We measured the rate constants kdisp for the four constructs of Egr-1 ZF-DBDs. The kdisp data were compared with the first-order rate constant koff,Sp1 for spontaneous dissociation of Sp1 ZF-DBD from the overlapping target site in the absence of Egr-1 ZF-DBD (details are given in Fig. S6).
Egr-1 ZFN DNA-Cleavage Assays in the Presence of Sp1 Bound to the Overlapping Target Site.
A substrate sequence, GGTTCCGCCCACGCTTTAAAGCGTGGGCGGAACCA, which contains overlapping Egr-1 (bold) and Sp1 (underlined) sites, was subcloned into the pCR-TOPO-2.1 vector and linearized via BglII digestion as described above. Sequence-specific DNA cleavage by Egr-1 ZFN in the presence of Sp1 ZF-DBD bound to the overlapping site was analyzed using the above-described conditions except that: (i) 200 nM Sp1 ZF-DBD was added to the solution 10 min before adding Egr-1 ZFN; and (ii) instead of calf thymus DNA, 28-bp nonspecific DNA duplex (legend of Fig. 1) was used as the competitor DNA. The latter condition was necessary to let Sp1 ZF-DBD occupy the overlapping target sites. When calf thymus DNA was used as the competitor, the presence of Sp1 in the reaction mixture did not significantly affect the kinetics of DNA cleavage by Egr-1 ZFN, presumably because the Sp1 occupancy at the overlapping site was low because of many natural Sp1 sites in calf thymus DNA.
Acknowledgments
We thank Drs. Tianzhi Wang and Mark White for technical assistance in NMR and X-ray facilities. This work was supported by National Institutes of Health Grants R01GM107590 and R01GM105931 (to J.I.) and US–Israel Binational Science Foundation Grant 2010424 (to. J.I. and Y.L.).
Footnotes
The authors declare no conflict of interest.
This article is a PNAS Direct Submission.
This article contains supporting information online at www.pnas.org/lookup/suppl/doi:10.1073/pnas.1507726112/-/DCSupplemental.
References
- 1.Choo Y, Isalan M. Advances in zinc finger engineering. Curr Opin Struct Biol. 2000;10(4):411–416. doi: 10.1016/s0959-440x(00)00107-x. [DOI] [PubMed] [Google Scholar]
- 2.Pabo CO, Peisach E, Grant RA. Design and selection of novel Cys2His2 zinc finger proteins. Annu Rev Biochem. 2001;70:313–340. doi: 10.1146/annurev.biochem.70.1.313. [DOI] [PubMed] [Google Scholar]
- 3.Segal DJ, Barbas CF., 3rd Custom DNA-binding proteins come of age: Polydactyl zinc-finger proteins. Curr Opin Biotechnol. 2001;12(6):632–637. doi: 10.1016/s0958-1669(01)00272-5. [DOI] [PubMed] [Google Scholar]
- 4.Durai S, et al. Zinc finger nucleases: Custom-designed molecular scissors for genome engineering of plant and mammalian cells. Nucleic Acids Res. 2005;33(18):5978–5990. doi: 10.1093/nar/gki912. [DOI] [PMC free article] [PubMed] [Google Scholar]
- 5.Urnov FD, Rebar EJ, Holmes MC, Zhang HS, Gregory PD. Genome editing with engineered zinc finger nucleases. Nat Rev Genet. 2010;11(9):636–646. doi: 10.1038/nrg2842. [DOI] [PubMed] [Google Scholar]
- 6.Gaj T, Gersbach CA, Barbas CF., 3rd ZFN, TALEN, and CRISPR/Cas-based methods for genome engineering. Trends Biotechnol. 2013;31(7):397–405. doi: 10.1016/j.tibtech.2013.04.004. [DOI] [PMC free article] [PubMed] [Google Scholar]
- 7.Joung JK, Sander JD. TALENs: A widely applicable technology for targeted genome editing. Nat Rev Mol Cell Biol. 2013;14(1):49–55. doi: 10.1038/nrm3486. [DOI] [PMC free article] [PubMed] [Google Scholar]
- 8.Tebas P, et al. Gene editing of CCR5 in autologous CD4 T cells of persons infected with HIV. N Engl J Med. 2014;370(10):901–910. doi: 10.1056/NEJMoa1300662. [DOI] [PMC free article] [PubMed] [Google Scholar]
- 9.Li H, et al. In vivo genome editing restores haemostasis in a mouse model of haemophilia. Nature. 2011;475(7355):217–221. doi: 10.1038/nature10177. [DOI] [PMC free article] [PubMed] [Google Scholar]
- 10.Soldner F, et al. Generation of isogenic pluripotent stem cells differing exclusively at two early onset Parkinson point mutations. Cell. 2011;146(2):318–331. doi: 10.1016/j.cell.2011.06.019. [DOI] [PMC free article] [PubMed] [Google Scholar]
- 11.Isalan M. Zinc-finger nucleases: How to play two good hands. Nat Methods. 2012;9(1):32–34. doi: 10.1038/nmeth.1805. [DOI] [PubMed] [Google Scholar]
- 12.Morisaki T, Imanishi M, Futaki S, Sugiura Y. Rapid transcriptional activity in vivo and slow DNA binding in vitro by an artificial multi-zinc finger protein. Biochemistry. 2008;47(38):10171–10177. doi: 10.1021/bi801124b. [DOI] [PubMed] [Google Scholar]
- 13.Pattanayak V, Ramirez CL, Joung JK, Liu DR. Revealing off-target cleavage specificities of zinc-finger nucleases by in vitro selection. Nat Methods. 2011;8(9):765–770. doi: 10.1038/nmeth.1670. [DOI] [PMC free article] [PubMed] [Google Scholar]
- 14.Shimizu Y, et al. Adding fingers to an engineered zinc finger nuclease can reduce activity. Biochemistry. 2011;50(22):5033–5041. doi: 10.1021/bi200393g. [DOI] [PMC free article] [PubMed] [Google Scholar]
- 15.von Hippel PH, Berg OG. Facilitated target location in biological systems. J Biol Chem. 1989;264(2):675–678. [PubMed] [Google Scholar]
- 16.Halford SE, Marko JF. How do site-specific DNA-binding proteins find their targets? Nucleic Acids Res. 2004;32(10):3040–3052. doi: 10.1093/nar/gkh624. [DOI] [PMC free article] [PubMed] [Google Scholar]
- 17.Zhou HX. A model for the mediation of processivity of DNA-targeting proteins by nonspecific binding: Dependence on DNA length and presence of obstacles. Biophys J. 2005;88(3):1608–1615. doi: 10.1529/biophysj.104.052688. [DOI] [PMC free article] [PubMed] [Google Scholar]
- 18.Gorman J, Greene EC. Visualizing one-dimensional diffusion of proteins along DNA. Nat Struct Mol Biol. 2008;15(8):768–774. doi: 10.1038/nsmb.1441. [DOI] [PubMed] [Google Scholar]
- 19.Mirny L, et al. How a protein searches for its site on DNA: The mechanism of facilitated diffusion. J Phys A Math Theor. 2009;42:401335. [Google Scholar]
- 20.Halford SE. An end to 40 years of mistakes in DNA-protein association kinetics? Biochem Soc Trans. 2009;37(Pt 2):343–348. doi: 10.1042/BST0370343. [DOI] [PubMed] [Google Scholar]
- 21.Friedman JI, Stivers JT. Detection of damaged DNA bases by DNA glycosylase enzymes. Biochemistry. 2010;49(24):4957–4967. doi: 10.1021/bi100593a. [DOI] [PMC free article] [PubMed] [Google Scholar]
- 22.Clore GM. Exploring translocation of proteins on DNA by NMR. J Biomol NMR. 2011;51(3):209–219. doi: 10.1007/s10858-011-9555-8. [DOI] [PMC free article] [PubMed] [Google Scholar]
- 23.Lewin B. Genes VII. Oxford Univ Press; Oxford: 2000. [Google Scholar]
- 24.Iwahara J, Levy Y. Speed-stability paradox in DNA-scanning by zinc-finger proteins. Transcription. 2013;4(2):58–61. doi: 10.4161/trns.23584. [DOI] [PMC free article] [PubMed] [Google Scholar]
- 25.Slutsky M, Mirny LA. Kinetics of protein-DNA interaction: Facilitated target location in sequence-dependent potential. Biophys J. 2004;87(6):4021–4035. doi: 10.1529/biophysj.104.050765. [DOI] [PMC free article] [PubMed] [Google Scholar]
- 26.Esadze A, Iwahara J. Stopped-flow fluorescence kinetic study of protein sliding and intersegment transfer in the target DNA search process. J Mol Biol. 2014;426(1):230–244. doi: 10.1016/j.jmb.2013.09.019. [DOI] [PMC free article] [PubMed] [Google Scholar]
- 27.Esadze A, Kemme CA, Kolomeisky AB, Iwahara J. Positive and negative impacts of nonspecific sites during target location by a sequence-specific DNA-binding protein: Origin of the optimal search at physiological ionic strength. Nucleic Acids Res. 2014;42(11):7039–7046. doi: 10.1093/nar/gku418. [DOI] [PMC free article] [PubMed] [Google Scholar]
- 28.Zandarashvili L, et al. Asymmetrical roles of zinc fingers in dynamic DNA-scanning process by the inducible transcription factor Egr-1. Proc Natl Acad Sci USA. 2012;109(26):E1724–E1732. doi: 10.1073/pnas.1121500109. [DOI] [PMC free article] [PubMed] [Google Scholar]
- 29.Khachigian LM, Lindner V, Williams AJ, Collins T. Egr-1-induced endothelial gene expression: A common theme in vascular injury. Science. 1996;271(5254):1427–1431. doi: 10.1126/science.271.5254.1427. [DOI] [PubMed] [Google Scholar]
- 30.Lee JL, Everitt BJ, Thomas KL. Independent cellular processes for hippocampal memory consolidation and reconsolidation. Science. 2004;304(5672):839–843. doi: 10.1126/science.1095760. [DOI] [PubMed] [Google Scholar]
- 31.Marcovitz A, Levy Y. Frustration in protein-DNA binding influences conformational switching and target search kinetics. Proc Natl Acad Sci USA. 2011;108(44):17957–17962. doi: 10.1073/pnas.1109594108. [DOI] [PMC free article] [PubMed] [Google Scholar]
- 32.Murugan R. Theory of site-specific DNA-protein interactions in the presence of conformational fluctuations of DNA binding domains. Biophys J. 2010;99(2):353–359. doi: 10.1016/j.bpj.2010.04.026. [DOI] [PMC free article] [PubMed] [Google Scholar]
- 33.Zhou HX. Rapid search for specific sites on DNA through conformational switch of nonspecifically bound proteins. Proc Natl Acad Sci USA. 2011;108(21):8651–8656. doi: 10.1073/pnas.1101555108. [DOI] [PMC free article] [PubMed] [Google Scholar]
- 34.Kalodimos CG, et al. Structure and flexibility adaptation in nonspecific and specific protein-DNA complexes. Science. 2004;305(5682):386–389. doi: 10.1126/science.1097064. [DOI] [PubMed] [Google Scholar]
- 35.Kalodimos CG, Boelens R, Kaptein R. Toward an integrated model of protein-DNA recognition as inferred from NMR studies on the Lac repressor system. Chem Rev. 2004;104(8):3567–3586. doi: 10.1021/cr0304065. [DOI] [PubMed] [Google Scholar]
- 36.Anderson KM, et al. Direct observation of the ion-pair dynamics at a protein-DNA interface by NMR spectroscopy. J Am Chem Soc. 2013;135(9):3613–3619. doi: 10.1021/ja312314b. [DOI] [PMC free article] [PubMed] [Google Scholar]
- 37.Pavletich NP, Pabo CO. Zinc finger-DNA recognition: Crystal structure of a Zif268-DNA complex at 2.1 Å. Science. 1991;252(5007):809–817. doi: 10.1126/science.2028256. [DOI] [PubMed] [Google Scholar]
- 38.Laity JH, Dyson HJ, Wright PE. DNA-induced alpha-helix capping in conserved linker sequences is a determinant of binding affinity in Cys2-His2 zinc fingers. J Mol Biol. 2000;295(4):719–727. doi: 10.1006/jmbi.1999.3406. [DOI] [PubMed] [Google Scholar]
- 39.Pollard TD, De La Cruz EM. Take advantage of time in your experiments: A guide to simple, informative kinetics assays. Mol Biol Cell. 2013;24(8):1103–1110. doi: 10.1091/mbc.E13-01-0030. [DOI] [PMC free article] [PubMed] [Google Scholar]
- 40.Doucleff M, Clore GM. Global jumping and domain-specific intersegment transfer between DNA cognate sites of the multidomain transcription factor Oct-1. Proc Natl Acad Sci USA. 2008;105(37):13871–13876. doi: 10.1073/pnas.0805050105. [DOI] [PMC free article] [PubMed] [Google Scholar]
- 41.Iwahara J, Zweckstetter M, Clore GM. NMR structural and kinetic characterization of a homeodomain diffusing and hopping on nonspecific DNA. Proc Natl Acad Sci USA. 2006;103(41):15062–15067. doi: 10.1073/pnas.0605868103. [DOI] [PMC free article] [PubMed] [Google Scholar]
- 42.Kozlov AG, Lohman TM. Kinetic mechanism of direct transfer of Escherichia coli SSB tetramers between single-stranded DNA molecules. Biochemistry. 2002;41(39):11611–11627. doi: 10.1021/bi020361m. [DOI] [PubMed] [Google Scholar]
- 43.Lee KS, et al. Ultrafast redistribution of E. coli SSB along long single-stranded DNA via intersegment transfer. J Mol Biol. 2014;426(13):2413–2421. doi: 10.1016/j.jmb.2014.04.023. [DOI] [PMC free article] [PubMed] [Google Scholar]
- 44.Lieberman BA, Nordeen SK. DNA intersegment transfer, how steroid receptors search for a target site. J Biol Chem. 1997;272(2):1061–1068. doi: 10.1074/jbc.272.2.1061. [DOI] [PubMed] [Google Scholar]
- 45.Vuzman D, Azia A, Levy Y. Searching DNA via a “Monkey Bar” mechanism: The significance of disordered tails. J Mol Biol. 2010;396(3):674–684. doi: 10.1016/j.jmb.2009.11.056. [DOI] [PubMed] [Google Scholar]
- 46.Vuzman D, Levy Y. DNA search efficiency is modulated by charge composition and distribution in the intrinsically disordered tail. Proc Natl Acad Sci USA. 2010;107(49):21004–21009. doi: 10.1073/pnas.1011775107. [DOI] [PMC free article] [PubMed] [Google Scholar]
- 47.Vuzman D, Polonsky M, Levy Y. Facilitated DNA search by multidomain transcription factors: Cross talk via a flexible linker. Biophys J. 2010;99(4):1202–1211. doi: 10.1016/j.bpj.2010.06.007. [DOI] [PMC free article] [PubMed] [Google Scholar]
- 48.Pernstich C, Halford SE. Illuminating the reaction pathway of the FokI restriction endonuclease by fluorescence resonance energy transfer. Nucleic Acids Res. 2012;40(3):1203–1213. doi: 10.1093/nar/gkr809. [DOI] [PMC free article] [PubMed] [Google Scholar]
- 49.Shingu T, Bornstein P. Overlapping Egr-1 and Sp1 sites function in the regulation of transcription of the mouse thrombospondin 1 gene. J Biol Chem. 1994;269(51):32551–32557. [PubMed] [Google Scholar]
- 50.Thottassery JV, et al. Sp1 and egr-1 have opposing effects on the regulation of the rat Pgp2/mdr1b gene. J Biol Chem. 1999;274(5):3199–3206. doi: 10.1074/jbc.274.5.3199. [DOI] [PubMed] [Google Scholar]
- 51.Riggs AD, Bourgeois S, Cohn M. The lac repressor-operator interaction. 3. Kinetic studies. J Mol Biol. 1970;53(3):401–417. doi: 10.1016/0022-2836(70)90074-4. [DOI] [PubMed] [Google Scholar]
- 52.Boehr DD, Nussinov R, Wright PE. The role of dynamic conformational ensembles in biomolecular recognition. Nat Chem Biol. 2009;5(11):789–796. doi: 10.1038/nchembio.232. [DOI] [PMC free article] [PubMed] [Google Scholar]
- 53.Brüschweiler R, Liao X, Wright PE. Long-range motional restrictions in a multidomain zinc-finger protein from anisotropic tumbling. Science. 1995;268(5212):886–889. doi: 10.1126/science.7754375. [DOI] [PubMed] [Google Scholar]
- 54.Laity JH, Dyson HJ, Wright PE. Molecular basis for modulation of biological function by alternate splicing of the Wilms’ tumor suppressor protein. Proc Natl Acad Sci USA. 2000;97(22):11932–11935. doi: 10.1073/pnas.97.22.11932. [DOI] [PMC free article] [PubMed] [Google Scholar]
- 55.Stoll R, et al. Structure of the Wilms tumor suppressor protein zinc finger domain bound to DNA. J Mol Biol. 2007;372(5):1227–1245. doi: 10.1016/j.jmb.2007.07.017. [DOI] [PubMed] [Google Scholar]
- 56.Takayama Y, Sahu D, Iwahara J. NMR studies of translocation of the Zif268 protein between its target DNA Sites. Biochemistry. 2010;49(37):7998–8005. doi: 10.1021/bi100962h. [DOI] [PubMed] [Google Scholar]
- 57.Oka S, et al. NMR structure of transcription factor Sp1 DNA binding domain. Biochemistry. 2004;43(51):16027–16035. doi: 10.1021/bi048438p. [DOI] [PubMed] [Google Scholar]
- 58.Palmer AG., 3rd Nmr probes of molecular dynamics: Overview and comparison with other techniques. Annu Rev Biophys Biomol Struct. 2001;30:129–155. doi: 10.1146/annurev.biophys.30.1.129. [DOI] [PubMed] [Google Scholar]
- 59.Record MT, Jr, Anderson CF, Lohman TM. Thermodynamic analysis of ion effects on the binding and conformational equilibria of proteins and nucleic acids: The roles of ion association or release, screening, and ion effects on water activity. Q Rev Biophys. 1978;11(2):103–178. doi: 10.1017/s003358350000202x. [DOI] [PubMed] [Google Scholar]
- 60.Givaty O, Levy Y. Protein sliding along DNA: Dynamics and structural characterization. J Mol Biol. 2009;385(4):1087–1097. doi: 10.1016/j.jmb.2008.11.016. [DOI] [PubMed] [Google Scholar]
- 61.Schreiber G. Kinetic studies of protein-protein interactions. Curr Opin Struct Biol. 2002;12(1):41–47. doi: 10.1016/s0959-440x(02)00287-7. [DOI] [PubMed] [Google Scholar]
- 62.Sydor JR, Engelhard M, Wittinghofer A, Goody RS, Herrmann C. Transient kinetic studies on the interaction of Ras and the Ras-binding domain of c-Raf-1 reveal rapid equilibration of the complex. Biochemistry. 1998;37(40):14292–14299. doi: 10.1021/bi980764f. [DOI] [PubMed] [Google Scholar]
- 63.Iwahara J, Jung YS, Clore GM. Heteronuclear NMR spectroscopy for lysine NH3 groups in proteins: Unique effect of water exchange on 15N transverse relaxation. J Am Chem Soc. 2007;129(10):2971–2980. doi: 10.1021/ja0683436. [DOI] [PubMed] [Google Scholar]
- 64.Esadze A, Zandarashvili L, Iwahara J. Effective strategy to assign ¹H- ¹⁵N heteronuclear correlation NMR signals from lysine side-chain NH3+ groups of proteins at low temperature. J Biomol NMR. 2014;60(1):23–27. doi: 10.1007/s10858-014-9854-y. [DOI] [PMC free article] [PubMed] [Google Scholar]


