

Abstract
An accurate model of three-dimensional protein structure is important in a variety of fields such as structure-based drug design and mechanistic studies of enzymatic reactions. While the entries in the Protein Data Bank (http://www.pdb.org) provide valuable information about protein structures, a small fraction of the PDB structures were found to contain anomalies not reported in the PDB file. The semiempirical PM7 method in MOPAC2012 was used for identifying anomalously short hydrogen bonds, C–H···O/C–H···N interactions, non-bonding close contacts, and unrealistic covalent bond lengths in recently published Protein Data Bank files. It was also used to generate new structures with these faults removed. When the semiempirical models were compared to those of PDB_REDO (http://www.cmbi.ru.nl/pdb_redo/), the clashscores, as defined by MolProbity (http://molprobity.biochem.duke.edu/), were better in about 50 % of the structures. The semiempirical models also had a lower root-mean-square-deviation value in nearly all cases than those from PDB_REDO, indicative of a better conservation of the tertiary structure. Finally, the semiempirical models were found to have lower clashscores than the initial PDB file in all but one case. Because this approach maintains as much of the original tertiary structure as possible while improving anomalous interactions, it should be useful to theoreticians, experimentalists, and crystallographers investigating the structure and function of proteins.
Keywords: Semiempirical methods, PM7, Protein data bank, Geometric anomalies
Introduction
An accurate knowledge of a protein’s structure is a prerequisite for understanding its physical interactions with its chemical environment. In the case of enzymes, the three-dimensional (3D) structure determines both catalytic ability and the mechanism of reaction. 3D protein structures are essential in many research fields. In structure-based drug design, for example, a thorough understanding of the target protein’s structure, especially that of any active or allosteric binding sites, is essential for directing the design and synthesis of potential therapeutic molecules. Even when a protein’s purpose is unknown, an analysis of its sequence, active site, and 3D structure can give insight into its origin and function. In many instances it is desirable to perform electronic structure calculations to supplement and provide insight into experimental work on proteins. It is therefore necessary that protein structures, frequently determined under non-biological conditions, be modified so as to be as representative of the in vivo structure as possible. The approach described here demonstrates that while PDB entries are valuable resources, the published structures sometimes contain features that are not chemically realistic, but that can be improved easily to provide structures of the type needed for effective modeling of proteins.
The two most common ways to determine protein 3D structure are X-ray crystallography and nuclear magnetic resonance (NMR) spectroscopy. With the current capabilities of protein NMR instrumentation, the upper size limit of determined structures is approximately 50–70 kDa [1], although there has been a report of an NMR structure of a 900 kDa protein complex [2]. In contrast, crystallographic methods are limited less by the size of the protein and more by the quality of the protein crystals [3], as well as limited diffraction data in comparison to the structural parameters needed to adequately model the protein [4]. These challenges can make atomic level resolution of proteins difficult [5].
A valuable resource for the scientific community, the Worldwide Protein Data Bank (http://www.wwpdb.org) [6], of which the Research Collaboratory for Structural Bioinformatics (RCSB) Protein Data Bank (PDB) [7] is a member, has created a comprehensive central repository for protein structures. Although the structures provide a wealth of information about proteins, several serious errors were found in some published structures [8, 9] as early as 1990, and this resulted in the recognition of the need to validate crystallographic protein structures. This issue came to the forefront again when the X-ray Validation Task Force (VTF) [10] of the worldwide Protein Data Bank responded to reports that structures were potentially fabricated [11, 12], completely incorrect [13], or contained other serious errors [14], which resulted in the publishing of recommendations for a more complete validation of deposited structures. The VTF report recognized that a number of validation tools would be needed to ensure accuracy of protein structures. The main problem areas identified were Geometric and Conformation Validation Criteria, Atomic and Molecular Interactions, Structure Factor and Electron-Density Validation, and Validating Nonprotein Components. Within these broad criteria was a recognized need to examine covalent bond lengths as well as hydrogen bond quality, two of the criteria examined closely in the current work. The VTF report suggests that bond lengths should be considered serious outliers only if their bond lengths were four or five standard deviations from the expected value. As an example, a typical carbon–carbon single bond between two sp3 hybridized carbons in a protein is 1.513 Å, with a standard deviation of 0.039 Å. Four standard deviations would correspond to a deviation of just ± 0.12 Å. Energetically, this corresponds to a calculated heat of formation penalty of approximately 3.6 kcal mol−1 [15]. If a protein structure contained a large number of errors of this type the energetic penalty would be quite large.
Another important criterion for gauging the quality of an X-ray crystal structure is the geometry of the hydrogen bonds [10]. For example, WHAT_CHECK is a useful tool for validating hydrogen bonds in crystal structures [16]. A systematic study of typical hydrogen bond lengths in protein crystallographic structures indicated that the distance between proton donor and acceptor atom participants, called the hydrogen bond length, of a normal hydrogen bond in a protein can vary from 2.7 to 3.2 Å, and that hydrogen bond lengths of <2.3 Å are extremely rare [17]. Observations of hydrogen bond lengths of less than 2.3 Å—here referred to as anomalously short hydrogen bonds—and occurrences of atoms in close contact that may not, under normal circumstances, participate in hydrogen bonding are also discussed in this study.
As the availability of experimentally determined protein structures increases, so does the need for more chemically realistic models. Research in several bioscience areas would benefit from an approach that identifies (and eventually improves) anomalies found in available structures. Joosten et al. [18, 19] have created a series of databases that have entries for many of the depositions in the wwPDB. This allows a user to enter a PDB accession code in the PDBREPORT database (http://swift.cmbi.ru.nl/gv/pdbreport/) and get a report of possible errors in that file [18].
Affiliated with PDBREPORT, the PDB_REDO databank (http://www.cmbi.ru.nl/pdb_redo/) [19, 20] employs the structure refinement software, REFMAC [21], which “can automatically optimize most of the existing structures to derive improved, up-to-date structure models based on the original experimental data that were deposited with the atomic coordinates in the PDB” [20]. New features have recently been incorporated into the PDB_REDO pipeline that can perform tasks such as correcting bad side chain rotamers, as described in Joosten et al. [20].
Due to a lack of experimental information for hydrogen atoms, electron density maps of PDB structures generally give information only about the positions of heavy atoms. Likewise, the structures obtained from refinement by PDB_REDO do not contain hydrogen atoms, although their positions are frequently of interest, particularly in the active site, where they may be important for enzyme reactivity and mechanism. There exist a number of methods (e.g., [22–25]) for predicting the proper protonation states of active site residues, frequently by calculating the pKa value of the amino acid in the protein interior. These quantitative calculations are non-trivial. Therefore, when the pKa values of the active site residues are not the property of interest, it is expedient to use a quicker qualitative method that does not calculate pKa values directly, but instead places the hydrogen atoms in the lowest energy positions. This type of calculation predicts which salt bridges are thermodynamically favorable in a protein, and provides a computational model that is more chemically representative of the in vivo structure.
Calculations of this type also enable the prediction of salt bridges in a protein and allow for future heavy atom optimization, which also permits the further analysis of the structure and the ability to create a computational model more chemically representative of the in vivo structure.
Energy minimization also optimizes hydrogen bond lengths. Hydrogen bonds are important for maintaining protein structure and play an essential role in enzymatic reactions, so any chemically realistic working model must also accurately reproduce their properties. In addition to the lack of information about hydrogen atom positions in the experimental coordinates there is often a lack of experimental evidence for the positions of embedded water molecules, and these are also not normally reported.
A consequence of collecting diffraction data from a large number of proteins in a crystal is that there can be two or more atom conformations within a particular residue. This results in the number average being reported, usually resulting in an overestimation of one bond length and a corresponding underestimation of another. For example, carboxylic acid and carboxylate anion groups are normally reported with two nearly equal carbon–oxygen bond distances. While this would be true for carboxylate anion groups, for individual carboxylic acid groups in an individual protein molecule the bond lengths for the C = O and C–OH bonds would be expected to be different when one oxygen is protonated. If positional disorder was present in carboxylic acid groups, then in different protein molecules the position of the C = O and C–OH bonds could be reversed, and an examination of the diffraction data would result in the incorrect conclusion that the two carbon–oxygen bonds in a carboxylic acid group were of equal length.
Materials and methods
Semiempirical method
The work described here uses a semiempirical method to convert an X-ray crystallographic structure into a computationally useful starting model that can then be used in modeling protein chemistry. This process involves the addition of hydrogen atoms and the optimization of their positions, followed by the optimization of the coordinates of all atoms. The semiempirical PM7 method [26] in MOPAC2012 (available from http://openmopac.net/) [27] was used in all calculations.
In order to have confidence in the methodology, it is necessary to show that the underlying computational method can reproduce protein structures with good accuracy. To establish the suitability of PM7 for this task, a comparison was made of predicted and observed structural data for a set of small molecules in the condensed phase. The Cambridge Structural Database (CSD) [28, 29] provides an excellent source of accurate geometrical data for bond lengths and angles for small molecules (such as individual amino acids). Because almost all structures, such as zwitterions, salt bridges, hydrogen bonds, etc., found in proteins can be found in entries in the CSD, it is reasonable to assume that the accuracy of PM7 in predicting the geometries of entries in the CSD would be an indication of the accuracy of prediction of protein structures. For archetypical structures in the CSD, PM7 reproduces the observed structure with errors in bond lengths on the order of 0.02 Å [26].
Previous analyses of protein crystallographic structures by PM7 have shown that adding a penalty function of 3 kcal mol−1 Å−2 biased toward the crystallographic structures prevents large scale movements such as translation of a helix through space, and effectively preserves the tertiary structure [26].
Crystallized proteins typically contain large amounts of water, particularly in the interstitial space between proteins, but because of the lack of experimental evidence of their positions these waters are not normally reported in the final PDB structure. This absence of explicit solvation can result in geometric changes, especially near the protein surface, though most if not all refinement procedures include a bulk solvent correction (for example, see [30, 31]). The computational model must include corrections for the lack of explicit solvation in the crystallographic structure, for example, by the incorporation of a dielectric constant to model solvation effects. Therefore errors may arise in the model from the absence of these water molecules, and the 3 kcal mol−1 Å−2 restraint helps to compensate for the lack of solvation in the computational model, and prevents the presence or absence of solvent from affecting the tertiary structure. For these reasons, the 3 kcal mol−1 Å−2 restraint is employed in this work.
Structural quality was analyzed using MolProbity [32], which utilizes Phenix software [33] to calculate Ramachandran and rotamer statistics, clashscores, and Cβ deviations to provide information regarding the quality of the structure. The software displays both the clashscore, defined as the number of steric overlaps ≥0.4 Å per 1,000 atoms, and MolProbity score, which builds upon the clashscore to include rotamer and Ramachandran backbone outliers as well. Lower values indicate fewer close contacts, which was used to compare original and modeled structures to determine if a given optimization improved the structure or not.
PM7 structures were compared with PDB_REDO structures using root-mean-square-deviation (RMSD) data collected on all heavy atoms in the structure, and by calculating clashscores in MolProbity [32]. In the RMSD calculation, water molecules, hydrogen atoms added by PM7, and missing side-chain atoms that were added by PDB_REDO were not included. In the calculation of clashscores, hydrogen atoms were added at “Electron-cloud” positions (rather than “Nuclear” positions) to the PDB_REDO structure, and were compared with the PM7 optimized structure, including the PM7-optimized hydrogen atom positions.
Protein data bank
Starting structures for all of the calculations were downloaded from the RCSB PDB. A list of the PDB accession codes used in this study is provided in Table 5 in the Results section.
Table 5.
Comparison of PDB_ REDO and PM7 optimizations. MolProbity scores and clashscores were obtained from http://molprobity.biochem.duke.edu/index.php. Lower MolProbity scores and clashscores correspond to better structures. RMSD values were obtained by removing hydrogen atoms, water molecules, and side-chain atoms that were missing from the PDB file and which were added by PDB_REDO. The PM7 optimizations were subjected to the 3 kcal mol−1 Å−2 restraint
| Initial PDB
|
Optimized using PM7
|
PDB_Redo
|
||||||
|---|---|---|---|---|---|---|---|---|
| MolProbity score | Clash score | MolProbity score | Clash score | RMSD | MolProbity score | Clash score | RMSD | |
| 3VZI | 2.68 | 8.08 | 2.28 | 3.89 | 0.115 | 2.04 | 3.29 | 0.622 |
| 3W1Z | 2.65 | 9.84 | 2.19 | 3.82 | 0.110 | 2.57 | 11.30 | 0.889 |
| 3ZI6 | 1.96 | 5.26 | 1.72 | .190 | 0.123 | 1.46 | 1.89 | 0.367 |
| 4BE8 | 2.07 | 8.17 | 1.59 | 4.41 | 0.110 | 2.79 | 13.85 | 0.765 |
| 4BL6 | 3.08 | 24.37 | 2.40 | 10.83 | 0.138 | 2.37 | 12.85 | 0.442 |
| 4DIF | 1.28 | 4.94 | 1.22 | 2.79 | 0.107 | 0.96 | 1.93 | 0.144 |
| 4EM1 | 4.21 | 72.67 | 3.68 | 23.66 | 0.161 | 4.18 | 67.94 | 0.021 |
| 4FDX | 1.15 | 3.56 | 0.89 | 1.52 | 0.103 | 1.04 | 2.54 | 0.417 |
| 4GHS | 3.12 | 18.95 | 2.63 | 7.90 | 0.133 | 2.06 | 7.90 | 0.697 |
| 4GSU | 1.79 | 9.12 | 1.49 | 4.07 | .105 | 1.44 | 2.59 | 0.468 |
| 4GVM | 2.29 | 10.27 | 2.35 | 6.49 | 0.112 | 1.23 | 2.54 | 0.606 |
| 4H3P | 2.70 | 11.32 | 2.40 | 4.91 | 0.124 | 1.87 | 3.40 | 0.607 |
| 4H3Q | 2.59 | 9.29 | 2.37 | 5.67 | 0.118 | 2.12 | 6.87 | 0.578 |
| 4HCX | 2.62 | 14.28 | 2.08 | 4.95 | 0.127 | 1.56 | 3.07 | 0.463 |
| 4IJ9 | 2.14 | 5.14 | 1.85 | 3.26 | 0.119 | 1.62 | 3.59 | 0.509 |
| 4IS8 | 2.22 | 5.72 | 1.90 | 3.33 | 0.105 | 2.67 | 9.58 | 0.582 |
| 4JAI | 3.95 | 73.47 | 3.16 | 19.93 | 0.212 | 2.67 | 9.35 | 1.076 |
| 4JAJ | 2.47 | 7.89 | 2.32 | 4.60 | 0.130 | 1.61 | 3.64 | 0.994 |
| 4JJX | 2.58 | 10.44 | 2.24 | 6.17 | 0.118 | 1.57 | 5.77 | 0.701 |
| 4KB6 | 3.35 | 44.01 | 2.83 | 19.44 | 0.152 | 3.47 | 37.20 | 1.112 |
Structure validation
Starting structures for all of the calculations were downloaded from the RCSB PDB. All files came from structures published no more than 1 year prior to starting the study. Hydrogen atoms were added to the PDB structures by MOPAC (for details of the calculation see the Approach section), and resulting structures were evaluated for anomalously short hydrogen bonds, C–H···O interactions, and non-covalent close contacts. If none were identified, no further analysis of that structure was performed. (Note, this analysis did not identify potential covalent bonding anomalies, but files excluded from further analysis could have contained these types of errors.) Subsequent covalent bond analysis focused on the structures that were identified to have potential non-covalent anomalies. The resolution of the files presented range from 1.52 to 3.20 Å. A list of the PDB accession codes used in this study is provided in Table 5 in the Results section.
Approach
The first simulation performed on the PDB files was the addition of hydrogen atoms in a way that was consistent with the valence of the atom to which it is bonded (for example, on an sp3 hybridized carbon atom, hydrogen atoms would be added such that the bond angle formed was 109.5° [27]). To perform this calculation no keywords were needed. The file extension was changed from .pdb to .mop, the MOPAC input file extension, and a calculation was performed. It is not necessary to add any keywords to the .mop file, as MOPAC would by default add hydrogen atoms when the input file has the format of a .pdb file. Initially, hydrogen atoms were added to side-chains as well as to the carboxyl and amino termini so that there were no charges in the system. Basic side-chains were deprotonated and acidic side-chains protonated to ensure neutrality. It was essential to begin the simulation this way because the alternative, a systematic ionization of residues, would give rise to a nonsensical structure if, for example, multiple acidic residues were adjacent to one another. If that occurred, a systematic ionization would result in a high concentration of charges which could cause conformational changes resulting in an unrealistic geometry. In such a scenario the actual pKa values of the residues would likely be altered significantly from the values in water. This simulation also identifies potentially anomalously short noncovalent interactions, such as hydrogen bonds.
In the second simulation the keywords NOOPT OPT-H GNORM=20 PDBOUT were used in the first line of the MOPAC input file, which optimized the positions of the hydrogen atoms, while the positions of all other atoms were frozen. This calculation identified instances where neutral side-chains were thermodynamically unfavorable, and proton transfers could occur, resulting in the formation of salt bridges. For example, a proton transfer from a carboxylic acid side-chain to a guanidine side-chain would form the carboxylate and guanidinium ions.
A third calculation using the keywords GEO_REF = “SELF” MOZYME GNORM=20 PDBOUT on the first line of the MOPAC input file resulted in the optimization of the positions of all atoms, while subject to a 3 kcal mol−1 Å−2 restraint biased towards the original PDB structure [4]. As stated above, this penalty function allows identification of strained covalent bonds between heavy atoms, but prevents large-scale movements. This resulted in the final optimized structure from MOPAC.
A fourth and final calculation used the output from the third structure as input, and the keywords 0SCF GEO_REF = “(name of the output file from the second calculation)” was performed. This compared atom location between the structure generated by the second calculation in which no heavy atoms moved, and the third optimized calculation. Any bond length that changed more than 0.1 Å was identified, and was further inspected using the molecular visualization software Jmol (http://www.jmol.org/) [34]. For a more detailed description of each of the MOPAC keywords and their precise function, see the MOPAC online manual [35].
Results
Out of a set of 225 proteins analyzed, 20 PDB files were found to contain anomalous interactions, and these results are presented here. Of the 20 PDB files, 10 displayed 14 instances of unusually short hydrogen bonds that involve only typical hydrogen bond donor and acceptor atoms, i.e., oxygen and/or nitrogen; 5 were found to have unrealistically close C–H·O/N interactions, 1 contained three instances of close contacts between two carbon atoms, and 11 contained 27 instances of main-chain or side-chain covalent bond length anomalies. Some PDB files contained multiple types of errors.
Unusually short H-bonding interactions
A summary of the anomalously short hydrogen bonds found by the simulations is given in Table 1. Provided in the table are PDB accession codes, structure resolution, H-bond donor and acceptor locations, and appropriate bond lengths and angles. Figure 1 displays an unusually short hydrogen bond from the initial and corrected O···O hydrogen bond distance found in protein 4 KB6, using Chimera Version 1.8.1 [36].
Table 1.
Summary of anomalously short hydrogen bonds, with participating atom constituents, found in recently reported structures. The initial bond length, R0 (Å), is the interatomic distance between the heavy atoms involved in the hydrogen bond in the original PDB file, Rf (Å) is the distance between the heavy atoms after the restrained optimization, |Δ| is the absolute value of the change in distance between the atoms before and after optimization, H-bond angle0(°) is the hydrogen bond angle upon initial placement of the hydrogen atom, and H-bond anglef(°) is the angle after the restrained optimization
| PDB ID | Resolution (Å) | H bond donor
|
H bond acceptor
|
R0 (Å) | Rf (Å) | |Δ| | H-bond angle0 (°) | H-bond anglef (°) | ||||
|---|---|---|---|---|---|---|---|---|---|---|---|---|
| Residue | Chain | Atom label | Residue | Chain | Atom label | |||||||
| 3VZI | 2.66 | Val 222 | B | N | Phe 202 | B | O | 2.222 | 2.639 | 0.417 | 117.55 | 156.40 |
| 3W1Z | 2.40 | Arg 102 | D | Nω′ | Glu 94 | C | Oε2 | 2.298 | 2.501 | 0.203 | 126.98 | 164.34 |
| 4BE8 | 3.00 | Thr 791 | A | Oγ1 | Trp 787 | A | O | 2.207 | 2.675 | 0.468 | 112.77 | 160.53 |
| 4EM1 | 3.00 | Ile 79 | A | N | Ile 75 | A | O | 2.297 | 2.564 | 0.267 | 114.46 | 134.50 |
| 4H3P | 2.30 | Tyr 312 | D | Oη | Asn 123 | D | Oγ1 | 2.267 | 2.685 | 0.418 | 106.85 | 160.30 |
| 4H3Q | 2.20 | Gly 204 | A | N | His 178 | A | O | 2.272 | 2.635 | 0.363 | 110.25 | 139.53 |
| 4HCX | 2.18 | Thr 369 | B | Oγ1 | Val 365 | B | O | 2.221 | 2.586 | 0.365 | 115.66 | 170.85 |
| Tyr 202 | B | Oη | Glu 113 | B | Oε1 | 2.225 | 2.594 | 0.369 | 118.28 | 165.95 | ||
| 4JAI | 3.20 | Gln 177 | A | N | Val 174 | A | O | 2.244 | 2.671 | 0.427 | 102.44 | 119.71 |
| Arg 251 | A | N | His 248 | A | O | 2.279 | 2.775 | 0.496 | 120.72 | 142.50 | ||
| 4JJX | 2.83 | Arg 105 | B | Nω′ | Leu 5 | B | O | 2.268 | 2.868 | 0.600 | 117.07 | 149.90 |
| 4KB6 | 3.08 | Ala 157 | A | N | Ile 153 | A | O | 2.239 | 2.645 | 0.406 | 118.11 | 135.18 |
| Leu 252 | A | N | Ala 248 | A | O | 2.220 | 2.615 | 0.395 | 121.67 | 138.76 | ||
| Tyr 460 | A | Oη | Thr 424 | A | Oγ | 2.198 | 2.676 | 0.478 | 94.06 | 153.29 | ||
Fig. 1.
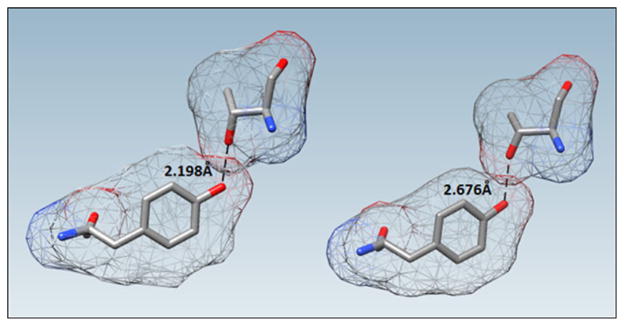
Unusually short hydrogen bonding located between Oη on Tyr 460 and Oη on Thr 424 on porcine cyclic GMP AMP synthase (PDB accession code 4KB6). The initial interatomic distance was found to be 2.198 Å. This high energy structure was identified and changed by PM7 to an interatomic distance of 2.676 Å. The calculated solvent-excluded surface area is displayed
Summary of unrealistically close noncovalent interactions
A summary of C–H···O close contacts is shown in Table 2. In all cases, the initial distance between the carbon and oxygen atoms was significantly shorter than the sum of their van der Waals radii. Five separate PDB files displayed instances of this type of close contact; an example is displayed in Fig. 2.
Table 2.
Summary of C–H···O/N close contacts. The initial bond length, R0 (Å), is the interatomic distance between the heavy atoms involved in the “hydrogen bond” in the original PDB file, Rf (Å) is the distance between the heavy atoms after the restrained optimization, |Δ| is the absolute value of the distance change between the atoms before and after optimization, H-bond angle0(°) is the hydrogen bond angle upon initial placement of the hydrogen atom, and H-bond anglef(°) is the angle after the restrained optimization
| PDB ID | Resolution (Å) | H bond donor
|
H bond acceptor
|
R0 (Å) | Rf (Å) | |Δ| | H-bond angle0 (°) | H-bond anglef (°) | ||||
|---|---|---|---|---|---|---|---|---|---|---|---|---|
| Residue | Chain | Atom label | Residue | Chain | Atom label | |||||||
| 4DIF | 1.52 | Leu 411 | B | Cδ1 | Val 407 | B | O | 2.292 | 2.785 | 0.493 | 112.81 | 132.72 |
| 4EM1 | 3.00 | Glu 180 | A | Cβ | IIe 176 | A | O | 2.218 | 2.729 | 0.511 | 119.23 | 134.49 |
| 4GSU | 2.00 | Pro 315 | A | Cδ | Ser 314 | A | Oγ | 2.301 | 2.701 | 0.400 | 112.81 | 114.48 |
| 4JAI | 3.20 | Arg 137 | A | Cγ | Arg 137 | A | Nω | 2.088 | 2.912 | 0.824 | 85.58 | 110.84 |
| 4JAJ | 2.70 | Arg 126 | A | Cγ | Lys 125 | A | O | 2.136 | 2.699 | 0.563 | 108.06 | 109.32 |
Fig. 2.
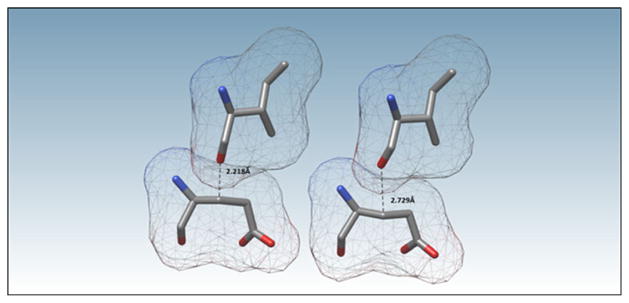
Non-covalent close contact interaction identified in deposited protein 4EM1 between carbonyl O on Ile 176 and Cβ on Glu 180. The initial interatomic distance was 2.218 Å. The restrained PM7 optimized structure relaxed the original high energy interaction to a distance of 2.729 Å. The calculated solvent-excluded surface area is displayed
A summary of the non-covalent close contacts found between pairs of carbon atoms in 4JAI is shown in Table 3. The abbreviations are the same as in prior tables. The initial distance between the carbon atoms was significantly shorter than the sum of their van der Waals radii. This distance increased greatly after optimization, as seen, for example, in Fig. 3. Only those close contacts shorter than 2.3 Å between the heavy atoms were reported.
Table 3.
Summary of non-bonding close contacts between carbon atoms in 4JAI, resolution 3.2 Å. The initial bond length, R0 (Å), is the interatomic distance between the heavy atoms in the original PDB file, Rf (Å) is the distance between the heavy atoms after the restrained optimization, and |Δ| is the absolute value of the change in these distances
| PDB ID | Resolution (Å) | Residue | Atom label | Residue | Atom label | R0 (Å) | Rf (Å) | |Δ| |
|---|---|---|---|---|---|---|---|---|
| 4JAI | 3.20 | Leu 293 | Cδ1 | Leu 293 | C | 2.077 | 2.909 | 0.832 |
| Leu 293 | Cβ | Thr 292 | Cα | 2.205 | 2.905 | 0.700 | ||
| Tyr 334 | Cδ2 | Tyr 334 | C | 2.088 | 2.671 | 0.583 |
Fig. 3.

Non-bonding Cδ1 to backbone carbon close contact interaction found in Aurora Kinase A (PDB accession code: 4JAI) and the corresponding PM7 altered structure. The interatomic distance increased by 0.832 Å. The calculated solvent-excluded surface area is displayed
Covalent bond length anomalies
Significant covalent bond length anomalies between protein heavy atoms are shown in Table 4, and an example is presented in Fig. 4. The abbreviations are the same as in the previous tables. Atom 1 and Atom 2 were assigned arbitrarily. It should be noted that results from 4JAI were excluded from Table 4 because of the large number, ca. 50, of covalent bond length anomalies found in this structure, although a very similar structure, 4JAJ, was included.
Table 4.
Summary of covalent bond length anomalies. The initial bond length, R0 (Å), is the interatomic distance between the heavy atoms in the original PDB file, Rf (Å) is the distance between the heavy atoms after the restrained optimization, and |Δ| is the absolute value of the change in these distances
| PDB ID | Resolution (Å) | Atom 1
|
Atom 2
|
R0 (Å) | Rf (Å) | |Δ| | ||||
|---|---|---|---|---|---|---|---|---|---|---|
| Residue | Chain | Atom label | Residue | Chain | Atom label | |||||
| 3ZI6 | 2.00 | Asn 111 | A | Nδ2 | Asn 111 | A | Cγ | 1.272 | 1.398 | 0.126 |
| 4BL6 | 2.18 | Leu 723 | C | Cδ1 | Leu 723 | C | Cγ | 1.658 | 1.532 | 0.126 |
| 4EM1 | 3.00 | Leu 178 | A | Cγ | Leu 178 | A | Cβ | 1.902 | 1.540 | 0.362 |
| Leu 108 | A | Cγ | Leu 108 | A | Cβ | 1.845 | 1.544 | 0.301 | ||
| Leu 178 | A | Cγ | Leu 178 | A | Cδ2 | 1.705 | 1.540 | 0.165 | ||
| Leu 108 | A | Cγ | Leu 108 | A | Cδ2 | 1.700 | 1.532 | 0.168 | ||
| Leu 108 | A | Cγ | Leu 108 | A | Cδ1 | 1.678 | 1.530 | 0.148 | ||
| Leu 178 | A | Cγ | Leu 178 | A | Cδ1 | 1.659 | 1.526 | 0.133 | ||
| Met 163 | A | Cε | Met 163 | A | Sδ | 1.689 | 1.815 | 0.146 | ||
| 4FDX | 1.64 | Thr 12 | B | Cγ2 | Thr 12 | B | Cβ | 1.791 | 1.527 | 0.264 |
| Met 5 | A | Cε | Met 5 | A | Sδ | 1.689 | 1.815 | 0.126 | ||
| 4GHS | 3.20 | Ile 147 | B | Cδ1 | Ile 147 | B | Cγ1q | 1.394 | 1.524 | 0.130 |
| Ile 147 | A | Cδ1 | Ile 147 | A | Cγ1 | 1.377 | 1.524 | 0.146 | ||
| Pro 40 | A | Cδ | Pro 40 | A | Cγ | 1.421 | 1.540 | 0.120 | ||
| 4GVM | 2.16 | Lys 159 | A | N | Leu 158 | A | C | 1.605 | 1.373 | 0.232 |
| Lys 159 | A | C | Lys 159 | A | O | 1.409 | 1.218 | 0.191 | ||
| 4H3P | 2.30 | His 178 | D | N | Asp 177 | D | C | 1.310 | 1.454 | 0.144 |
| 4HCX | 2.18 | Pro 98 | A | Cγ | Pro 98 | A | Cβ | 1.365 | 1.537 | 0.173 |
| Pro 385 | A | Cγ | Pro 385 | A | Cβ | 1.388 | 1.540 | 0.152 | ||
| Ile 381 | B | N | Ala 380 | B | C | 1.245 | 1.372 | 0.127 | ||
| 4IJ9 | 2.55 | Ile 163 | A | Cδ1 | Ile 163 | A | Cγ1 | 1.680 | 1.531 | 0.149 |
| Ile 174 | A | Cδ1 | Ile 174 | A | Cγ1 | 1.654 | 1.530 | 0.124 | ||
| 4IS8 | 2.78 | Asn 478 | B | Nγ2 | Asn 478 | B | Cγ | 1.231 | 1.381 | 0.150 |
| 4JAJ | 2.70 | Met 305 | A | Cε | Met 305 | A | Sδ | 1.591 | 1.820 | 0.228 |
| Pro 138 | A | Cγ | Pro 138 | A | Cβ | 1.394 | 1.538 | 0.143 | ||
| Leu 263 | A | Cδ2 | Leu 263 | A | Cγ | 1.399 | 1.529 | 0.130 | ||
| Pro 282 | A | Cγ | Pro 282 | A | Cβ | 1.665 | 1.539 | 0.125 | ||
Fig. 4.
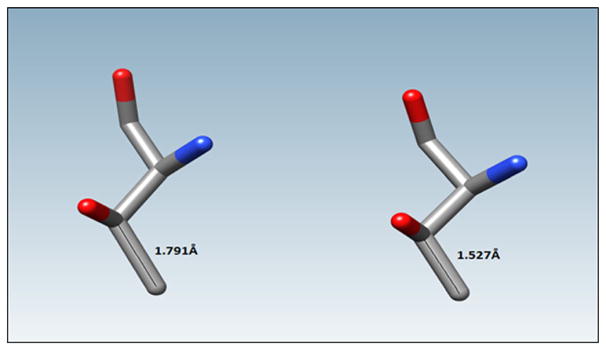
Protein 4-oxalocrotonate tautomerase isozyme (PDB accession code 4FDX) was found to have an initial Thr Cβ to Cγ2 covalent bond length of 1.791 Å, and was adjusted using PM7 to 1.527 Å. Total interatomic distance was changed by 0.264 Å
Comparisons of PDB, PDB_REDO, and PM7 optimized structures
Table 5 compares the clashscores and MolProbity scores for the original PDB files, PDB_REDO structures and PM7 optimized structures. It also compares heavy atom RMSD values for PDB_REDO and PM7 structures compared to the original PDB file for both methods.
Discussion
Protein structure refinement is important for experimental chemists and biologists because a realistic structure is essential when determining how a protein will react in vivo. Arguably, X-ray crystallography is the best real-world demonstration of these structures but, as recognized by the VTF [10], X-ray structures may contain anomalies that do not accurately represent the in vivo conformation.
Prior work examining 948 protein chains with resolution better than 2.0 Å has shown that typical protein hydrogen bonds have a heavy atom donor to acceptor (D–A) distance of 2.7–3.2 Å [17]. This latter work also concluded that short hydrogen bonds (SHBs), i.e., hydrogen bonds where the heavy atom donor acceptor (D–A) distance was less than 2.7 Å, and the hydrogen bond angle (D–H···A) was greater than or equal to 150°, occur relatively frequently in proteins, both between side-chain groups as well as backbone atoms. The lower limit of SHB D–A distances appeared to be about 2.3 Å between side-chain atoms, and about 2.45 Å between side-chain and backbone atoms. As expected, the distribution of unusually short hydrogen bonding interactions that were found was weighted heavily toward the upper limit of 2.7 Å [17].
Hydrogen bonding interactions with D–A atom pairs that are less than or equal to 2.3 Å apart have been defined here as anomalously short hydrogen bonds [17]. Using this criterion, a total of 14 hydrogen bonding pairs in ten different structures were identified that had D–A distances between 2.198 and 2.297 Å.
The hydrogen bonding angle involved in anomalously short hydrogen bonds was examined after hydrogen atom optimization, and again after restrained protein optimization to verify if there was a change in the angle. It was observed that if the heavy atoms were less than 2.3 Å apart, then even after hydrogen atom optimization the angle formed by the three atoms was less than 130°, i.e., significantly narrower than the typical value of 150° or more [17]. Situations such as this were improved after the restrained optimization, and hydrogen bond angles increased between 17 and 59°. Not surprisingly, it was observed that hydrogen bond angles involving atoms in the peptide backbone showed a smaller angle change than atoms in the side-chain. This is to be expected due to the relative rigidity of the peptide backbone and the involvement in stabilizing secondary structures.
Five instances in five separate protein structures were found to have unrealistically close C–H·O or C–H···N interactions. While there have been reports of electrostatically stabilized hydrogen bond interactions of this sort in small molecules [37] and proteins [38], the carbon to oxygen or nitrogen distances typically occur in the range 3.0–3.8 Å. The distances reported here are significantly shorter than those cited, and are also closer than the sums of their van der Waals radii. It has been suggested that very short C–H···O contacts (with a heavy atom distance of less than 3.2 Å) and with very bent angles (90–110°) should be viewed with skepticism [37]. As can be seen in Table 2, only those with heavy atom distances less than or equal to 2.3 Å, i.e., well below 3.2 Å, are reported. In addition, most of the angles in the reported pairs are near the 110° threshold, indicating they are unlikely to be true stabilizing interactions. While this type of interaction has been previously identified [39], the contact distances were anomalously short when considering the strength of interaction and the distance between the atoms, and are unlikely to be maintained in vivo.
In one of the protein structures examined (4JAI), three unrealistically short carbon–carbon close contacts were found in which the inter-atomic distances ranged from 2.08 to 2.21 Å, i.e., well within the sum of the van der Waals radii. The structure in 4JAI had the lowest resolution, 3.20 Å. of any used in this study. A common consequence of low resolution data is the lack of resolution of regions of electron density which, in turn, can complicate the subsequent refinement of the model, and can even result in vanishing side-chains and secondary structure elements [40]. Even when high resolution data are available, naturally occurring disorder in a crystal, both structural and positional, can cause complications during the refinement of the model.
Anomalous heavy atom covalent bond distances were found in 27 atoms pairs in 11 unique crystal structures. In each case, the bond length deviated by at least 0.12 Å compared to the average reported by Engh and Huber [41, 42]. In most cases this corresponded to four or more standard deviations outside the norm. It is reasonable to assume that the spectrum of bond lengths and bond angles observed in small molecules, i.e., high-accuracy structures, would be the same as that in bio-molecules, thus these bond lengths fall well outside the range of accepted values.
In one structure (4EM1), the Cβ–Cγ single bond in Leu 178 was approximately 0.3 Å longer than the expected value. This distance was great enough that MOPAC2012 interpreted the geometry as an alanine residue and propane ligand. This type of error was flagged in the output by a change in the residue name and the formation of a new heterogroup with the same residue number. Severe errors of this type would need to be corrected either by keywords or by editing the PDB file before proceeding.
The existing refined data set provided by PDB_REDO gave a poorer (larger) MolProbity score and/or clashscore on 4 of the 20 analyzed proteins than the crystallized structure, while PM7 optimized structures displayed one poorer MolProbity score. Additionally, PM7 was able to provide structures with lower clashscores than PDB_REDO in nine of the proteins analyzed, and lower MolProbity Scores in six. Additional RMSD analysis was performed in order to determine if the structure was undergoing large changes that may be inconsistent with the published coordinates, such as partial unfolding or expansion. PDB_REDO changes the model to improve the fit with the experimental data, so any smaller RMSD indicates that the model has not drifted too much away from the experimental data.
RMSD values for PM7 optimized proteins were less than those optimized by PDB_REDO in 19 of the 20 proteins analyzed. The one protein that did not have a lower RMSD value was found to have a decrease in clashscore over the PDB_REDO structure of 44.28. This indicates that the restrained PM7 optimization was better at preserving the original PDB X-ray structure while refining structural anomalies except when extreme clashes are able to be identified and resolved.
As a consequence of using a crystal containing multiple protein molecules, rather than a single molecule, PDB X-ray structures report a number average of bond lengths in the crystalline structure. Thus structures that are conformationally flexible or rotating may have their bond lengths averaged, this is observed, for example, in the glutamine and asparagine side-chains, which have a carbon–oxygen double bond as well as a carbon-nitrogen single bond. Because of the rotation around the carbon–carbon single bond, these bond lengths may appear symmetric, when in fact they should not be. These number averages are corrected when optimizing the structure with these semiempirical methods, and, due to their presence in all proteins, errors of this type are left out of further examination.
Conclusions
A straightforward and computationally efficient procedure has been developed that will locate unrealistic features in X-ray crystallographic models of protein structures. This approach can both identify and correct anomalies in protein structures, such as anomalous covalent bond lengths, very short hydrogen bonds, and van der Waals close contacts. Additionally, hydrogen atoms can be added in a way that correctly predicts salt bridges and hydrogen bonds. The optimization of the hydrogen atoms and heavy atom coordinates provides a more chemically representative structure of a protein. This will be useful in many bioscience research fields, including both experimental and computational sciences. It should be noted that, although weak interactions govern tertiary protein structures, these weak interactions are difficult to capture using semiempirical computational chemistry methods, and thus a 3 kcal mol−1 Å−2 restraint was employed to preserve the tertiary structure while allowing for the relaxation of local structural anomalies.
Refinement of X-ray diffraction data into an electron density map is a challenging process. While crystallographers are able to detect and report many of the inconsistencies in their models, this work demonstrates that it is still possible, even using current methods, to overlook covalent bond anomalies or close contacts. Crystallographers could preemptively employ the approach described here to perform a check on their models, identify anomalies, and use that information to re-refine the coordinates. Complete optimization of a protein structure of the type reported here would require about an hour to set up, and about 1–2 days of computational effort using a conventional desktop computer. If this type of procedure were to be integrated into the refinement process, faults of the type reported here would be eliminated automatically, thus resulting in a reduction in both the set-up time and the computational effort. A possible alternative, a MolProbity run, would take only seconds, but, because subtle effects such as hydrogen bonding involving water could not be modeled, the results from MolProbity would be of limited usefulness in refining coordinates. Alternatively, this method can be used to find and report additional anomalous data present in the final structure, as has also been demonstrated here.
Acknowledgments
The authors acknowledge the University of Colorado Colorado Springs and the National Institute Of General Medical Sciences of the National Institutes of Health (Award Number R44GM108085) and the UCCS Biofrontiers Center for funding. B.P.M. and S.B.B.-S. acknowledge the Merck/AAAS Undergraduate Science Research Program for funding. Dr. Chet Dymek is thanked for constructive discussions and critical reading of the manuscript, and Sarah Lopez is thanked for helpful discussions.
Footnotes
Conflict of interest The authors are aware of no conflicts of interest present in this research.
Disclaimer This work is solely the responsibility of the authors and does not necessarily represent the official views of the National Institutes of Health.
Contributor Information
Christopher J. Brandon, Email: cbrandon1031@gmail.com, Department of Chemistry and Biochemistry, University of Colorado, Colorado Springs, Colorado Springs, CO 80918, USA
Benjamin P. Martin, Email: benjaminmartin4000@gmail.com, Department of Chemistry and Biochemistry, University of Colorado, Colorado Springs, Colorado Springs, CO 80918, USA
Kelly J. McGee, Email: kmcgee@uccs.edu, Department of Chemistry and Biochemistry, University of Colorado, Colorado Springs, Colorado Springs, CO 80918, USA
James J. P. Stewart, Email: mrmopac@att.net, Department of Chemistry and Biochemistry, University of Colorado, Colorado Springs, Colorado Springs, CO 80918, USA. Stewart Computational Chemistry, 15210 Paddington Circle, Colorado Springs, CO 80921, USA
Sonja B. Braun-Sand, Email: sbraunsa@uccs.edu, Department of Chemistry and Biochemistry, University of Colorado, Colorado Springs, Colorado Springs, CO 80918, USA
References
- 1.McAlister A. [Accessed 5 July 2013];Integrating SAXS/NMR Data for structure determination. 2012 http://www.theresonance.com/2012/categories/structural-biology/integrating-saxs-and-nmr.
- 2.Fiaux J, Bertelsen EB, Horwich AL, Wuethrich K. NMR analysis of a 900 K GroEL-GroES complex. Nature (London) 2002;418:207–211. doi: 10.1038/nature00860. [DOI] [PubMed] [Google Scholar]
- 3.Shankar JR, Bansal GK. Principles of protein crystallization. Int J Chem Sci Appl. 2013;4:384–389. [Google Scholar]
- 4.Yu N, Yennawar HP, Merz KM., Jr Refinement of protein crystal structures using energy restraints derived from linear-scaling quantum mechanics. Acta Crystallogr Sect D: Biol Crystallogr. 2005;D61:322–332. doi: 10.1107/s0907444904033669. [DOI] [PubMed] [Google Scholar]
- 5.Jelsch C, Teeter MM, Lamzin V, Pichon-Pesme V, Blessing RH, Lecomte C. Accurate protein crystallography at ultra-high resolution: valence electron distribution in crambin. Proc Natl Acad Sci USA. 2000;97:3171–3176. doi: 10.1073/pnas.97.7.3171. [DOI] [PMC free article] [PubMed] [Google Scholar]
- 6.Berman H, Henrick K, Nakamura H. Announcing the worldwide protein data bank. Nat Struct Biol. 2003;10:980. doi: 10.1038/nsb1203-980. [DOI] [PubMed] [Google Scholar]
- 7.Berman HM, Westbrook J, Feng Z, Gilliland G, Bhat TN, Weissig H, Shindyalov IN, Bourne PE. The protein data bank. Nucleic Acids Res. 2000;28(1):235–242. doi: 10.1093/nar/28.1.235. [DOI] [PMC free article] [PubMed] [Google Scholar]
- 8.Brändén C-I, Jones TA. Between objectivity and subjectivity. Nature. 1990;343:687–689. [Google Scholar]
- 9.Hooft RWW, Vriend G, Sander C, Abola EE. Errors in protein structures. Nature (London) 1996;381:272. doi: 10.1038/381272a0. [DOI] [PubMed] [Google Scholar]
- 10.Read RJ, Adams PD, Arendall WB, III, Brunger AT, Emsley P, Joosten RP, Kleywegt GJ, Krissinel EB, Luetteke T, Otwinowski Z, Perrakis A, Richardson JS, Sheffler WH, Smith JL, Tickle IJ, Vriend G, Zwart PH. A new generation of crystallographic validation tools for the protein data bank. Struct (Camb) 2011;19:1395–1412. doi: 10.1016/j.str.2011.08.006. [DOI] [PMC free article] [PubMed] [Google Scholar]
- 11.Janssen BJC, Read RJ, Bruenger AT, Gros P. Crystallography: crystallographic evidence for deviating C3b structure. Nature (London) 2007;448:E1–E2. doi: 10.1038/nature06102. [DOI] [PMC free article] [PubMed] [Google Scholar]
- 12.Borrell B. Fraud rocks protein community. Nature (London) 2009;462:970. doi: 10.1038/462970a. [DOI] [PubMed] [Google Scholar]
- 13.Chang G, Roth CB, Reyes CL, Pornillos O, Chen Y-J, Chen AP. Structure of the ABC transporter MsbA in complex with ADP·vanadate and lipopolysaccharide. [Retraction of document cited in CA143:111210] Science (Washington) 2006:314. doi: 10.1126/science.1107733. [DOI] [PubMed] [Google Scholar]
- 14.Hanson MA, Stevens RC. Retraction: cocrystal structure of synaptobrevin-II bound to botulinum neurotoxin type B at 2.0 Å resolution. Nat Struct Mol Biol. 2009;16:795. doi: 10.1038/nsmb0709-795. [DOI] [PubMed] [Google Scholar]
- 15.Leach AR. Molecular modelling: principles and applications. Prentice Hall; Harlow: 2001. [Google Scholar]
- 16.Hooft RW, Vriend G, Sander C, Abola EE. Errors in protein structures. Nature. 1996;381(6580):272. doi: 10.1038/381272a0. [DOI] [PubMed] [Google Scholar]
- 17.Rajagopal S, Vishveshwara S. Short hydrogen bonds in proteins. FEBS J. 2005;272:1819–1832. doi: 10.1111/j.1742-4658.2005.04604.x. [DOI] [PubMed] [Google Scholar]
- 18.Joosten RP, te Beek TAH, Krieger E, Hekkelman ML, Hooft RWW, Schneider R, Sander C, Vriend G. A series of PDB related databases for everyday needs. Nucleic Acids Res. 2011;39:D411–D419. doi: 10.1093/nar/gkq1105. [DOI] [PMC free article] [PubMed] [Google Scholar]
- 19.Joosten RP, Salzemann J, Bloch V, Stockinger H, Berglund AC, Blanchet C, Bongcam-Rudloff E, Combet C, Da Costa AL, Deleage G, Diarena M, Fabbretti R, Fettahi G, Flegel V, Gisel A, Kasam V, Kervinen T, Korpelainen E, Mattila K, Pagni M, Reichstadt M, Breton V, Tickle IJ, Vriend G. PDBREDO: automated re-refinement of X-ray structure models in the PDB. J Appl Crystallogr. 2009;42:376–384. doi: 10.1107/s0021889809008784. [DOI] [PMC free article] [PubMed] [Google Scholar]
- 20.Joosten RP, Joosten K, Cohen SX, Vriend G, Perrakis A. Automatic rebuilding and optimization of crystallographic structures in the protein data bank. Bioinformatics. 2011;27:3392–3398. doi: 10.1093/bioinformatics/btr590. [DOI] [PMC free article] [PubMed] [Google Scholar]
- 21.Murshudov GN, Vagin AA, Dodson EJ. Refinement of macromolecular structures by the maximum-likelihood method. Acta Crystallogr D Biol Crystallogr. 1997;53(Pt 3):240–255. doi: 10.1107/s0907444996012255. [DOI] [PubMed] [Google Scholar]
- 22.Warshel A, Dryga A. Simulating electrostatic energies in proteins: perspectives and some recent studies of pKas, redox, and other crucial functional properties. Proteins: Struct Funct Bioinforma. 2011;79:3469–3484. doi: 10.1002/prot.23125. [DOI] [PubMed] [Google Scholar]
- 23.Nielsen JE, Gunner MR, Garcia-Moreno EB. The pKa Cooperative: a collaborative effort to advance structure-based calculations of pKa values and electrostatic effects in proteins. Proteins: Struct Funct Bioinforma. 2011;79:3249–3259. doi: 10.1002/prot.23194. [DOI] [PMC free article] [PubMed] [Google Scholar]
- 24.Garcia-Moreno BE, Fitch CA. Structural and interpretation of pH and salt-dependent processes in proteins with computational methods. Methods Enzymol. 2004;380:20–51. doi: 10.1016/S0076-6879(04)80002-8. [DOI] [PubMed] [Google Scholar]
- 25.Chen J, Brooks CL, III, Khandogin J. Recent advances in implicit solvent-based methods for biomolecular simulations. Curr Opin Struct Biol. 2008;18:140–148. doi: 10.1016/j.sbi.2008.01.003. [DOI] [PMC free article] [PubMed] [Google Scholar]
- 26.Stewart JJP. Optimization of parameters for semiempirical methods VI: more modifications to the NDDO approximations and re-optimization of parameters. J Mol Model. 2013;19:1–32. doi: 10.1007/s00894-012-1667-x. [DOI] [PMC free article] [PubMed] [Google Scholar]
- 27.Stewart JJP. MOPAC2012, Version 13.159 M. Stewart computational chemistry 28. Allen FH, Kennard O, Taylor R (1983) Systematic analysis of structural data as a research technique in organic chemistry. Acc Chem Res. 2012;16:146–153. doi: 10.1021/ar00089a001. [DOI] [Google Scholar]
- 29.Allen FH. The Cambridge structural database: a quarter of a million crystal structures and rising. Acta Crystallogr, Sect B: Struct Sci. 2002;B58:380–388. doi: 10.1107/s0108768102003890. Copyright (C) 2013 American Chemical Society (ACS). All Rights Reserved. [DOI] [PubMed] [Google Scholar]
- 30.Moews PC, Kretsinger RH. Refinement of the structure of carp muscle calcium-binding parvalbumin by model building and difference Fourier analysis. J Mol Biol. 1975;91(2):201–225. doi: 10.1016/0022-2836(75)90160-6. [DOI] [PubMed] [Google Scholar]
- 31.Kostrewa D. Bulk solvent correction: practical application and effects in reciprocal and real space. Newslett Protein Crystallogr. 1997;34:9–22. [Google Scholar]
- 32.Chen VB, Arendall WB, 3rd, Headd JJ, Keedy DA, Immormino RM, Kapral GJ, Murray LW, Richardson JS, Richardson DC. MolProbity: all-atom structure validation for macromolecular crystallography. Acta Crystallogr D Biol Crystallogr. 2010;66(Pt 1):12–21. doi: 10.1107/s0907444909042073. [DOI] [PMC free article] [PubMed] [Google Scholar]
- 33.Adams PD, Afonine PV, Bunkoczi G, Chen VB, Davis IW, Echols N, Headd JJ, Hung LW, Kapral GJ, Grosse-Kunstleve RW, McCoy AJ, Moriarty NW, Oeffner R, Read RJ, Richardson DC, Richardson JS, Terwilliger TC, Zwart PH. PHENIX: a comprehensive Python-based system for macromolecular structure solution. Acta Crystallogr D Biol Crystallogr. 2010;66(Pt 2):213–221. doi: 10.1107/s0907444909052925. [DOI] [PMC free article] [PubMed] [Google Scholar]
- 34.Jmol: an open-source Java viewer for chemical structures in 3D. http://jmol.sourceforge.net/
- 35.Stewart JJP. [Accessed 18 September 2013];MOPAC Online User Manual. 2013 http://openmopac.net/manual/. http://openmopac.net/manual/
- 36.Pettersen EF, Goddard TD, Huang CC, Couch GS, Greenblatt DM, Meng EC, Ferrin TE. UCSF Chimera—a visualization system for exploratory research and analysis. J Comput Chem. 2004;25(13):1605–1612. doi: 10.1002/jcc.20084. [DOI] [PubMed] [Google Scholar]
- 37.Desiraju GR. The C-H···O hydrogen bond: structural implications and supramolecular design. Acc Chem Res. 1996;29:441–449. doi: 10.1021/ar950135n. [DOI] [PubMed] [Google Scholar]
- 38.Manikandan K, Ramakumar S. The occurrence of C-H…O hydrogen bonds in α-helices and helix termini in globular proteins. Proteins: Struct Funct Bioinforma. 2004;56:768–781. doi: 10.1002/prot.20152. [DOI] [PubMed] [Google Scholar]
- 39.Nangia A. Conformational polymorphism in organic crystals. Acc Chem Res. 2008;41:595–604. doi: 10.1021/ar700203k. [DOI] [PubMed] [Google Scholar]
- 40.Davis AM, St-Gallay SA, Kleywegt GJ. Limitations and lessons in the use of X-ray structural information in drug design. Drug Discov Today. 2008;13(19–20):831–841. doi: 10.1016/j.drudis.2008.06.006. [DOI] [PMC free article] [PubMed] [Google Scholar]
- 41.Engh RA, Huber R. Accurate bond and angle parameters for x-ray protein structure refinement. Acta Crystallogr Sect A: Found Crystallogr. 1991;A47:392–400. doi: 10.1107/s0108767391001071. [DOI] [Google Scholar]
- 42.Engh RA, Huber R. International Tables for Crystallography. F. Kluwer; Dordrecht: 2006. Structure quality and target parameters; pp. 382–392. [DOI] [Google Scholar]