Abstract
The goal of this research was to find the most comprehensive lipid extraction of blood plasma, while also providing adequate aqueous preparation for metabolite analysis. Comparisons have been made previously of the Folch, Bligh-Dyer, and Matyash lipid extractions; furthermore, this paper provides an additional comparison of a phospholipid removal plate for analysis. This plate was used for lipid extraction rather than its intended use in lipid removal for polar analysis, and it proves to be robust for targeted lipid analysis. Folch and Matyash provided reproducible recovery over a range of lipid classes, however the Matyash aqueous layer compared well to a typical methanol preparation for polar metabolite analysis. Thus, the Matyash method is the best choice for an untargeted biphasic extraction for metabolomics and lipidomics in blood plasma.
Keywords: Metabolomics, lipidomics, sample preparation, LC-MS
1. Introduction
Global metabolomics and lipidomics rely on a variety of sample preparation procedures that all influence recovery percentages. When extracting lipids from a matrix such as blood plasma, thorough extraction of the lipidome is necessary to ensure reproducible and comprehensive recovery of lipids, despite the wide variation in physiochemical properties. Cornerstone lipid extraction methods exist, including the Bligh-Dyer [1] and Folch, [2] but many other methods have been developed in recent decades. The Matyash [3] method uses methyl tert-butyl ether (MTBE) in place of chloroform, which provides several advantages, including improved efficiency, high throughput and safety of using MTBE compared to chloroform for lipid analysis of human brain samples [4]. MTBE is safer to work with than chloroform, reducing hazardous chemical use in many labs. Additionally, the density of the MTBE compared to the water/methanol layer is such that, in the Matyash method, the organic layer is on top of the aqueous layer with the protein at the bottom, thus minimizing pipette contamination and leading to easier integration with robotics and automation [4, 5].
Reis [6] et al., performed an experiment comparing 5 different non-polar extractions for blood plasma, including both the Folch and Matyash preparations. Recovery with each solvent was dependent on lipid class, but Folch and Bligh-Dyer were deemed the best for “broad-based” lipidomics by providing reasonable coverage and reproducibility across a variety of lipid classes. However, comparison of the Folch with the MTBE-based method in Reis’s work only showed significant differences among a few classes, in which SM and LacCer fared better with the MTBE-based method. Conversely, the lipoamino acids and PIs had better recovery with the chloroform-based method. Lee [7] et al., demonstrated that Folch and Matyash methods performed equally robust for global lipidome analysis, but neither recovered aqueous metabolites as well as protein precipitation methods.
This study aimed at comparing three protocols for the sample preparation of non-polar metabolites from plasma: Folch, Matyash, and a method using the Waters Ostro phospholipid removal plate. The Waters Ostro plate, although originally developed as a phospholipid removal plate for polar metabolite sample preparation [8, 9], also works well for targeted lipid sample preparation with the use of different solvents, as noted in a Waters application note [10]. A set of lipid recovery standards and a set of endogenous lipids from several classes were targeted and compared for each sample preparation protocol. The aqueous Matyash layer was also examined in comparison to a methanol protein precipitation method to examine its potential for reproducible biphasic extractions. The Bligh and Dyer method was not compared here as previous results in our lab demonstrated practical and analytical advantages to using the Folch and Matyash methods. Cleaner phase separations were seen in both Folch and Matyash protocols with this particular sample type.
In an outline for optimization of sample preparation procedures in lipid profiling by Sarafian [5] et al., basic criteria were laid out for quality lipid sample preparation including simplicity, safety, protein removal efficiency, reproducibility and repeatability, lipid recovery, and cost. From previous studies, a few comments can be made about the Folch, Matyash, and Waters Ostro plate procedures concerning Sarafian’s criteria. The benefit of the phase formation in the Matyash method with protein on bottom and organic phase on top adds simplicity over the Folch method. The Ostro plate also has an advantage of using fewer resources because the 96-well tray is used throughout sample preparation reducing transfer between centrifuge tubes. As mentioned previously, the safety of chloroform and other solvents must be under consideration when choosing a chloroform-based procedure. Sarafian [5] found that the Folch method did not perform as well removing proteins as the other methods tested, with Folch leaving about 5% protein in the organic phase. Protein removal efficiency must be high for liquid chromatography to maximize column lifetime, reduce source clogging, and reduce ion suppression. Folch has remained a gold standard technique due to the broad lipid coverage, reproducibility, and historical use. Concerning cost, the Ostro plate has the plate and one-time vacuum manifold cost associated with it; however, downstream costs may be saved in solvent usage. The Ostro plate uses slightly more solvent per sample than the Folch method, but much less than the Matyash method, which uses more than double the volume of solvent of the Waters Ostro plate.
It has also been reported [11] that the Matyash method or a similar method using MTBE may serve as a biphasic extraction for small polar metabolites as well as lipids and other non-polar species. Chen et al.[11] demonstrated that the Matyash method with more water provided an aqueous portion comparable to a typical 80% extraction. Thus, as an added benefit of the Matyash method, it was compared to a typical cold methanol protein precipitation in order to probe the metabolite coverage differences. The peak areas of a selection of endogenous compounds were compared between the Matyash aqueous phase and the methanol protein precipitation protocol.
This is the first paper to compare a phospholipid removal plate to other lipid sample preparation methods for blood plasma. The previously published work concerning lipid sample preparation for cells and tissue helped provide background for work with blood plasma as a matrix, especially Reis et al.[6], Sarafian et al.[5], Abbott et al.[4], and Lee et al.[7]. Here we show a detailed comparison of three sample preparation methods for blood plasma for LC/MS lipidomics analysis from the well-known Folch, through to the lesser-known Waters Ostro method. Analysis of compounds in plasma, based on reproducibility, extraction efficiency, practicality, and comprehensive coverage of different compound classes demonstrate the strengths of the Matyash method.
2. Materials and Methods
2.1. Chemicals and materials
Solvents used for extraction included HPLC grade methyl tert-butyl ether (MTBE), chloroform, and triethylamine (TEA) from Fisher Scientific (San Jose, CA, USA). Fisher Optima LC/MS grade solvents included isopropanol, water with 0.1% formic acid, acetonitrile (ACN), and acetonitrile with 0.1% formic acid. Fluka Analytical methanol was LC/MS grade from Sigma Aldrich (St. Louis, MO, USA). Ethanol (200 proof) was purchased from Pharmaco-Aaper (Brookfield, CT, USA). Formic acid ampoules were Optima LC/MS grade from Fisher Scientific. Ammonium formate (LC/MS grade) and butylhydroxytoluene (BHT) were purchased from Fisher. BHT was used at a concentration of 1mM in the methanol during sample preparation to limit oxidation.
Mobile phases for the lipid method consisted of 60:40 acetonitrile:water with 10 mM ammonium formate and 0.1% formic acid (A) and 90:10 isopropanol:acetonitrile with 10 mM ammonium formate and 0.1% formic acid (B). Mobile phases for the polar metabolite method consisted of water and acetonitrile, both with 0.1% formic acid.
All of the lipid internal standards (ISTDs) were purchased from Avanti Polar Lipids Inc (Alabaster, AL, USA). These included lysophosphatidylcholines (LPC) 17:0 and 19:0, phosphatidylcholines (PC) (17:0/17:0) and (19:0/19:0), phosphatidylglycerols (PG) (17:0/17:0) and (14:0/14:0), phosphatidylethanolamines (PE) (17:0/17:0) and (15:0/15:0). Triacylglycerides (TG) (17:0/17:0/17:0) and (15:0/15:0/15:0) were purchased from Sigma Aldrich. All of these lipids were prepared as a mixture to a concentration of 100 ppm in chloroform:methanol (1:2, v/v). The metabolomics internal standard was L-tryptophan-2,3,3-d3 from CDN Isotopes (Pointe-Claire, Quebec, Canada) in 90:10 water:methanol at a concentration of 100 µg/L.
2.2. Storage and handling of plasma samples
Pooled American Red Cross blood plasma samples were stored at −80 °C. The plasma was thawed on ice prior to extraction. For all experiments, the internal standards were spiked into half the samples before extraction and the other half after extraction, hence “pre-extraction” and “post-extraction” peak areas. Each set was analyzed in technical triplicates.
2.3. Folch lipid extraction
The blood plasma samples that were prepared via the Folch lipid extraction were divided into two sets of three, one set for pre-extraction and one set for post-extraction. Each aliquot consisted of 40 µL of blood plasma. The mixture of lipid ISTDs was added to the pre-extraction set (15 µL of 100 ppm). Next, 160 µL of methanol (with 1 mM BHT) was added to all Folch samples followed by 320 µL of chloroform. Samples were vortexed and incubated on ice for 20 minutes. Samples were vortexed again before the addition of 150 µL of water to induce phase separation, and incubation on ice for another 10 minutes. Folch samples were then centrifuged for 5 minutes at 10,000 rpm. The bottom layer (organic) was removed to a new, clean microcentrifuge tube before the top layer was reextracted with 250 µL of chloroform:methanol (2:1, v/v). The reextraction was vortexed and centrifuged an additional 5 minutes. The organic layers were combined and 15 µL ISTD was added to the designated post-extraction samples. The samples were dried in a nitrogen gas evaporator with multiple channels for the tubes and held at 30 °C. Finally, they were reconstituted in 200 µL isopropanol and transferred to LC vials prior to LC analysis.
2.4. Waters Ostro Phospholipid Removal Plate
The Waters Ostro plate, originally intended to remove phospholipids from samples before analysis of small polar metabolites, was instead used to select lipids for analysis per a 2012 application note from Waters [10]. For this preparation, the 96-well Waters Ostro plate was placed on top of a vacuum manifold (Biotage Vacmaster 96) with a collection plate below. Blood plasma (40 µL) was placed in six wells across a row (two each in left, middle, and right). To three wells, 15 µL of 100 ppm ISTD mix was added. Each of the six wells then received 320 µL of ethanol before vacuum was applied (−0.4 bar) until solvent flowed through. A second aliquot of ethanol (320 µL) was added to each well and vacuum was again applied. The collection plate was removed (the flow through fraction) from the vacuum manifold and a new collection plate (eluate fraction) was placed in the vacuum manifold followed by 320 µL of eluate solution (4.5:4.5:1, chloroform:methanol:triethylamine, v/v/v) into each of the six wells. Vacuum was applied until dry, followed by another 320 µL aliquot of eluate solution and more vacuum. ISTD mix (15 µL of 100 ppm) was added to the wells of the collection plate corresponding to the post-extraction samples. The collection plates were dried under nitrogen gas at room temperature. The samples were then reconstituted in 200 µL isopropanol for analysis.
2.5. Matyash Lipid Extraction and Metabolite Preparation
Similar to the Folch method, 40 µL of plasma was placed into six microcentrifuge tubes on ice [3]. In three of the tubes, 15 µL of ISTD mix was added for pre-extraction. All six tubes then had 300 µL of methanol (1mM BHT) added as well as 1 mL of MTBE. Samples were then placed on shaker at room temperature. After one hour, 250 µL water was added to each tube to induce phase separation, followed by 10 minutes of incubation at room temperature (with occasional vortex). The samples were centrifuged for 10 minutes before removal of upper (organic) phase to new, clean microcentrifuge tubes. The bottom (aqueous) layer was reextracted with 2 mL MTBE:methanol:water (10:3:2.5, v/v). Reextraction tubes were vortexed and centrifuged for 10 minutes, and organic layers were combined. The aqueous phase was transferred to new, clean microcentrifuge tube for metabolomic analysis. All organic samples were dried under nitrogen gas and reconstituted in 200 µL isopropanol. Aqueous samples were dried under nitrogen gas and reconstituted in 150 µL of water with 0.1% formic acid.
2.6. LC conditions and experiments for lipid analysis
A Dionex Ultimate 3000 (Thermo, San Jose, CA, USA) ultra-high performance liquid chromatography system with a Thermo Q-Exactive mass spectrometer operating in positive mode was used for both the lipid and small metabolite separation and data acquisition. For lipid sample analysis, a Waters (Milford, MA, USA) BEH C18 column (50 × 2.1 mm, 1.7 µm pore size) with a Waters VanGuard BEH C18 1.7 µm guard column was used for separation. Mobile phases consisted of (A) 60:40 acetonitrile:water with 10 mM ammonium formate and 0.1% formic acid and (B) 90:10 isopropanol: acetonitrile with 10 mM ammonium formate and 0.1% formic acid. The flow rate was held constant at 0.5 mL/min with a gradient beginning at 32% B, increasing to 100 % B over 16 minutes, held isocratic for 1 minute, and returned to starting conditions from 17–18 minutes and 4 minutes for equilibration. Injection volume was 2 µL and the column was held at 30 °C. All samples were injected twice.
The mass spectrometer was operated in positive heated electrospray ionization (HESI) mode with a spray voltage of 3.5 kV, capillary temperature of 300 °C, sheath gas flow of 30, auxiliary gas of 5 (arbitrary units). The s-lens RF level was set to 35. Acquisition resolving power was set at 70,000 at m/z 200 for alternating scans between full scan and all ion fragmentation (AIF). AIF maintained the 70,000 resolution with a normalized collision energy (NCE) of 35. Traditional MS/MS spectra were obtained in some cases to further confirm identity. In those cases, a resolution of 17,500 was used with NCE of 25 and isolation width of 2.0 m/z.
2.7. UHPLC conditions and experiments for aqueous metabolite analysis
For the smaller, polar molecules the same UHPLC/MS system was used, but with an ACE (Aberdeen, Scotland) Excel 2 C-18 PFP (100 × 2.1 mm, 2µm) column and C18 guard. Mobile phases consisted of (A) water with 0.1% formic acid and (B) acetonitrile with 0.1% formic acid. The chromatography gradient started at 2% B for 1 minute, went to 98% B over 10 minutes, was held for 2 minutes, and was reduced to 2% over 30 seconds before equilibration for 3 minutes. Injection volume was 2 µL and the column was held at 35 °C. All samples were injected twice.
The mass spectrometer was operated in heated electrospray ionization (HESI) mode with a spray voltage of 3.5 kV, capillary temperature of 300 °C, sheath gas flow of 50, auxiliary gas of 10. The s-lens RF level was set to 40 and the s-lens voltage was set to 25 V. Acquisition resolution was 70,000 for full scan, and 17,500 for MS/MS with an inclusion list. The MS/MS inclusion list (shown in supplemental data) consisted of a wide variety of metabolites and metabolite classes in order to get a comprehensive understanding of how the different sample preparations affect certain types of metabolites. It included amino acids and many amino acid derivatives, carnitines, and lysophospholipids.
2.8. Data analysis
All data were processed with Xcalibur processing software (Thermo) for peak area integration of internal standards and endogenous compounds. Extraction efficiency of the ISTDs was calculated by taking the ratio of the averaged pre-extraction peak area over the averaged post-extraction peak area. Databases such as LipidMaps and the Human Metabolome Database (HMDB) were referenced for metabolite identification using the exact mass and MS/MS information available.
3. Results and Discussion
3.1. Overview
These experiments aimed to define an optimum set of sample preparation conditions for global analysis of polar and non-polar metabolites in blood plasma. The following were considered: extraction efficiency, reproducibility, coverage, practicality and cost.
3.2. Recovery of Internal Standards
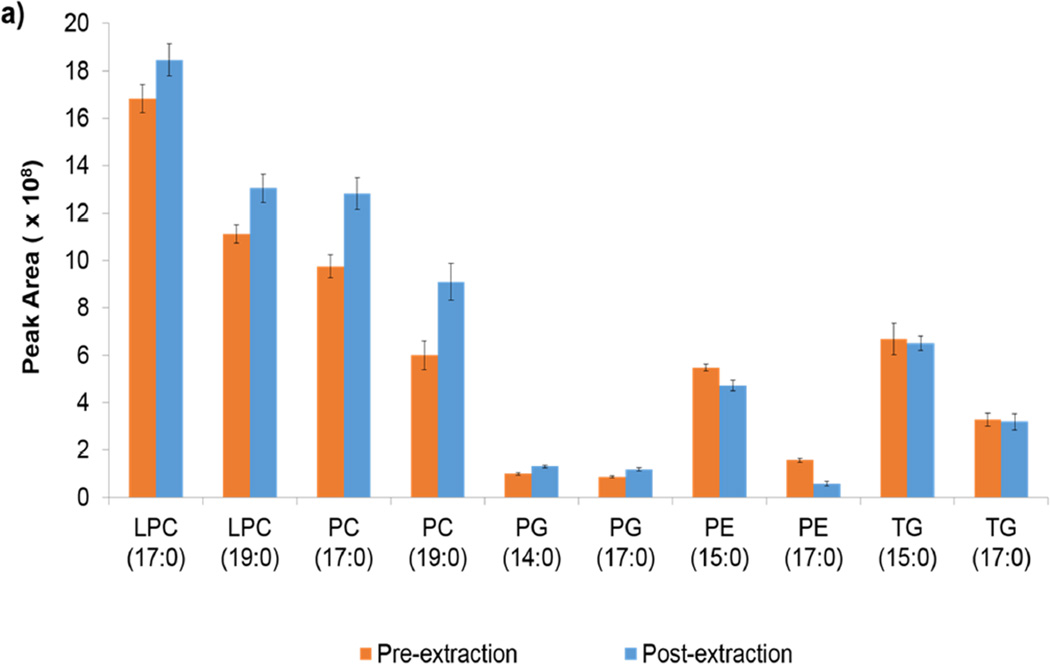
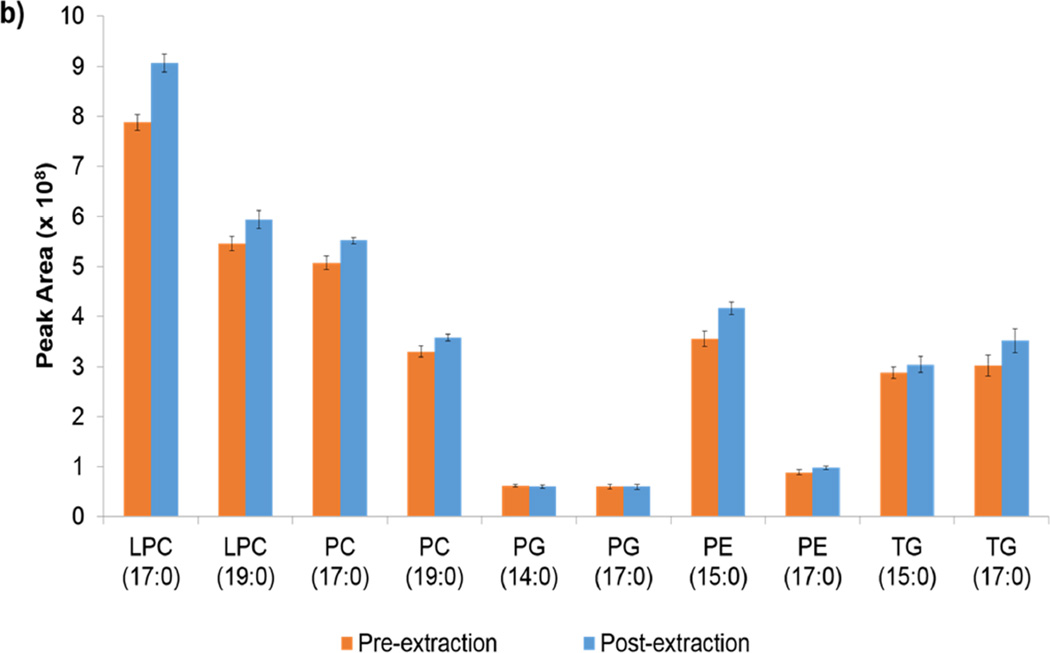
Extraction efficiencies of internal standards were calculated by the ratio of the internal standard in the pre-extraction samples to the same internal standard in the post-extraction species. Note in Table 1 that all of the methods are reproducible within lipid class. Figure S1 in the supplemental material shows this information graphically. Table 1 also shows the average recoveries for lipid internal standards. Although Folch and Matyash demonstrated the same average recovery, the variability was lower in the Matyash method. All four methods show at least one case of >100 % recovery. Although most are within error, the PE recovery in the Folch method is an exception. Figures 1a and 1b show the peak areas of the pre- and post- extraction peak areas for the internal standards in the Folch and Matyash methods, respectively. Although the general trends in ionization efficiency of class and tail length are similar between the methods, the overall peak area is higher in that of the Folch. This higher peak area but similar ionization proportions may indicate the presence of more ion suppression in the Matyash method. Specifically, the shorter chain species within each class have higher signal efficiency in both methods. Note the larger signal in PE pre-extraction peak area compared to post-extraction of the Folch.
Table 1.
Percentage of recovery for each ISTD with each method or fraction, including the average recovery for each method.
| Folch | Matyash | Ostro FT | Ostro E | |
|---|---|---|---|---|
| PC (17:0) | 92 ± 3 | 87 ± 2 | 6.4 ± 0.9 | 96 ± 10 |
| LPC (19:0) | 85 ± 3 | 92 ± 2 | 2.6 ± 0.4 | 102 ± 12 |
| PC (17:0/170) | 76 ± 4 | 92 ± 2 | 0 | 105 ± 10 |
| PC (19:0/19:0) | 66 ± 7 | 92 ± 3 | 0 | 101 ± 16 |
| PG (14:0/14:0) | 76 ± 5 | 103 ± 3 | 89 ± 3 | 1.5 ± 0.3 |
| PG (17:0/17:0) | 74 ± 4 | 101 ± 6 | 82 ± 4 | 2.0 ± 0.4 |
| PE (15:0/15:0) | 116 ± 3 | 85 ± 4 | 82 ± 17 | 6.8 ± 1 |
| PE (17:0/17:0) | 134 ± 14 | 91 ± 5 | 105 ± 3 | 11 ± 1 |
| TG (15:0/15:0/15:0) | 103 ± 10 | 95 ± 4 | 80 ± 6 | 11 ± 1 |
| TG (17:0/17:0/17:0) | 103 ± 8 | 86 ± 7 | 47 ± 8 | 25 ± 6 |
| Average | 92 ± 7% | 92 ± 2% | 49 ± 14% | 46 ± 15% |
Figure 1.
a and 1b. a) ISTD peak areas for the Folch method for pre-extraction and post-extraction samples. b) ISTD peak areas for the Matyash method for the pre-extraction and post-extraction samples. ISTDs are abbreviated like so: “PC (17:0)” represents PC (17:0/17:0).
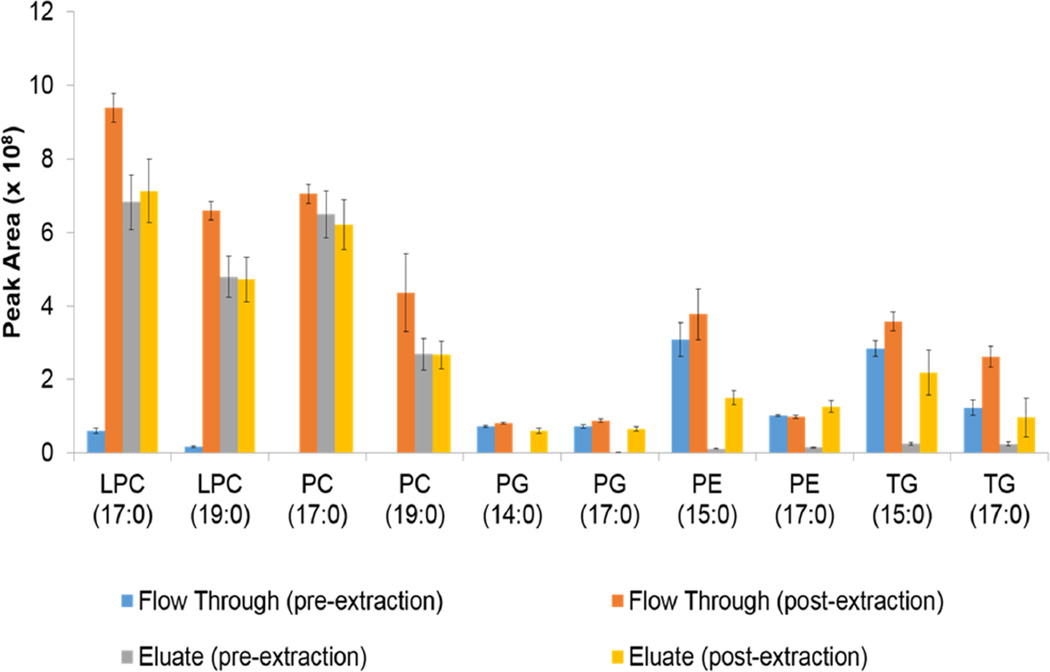
The phospholipid removal plate demonstrated reproducibility within classes, as shown in Figure 2, but varied from class to class concerning the fraction of elution (eluate or flow through). PCs and LPCs eluted in the eluate fraction (chloroform:methanol:triethylamine), while PEs, PGs, and TGs mostly eluted in the flow through fraction (ethanol). Although the PGs, PEs, and TGs eluted in both fractions, recoveries were all below 12% with the exception of TG (17:0/17:0/17:0), which had 25% recovery in the eluate fraction. The separation of the PCs from the rest of the classes would be an advantage for targeted analysis by class. PCs usually have a very high signal and create ion suppression [12]. By separating the PCs from many other lipid classes, the analysis of other classes would be easier. Finally, when both fractions are analyzed, there is, in total more compound coverage compared to Folch or Matyash on by themselves. Over all the lipid classes tested in the Ostro method, the average sum recovery in both fractions was 95±4%.
Figure 2.
ISTD peak areas for the Ostro plate method. From left to right: Flow through pre-extraction, flow through post-extraction eluate pre-extraction, eluate post-extraction.
Reproducibility between methods, also shown in Table 1, was measured by the standard deviation of the mean (SEM) of the internal standard recoveries. The Matyash method did not have any SEM values over 7%, whereas the Folch TG (15:0) recovery had 10% variability, Ostro flow through PE (15:0) had 17% variability, and Ostro eluate had 10, 12, and 16% variability on LPC (17:0), LPC (19:0), and PC (19:0), respectively. Examining the error bars in Figure S1 corroborate these numbers. A positive pressure vacuum manifold could likely increase the reproducibility of the Ostro methods, but was not tested in this study. The vacuum used in this study had a tendency to pull the middle wells more consistently than the outer ones, potentially increasing variability across the plate.
In conclusion, the internal standards demonstrated hallmark characteristics of the Folch, Matyash, and Ostro plate methods. The Folch method demonstrated great signal from internal standards, with similar recovery but lower reproducibility compared to Matyash. The Ostro plate demonstrated partitioning of the lipids by class with consistency within each class, but included more variability. Overall the Matyash method proved to have the best reproducibility and extraction efficiency across the lipid classes.
3.3. Recovery of Endogenous Lipids
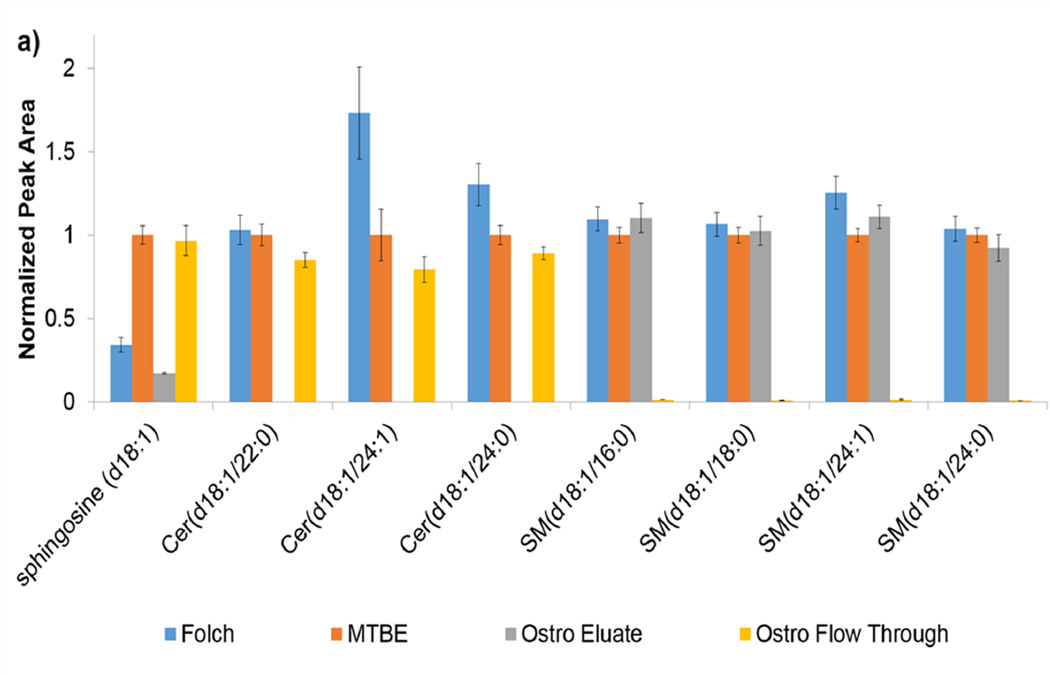
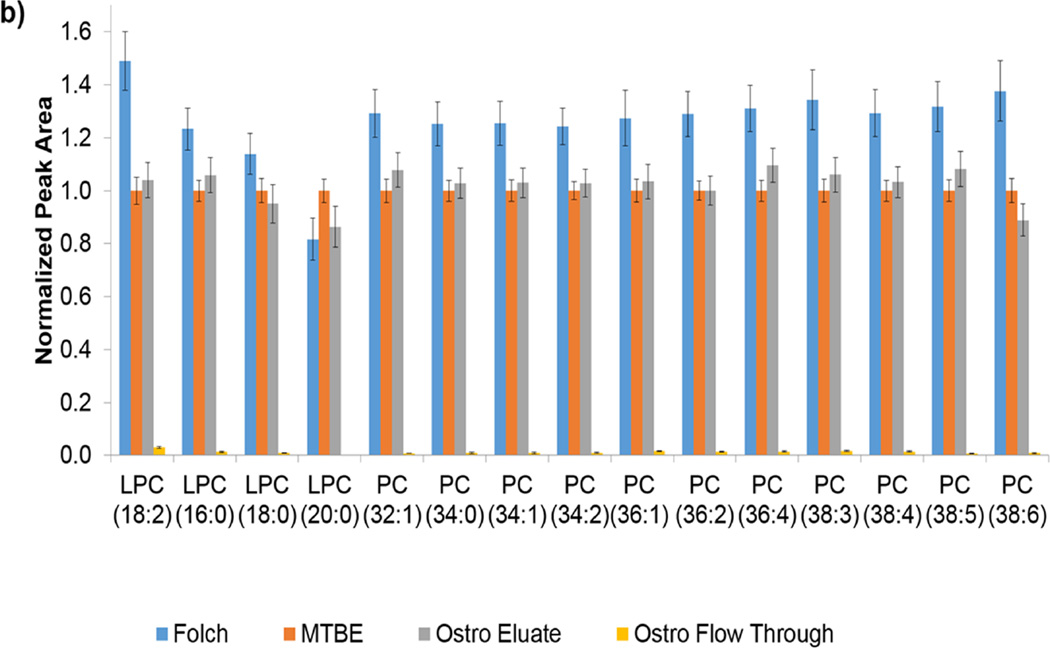
In order to get a broader view of how compound classes fared in each preparation method, a wide list of endogenous compounds was targeted. For the lipid method, classes targeted included carnitines, phospholipids, diacylglycerols (DG), sphingolipids, cholesterol esters, and triacylglycerols (TG) for a total of 52 species. In most cases, lipids are listed with total number of carbons and unsaturations. In cases where chromatographic separation was not obtained due to the presence of differing chain length combinations, peak areas were summed. Patterns within class were fairly consistent. The sphingolipids shown in Figure 3a represent an example of a targeted class. The ceramides elute almost 100% in the flow through fraction of the Ostro plate while the Folch method recovered more ceramides. Conversely, almost 100% of the SMs eluted in the eluate fraction of the Ostro plate. Notice that the Folch, Matyash, and Ostro eluate fraction consistently recovered the same amount of SM. Since PCs and SMs share the same headgroup (Figure 3b), it can be assumed that the polarity of the phosphocholine headgroup is contributing to the partitioning behavior. The PCs elute 99% in the eluate portion of the Ostro, but also have consistently better signal in the Folch compared to the Matyash. Since the recovery of the PC internal standards were better in Matyash, the higher peak area seen here indicates better ionization efficiency as seen in general for Folch internal standard work, but not necessarily higher recovery. Since PCs ionize very well, they can often cause ion suppression of other lipids in similar retention times [12]. Using the Ostro plate for lipid preparation may be beneficial since removing PCs can increase ionization of other compounds.
Figure 3.
a and 3b. a) Peak areas for lipids within the sphingolipid class are shown normalized to the Matyash method. The order shown: Folch, Matyash, Ostro Eluate fraction, and Ostro Flow Through fraction. b) Peak areas for PCs are shown in the same order, also normalized to Matyash method.
Similar data for extraction efficiencies of carnitines, PEs, DGs, CEs, and TGs can be found in the supplemental material. Note in many cases, especially PCs, PEs and DGs, the lower standard deviation of the mean (error bars) in the Matyash method for all compounds. The carnitines varied by class and were the least reproducible across all methods. In addition, the longer chain lengths partitioned into the Ostro eluate fraction over the flow through fraction. PEs demonstrated mostly the same recovery in Folch and Matyash within error and 91% elute in the flow through portion of the Ostro plate. TGs and DGs, as expected, responded very similarly to each other. Highest recovery in both cases occurred with the Folch method, but note the higher error associated with the Folch (6% in TG; 33% in DG) over the Matyash (4% in TG; 11% in DG) or Ostro flow through portion (2% in TG; 7% in DG), especially in DGs. The higher error in the DG class may be due to the low abundance of DG signal in plasma samples – more than an order of magnitude lower than TGs. The last of the lipid classes targeted were CEs, in which recovery remained similar in Folch and MTBE. The CEs partitioned into the flow through fraction of the Ostro plate, where recovery was sometimes half that of Folch and Matyash. Reproducibility was better with the Matyash method, especially for CE (18:1), but overall the error was consistent for this class across methods.
The Ostro plate method proved valuable in phosopholipid recovery and other classes as well. Overall, the Ostro plate would be useful for a targeted lipidomics platform. The phosphatidylcholines (PCs) elute in a different fraction, thus are mostly separated from other lipid classes such as PE, PG, CE, DG, and TG. This is could be advantageous since PCs ionize very well and their removal may enable improved signal from other lipid classes of interest. The Folch and Matyash methods both provided good recovery; and in many cases, the same amount of recovery. The primary benefit of the Matyash method is consistent recovery across lipid classes with low variability.
3.4. Added benefit of biphasic Matyash method
With ultimate interest in both small polar metabolites and lipid species, a robust biphasic extraction method for blood plasma can greatly reduce time, cost, and labor. Since the Matyash method has proven so helpful in lipid extraction efficiency in addition to biphasic extraction of lipids in brain tissue [4], comparison with a standard cold-methanol protein precipitation method was performed. Tryptophan (d3-tryptophan) was used as an internal standard, but different classes of metabolites were targeted for recovery, similarly to the endogenous lipid targets. These classes included amino acids, amino acid derivatives, carnitines, and lysophospholipids for a total of 34 compounds.
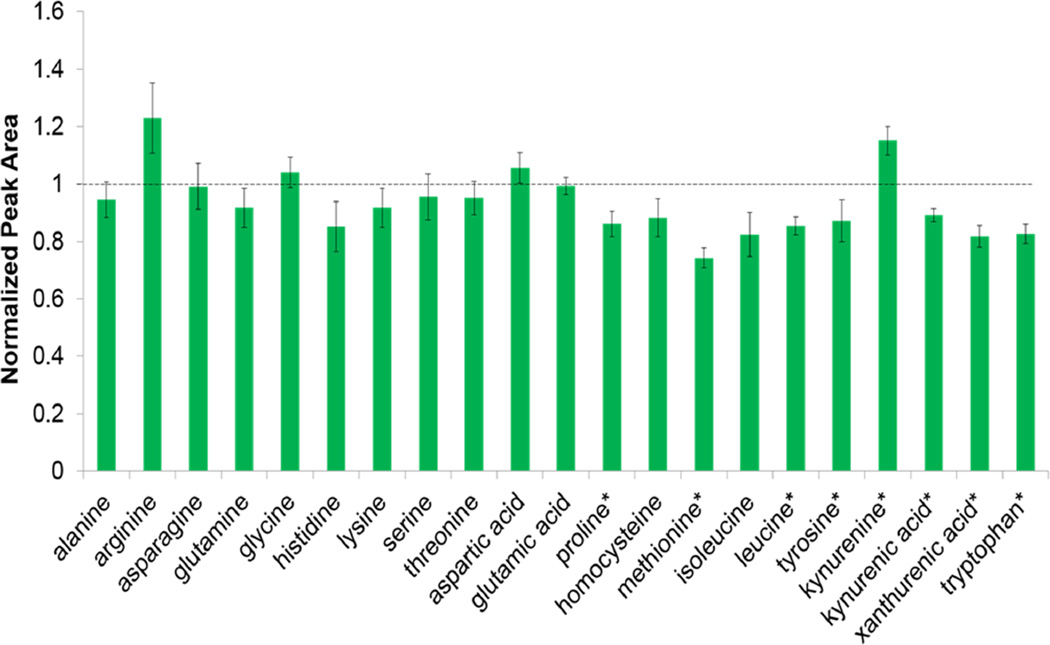
Graphs for all the compounds targeted are shown by class in the supplemental material, but the amino acids and derivatives are shown in Figure 4 as an example. This graph demonstrates the similarities between the Matyash aqueous and methanol protocol. The similarity across a class demonstrates the valuable use of the Matyash aqueous method. Carnitines have consistent and similar recovery in both methods as seen in Supplemental Figure S6. Lysophospholipids, including LPC (16:0), LPC (18:2), LPC (18:0), LPE (18:0) and LPE (16:0) all showed higher recovery in the Matyash aqueous phase as seen in Supplementary Figures S7. Recovery of LPCs were not as good in the Matyash organic phase compared to the Folch organic; it appears that the LPCs partition more in the aqueous phase of the Matyash method. LPEs, on the other hand, are extracted well both in the Matyash organic (better than Folch) and the Matyash aqueous (better than methanol). Variation in these methods was not significantly better or worse in any one. Since LPEs are consistently found in both Matyash phases, either could be used for LPE analysis, or the sum of both. LPC analysis may be best when using the aqueous phase for Matyash since the partition seems to be a bit higher in that phase. The partitioning between phases is consistent between LPC of chain length 16:0, 18:2, and 18:0 with the following respective ratios of peak area (aqueous/organic): 0.25, 0.30, 0.26.
Figure 4.
Peak areas of amino acids and derivatives in the Matyash method normalized to a MeOH crash. Dotted line indicates 1, where recovery is equal in both methods. *P<0.05
3.5. Time, Cost and Labor of methods
As mentioned above, time, cost and labor are all important when picking a standard protocol. The Folch method is advantageous since it is quick and considered one of the gold standards in lipid preparation. The Matyash method requires additional shaking time; however, this is not active time, thus use of that time affects time duration in comparison to Folch rather than human interaction. Due to the phase order, the Matyash is slightly more amenable to robotic sample preparation, which although, costly upfront, would save considerable hours in labor. The 96-well tray of the Ostro plate can reduce time where samples would otherwise be transferred to an LC-vial or 2–3 microcentrifuge tubes during preparation. One drawback of the Ostro plate for global lipidomics is that two fractions are created in the sample preparation process, thus leading to at least twice as many injections and reducing throughput. This, however, can have benefits for targeted lipidomics where one class may be partitioned to only one fraction. Additionally, light precipitation occurred after refrigeration of the Ostro samples before injection, thus indicating either limited protein removal efficiency or limited solubility, but could also be a drawback due to the lack of centrifugation in this method. Unlike the other protocols where samples sit on ice before transfer to LC vial for injection, the Ostro samples are not transferred, thus the protein precipitation could be a problem. The vacuum manifold on the Ostro is one source of potential error due to the variability across the plate. Initial cost of the manifold can be significant. Finally, the solvent usage per sample affects the cost of the analysis. The Folch method uses a total of 1.08 mL solvent per 40 µL sample, whereas the Ostro uses 1.48 mL per 40 µL sample, and the Matyash method uses the most at 3.76 mL per 40 µL sample. Factoring in cost of solvents, that could almost quadruple the cost of the Matyash method compared to the Folch method.
4. Conclusion
This is the first paper to compare the following methods for lipidomics sample preparation: Folch, Matyash, and Waters Ostro. The Matyash and Folch methods have reproducible recovery across a range of lipid classes with Folch tending to give higher peak areas, while the Matyash lends itself well to automated and greener chemistry. The Waters Ostro plate is beneficial for targeted lipid analysis. Since the ion-suppressing PCs are only found in one fraction, targeted analysis of classes such as PE, PG, CE, DG, and TGs is more sensitive than other methods. If untargeted analysis is the goal, the number of injections using the Ostro plate doubles and reduces throughput. The Matyash method has the added benefit of reproducibility in aqueous metabolite recovery for small polar metabolomics analysis.
Supplementary Material
Highlights.
Folch, Matyash, and Ostro plate preparations were compared for lipid coverage.
Matyash method provides recovery and reproducibility across lipid classes.
The Waters Ostro plate is beneficial for targeted lipidomics by class.
Matyash provides recovery of polar compounds as use in biphasic extraction.
Acknowledgments
The authors would like to acknowledge funding from the CTSI NIH grant (# UL1 TR000064), the SECIM NIH grant (# U24 DK097209), and the UF Chemistry Department. The Yost group members, both current and alumni, were also very helpful in this research, specifically Yu-Hsuan Tsai, Candice Z. Ulmer, and John Bowden.
Abbreviations
- TEA
triethylamine
- MTBE
methyltert-butyl ether
- BHT
butylhydroxytoluene
- ISTD
internal standard
- PC
phosphatidylcholine
- LPC
lysophosphatidylcholine
- PE
phosphatidylethanolamine
- LPE
lysophosphatidylethanolamine
- PG
phosphatidylglycerol
- DG
diacylglyceride
- TG
triacylglycerides
- CE
cholesterol ester
- ACN
acetonitrile
- IPA
isopropanol
- SM
sphingomyelin
- PI
phosphatidylinositol
- LacCer
lactosylceramide
- NCE
normalized collision energy
- AIF
all ion fragmentation
Footnotes
Publisher's Disclaimer: This is a PDF file of an unedited manuscript that has been accepted for publication. As a service to our customers we are providing this early version of the manuscript. The manuscript will undergo copyediting, typesetting, and review of the resulting proof before it is published in its final citable form. Please note that during the production process errors may be discovered which could affect the content, and all legal disclaimers that apply to the journal pertain.
References
- 1.Bligh EG, Dyer WJ. A rapid method of total lipid extraction and purification. Can. J. Biochem. Physiol. 1959;37:911–917. doi: 10.1139/o59-099. [DOI] [PubMed] [Google Scholar]
- 2.Folch-Pi J, Lees M, Stanley GHS. A simple method for the isolation and purification of total lipides from animal tissue. J. Bio. Chem. 1957;226:497–509. [PubMed] [Google Scholar]
- 3.Matyash V, Liebisch G, Kurzchalia TV, Shevchenko A, Schwudke D. Lipid extraction by methyl-tert-butyl ether for high-throughput lipidomics. J. Lipid. Res. 2008;49:1137–1146. doi: 10.1194/jlr.D700041-JLR200. [DOI] [PMC free article] [PubMed] [Google Scholar]
- 4.Abbott SK, Jenner AM, Mitchell TW, Brown SHJ, Halliday GM, Garner B. An improved high-throughput lipid extraction method for the analysis of human brain lipids. Lipids. 2013;48:307–318. doi: 10.1007/s11745-013-3760-z. [DOI] [PubMed] [Google Scholar]
- 5.Sarafian MH, Gaudin M, Lewis MR, Martin F-P, Holmes E, Nicholson JK, Dumas M-E. Objective set of criteria for optimization of sample preparation procedures for ultra-high throughput untargeted blood plasma lipid profiling by ultra performance liquid chromatography–mass spectrometry. Anal. Chem. 2014 doi: 10.1021/ac500317c. 140602081106005. [DOI] [PubMed] [Google Scholar]
- 6.Reis A, Rudnitskaya A, Blackburn GJ, Fauzi NM, Pitt AR, Spickett CM. A comparison of five lipid extraction solvent systems for lipidomic studies of human LDL. J. Lipid. Res. 2013;54:1812–1824. doi: 10.1194/jlr.M034330. [DOI] [PMC free article] [PubMed] [Google Scholar]
- 7.Lee DY, Kind T, Yoon Y-R, Fiehn O, Liu K-H. Comparative evaluation of extraction methods for simultaneous mass-spectrometric analysis of complex lipids and primary metabolites from human blood plasma. Anal. Bioanal. Chem. 2014;406:7275–7286. doi: 10.1007/s00216-014-8124-x. [DOI] [PubMed] [Google Scholar]
- 8.Wheaton JP, Mantha G, Martin J, Chambers EE, Diehl DM. A novel sample preparation device for improved phospholipid removal in bioanalytical assays. Waters Poster. 2010 [Google Scholar]
- 9.Tulipani S, Llorach R, Urpi-Sarda M, Andres-Lacueva C. Comparative analysis of sample preparation methods to handle the complexity of the blood fluid metabolome: When less is more. Anal. Chem. 2013;85:341–348. doi: 10.1021/ac302919t. [DOI] [PubMed] [Google Scholar]
- 10.Ritchie M, Mal M, Wong S, editors. Corporation. Milford: W. Waters Corporation; 2012. [Google Scholar]
- 11.Chen S, Hoene M, Li J, Li Y, Zhao X, Häring H-U, Schleicher ED, Weigert C, Xu G, Lehmann R. Simultaneous extraction of metabolome and lipidome with methyl tert-butyl ether from a single small tissue sample for ultra-high performance liquid chromatography/mass spectrometry. J. Chrom. A. 2013;1298:9–16. doi: 10.1016/j.chroma.2013.05.019. [DOI] [PubMed] [Google Scholar]
- 12.Ismaiel O, Halquist M, Elmamly M, Shalaby A, Thomaskarnes H. Monitoring phospholipids for assessment of ion enhancement and ion suppression in ESI and APCI LC/MS/MS for chlorpheniramine in human plasma and the importance of multiple source matrix effect evaluations. J. Chrom. B. 2008;875:333–343. doi: 10.1016/j.jchromb.2008.08.032. [DOI] [PubMed] [Google Scholar]
Associated Data
This section collects any data citations, data availability statements, or supplementary materials included in this article.


