

Abstract
The Carnitine palmitoyltransferase I (Cpt1) gene family plays a crucial role in energy homeostasis since it is required for the occurrence of fatty acid β-oxidation in the mitochondria. The exact gene repertoire in different vertebrate lineages is variable. Presently, four genes are documented: Cpt1a, also known as Cpt1a1, Cpt1a2; Cpt1b and Cpt1c. The later is considered a mammalian innovation resulting from a gene duplication event in the ancestor of mammals, after the divergence of sauropsids. In contrast, Cpt1a2 has been found exclusively in teleosts. Here, we reassess the overall evolutionary relationships of Cpt1 genes using a combination of approaches, including the survey of the gene repertoire in basal gnathostome lineages. Through molecular phylogenetics and synteny studies, we find that Cpt1c is most likely a rapidly evolving orthologue of Cpt1a2. Thus, Cpt1c is present in other lineages such as cartilaginous fish, reptiles, amphibians and the coelacanth. We show that genome duplications (2R) and variable rates of sequence evolution contribute to the history of Cpt1 genes in vertebrates. Finally, we propose that loss of Cpt1b is the likely cause for the unusual energy metabolism of elasmobranch.
Introduction
Long chain fatty acids are vital players in energy homeostasis since they undergo catabolism through the β-oxidation pathway in the mitochondria. Given that the inner mitochondrial membrane is only permeable to acyl groups if linked to carnitine, fatty acid uptake requires the action of carnitine palmitoyltransferase (CPTs). This system comprises two proteins with reverse functions, CPT1 and CPT2, residing in the outer and inner mitochondrial membranes, respectively [1]. CPT1 is the rate-limiting enzyme in the trans-esterification of acyl groups from coenzyme A (CoA) to carnitine due to its sensitivity and inhibition by malonyl-CoA, an intermediate of fatty acid synthesis [2].
In mammals CPT1 enzymes are encoded by three separate genes designated Cpt1a, Cpt1b and Cpt1c, each expressed in different tissue compartments [1, 3–5]. Cpt1a, known as the liver-expressing enzyme, is found also in other tissues [6]. The second isoform, Cpt1b, is primarily expressed in cardiac and skeletal muscle, hence termed muscle specific, although it can also be detected in testis and adipose tissue [1, 3, 5]. A more divergent Cpt1 gene was described and named Cpt1c. Commonly designated as the brain isoform, it is expressed mostly in the hypothalamus but residual levels can also appear in the ovary, testis and intestine [1, 7].
The evolution and orthology assignment of vertebrate Cpt1 genes has posed complex questions. Orthologs of Cpt1a, also referred as Cpt1a1 (see below), and Cpt1b have been previously identified in most vertebrate lineages [5, 8–11]. As for Cpt1c, the origin and function has remained difficult to elucidate. The prevailing consensus considers that Cpt1c is a recent gene duplicate that emerged in the mammalian lineage [2, 5, 12], probably acting as a malonyl-CoA targeted energy-sensor [2]. Recently, Ka and collaborators (2013) suggested that the sauropsid Cpt1b is pro-orthologous to mammalian Cpt1b and Cpt1c [8].
A further line of evolutionary complexity results from the identification of two extra Cpt1 genes designated Cpt1a2 alpha and beta, so far identified uniquely in teleosts [5, 9]. Their phylogenetic positioning suggests that they are a subfamily of Cpt1a [5, 9].
Here we re-examine the repertoire and evolutionary history of Cpt1 genes in vertebrate species. By means of comparative genomics, phylogenetics and sampling of a basal vertebrate lineage, the chondrichthyans, we provide important insights into the evolution of the Cpt1 gene family.
Material and Methods
Database identification and collection of Cpt1 genes
Using the H. sapiens CPT amino acid sequences, blastp and tblastn searches were performed in NCBI and Ensembl databases in order to identify and retrieve sequences from the following species: Mus musculus, Sus scrofa, Monodelphis domestica, Gallus gallus, Falco peregrinus, Anolis carolinensis, Xenopus tropicalis, Latimeria chalumnae, Danio rerio, Takifugu rubripes, Oryzias latipes, Gasterosteus aculeatus, Oreochromis niloticus, Tetraodon nigroviridis, Tachysurus fulvidraco, Callorhynchus milii, Drosophila melanogaster and Ciona instestinalis. For Leucoraja erinacea Blast searches were performed on the existing genome assemblies (Build 2) and transcriptomic assemblies (Build 2) available at SkateBase [13] (S1 Table).
Phylogenetic analysis
Sequence alignment was performed using MAFFT with the L-INS-i method [14]. The final alignment with 52 sequences was curated in BioEdit version 7.2.5 [15] with the removal of all columns containing gaps (S1 Fig), leaving an alignment with 655 gaps free sites for phylogenetic analysis. The original file with the sequence alignment containing gaps was also maintained for further phylogenetic analysis (S2 and S3A Figs). To determine the best evolutionary model of amino acid substitution, the sequence alignments were submitted to the ProtTest 2.4 server, resulting in a LG+I+G+F model [16]. Maximum Likelihood trees were reconstructed using PhyML 3.0 [17]. Branch support was assessed with aBayes [18]. Supplementary phylogenetic analysis using bayesian inference and neighbor-joining methods were conducted with the initial sequence alignment without gaps. Methods are described in S3B, S3C and S3D Fig. The resulting trees were visualized in Fig Tree V1.3.1 and rooted with the Cpt1 homologues of D. melanogaster and C. intestinalis.
Comparative genomics and neighbouring gene families
Comparative synteny maps were constructed with Ensembl comparative genomics pipeline, using as reference the latest available genome assemblies (Ensembl release 80—May 2015) for the following species: H. sapiens (GRCh38.p2), M. domestica (monDom5), G. gallus (Galgal4), A. carolinensis (AnoCar2.0), X. tropicalis (JGI_4.2), L. chalumnae (LatCha1) and D. rerio (GRCz10). The F. peregrinus data was collected from the latest assembly F. peregrinus v1.0 available in NCBI. For each species we analysed the genomic location of each Cpt gene, as well as, the five contiguous flanking genes to each side of the target gene, when possible. Following the assembly of the synteny maps, we proceeded to identify and localize the corresponding human orthologues of non-conserved neighbouring genes. Orthology was determined through the Ensembl orthologue-paralogue pipeline and our own phylogenetic analysis (not shown). Finally, synteny maps and annotated orthologues were then used to infer the localization of the ancestral Cpt gene in the reconstructed genome of the vertebrate ancestor using as reference the reconstruction presented by Nakatani and colleagues [19]. Synteny statistics was performed using CHSminer v1.1 [20]; input data was automatically retrieved from ensemble release 64, statistical analysis was performed for H. sapiens vs A. carolinesis and H. sapiens vs D. rerio and H. sapiens vs X. tropicalis when possible. If not indicated otherwise search parameters maintained as default maximal gap = < 30 and size> = 2. To further support synteny analysis we selected two flanking genes from each Cpt1 locus with representation in the majority of lineages analysed if not all, and performed phylogenetic analysis to address the orthology of the sequences (methods described in S4, S5 and S6 Figs).
Polymerase chain reaction (PCR) and gene expression analysis
Tissues were collected from Leucoraja erinacea obtained from Woods Hole, USA (kind gift from Neelakanteswar Aluru). Procedures were approved by the Animal Care and Use Committee of the Woods Hole Oceanographic Institution. Total RNA was extracted using the illustra RNAspin Mini kit (GE Healthcare, UK). The RNA extraction process included an on-column DNase I treatment (provided in the kit). RNA integrity was assessed on a 1% agarose TAE gel stained with GelRed™ nucleic acid stain (Biotium, Hayward, CA, USA). The Quant-iT™ RiboGreen® RNA Assay Kit (Life Technologies, Carlsbad, CA, USA) was used to measure total RNA concentration. Reverse transcription reactions were performed with the iScript cDNA Synthesis Kit (Bio-Rad, Hercules, CA, USA). Primers targeting Cpt1a and Cpt1c genes were designed with Primer3 Software [21], using the unassembled genome sequence from L. erinacea [13]. PCR was performed with Phusion Flash High-Fidelity PCR Master Mix (Thermo Fisher Scientific, USA). Reactions were set up for a final volume of 20 μl, sense and anti-sense primer concentrations of 500 nM and 0.8 μl of template cDNA using the following general protocol: initial denaturation at 98°C for 10 seconds, a 3-step cycle including an denaturation at 98°C for 1 second, annealing for 5 seconds at a primer set specific temperature (58–61°C) and extension at 72°C during a predicted product size appropriate time (5–40 seconds) for 40 cycles and a final extension at 72°C for 1 minute. PCR products were separated by electrophoresis in 1% agarose gel. Amplification products were excised from gel and cleaned with the GRS PCR & Gel Band Purification Kit (GRiSP, Portugal) and sequenced at STABVIDA (Portugal). The resulting full ORF nucleotide sequences were deposited in GenBank: Cpt1a (KF570112) and Cpt1c (KF570111).
Results
Phylogenetic analysis of the Cpt1 gene family reveals three ancestral clades
We began by retrieving annotated and non-annotated CPT1-like protein sequences from genome databases of species representing all major vertebrate lineages (S1 Table). We next performed molecular phylogenetic analysis to address the overall evolutionary relationships of Cpt1 genes. Phylogenetic analyses performed with both sequence alignments one containing gaps (S1 Fig) and the second without gaps (S2 Fig) rendered trees with similar overall topology (Fig 1 and S3A Fig). The inferred ML trees place invertebrate Cpt1 genes outside a monophyletic group containing all vertebrate sequences (Fig 1). The later were divided into three well-supported groups encompassing Cpt1a, Cpt1b, and Cpt1a2/Cpt1c sequences respectively (Fig 1). The Cpt1a and Cpt1b clades were found to include sequences from teleosts, amphibians, coelacanth, birds and reptiles, and mammals. Contrary to previous findings, Cpt1a2 is not unique to teleosts. Orthologues were identified in the X. tropicalis, A. carolinensis, and L. chalumnae (Fig 1). Surprisingly, the mammalian Cpt1c sequences robustly group with the Cpt1a2 clade (see below). Additionally, mammalian Cpt1c orthologues are also apparently the least conserved, as indicated by their longer branch-lengths in the tree (Fig 1). Despite our searches, we were unable to locate an orthologue of Cpt1c in the available avian genomes, also confirmed by others in recent release of various avian genomes [22]. The C. milii Cpt1 gene that is currently annotated as Cpt1a [10], robustly clusters with the Cpt1c group in our analysis (Fig 1).
Fig 1. Molecular phylogenetic analysis of the Cpt1 genes by Maximum Likelihood.

Node values represent branch support using the aBayes algorithm. Accession numbers for all sequences are provided in the S1 Table.
Synteny conservation of Cpt1a and Cpt1b loci
To further clarify the orthology/paralogy relationships of the Cpt1 gene repertoire of the different lineages, we next examined the gene families adjacent to each Cpt1 gene locus in a variety of species (Figs 2 and 3). The Cpt1a locus displays a high degree of synteny conservation. For example, Mtl5 flanks Cpt1a in all of the examined Sarcopterygii species (Fig 2A), with the exception of X. tropicalis whose genome assembly at this locus is still very poor. In the paralogous Cpt1aa and Cpt1ab loci of D. rerio, the gene conservation is less evident, with the vast majority of genes having their H. sapiens orthologues mapping to chromosome 11 but at a distinct genomic region. However, adjacent to the fish Cpt1ab we found a novel gene family which although absent from mammals flanks the L. chalumnae and A. carolinensis Cpt1a orthologue (SIST-binding protein like) (Fig 2A). Comparative synteny statistical analysis was performed for H. sapiens vs A. carolinesis and H. sapiens vs D. rerio (Fig 2B). In both cases we find that the analysed chromosomal segments are orthologous to the corresponding locus in H. sapiens. In D. rerio the analysed chromosomal segment was expanded (gaps< = 100) to accommodate the highly rearranged nature of this locus in D. rerio. However the minimal number of genes was also proportionally increased, to maintain the statistical sensitivity. The analysis was not performed for X. tropicalis given that Cpt1a gene in this species is placed in an independent unplaced scaffold with no information on the neighbouring genes. Additionally, phylogenetic analysis of neighbouring genes Mtl5 and Sits-like, supports the orthology of these sequences across different species (S4 Fig) and thus the common origin of this locus.
Fig 2.

A. Synteny maps of Cpt1a gene loci in selected vertebrate genomes. Chromosome (Chr.) and location in mega base pairs (Mb) is given for the gene of interest in each species. The location of the H. sapiens orthologue is also given for non-conserved neighbouring genes in the other species analysed. Colour code denotes orthology relationships. Red dots indicate end of the chromosome or scaffold. B. Statistical synteny analysis. Reported p-values indicate the probability of identifying non homologous chromosomal segments, and S indicates the size of the chromosomal segment identified.
Fig 3.

A. Synteny maps of Cpt1b in selected vertebrate genomes. Chromosome (Chr.) and position in mega base pairs (Mb) locations are given for the gene of interest in each species. The location of the H. sapiens orthologue is also given for non-conserved neighbouring genes in the other species analysed. Red dots indicate end of the chromosome or scaffold. B. Statistical synteny analysis. Reported p-values indicate the probability of identifying non homologous chromosomal segments, and S indicates the size of the chromosomal segment identified.
The gene composition of the Cpt1b locus also displays some degree of conservation in both Sarcopterygii and Actinopterygii species, except in A. carolinensis and X. tropicalis (Fig 3A). Even though the gene order is not exact, Chkb, Arsa and Shank3 are all found in the proximity of Cpt1b in many of the examined species, providing strong support for their common origin (Fig 3A). Statistical analysis between H. sapiens vs D. rerio Cpt1b locus again indicates that these chromosomal segments are syntenic (Fig 3B). Here, statistical analysis was not performed for A. carolinesis and X. tropicalis given that Cpt1b gene is placed in a small scaffold in A. carolinesis or at the edge of the scaffold in X. tropicalis; in both cases lacking the minimal information regarding neighbouring genes, not allowing a confident statistical analysis of synteny. Additionally phylogenetic analysis of the neighbouring genes Chkb and Arsa, support that this genomic locus shares a common origin in the analysed species (S5 Fig).
Locus composition supports the idea that Cpt1a2 and Cpt1c genes are highly divergent orthologues
Previous reports described a new Cpt1 gene, Cpt1a2, present uniquely in teleost species [5, 9] and suggested Cpt1a2 to result from a duplication event in the teleost ancestor [9]. However, we have found orthologues, on the basis of phylogenetics, in all examined gnathostome species, except birds (Fig 1). To shed light into its evolutionary origin, we proceeded to investigate the Cpt1a2 gene loci composition (Fig 4A). The A. carolinensis gene is flanked by Tsks similarly to L. chalumnae, while Ap2a1 is also found close to Cpt1a2 in all examined species, with the exception of D. rerio Cpt1ca and C. milii Cpt1c (Fig 4A). Nonetheless, we find that neighbouring genes such as Dnaaf3, Kcnc3 (in D. rerio Cpt1ca) and Ntf4 (in C. milii) have their human orthologues localizing to the CPT1C locus, establishing a conserved synteny within the analysed species (Fig 4A). In effect, detailed analysis shows that Cpt1c and Cpt1a2 share a similar locus (Fig 4A), irrespective of the species where they occur. Additionally statistical analysis of Cpt1c locus synteny calculated for H. sapiens vs A. carolinesis, X. tropicalis and D. rerio, resulted in highly significant p-values in all cases (Fig 4B), indicating that these chromosomal segments are orthologous in the analysed species (Fig 4B). Both the phylogenetic and synteny analyses indicate that Cpt1c and Cpt1a2 are most likely highly divergent orthologues. Thus, we propose that Cpt1a2 from non-mammalian species should be renamed to Cpt1c. The occurrence of two genes in teleosts most likely results from the 3R teleost specific genome duplication [23]. In effect, Fam171A2b which flanks the D. rerio Cpt1ca has a teleost specific paralogue localizing to chromosome 3, the locus of origin of Cpt1cb (not shown).
Fig 4. Synteny maps of Cpt1c in selected vertebrate genomes.

Chromosome (Chr.) and position in mega base pairs (Mb) locations are given for the gene of interest in each species. The location of the H. sapiens orthologue is also given for non-conserved neighbouring genes in the other species analysed. Red dots indicate end of the chromosome or scaffold. Mapping data from the C. milii derived from [10]. B- Statistical synteny analysis. Reported p-values indicate the probability of identifying non homologous chromosomal segments, and S indicates the size of the chromosomal segment identified.
Cartilaginous fish have Cpt1a and Cpt1c orthologues
A Cpt1a gene has been recently described in a basal gnathostome, the C. milii [10]. However, both our phylogenetic and synteny analyses suggest that this is a Cpt1c gene (Figs 1 and 4). To clarify the complement of Cpt1 genes in basal vertebrate lineages, we examined the repertoire of Cpt1 genes in the L. erinacea and C. milii. Blast searches to the genome sequence and the transcriptome of both species identified two complete/incomplete Cpt1-like genes in both species. Phylogenetic analysis indicates that L. erinacea has Cpt1a and Cpt1c orthologues (Fig 1). These findings are also confirmed by the analysis of the Cpt1c locus composition in C. milii (Fig 4A) [10]. Careful inspection shows that the gene occurs at a similar genomic location to the H. sapiens Cpt1c (Fig 4A). Additionally phylogenetic analysis of neighbouring genes Tnnt1 and Dnaaf3 (S6 Fig) supports previous statistical analysis indicating that this chromosomal segment is orthologous between H. sapiens and D. rerio and allows us to extend this conclusion to the C. milii Cpt1c locus. Despite intensive searches to the genome sequence of the C. milii, as well as, with degenerate primer PCR in L. erinacea, we failed to isolate Cpt1b orthologues (not shown).
Discussion
The conversion of long chain fatty acids into acylcarnitines, a fundamental step in the transport of long chain fatty acids to the mitochondria for β-oxidation, is catalyzed by CPT1. Thus, this enzyme plays an essential role in energy homeostasis, since it regulates fatty acid import for subsequent oxidation. Here, we set out to reassess the evolutionary history of Cpt1 genes in vertebrate history, paying special attention to a basal gnathostome lineage, the chondrichthyans. These are known to have an unusual energetic metabolism without fatty acid oxidation in both skeletal and cardiac muscle [24]. Additionally, Cpt1c a so-called mammalian specific gene has an unclear origin and function. Several evolutionary models have been put forward to account for the reported Cpt1 gene diversity in vertebrate lineages (Fig 5). Morash and co-workers (2010) proposed that a duplication in the ancestor of both fish and mammals gave rise to the Cpt1a and Cpt1b isoforms [9], (Fig 5 model 1), with a subsequent duplication generating Cpt1a1 and Cpt1a2 isoforms after the divergence of teleost fish; in an alternative scenario the 1a2 isoform was secondarily lost in mammals while retained in teleosts [9]. Extra specific genome duplications that took place in teleosts (e.g. 3R and 4R) would be responsible for the higher number of Cpt1 genes in fish species (e.g. Cpt1a1a and Cpt1a1b) [9]. Nevertheless, this proposal did not address the origin and evolution of the puzzling Cpt1c gene, nor did it provide clear insight into the duplication history of Cpt1a1 and Cpt1a2 genes. So far, Cpt1c has been largely recognized as a mammalian novelty with no orthologues identified in non-mammalian genomes [7, 25]. On the basis of phylogenetics and chromosomal mapping of the G. gallus Cpt1b gene, it was proposed that Cpt1c and Cpt1b emerged in mammalian ancestry from the duplication of a Cpt1b/c gene after the divergence of sauropsids (Fig 5 model 2) [8]. Thus, the sauropsid Cpt1b would be pro-orthologous of mammalian Cpt1b and Cpt1c [8].
Fig 5. Schematic representation of two evolutionary scenarios of Cpt1 genes.
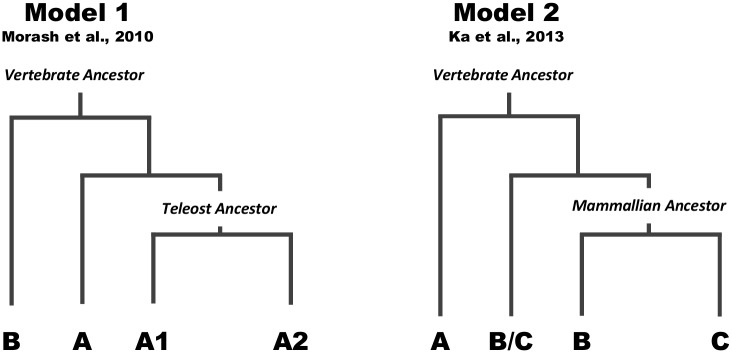
Model 1 derived from Morash et al. 2010 [9], and Model 2 derived from Ka et al. 2013 [8].
We have put these evolutionary scenarios to the test by comprehensively mining the genomes of extant species, representative of major vertebrate lineages, for phylogenetic and synteny analyses, in particular the chondrichthyans for which no information was available. We began by undertaking molecular phylogenetics and the recovered tree topology identified three well-supported groups (Cpt1a, Cpt1b, and Cpt1c/Cpt1a2) in contrast to previous reports [5, 8, 9]. We also found that Cpt1a was present in all of the examined lineages, with its origin dating to the vertebrate ancestor. Interestingly, the gene previously designated as Cpt1a in the C. milii fails to group here, and instead is part of the Cpt1c/1a2 group. In addition, we were able to identify a Cpt1a orthologue in a cartilaginous species.
We found that, in phylogenetic trees, mammalian Cpt1c genes branch together with the previously designated Cpt1a2 genes, but with longer branch lengths. Thus, Cpt1c could be a highly divergent Cpt1 gene without any counterpart in non-mammalian species, or a divergent orthologue of a described Cpt1 gene. To test these possibilities we examined the synteny of Cpt1 gene loci. Cpt1a and Cpt1b loci are conserved across the tested species, a clear indication that they emerged early in vertebrate evolution. Strikingly, we also found that mammalian Cpt1c and non-mammalian Cpt1a2 have a similar loci composition, again suggesting that they are highly divergent orthologues. Our analysis allowed the simultaneous clarification of the origin of both mammalian Cpt1c and non-mammalian Cpt1a2.
Cpt1a and Cpt1b are located in genomic regions related by genome duplications in vertebrate ancestry, the so-called 2R WGD (Fig 6A) [26, 27]. Interestingly, the genomic region harbouring Cpt1c is part of the same linkage group [10, 26]. In this context, we put forward a model that includes the duplication of a single copy Cpt1 gene in the ancestor of vertebrates as a result of 2R, with the retention of 3 genes and the loss of a fourth paralogue (Fig 6B). This gene complement expanded in teleosts with the lineage independent genome duplications, 3R and 4R. Based on the present data we suggest that after the divergence of sauropsids, Cpt1c underwent an accelerated rate of evolution and functional divergence in mammals (Fig 6B). Consequently, despite the common origin, mammalian Cpt1c has most likely acquired a novel function after the divergence of sauropsids. In effect, the information currently available indicates that the mammalian CPT1C function and biology is rather unique. In contrast to other CPT1 enzymes it does not localize to mitochondria but to the ER [28]. Regardless of its function, it is clear that mammalian CPT1C does not mediate mitochondrial transport of long chain fatty acids. In fact, given its oxygen demand, generation of toxic oxidative by-products and slow rate of ATP production, the brain does not rely on mitochondrial fatty acid β-oxidation, favouring glucose and liver-derived ketone bodies as source of energy [29]. Given the striking divergence of mammalian CPT1C, in both its N-terminal domain, suggested to determine protein localization and regulate activity, and C-terminal catalytic domain [30, 31], further studies are needed to elucidate their molecular function.
Fig 6. Linkage group of Cpt1 genes upon genome duplications of the ancestral proto-chromosome D (details from Nakatani et al. (19) (A), and the proposed evolutionary model of the Cpt1 gene family in vertebrates (B).

WGD–whole genome duplication.
Our results also strongly suggest that Cpt1 gene retention after 2R varied in different lineages, similar to what has been described for other gene families [26, 32, 33]. For example, we were unable to find an orthologue of Cpt1c in birds and Cpt1b in chondrichthyans. Strikingly, the absence of Cpt1b, the “muscle isoform”, directly correlates with the use of ketone bodies and not fatty acids as oxidative fuels in muscle of elasmobranches [24]. If confirmed, the uncommon muscle energy metabolism elasmobranch fishes would be linked to a single event of gene loss.
Conclusion
Our approach has provided additional clarification on the evolution of Cpt1 genes and shows that the mammalian Cpt1c is probably a rapidly evolving orthologue of Cpt1a2 in non-mammalian vertebrates. We propose that Cpt1a, Cpt1b and Cpt1c emerged in vertebrate ancestry as the result of genome duplications. Cpt1c is not a mammalian innovation (though its function probably is) since synteny and phylogenetics shows that divergent orthologues can be found in other classes. We suggest that differential loss, extra lineage-specific duplications, and an accelerated rate of sequence divergence have all modelled the history of the Cpt1 gene family in vertebrates, with consequences in energy metabolism.
Supporting Information
(PDF)
(PDF)
—Maximum likelihood phylogeny (gap alignment) using aBayes for branch support (Figure A), Maximum likelihood phylogeny with 1000 bootstraps replicates (Figure B), Bayesian Phylogenetic analysis (Figure C) and Phylogenetic analysis using Neighbor-Joining method (Figure D).
(PDF)
(PDF)
(PDF)
(PDF)
(PDF)
Data Availability
All relevant data are within the paper and its Supporting Information files.
Funding Statement
The authors received no specific funding for this work.
References
- 1. Bonnefont JP, Djouadi F, Prip-Buus C, Gobin S, Munnich A, Bastin J. Carnitine palmitoyltransferases 1 and 2: biochemical, molecular and medical aspects. Mol Aspects Med. 2004;25(5–6):495–520. Epub 2004/09/15. [DOI] [PubMed] [Google Scholar]
- 2. Wolfgang MJ, Kurama T, Dai Y, Suwa A, Asaumi M, Matsumoto S, et al. The brain-specific carnitine palmitoyltransferase-1c regulates energy homeostasis. Proc Natl Acad Sci U S A. 2006;103(19):7282–7. Epub 2006/05/03. [DOI] [PMC free article] [PubMed] [Google Scholar]
- 3. Esser V, Brown NF, Cowan AT, Foster DW, McGarry JD. Expression of a cDNA isolated from rat brown adipose tissue and heart identifies the product as the muscle isoform of carnitine palmitoyltransferase I (M-CPT I). M-CPT I is the predominant CPT I isoform expressed in both white (epididymal) and brown adipocytes. J Biol Chem. 1996;271(12):6972–7. [DOI] [PubMed] [Google Scholar]
- 4. van der Leij FR, Huijkman NC, Boomsma C, Kuipers JR, Bartelds B. Genomics of the human carnitine acyltransferase genes. Mol Genet Metab. 2000;71(1–2):139–53. [DOI] [PubMed] [Google Scholar]
- 5. Boukouvala E, Leaver MJ, Favre-Krey L, Theodoridou M, Krey G. Molecular characterization of a gilthead sea bream (Sparus aurata) muscle tissue cDNA for carnitine palmitoyltransferase 1B (CPT1B). Comp Biochem Physiol Biochem Mol Biol. 2010;157(2):189–97. Epub 2010/07/06. [DOI] [PubMed] [Google Scholar]
- 6. Britton CH, Schultz RA, Zhang B, Esser V, Foster DW, McGarry JD. Human liver mitochondrial carnitine palmitoyltransferase I: characterization of its cDNA and chromosomal localization and partial analysis of the gene. Proc Natl Acad Sci U S A. 1995;92(6):1984–8. Epub 1995/03/14. [DOI] [PMC free article] [PubMed] [Google Scholar]
- 7. Price NT, van der Leij FR, Jackson VN, Corstorphine CG, Thomson R, Sorensen A, et al. A Novel Brain-Expressed Protein Related to Carnitine Palmitoyltransferase I. Genomics. 2002;80(4):433–42. [DOI] [PubMed] [Google Scholar]
- 8. Ka S, Markljung E, Ring H, Albert FW, Harun-Or-Rashid M, Wahlberg P, et al. Expression of carnitine palmitoyl-CoA transferase-1B is influenced by a cis-acting eQTL in two chicken lines selected for high and low body weight. Physiol Genomics. 2013. 2013-May-01 00:00:00. 367–76 p. 10.1152/physiolgenomics.00078.2012 [DOI] [PubMed] [Google Scholar]
- 9. Morash AJ, Le Moine CMR, McClelland GB. Genome duplication events have led to a diversification in the CPT I gene family in fish. Am J Physiol Regul Integr Comp Physiol. 2010;299(2):R579–89. 10.1152/ajpregu.00088.2010 [DOI] [PubMed] [Google Scholar]
- 10. Ravi V, Bhatia S, Gautier P, Loosli F, Tay B-H, Tay A, et al. Sequencing of Pax6 loci from the elephant shark reveals a family of Pax6 genes in vertebrate genomes, forged by ancient duplications and divergences. PLoS Genet. 2013;9(1):e1003177 10.1371/journal.pgen.1003177 [DOI] [PMC free article] [PubMed] [Google Scholar]
- 11. Skiba-Cassy S, Collin A, Chartrin P, Medale F, Simon J, Duclos MJ, et al. Chicken liver and muscle carnitine palmitoyltransferase 1: nutritional regulation of messengers. Comp Biochem Physiol B Biochem Mol Biol. 2007;147(2):278–87. [DOI] [PubMed] [Google Scholar]
- 12. Lee J, Wolfgang MJ. Metabolomic profiling reveals a role for CPT1c in neuronal oxidative metabolism. BMC biochem. 2012;13:23 Epub 2012/10/27. 10.1186/1471-2091-13-23 [DOI] [PMC free article] [PubMed] [Google Scholar]
- 13. Wang Q, Arighi CN, King BL, Polson SW, Vincent J, Chen C, et al. Community annotation and bioinformatics workforce development in concert—Little Skate Genome Annotation Workshops and Jamborees. Database. 2012;2012. [DOI] [PMC free article] [PubMed] [Google Scholar]
- 14. Katoh K, Toh H. Recent developments in the MAFFT multiple sequence alignment program. Brief Bioinform. 2008;9(4):286–98. Epub 2008/03/29. 10.1093/bib/bbn013 [DOI] [PubMed] [Google Scholar]
- 15. Hall T. A. BioEdit: a user-friendly biological sequence alignment editor and analysis program for Windows 95/98/NT Nucleic Acids Symp Ser. Vol. 41 (1999), pp. 95–98. [Google Scholar]
- 16. Abascal F, Zardoya R, Posada D. ProtTest: selection of best-fit models of protein evolution. Bioinformatics. 2005;21(9):2104–5. Epub 2005/01/14. [DOI] [PubMed] [Google Scholar]
- 17. Guindon S, Dufayard JF, Lefort V, Anisimova M, Hordijk W, Gascuel O. New algorithms and methods to estimate maximum-likelihood phylogenies: assessing the performance of PhyML 3.0. Syst Biol. 2010;59(3):307–21. Epub 2010/06/09. 10.1093/sysbio/syq010 [DOI] [PubMed] [Google Scholar]
- 18. Anisimova M, Gil M, Dufayard JF, Dessimoz C, Gascuel O. Survey of branch support methods demonstrates accuracy, power, and robustness of fast likelihood-based approximation schemes. Syst Biol. 2011;60(5):685–99. Epub 2011/05/05. 10.1093/sysbio/syr041 [DOI] [PMC free article] [PubMed] [Google Scholar]
- 19. Nakatani Y, Takeda H, Kohara Y, Morishita S. Reconstruction of the vertebrate ancestral genome reveals dynamic genome reorganization in early vertebrates. Genome Res. 2007;17(9):1254–1265. 10.1101/gr.6316407 [DOI] [PMC free article] [PubMed] [Google Scholar]
- 20. Wang Z, Ding GH, Yu ZH, Liu L, Li YX (2009) CHSMiner: a GUI tool to identify chromosomal homologous segments. Algorithms Mol Biol 4: 2 10.1186/1748-7188-4-2 [DOI] [PMC free article] [PubMed] [Google Scholar]
- 21. Rozen S, Skaletsky H. Primer3 on the WWW for general users and for biologist programmers. Methods Mol Biol. 2000;132:365–86. Epub 1999/11/05. [DOI] [PubMed] [Google Scholar]
- 22. Lovell P, Wirthlin M, Wilhelm L, Minx P, Lazar N, Carbone L, et al. Conserved syntenic clusters of protein coding genes are missing in birds. Genome Biol. 2014;15(12):565 [DOI] [PMC free article] [PubMed] [Google Scholar]
- 23. Jaillon O, Aury J-M, Brunet F, Petit J-L, Stange-Thomann N, Mauceli E, et al. Genome duplication in the teleost fish Tetraodon nigroviridis reveals the early vertebrate proto-karyotype. Nature. 2004;431(7011):946–57. [DOI] [PubMed] [Google Scholar]
- 24. Speers-Roesch B, Treberg JR. The unusual energy metabolism of elasmobranch fishes. Comp Biochem Physiol A Mol Integr Physiol. 2010;155(4):417–34. 10.1016/j.cbpa.2009.09.031 [DOI] [PubMed] [Google Scholar]
- 25. Wolfgang MJ, Cha SH, Millington DS, Cline G, Shulman GI, Suwa A, et al. Brain-specific carnitine palmitoyltransferase-1C: role in CNS fatty acid metabolism, food intake and body weight. J Neurochem. 2008;105(4):1550–9. 10.1111/j.1471-4159.2008.05255.x [DOI] [PMC free article] [PubMed] [Google Scholar]
- 26. Feiner N, Meyer A, Kuraku S. Evolution of the vertebrate Pax4/6 class of genes with focus on its novel member, the Pax10 gene. Genome Biol Evol. 2014;6(7):1635–51. Epub 2014/06/22. 10.1093/gbe/evu135 [DOI] [PMC free article] [PubMed] [Google Scholar]
- 27. Lundin L-G, Larhammar D, Hallböök F. Numerous groups of chromosomal regional paralogies strongly indicate two genome doublings at the root of the vertebrates In: Meyer A, Van de Peer Y, editors. Genome Evolution: Springer; Netherlands; 2003. p. 53–63. [PubMed] [Google Scholar]
- 28. Sierra AY, Gratacos E, Carrasco P, Clotet J, Urena J, Serra D, et al. CPT1c is localized in endoplasmic reticulum of neurons and has carnitine palmitoyltransferase activity. J Biol Chem. 2008;283(11):6878–85. 10.1074/jbc.M707965200 [DOI] [PubMed] [Google Scholar]
- 29. Schonfeld P, Reiser G. Why does brain metabolism not favor burning of fatty acids to provide energy? Reflections on disadvantages of the use of free fatty acids as fuel for brain. J Cereb Blood Flow Metab. 2013;33(10):1493–9. 10.1038/jcbfm.2013.128 [DOI] [PMC free article] [PubMed] [Google Scholar]
- 30. Cohen I, Guillerault F, Girard J, Prip-Buus C. The N-terminal domain of rat liver carnitine palmitoyltransferase 1 contains an internal mitochondrial import signal and residues essential for folding of its C-terminal catalytic domain. J Biol Chem. 2001;276(7):5403–11. Epub 2000/11/23. [DOI] [PubMed] [Google Scholar]
- 31. Samanta S, Situ AJ, Ulmer TS. Structural characterization of the regulatory domain of brain carnitine palmitoyltransferase 1. Biopolymers. 2014;101(4):398–405. 10.1002/bip.22396 [DOI] [PMC free article] [PubMed] [Google Scholar]
- 32. Castro LF, Lopes-Marques M, Wilson JM, Rocha E, Reis-Henriques MA, Santos MM, et al. A novel Acetyl-CoA synthetase short-chain subfamily member 1 (Acss1) gene indicates a dynamic history of paralogue retention and loss in vertebrates. Gene. 2012;497(2):249–55. Epub 2012/02/09. 10.1016/j.gene.2012.01.013 [DOI] [PubMed] [Google Scholar]
- 33. Mulley JF, Holland PWH. Parallel retention of Pdx2 genes in cartilaginous fish and coelacanths. Mol Biol Evol. 2010;27(10):2386–91. 10.1093/molbev/msq121 [DOI] [PMC free article] [PubMed] [Google Scholar]
Associated Data
This section collects any data citations, data availability statements, or supplementary materials included in this article.
Supplementary Materials
(PDF)
(PDF)
—Maximum likelihood phylogeny (gap alignment) using aBayes for branch support (Figure A), Maximum likelihood phylogeny with 1000 bootstraps replicates (Figure B), Bayesian Phylogenetic analysis (Figure C) and Phylogenetic analysis using Neighbor-Joining method (Figure D).
(PDF)
(PDF)
(PDF)
(PDF)
(PDF)
Data Availability Statement
All relevant data are within the paper and its Supporting Information files.