

Abstract
Variations in home characteristics, such as moisture and occupancy, affect indoor microbial ecology as well as human exposure to microorganisms. Our objective was to determine how indoor bacterial and fungal community structure and diversity are associated with the broader home environment and its occupants. Next-generation DNA sequencing was used to describe fungal and bacterial communities in house dust sampled from 198 homes of asthmatic children in southern New England. Housing characteristics included number of people/children, level of urbanization, single/multifamily home, reported mold, reported water leaks, air conditioning (AC) use, and presence of pets. Both fungal and bacterial community structure were non-random and demonstrated species segregation (C-score, p<0.00001). Increased microbial richness was associated with the presence of pets, water leaks, longer AC use, suburban (vs. urban) homes, and dust composition measures (p<0.05). The most significant differences in community composition were observed for AC use and occupancy (people, children, and pets) characteristics. Occupant density measures were associated with beneficial bacterial taxa, including Lactobacillus johnsonii as measured by qPCR. A more complete knowledge of indoor microbial communities is useful for linking housing characteristics to human health outcomes. Microbial assemblies in house dust result, in part, from the building’s physical and occupant characteristics.
Introduction
There are currently 6.8 million children in the United States and 300 million people worldwide with asthma (Bloom et al., 2013; Masoli et al., 2004). Asthma severity can be affected by microbes, with significant exposure occurring indoors where humans spend nearly 90% of their time (Klepeis et al., 2001). Exposure to allergenic fungi in homes has been associated with exacerbation of current asthma symptoms by 36–48% (Sharpe et al., 2015).
Microbial exposure may also influence the development of allergies and asthma. Exposure to low fungal and bacterial richness in house dust is associated with an increased risk of asthma development (Ege et al., 2011; Dannemiller et al., 2014a). Asthma and allergy have been linked with low richness within the fungal genera Cryptococcus in house dust (Dannemiller et al., 2014a) and low richness of skin-associated Gammaproteobacteria (Hanski et al., 2012). Aerosol exposure to Acinetobacter and ingestion of Lactobacillus spp., especially Lactobacillus johnsonii, may provide a protective effect in the development of these diseases (Ege et al., 2012; Chen et al., 2010; Debarry et al., 2010; Fujimura et al., 2014; Fyhrquist et al., 2014).
While microbes in house dust originate from both occupants and the outdoor environment, the relative strength of these sources is controlled by building design, operation, ventilation, and occupancy levels (Hospodsky et al., 2012; Qian et al., 2012; Kembel et al., 2012; Kembel et al., 2014; Meadow et al., 2014). Indoor microbial communities are influenced by building location (Adams et al., 2013a; Adams et al., 2013b; Amend et al., 2010), surface types (Dunn et al., 2013), and the presence of excess moisture (Dannemiller et al., 2014a). Eventually, homes might be designed to better prevent exposure to pathogens and allergens, while promoting the presence of microbial communities that are beneficial to human health (Green, 2014).
In the present analysis, we demonstrate associations between microbial communities and housing characteristics in homes of asthmatic children. Our sample size is large relative to previous sequencing studies and examines a novel set of housing characteristics. We measured fungal taxa and bacterial operational taxonomic units (OTUs) using next-generation DNA sequencing in 198 homes from Connecticut and Massachusetts, USA. The housing characteristics considered herein have been previously associated with human health outcomes. These characteristics include the number of people and children in the home (Strachan et al., 1989, Hesselmar et al., 1999), level of urbanization (Ege et al., 2011; Yemaneberhan et al., 1997), single or multifamily homes (Belanger et al., 2006), visible mold (Mendell et al., 2011; Fisk et al., 2007), water leaks (Mendell et al., 2011; Fisk et al., 2007), air conditioning use (Zock et al., 2002), presence of pets (Hesselmar et al., 1999), and concentrations of bulk house dust fungi, bacteria, human cells, dog cells, endotoxin, and (1–3)-β-D-glucan (Shendell et al., 2012; Thorne et al., 2005). Results allow for more detailed qualitative and quantitative descriptions of microbial taxa and diversity in homes, identification of housing characteristics that influence potentially health-relevant microbial taxa and diversity, and hypothesis generation for possible ecological processes in homes that determine fungal and bacterial community assembly.
Methods
Detailed methods are available online in the Supporting Information.
Study and dust collection
Between 2006–2009, children with asthma were recruited from southern New England for a prospective, one-year follow-up study of school-aged children (Gent et al., 2012, Belanger et al., 2013). From 1401 participating families, 198 homes sampled May-October were selected for inclusion in the present analysis. Two samples were excluded due to DNA amplification failure (n=196 homes). The geographic distribution of the sampled homes is shown in Figure S1. There were 12 (6%) samples collected in 2006, 111 (57%) in 2007, and 73 (37%) in 2008. Of the included samples, 100 (51%) were collected in May–June, 52 (27%) in July–August, and 44 (22%) in September–October. Approval for this study was obtained from the Human Investigation Committee of Yale University and all participants provided informed consent.
Home visit and dust collection
Samples and home metadata from occupant interviews were collected during a home visit at the time of enrollment. Questions from the home interview included demographic information (race, gender, etc.) and information about the home (reported pests, pets, smoking, presence of mold or water leaks, etc.). Residents were asked to report the number of people and the number of children under the age of 18 years residing in the home. Mold and water leaks in the home were reported by the resident. Residents reported whether they live in a single family home (no other attached units) or a multifamily home, if they keeps pets (cats, dogs, rodents, or birds) in their home, and if they use air conditioning (AC) during the summer months and for what period of time. Urban locations were defined in areas including less than 45% single family homes and suburban locations were defined in areas including at least 45% single family homes.
During the home visit, dust was collected from surfaces within the main living area using a Eureka Mighty Mite vacuum (Eureka Co., Bloomington, IL, USA) fitted with a 19 × 90 mm Whatman cellulose extraction thimble (Whatman, Inc., Tewkesbury, MA, USA). Dust was sampled using a standardized protocol that prescribed a 3-minute collection of sample from an exposed seat cushion, seat back and arms of a couch or chair in addition to a 1 m2 section of floor for 2 minutes (Belanger et al., 2003; Leaderer et al., 2002; Belanger et al., 2013; Gent et al., 2012). Floor surface types included all smooth floors (33%), all carpeted floors (43%), or a combination of smooth floor and carpet (23%). Dust was stored at −80 °C prior to analysis.
DNA extraction and sequencing
Dust was sieved to <300 μm and 50 mg aliquots were used for DNA extraction in a sterile, laminar flow hood using the MoBio PowerSoil kit (MoBio, Carlsbad, CA, USA) modified by adding additional glass beads and lysing cells on a bead beater (Yamamoto et al., 2012). Testing of spiked samples revealed no PCR inhibition. For fungi, taxonomic libraries were prepared using ITS1F and ITS4 primers (Manter et al., 2007; Larena et al., 1999) to amplify the internal transcribed spacer (ITS) region (Dannemiller et al., 2014a) and samples were sequenced using the 454 GS FLX Titanium DNA sequencing platform (454 Life Sciences, Branford, CT, USA). Sequences were archived in the European Nucleotide Archive (accession numbers ERP005149, ERP002369). For bacteria, the V4 region of 16S rRNA was sequenced using 515F/806R primers (Caporaso et al., 2011). Library preparation and sequencing was conducted at Research and Testing Laboratory (Lubbock, TX, USA) in accordance with manufacturer instructions on an Ion Torrent™ Personal Genome Machine® with an Ion 318™ chip kit v2 using 400-base chemistry. Ion Torrent produces microbial community profiles that are consistent with results from denoised 454 pyrosequencing (Yergeau et al., 2012). Sequences were archived in the European Nucleotide Archive (accession number ERP005148).
We measured total fungal, bacterial, human, dog, and Lactobacillus johnsonii cell concentration per gram of dust by quantitative PCR. L. johnsonii was selected for specific qPCR targeting because it has been shown to be relevant to allergic disease (Fujimura et al., 2014) and next generation-based sequencing cannot identify bacterial operational taxonomic units (OTUs) to the rank of species. The microbial agents endotoxin and (1–3)-β-D-glucan were also measured (see Supporting Information).
DNA sequence analysis
For diversity analysis of fungal data, QIIME, version 1.7 (Caporaso et al., 2010) was used for quality trimming, denoising, and clustering at 97% similarity (Dannemiller et al., 2014a). For α diversity and rarefaction analysis, the OTU table was trimmed to 450 reads per sample. For β diversity and principal coordinate analysis (PCoA), Morisita Horn (Horn, 1966) (non-phylogenetic) distance was calculated from all quality-trimmed reads for analysis of similarity (ANOSIM, available through QIIME) to determine the statistical significance of clustering. The Morisita Horn distance matrix was also used to determine which housing characteristics are associated with increased similarities in communities. FHiTINGS, version 1.1 (Dannemiller et al., 2013) was used for taxonomic assignment of fungi using the appropriate database (Nilsson et al., 2009), as described previously (Dannemiller et al., 2014a).
Analysis of bacterial sequences began with a quality trimming pipeline performed at the sequencing core lab (Research and Testing Labs, Lubbock, TX, USA). Read analysis was then performed in QIIME, version 1.7 (Caporaso et al., 2010). Sequences were clustered at 97% similarity, aligned using PyNAST against the GreenGenes core set (McDonald et al., 2012), and phylogenetic assignments were made using the Ribosomal Database Project classifier in QIIME. Bacterial taxa are referred to as OTUs (as opposed to species) due to the clustering. Bacterial rarefaction curves and richness were assessed based on the number of observed OTUs in 2500 sequences per sample. For bacterial β diversity analysis, comparisons between samples were performed using both unweighted and weighted Unifrac distance (Lozupone et al., 2005). All figures display unweighted Unifrac distance for simplicity, and weighted and unweighted Unifrac values are reported in tables.
EcoSim version 7.71 (Gotelli et al., 2004) was used to study co-occurrence of species using the C-score (Stone et al., 1990) to indicate species segregation or aggregation. In this measure, the number of checkerboard units (Diamond et al., 1975) (samples where the species are not found together) are calculated for each species pair, and these values are combined to calculate the overall C-score for the entire dataset. This value is then compared to random simulations. If the C-score is statistically significantly different than the expected value, a high C-score indicates species segregation while a low C-score indicates aggregation. This calculation was conducted separately for fungi and bacteria, and all default settings were used on presence/absence tables. Fungi were limited to species identifications with at least 20 sequences among all samples, and bacteria were limited to OTUs with at least 50 sequences among all samples.
Statistical analysis
SAS, version 9.2 (SAS Institute, Inc., Cary, NC, USA) was used to compare microbial diversity and taxa to housing variables. Housing characteristics considered included number of people in the home, number of children in the home, level of urbanization (suburban vs. urban), house type (single vs. multifamily), reported visible mold, reported water leaks, air conditioning (AC) use (yes/no and length of time used), and presence of pets. Variables were dichotomous, and number of people and children were also considered as categorical values. Homes with missing values were excluded only from the specific analysis for which the value was missing (mold n = 2, water leaks n = 4). Correlated housing characteristics (i.e., suburban location with single family homes and with pet ownership) were not relevant to any of the adjusted statistical models. We tested for associations between individual housing characteristics and the following microbial community features: fungal and bacterial richness (number of OTUs per sample), differences between microbial communities (ANOSIM analysis in QIIME), Morisita Horn or unweighted Unifrac distances, and taxonomic identifications. A two-sample t-test was used to compare richness in different categories to each other and in the distance matrix comparison to compare each category to the reference. For the distance matrix comparison, homes sharing a characteristic (such as suburban location) with statistically significantly lower mean distance than the reference value had increased community similarity.
To determine associations of housing characteristics with specific taxa, the relative abundance derived from the next-generation sequencing data was multiplied by the concentration of either total fungi or bacteria per gram of dust measured by qPCR in order to allow for comparisons of absolute concentrations (Dannemiller et al., 2014b). These values were then dichotomized at the 75th percentile to define high and low values. Microbial agents endotoxin and (1–3)-β-D-glucan were also dichotomized at the 75th percentile to characterize high exposures, and at that level the endotoxin concentration was 0.44 EU/mg dust and the (1–3)-β-D-glucan concentration was 178 μg/g dust. The MULTTEST procedure in SAS was used (pfdr option) to calculate the q-value (Storey et al., 2003). The q-value is a modified p-value adjusted for multiple comparisons, and in these cases statistical significance was defined as p<0.05 and q<0.05. Linear regression analysis was used to compare fungal and bacterial richness using the REG procedure in SAS.
Results
Overview
After quality trimming, 158,528 fungal sequences were included in the analysis. There were 507 non-ambiguous fungal species identified with at least 20 sequences among all samples. The most abundant fungal species overall were Leptosphaerulina chartarum, Epicoccum nigrum, and Wallemia sebi. Over 1.8 million bacterial sequences were retained for this analysis after quality trimming. A total of 2,690 bacterial OTUs had at least 50 sequences per OTU for inclusion in the taxonomic analyses. The most abundant bacterial OTUs by number of sequences were in the human-associated families Staphylococcaceae, Streptococcaceae, and Corynebacteriaceae.
Rarefaction curves for fungi and bacteria (Figure 1 A,B) show a wide range of richness in the house dust samples. Mean (SD) fungal richness was 93 (40) OTUs per 450 sequences (range 5–197), and mean (SD) bacterial richness was 734 (201) OTUs per 2,500 sequences (range 184–1,259). There was a weak correlation between fungal and bacterial richness in the same sample (R=0.30, p=0.0002) (Figure 1 C).
Figure 1.
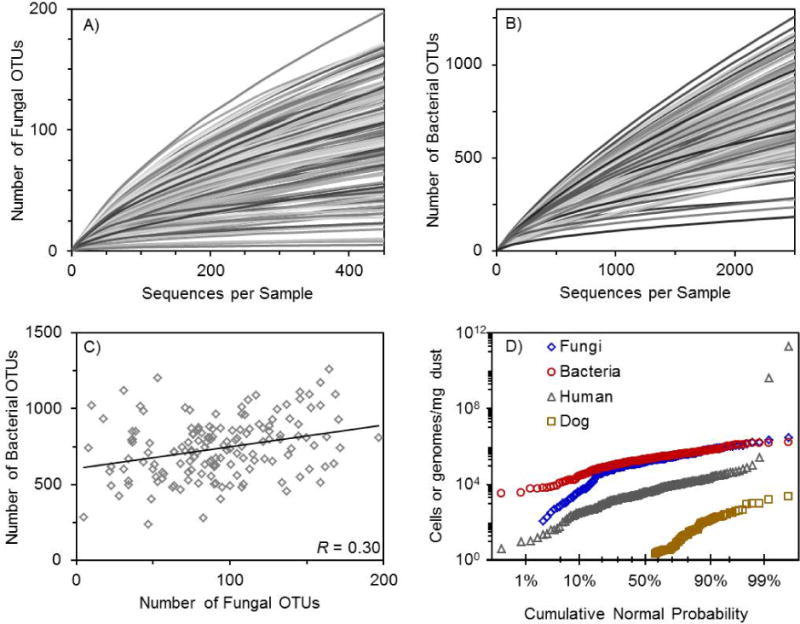
A,B,C,D. Rarefaction curves for (A) fungi and (B) bacteria, (C) a comparison of fungal and bacterial richness, and (D) dust composition analysis for total concentration of bacteria, fungi, human, and dog (Canis lupus familiaris) cells. (A,B) Lines are randomly displayed in various shades of gray for improved visualization. (A,B,C) Fungi were normalized to 450 sequences per sample and bacteria were normalized to 2500 sequences per sample prior to analysis. (C) R = 0.30, p = 0.0002.
Based on the C-score, both fungi and bacteria in house dust demonstrate segregation, indicating that there is statistically significantly less co-occurrence than expected by chance (p<0.00001, Table S1). Thus, community structure in house dust is non-random. In the following paragraphs, we further explore dependence on housing characteristics and dust composition.
Microbial richness and home characteristics
Microbial richness was associated with the presence of pets, urbanization, reported water leaks, and length of AC use. The presence of pets was associated with a significant increase in both fungal and bacterial richness, and homes located in suburban areas had more bacterial richness than urban homes (Table 1).
Table 1.
Richness analysis of housing characteristics for fungi and bacteria. Associations with p < 0.05 are in bold.
| Category | n (Yes) | Mean number of Fungal OTUs | Mean number of Bacterial OTUs | ||||
|---|---|---|---|---|---|---|---|
| Yes | No | p-value | Yes | No | p-value | ||
| More than 5 people in home | 49 | 95.7 | 91.8 | 0.59 | 735 | 735 | 0.91 |
| More than 3 children in home | 87 | 96.6 | 91.8 | 0.54 | 701 | 743 | 0.26 |
| Urban home (vs. Suburban) | 112 | 90.1 | 96.2 | 0.33 | 707 | 772 | 0.031 |
| Single family (vs. Multifamily) | 94 | 92.8 | 92.6 | 0.98 | 755 | 717 | 0.22 |
| Mold | 85 | 94.0 | 91.8 | 0.73 | 738 | 728 | 0.75 |
| Water leaks | 80 | 102 | 86.6 | 0.017 | 729 | 740 | 0.73 |
| AC use (yes or no) | 178 | 92.6 | 94.4 | 0.86 | 737 | 712 | 0.63 |
| AC use (more than 2 months)* | 105 | 86.6 | 102.4 | 0.021 | 730 | 757 | 0.40 |
| Pets | 85 | 101 | 86.2 | 0.015 | 772 | 704 | 0.024 |
excludes homes with no AC use
“Yes” and “no” refer to the category, i.e., for pets, “yes” homes had pets and “no” homes did not have pets.
Increased fungal richness was also associated with factors related to increased moisture. Reported water leaks in a home was significantly associated with an increased number of house dust fungal OTUs, as seen previously (Dannemiller et al., 2014a; Pitkäranta et al., 2011). The intermittent use of AC during summer months can affect ventilation, temperature, and humidity, but was not associated with fungal or bacterial richness. However, among homes with AC use, operation for more than 2 months per year was associated with decreased fungal richness (Table 1).
Microbial community structure and home characteristics
Two methods were used to explore how housing characteristics influenced the population structure of microbial communities. First, β diversity distance measures using principal coordinate analysis (PCoA) and the ANOSIM statistical test were used to determine if differences exist between different sets of microbial communities. This method reveals “between community differences.” Using this test, the PCoA graphs in Figures S2 and summarized in Table 2 show the housing factors that are associated with differences in microbial communities. Comparable PCoA graphs for fungi are not shown because of an arch distortion (Gauch et al., 1977). Second, the phylogenetic or taxonomic distance within a group (for example, homes with pets) was compared with distances between groups (for example, homes with pets compared to homes without pets) to determine if the specific home characteristic drives the similarity of microbial communities. This method reveals “within community composition.” If mean distance is lower within a group (bars in bar graphs, Figures 2,3) compared to the distance between groups (solid lines in bar graphs), then there is low variation in community composition (communities are similar) among homes with that characteristic.
Table 2.
Community analysis of housing characteristics for fungi and bacteria corresponding to the PCoA plots in Figures 2,S2. ANOSIM p-values and test statistics (R) are reported, and associations with p < 0.05 are in bold.
| Category | Fungi | Bacteria | Bacteria | |||
|---|---|---|---|---|---|---|
| Morisita Horn | Unweighted Unifrac | Weighted Unifrac | ||||
| p-value | R | p-value | R | p-value | R | |
| Number of people in home* | 0.0049 | 0.08 | 0.28 | 0.02 | 0.1 | 0.04 |
| Number of children in home* | 0.028 | 0.10 | 0.76 | −0.02 | 0.075 | 0.04 |
| Urban home (vs. Suburban) | 0.33 | 0.01 | 0.03 | 0.03 | 0.065 | 0.02 |
| Single family (vs. Multifamily) | 0.0008 | 0.03 | 0.0001 | 0.06 | 0.0001 | 0.05 |
| Mold | 0.019 | 0.03 | 0.19 | 0.01 | 0.71 | −0.01 |
| Water leaks | 0.59 | −0.01 | 0.49 | 0.00 | 0.69 | −0.01 |
| AC use (yes or no) | 0.0002 | 0.30 | 0.23 | 0.05 | 0.18 | 0.07 |
| AC use (more than 2 months)** | 0.74 | −0.01 | 0.71 | −0.01 | 0.56 | 0.00 |
| Pets | 0.0012 | 0.07 | 0.047 | 0.02 | 0.012 | 0.03 |
categorical variables (not dichotomous)
excludes homes with no AC use
Figure 2.
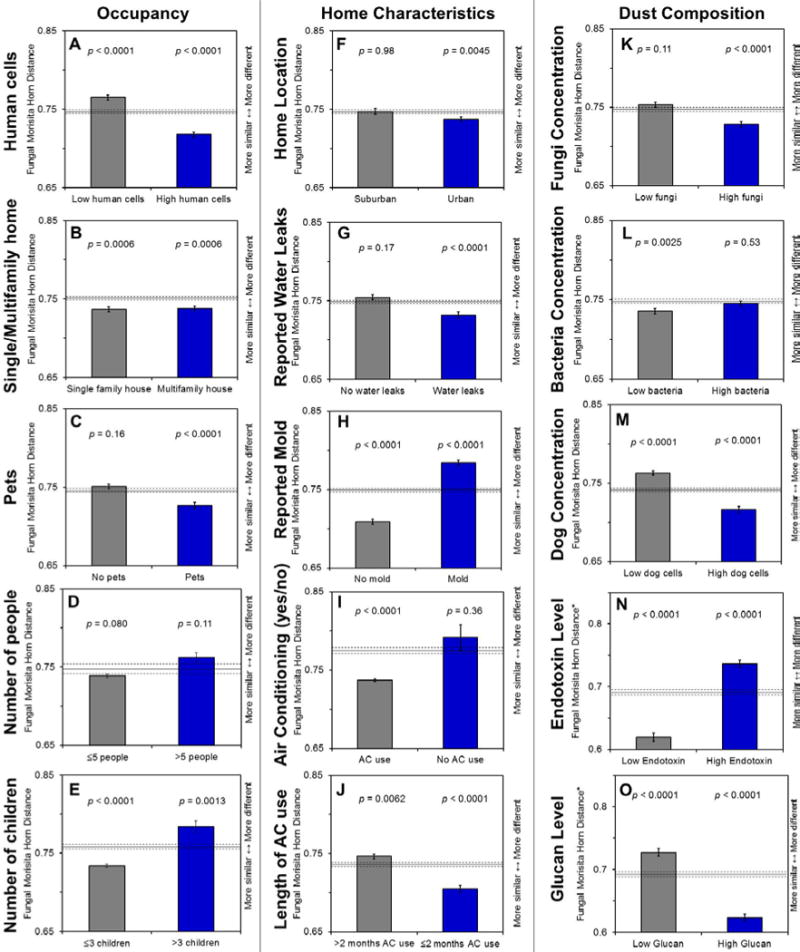
A–O. Morisita Horn distance comparison for fungi for occupancy, housing characteristics, and dust composition measures. The p-values on bar graphs compare the within group average (represented by the bar) to the between group average (represented by the solid line). Error bars and dotted lines represent standard error. Bars significantly below the solid line indicate low variation in community composition (more similar communities).
Figure 3.
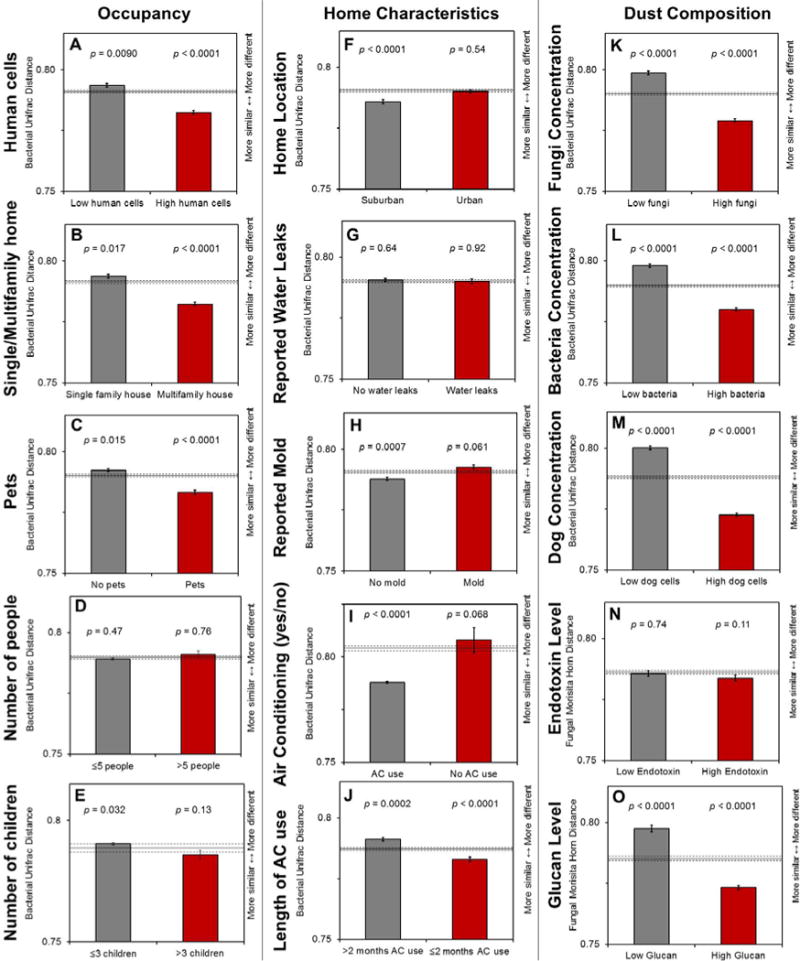
A–O. Unweighted Unifrac distance comparison for bacteria for occupancy, housing characteristics, and dust composition measures. The p-values on bar graphs compare the within group average (represented by the bar) to the between group average (represented by the solid line). Error bars and dotted lines represent standard error. Bars significantly below the solid line indicate low variation in community composition (more similar communities).
Occupancy
Increased occupancy has a subtle but consistent association with differences in bacterial and fungal communities. Fungal community differences were associated with high human cell concentration, number of people and children, single vs. multifamily housing, and pets, and bacterial community differences were associated with human cell concentration, single vs. multifamily housing and presence of pets (ANOSIM p<0.05, Tables 2,3). High human cell concentration, large number of people, large number of children, multifamily housing shift the communities toward the lower left-hand corner in the bacterial PCoA graphs (Figure S2). Pets also shift the communities to the left. With the exception of number of home occupants (people or children), these shifts are significant (p<0.05, Table 2). With the exception of AC use, occupancy factors contributed to the most variance in fungal communities, and single/multifamily housing accounted for the most variance in bacteria. However, each factor accounted for a low proportion of variance in the overall communities as indicated by the R test statistics (Table 2).
Table 3.
Community analysis for fungi and bacteria based on dust composition. ANOSIM p-values and test statistics (R) are reported, and associations with p < 0.05 are in bold.
| Dust composition measure | Fungi | Bacteria | Bacteria | |||
|---|---|---|---|---|---|---|
| Morisita Horn | Unweighted Unifrac | Weighted Unifrac | ||||
| p-value | R | p-value | R | p-value | R | |
| Bacteria concentration | 0.006 | 0.02 | 0.011 | 0.02 | 0.053 | 0.01 |
| Fungi concentration | 0.085 | 0.01 | 0.032 | 0.01 | 0.35 | 0.00 |
| Human cell concentration | 0.0011 | 0.05 | 0.0001 | 0.05 | 0.0001 | 0.05 |
| Dog cell concentration | 0.93 | −0.02 | 0.92 | −0.02 | 0.26 | 0.01 |
| Endotoxin concentration | 0.018 | 0.02 | 0.025 | 0.02 | 0.06 | 0.02 |
| (1–3)-β-D-glucan concentration | 0.0035 | 0.04 | 0.57 | 0.00 | 0.34 | 0.00 |
High occupancy conditions or living in close proximity to more people (based on human cell concentration, single vs. multifamily housing, and presence of pets/dogs) result in decreased compositional variation in fungal and bacterial communities (bar graphs, Figures 2,3). The presence (rather than absence) of people and pets may drive these community similarities. There are no clear trends in bacteria based on number of people or children in bacteria, although homes with fewer people or fewer children tend to have lower compositional variation in fungi.
Level of urbanization
Level of urbanization was associated with differences in bacterial communities. While level of urbanization was not associated with differences between fungal communities (p=0.33, Table 2), previous studies restricted to homes without visible mold demonstrated the important influence of outdoor air (Adams et al., 2013a). Restricting homes in this study to those without reported visible mold (n=109) also revealed significant but small fungal community differences based on urban or suburban location (R=0.03, p=0.04). Regarding community composition, urban homes were more similar to each other (had less variation) than suburban homes for fungi, while suburban homes shared more similarities than urban homes for bacteria (Figures 2,3).
Moisture and AC use
Reported mold and AC use in homes was associated with differences in the fungal but not bacterial communities (Table 2). Within community composition, reported mold increased compositional variation (increased differences among homes with mold) for fungi (Figure 2). The opposite effect occurred for reported water leaks, which were associated with more similar fungal communities (Figure 2).
Overall, AC use accounted for the most variance in fungal communities among the variables included in this study (Table 2). The fungal populations in homes with AC use were more similar to each other (Figure 2). The use of AC in homes may lead to similarities among microbial communities (as opposed to similarities associated with the absence of AC use). After restricting the analysis to only homes with AC use, using AC for longer periods of time increased variation in community composition (Figures 2,3).
Associations between specific taxa and home characteristics
Taxonomic associations were found with many of the housing characteristics considered. The fungal class Wallemiomycetes was significantly associated with homes with more than five people. Fungal taxa Phlogicylindrium eucalyptorum, Lecythophora hoffmannii, and the genera Phlogicylindrium and Penicillium were associated with homes with more than three children (Table S2).
There were three bacterial OTUs associated with homes without pets (genera Staphylococcus and Corynebacteriaceae) and 53 bacterial OTUs associated with homes with pets, with the most significant associations including Bacteroidetes, Firmicutes, Fusobacteria, and Gammaproteobacteria (Table S3). Bacteria previously associated with dogs (Porphyromonadaceae and Pasteurellaceae) (Dunn et al., 2013) were found in homes with pets.
A total of 34 fungal taxa were more common in either urban or suburban homes, and 20 fungal taxa had associations with single or multifamily homes. Many fungal taxa associated with suburban homes have been found outdoors on plants or in soil. Three Cryptococcus spp. were associated with suburban homes, none with urban homes, two with single family homes, and one with multifamily homes (Table S2). For bacteria, 16 OTUs were associated with suburban homes, while 79 OTUs were associated with either single family or multifamily house type. Multifamily housing was associated most significantly with Wautersiella falsenii and Staphylococcaceae, and also with many other taxa including the genera Acinetobacter, Corynebacterium, and Prevotella (Table S3).
The fungal genus Candida and classes Wallemiomycetes and Saccharomycetes were found at significantly higher concentration in homes without AC use (Table S2). A trend toward an association was seen in species Candida tropicalis (p=0.0002, q=0.071) and Candida albicans (p=0.0005, q=0.097) with homes without AC use.
Dust composition
We measured the concentration of total fungi (spore equivalents/mg dust), bacteria (genomes/mg dust), human (cells/mg dust), and dog cells (cells/mg dust) (Figure 1 D). Human cells had the widest concentration range. Number of bacterial genomes was generally higher than number of fungal spore equivalents, although median values were similar. Concentration of dog cells was correlated with reported dog(s) in the home (R=0.43, p<0.0001) for homes with available responses on the specific presence of dog(s) (n=85). Homes with a high concentration of fungi, bacteria, or human cells were significantly more likely to also have high concentrations of the other two (all p<0.0001, Table 4). Dog cell concentration was also correlated with fungi and bacteria concentration (Table 4). Having more than five people in the home was significantly associated with higher detected levels of log-transformed bacteria concentration (p=0.047), as was having more than three children in a home (p=0.034). These occupant characteristics were not directly associated with human cell or fungi concentration (all p>0.05).
Table 4.
Correlation coefficients (R) and correlation p-values for microbial measurements.
| Bacteria concentration | Human cell concentration | Dog cell concentration | Endotoxin | (1–3)-β-D-Glucan | Bacterial richness | Fungal richness | |
|---|---|---|---|---|---|---|---|
| Fungi concentration | 0.41 <0.0001 |
0.31 <0.0001 |
0.25 0.001 |
0.08 0.41 |
0.08 0.41 |
0.26 0.0003 |
0.07 0.36 |
| Bacteria concentration | 0.45 <0.0001 |
0.14 0.04 |
0.11 0.24 |
0.17 0.057 |
−0.01 0.89 |
0.17 0.03 |
|
| Human cell concentration | 0.12 0.08 |
0.04 0.65 |
0.14 0.12 |
−0.01 0.84 |
0.16 0.04 |
||
| Dog cell concentration | 0.18 0.053 |
0.07 0.42 |
0.18 0.02 |
0.14 0.07 |
|||
| Endotoxin | −0.02 0.79 |
0.14 0.14 |
0.00 1.00 |
||||
| (1–3)-β-D-Glucan | 0.02 0.80 |
0.25 0.01 |
|||||
| Bacterial richness | 0.30 0.0002 |
For taxa associations, the most abundant fungal taxa were more likely to be associated with higher concentrations of fungal cells. Thus high total fungal concentrations are composed of higher concentrations of abundant taxa, rather than an overall increase in number of taxa since concentration is not associated with richness. Higher concentrations of human cells were associated with human-associated fungi, such as Malassezia spp. (Table S2), and human commensal bacteria such as Rothia mucilaginosa, Streptococcus, Corynebacterium, and Staphylococcus (Table S3). The genus Ascochyta and class Wallemiomycetes were associated with increased (1–3)-β-D-glucan concentrations, and there was a trend toward an association with two Cryptoccocus spp., C. carnescens and C. dimennae (both p<0.001, q<0.16). Lactobacillus johnsonii (specifically targeted by qPCR) tended toward increased concentration with the presence of dog (p=0.07) and was also associated with increased human cell concentration (p=0.008).
Measured microbial agents (bacterial endotoxin and fungal (1–3)-β-D-glucan) were correlated with differences in communities. Fungal (1–3)-β-D-glucan was not correlated with total fungal concentration (p=0.41) but was correlated with community differences (p=0.004) and richness (p=0.02) (Tables 3,5 and Figure 2). Measured bacterial endotoxin was not correlated with total bacteria concentration (Table 4) but was correlated with community differences (p=0.03) (Table 3). Human cell concentration was correlated with differences in fungal and bacterial communities (Table 3, Figures 2,3,S2). The microbial community compositions in homes with high concentrations of fungi, bacteria, human, or dog cells tend to be similar to each other based on distance comparison (Figure 2, 3).
Table 5.
Richness analysis for fungi and bacteria based on dust composition. Associations with p < 0.05 are in bold.
| Dust composition measure | n (High) | Mean number of Fungal OTUs | Mean number of Bacterial OTUs | ||||
|---|---|---|---|---|---|---|---|
| High | Low | p-value | High | Low | p-value | ||
| Bacteria concentration | 98 | 99.6 | 86.0 | 0.028 | 732 | 737 | 0.89 |
| Fungi concentration | 98 | 95.5 | 89.7 | 0.36 | 788 | 682 | 0.0003 |
| Human cell concentration | 98 | 99.1 | 86.4 | 0.042 | 731 | 737 | 0.84 |
| Dog cell concentration | 82* | 99.3 | 87.9 | 0.070 | 777 | 704 | 0.016 |
| Endotoxin concentration | 60* | 83.0 | 82.0 | 0.88 | 773 | 713 | 0.10 |
| (1–3)-β-D-glucan conc. | 60* | 89.9 | 74.8 | 0.019 | 744 | 741 | 0.93 |
Dog cell concentration was above the detection limit in 82 homes. Endotoxin and (1–3)-β-D-glucan measurements were conducted in a subset of homes (n=120).
“High” and “Low” refer to the concentration of the dust composition measure, i.e., for bacteria concentration, “high” homes had a bacteria concentration above the median.
Discussion
In this study of 198 homes in southern New England, USA, we determined that both fungal and bacterial communities are non-random and demonstrated species segregation based on the C-score. Subsequently, we demonstrated that these communities are associated with selected housing characteristics previously associated with human health outcomes. Based on the R test statistics in Table 2, AC use and occupancy factors are the dominant factors among those studied that most affect microbial communities, similar to previous studies (Meadow et al., 2014).
Moisture and fungi
As seen previously (Dannemiller et al., 2014a; Pitkäranta et al., 2011), reported water leaks in a home was significantly associated with increased fungal richness. Reported water leaks and reported mold were correlated with each other (R=0.26, p=0.0003,), but these factors had opposite effects on community structure. While reported water leaks was associated with increasing the similarity among fungal communities, reported mold reduced similarities in community structure. Homes without mold showed increased similarities to each other as opposed to the similarities among homes with mold. Neither mold nor water leaks were associated with any microbial taxa, although there was a trend toward an association of fungal class Exobasidiomycetes with homes with mold (p=0.012, q=0.079), and the closely-related class Ustilaginomycetes (both in subphylum Ustilaginomycotina) has been previously associated with mold in homes (Dannemiller et al., 2014a). Mold growth modified the effect of moisture on fungal richness in a previous study (Dannemiller et al., 2014a). Overall, these results indicated that water leaks may increase similarities in fungal communities (and increase richness), while the growth of mold leads to differences. One hypothesis for this difference is that mold growth suggests a long term water-related problem that tends to be dominated by one or several fungal species. Domination by a small number of species that differ between households may lead to fungal community differences between homes. Both water leaks and presence of mold were reported by the resident, which could contribute to increased variability.
Homes with AC use typically experience differences in ventilation, temperature, and relative humidity (Wong et al., 2004). These changes may affect the selection processes occurring in the home and/or dispersal from outdoor air. These differences in temperature, relative humidity, and dispersal from outdoor air may be associated with longer periods of AC use, which in this study was associated with decreased fungal richness. While ventilation type and rate were not measured specifically in this study, previous work has identified this as an important factor for both indoor microbial communities (Hospodsky et al., 2014; Kembel et al., 2014; Meadow et al., 2014) and human health (Seppänen et al., 1999; Sundell et al., 2011). Ventilation and AC use remain important areas for future studies.
Microbial diversity
By design, all homes sampled in this study had a child with asthma. Therefore, changes to microbial communities associated with asthma development may not be applicable to those in the general population. For instance, in previous studies, high overall fungal richness was protective against asthma development (Dannemiller et al., 2014a; Ege et al., 2011). While richness may be artificially lower in this study, it is still useful to examine this important microbial community factor with this caveat in mind. Water leaks and pets were associated with increased fungal diversity while longer AC use was associated with a decrease in fungal diversity (Table 1). Dampness in homes is detrimental to human health (Fisk et al., 2007), which is inconsistent with the direction of the diversity change seen here, and thus fungal richness may not directly link asthma to dampness (Dannemiller et al., 2014a). AC use may change relative humidity and ventilation, which may result in lower fungal diversity. The presence of pets/dogs has been reported to reduce the risk of allergies and asthma (Hesselmar et al., 1999), and we found that presence of pets was associated with increased fungal diversity. Increased concentration of human cells in the dust was also associated with increased fungal diversity.
Dispersal
Dispersal is emerging as an important process occurring in microbial communities in the home (Adams et al., 2013a). The patterns in this current study cannot mechanistically be linked with associated microbial dispersal processes, but results can serve as a point of hypothesis generation. For example, increased dispersal can result in increased richness (Vellend et al., 2010). Our results suggest an increase in microbial richness in the home is associated with pets, and dogs in particular. Pets may add to the dispersal of microbes into the floor dust, possibly through shedding and activities such as tracking soil into the home (Fujimura et al., 2010). The presences of specific microbes (e.g. Porphyromonadaceae and Pasteurellaceae) associated with pets in the floor dust supports this hypothesis.
Dispersal of microbes from outdoor environment may account for increased bacterial diversity in suburban homes. Outdoor air from a rural setting (Greeley, CO) had higher bacterial diversity than outdoor air from an urban location (Denver, CO) (Bowers et al., 2013) and deposited outdoor air may exert a significant influence on house dust microbial communities (Qian et al., 2012). Increased bacterial richness in house dust of suburban compared to urban areas of this study may be due to dispersal from outdoor air of a richer community. In fact, many of the bacterial orders identified as different in urban and suburban homes in this study, including Sphingobacteriales, Rhizobiales, Burkholderiales, Lactobacillales, and Clostridiales (Table S3), have previously been reported as different in the outdoor air of urban and rural areas (Bowers, 2013).
Taxa and human health
Our results suggest that environmental conditions and human/animal occupancy unique to each home exert influence on microbial communities in house dust. Linking housing characteristics to beneficial and/or detrimental microbial taxa and associated diversity measures is a critical step in studying the associations between microbial populations in homes and human health (Ege et al., 2011; Dannemiller et al., 2014a).
Of the many associations listed in Tables S2 and S3, we examined taxa previously associated with human health outcomes. Several of these bacterial taxa were present in homes with pets or more total people/children. For instance, we found Bacteroides is associated with pets in the home and exposure to the species Bacteroides fragilis has been associated with immune function (Round et al., 2011). Faecalibacterium prausnitzii was associated with multifamily housing and more than 3 children in a home. This species is anti-inflammatory and protective against Crohn’s disease (Sokol et al 2008). This species (and others) also produces beneficial short-chain fatty acids that were more prevalent in rural African children than city-dwelling European children (De Filippo et al 2010, Rook 2012). We found the genus Lactobacillus to be more prevalent in homes with more children/people and multifamily housing, and this genus is protective against allergies and asthma (Ege et al., 2012; Chen et al., 2010). Lactobacillus johnsonii, which has been reported to be protective against allergies and associated with dogs (Fujimura et al., 2014), was associated with human cells and had a trend toward an association with dog cells. Acinetobacter spp. have previously been shown to be protective for development of allergic disease (Debarry et al., 2010; Ege et al., 2012), and here Acinetobacter spp. were associated with multifamily housing.
Study strengths, limitations, and future directions
Strengths of this study include that it was conducted in a homogeneous population of asthmatic children in the northeastern United States, and all samples were collected during the same season. Under occupied conditions, microbial populations in floor dust are similar to the airborne microbial populations (Hospodsky et al., 2012), and because it represents longer term accumulations, dust is commonly used for estimating microbial content and human exposure in buildings (Shendell et al., 2012; Amend et al., 2010; Dannemiller et al., 2014a; Ege et al., 2011). Next-generation DNA sequencing techniques allow identification of bacterial and fungal taxa without a priori taxa selection or culturing biases, in addition to allowing for more accurate measures of richness and diversity. Taxa identifications were adjusted for the presence of multiple comparisons. The large sample size relative to past sequencing studies permits an examination of many housing factors, and results corroborate previous smaller studies. The presence of at least one child with asthma in each home ensures that results are relevant to studies of childhood asthma, especially asthma exacerbations associated with microbial exposure. This study represents a diverse housing stock of both single and multifamily homes in both suburban and urban areas.
Limitations include that housing characteristics may have different effects on microbial communities in homes in different populations, geographic locations, and seasons that may affect generalizability. Samples were collected over three years, although all samples were collected in the same season. In addition, this study measured the microbial communities in house dust from the main living area, which may differ from communities located elsewhere in the home. Although water leaks, mold, and microbial communities results followed observed trends in prior studies (Dannemiller et al., 2014a; Pitkäranta et al., 2011), potential exposure misclassification for water leaks and visible mold is possible since these were reported by the resident and not assessed by trained observations or moisture meter measurements. Additional unmeasured housing characteristics may also have influenced microbial communities. Visible shifts in principal coordinate plots are subtle, which may result from the many variables that affect these microbial communities as opposed to one dominating factor, as well as from the fact that differences within the same habitat type (e.g., house dust) may be subtle.
Due to the matrix structure of the data, we were unable to perform a spatial autocorrelation analysis on the distance matrices for unweighted Unifrac (bacteria) and Morisita Horn (fungi). A previous study (Adams et al., 2013a) identified geographic proximity as an important factor influencing microbial communities. This prior study was conducted in a housing complex with homes <500 m apart. In this current study, the homes were more geographically distant (Figure S1), the mean distance between homes was 53 km, and only 0.26% of the distances between homes were less than 500 m. Additionally, at distances between homes less than 10 km, a linear regression analysis revealed no significant associations between geographic distance and unweighted Unifrac (bacteria, R=0.00, p=0.97) or Morisita Horn (fungi, R=0.02, p=0.14) distance. This 10 km distance was chosen to be sufficient to separate urban and suburban areas. Spatial autocorrelation is unlikely within this data.
This study relies on statistical associations found in homes of children with asthma, and these associations may be validated with mechanistic studies. Future studies may consider the opposing effects of reported water leaks and reported mold on fungal communities.
Conclusions
Housing characteristics have a significant impact on household microbial communities in homes of asthmatic children. Our results demonstrate that both indoor fungal and bacterial microbial communities are not randomly structured and all of the housing factors examined exerted some influence on microbial richness or taxa. Microbial richness was influenced by reported water leaks, length of AC use, level of urbanization, and presence of pets. Number of people and children, house type, mold, AC use, and pets were associated with differences in fungal communities, while bacterial community differences were associated with pets, level of urbanization, and single or multifamily homes. Richness values and taxa associated with specific human diseases were found to have associations with both occupancy and environmental factors. Choices about the construction, maintenance, and occupation of the indoor environment affect human exposures to microbes, and this relationship may eventually lead to updated housing recommendations to improve human health.
Supplementary Material
Practical Implications.
The indoor microbiome is influenced by the construction, maintenance, and occupation of homes. This work demonstrated that air conditioning use and occupancy are dominant building factors among those studied that shape the indoor microbiome. The results presented here allow for hypothesis generation for possible ecological processes in homes that determine fungal and bacterial community assembly. In conjunction with other studies, this work may lead to housing recommendations that modify microbial exposures and positively impact human health, especially in asthmatic children.
Acknowledgments
This work was supported by the Alfred P. Sloan Foundation (sample sequencing and analysis) and grant number ES05410 from the National Institutes of Health (household study and floor dust sample collection).
Footnotes
Conflict of Interest Statement
The authors declare no conflicts of interest.
References
- Adams RI, Miletto M, Taylor JW, Bruns TD. Dispersal in microbes: fungi in indoor air are dominated by outdoor air and show dispersal limitation at short distances. ISME J. 2013a;7:1262–1273. doi: 10.1038/ismej.2013.28. [DOI] [PMC free article] [PubMed] [Google Scholar]
- Adams RI, Miletto M, Taylor JW, Bruns TD. The Diversity and Distribution of Fungi on Residential Surfaces. PLoS ONE. 2013b;8:e78866. doi: 10.1371/journal.pone.0078866. [DOI] [PMC free article] [PubMed] [Google Scholar]
- Amend AS, Seifert KA, Samson R, Bruns TD. Indoor fungal composition is geographically patterned and more diverse in temperate zones than in the tropics. P Natl Acad Sci USA. 2010;107:13748–13753. doi: 10.1073/pnas.1000454107. [DOI] [PMC free article] [PubMed] [Google Scholar]
- Belanger K, Beckett W, Triche E, Bracken MB, Holford T, Ren P, Mcsharry JE, Gold DR, Platts-Mills TaE, Leaderer BP. Symptoms of Wheeze and Persistent Cough in the First Year of Life: Associations with Indoor Allergens, Air Contaminants, and Maternal History of Asthma. Am J Epidemiol. 2003;158:195–202. doi: 10.1093/aje/kwg148. [DOI] [PubMed] [Google Scholar]
- Belanger K, Gent JF, Triche EW, Bracken MB, Leaderer BP. Association of indoor nitrogen dioxide exposure with respiratory symptoms in children with asthma. Am J Respir Crit Care Med. 2006;173:297–303. doi: 10.1164/rccm.200408-1123OC. [DOI] [PMC free article] [PubMed] [Google Scholar]
- Belanger K, Holford TR, Gent JF, Hill ME, Kezik JM, Leaderer BP. Household levels of nitrogen dioxide and pediatric asthma severity. Epidemiology. 2013;24:320–330. doi: 10.1097/EDE.0b013e318280e2ac. [DOI] [PMC free article] [PubMed] [Google Scholar]
- Bloom B, Jones L, Freeman G. Summary health statistics for U.S children: National Health Interview Survey, 2012. National Center for Health Statistics. Vital Health Stat. 2013;10(258) [PubMed] [Google Scholar]
- Bowers RM, Clements N, Emerson JB, Wiedinmyer C, Hannigan MP, Fierer N. Seasonal Variability in Bacterial and Fungal Diversity of the Near-Surface Atmosphere. Environ Sci Tech. 2013;47:12097–12106. doi: 10.1021/es402970s. [DOI] [PubMed] [Google Scholar]
- Caporaso JG, Kuczynski J, Stombaugh J, Bittinger K, Bushman FD, Costello EK, Fierer N, Pena AG, Goodrich JK, Gordon JI, Huttley GA, Kelley ST, Knights D, Koenig JE, Ley RE, Lozupone CA, Mcdonald D, Muegge BD, Pirrung M, Reeder J, Sevinsky JR, Turnbaugh PJ, Walters WA, Widmann J, Yatsunenko T, Zaneveld J, Knight R. QIIME allows analysis of high-throughput community sequencing data. Nat Meth. 2010;7:335–336. doi: 10.1038/nmeth.f.303. [DOI] [PMC free article] [PubMed] [Google Scholar]
- Caporaso JG, Lauber CL, Walters WA, Berg-Lyons D, Lozupone CA, Turnbaugh PJ, Fierer N, Knight R. Global patterns of 16S rRNA diversity at a depth of millions of sequences per sample. Proc Natl Acad Sci USA. 2011;108(Suppl 1):4516–4522. doi: 10.1073/pnas.1000080107. [DOI] [PMC free article] [PubMed] [Google Scholar]
- Chen YS, Lin YL, Jan RL, Chen HH, Wang JY. Randomized placebo-controlled trial of lactobacillus on asthmatic children with allergic rhinitis. Pediatr Pulm. 2010;45:1111–1120. doi: 10.1002/ppul.21296. [DOI] [PubMed] [Google Scholar]
- Dannemiller K, Mendell MJ, Macher JM, Kumagai K, Bradman A, Holland N, Harley K, Eskenazi B, Peccia J. Next-generation DNA sequencing reveals that low fungal diversity in house dust is associated with childhood asthma development. Indoor Air. 2014a;24:236–247. doi: 10.1111/ina.12072. [DOI] [PMC free article] [PubMed] [Google Scholar]
- Dannemiller KC, Lang-Yona N, Yamamoto N, Rudich Y, Peccia J. Combining real-time PCR and next-generation DNA sequencing to provide quantitative comparisons of fungal aerosol populations. Atmos Environ. 2014b;84:113–121. [Google Scholar]
- Dannemiller KC, Reeves D, Bibby K, Yamamoto N, Peccia J. Fungal High-throughput Taxonomic Identification tool for use with Next-Generation Sequencing (FHiTINGS) J Basic Microb. 2013;54:315–321. doi: 10.1002/jobm.201200507. [DOI] [PubMed] [Google Scholar]
- De Filippo C, Cavalieri D, Di Paola M, Ramazzotti M, Poullet JB, Massart S, Collini S, Pieraccini G, Lionetti P. Impact of diet in shaping gut microbiota revealed by a comparative study in children from Europe and rural Africa. Proc Natl Acad Sci USA. 2010;107:14691–14696. doi: 10.1073/pnas.1005963107. [DOI] [PMC free article] [PubMed] [Google Scholar]
- Debarry J, Hanuszkiewicz A, Stein K, Holst O, Heine H. The allergy-protective properties of Acinetobacter lwoffii F78 are imparted by its lipopolysaccharide. Allergy. 2010;65:690–697. doi: 10.1111/j.1398-9995.2009.02253.x. [DOI] [PubMed] [Google Scholar]
- Diamond JM. Assembly of species communities. In: Cody ML, Diamond JM, editors. Ecology and evolution of communities. Cambridge, Massachusetts, USA: Harvard University Press; 1975. pp. 342–444. [Google Scholar]
- Dunn RR, Fierer N, Henley JB, Leff JW, Menninger HL. Home Life: Factors Structuring the Bacterial Diversity Found within and between Homes. PLoS ONE. 2013;8:e64133. doi: 10.1371/journal.pone.0064133. [DOI] [PMC free article] [PubMed] [Google Scholar]
- Ege MJ, Mayer M, Normand AC, Genuneit J, Cookson WOCM, Braun-Fahrländer C, Heederik D, Piarroux R, Von Mutius E. Exposure to Environmental Microorganisms and Childhood Asthma. New Engl J Med. 2011;364:701–709. doi: 10.1056/NEJMoa1007302. [DOI] [PubMed] [Google Scholar]
- Ege MJ, Mayer M, Schwaiger K, Mattes J, Pershagen G, Van Hage M, Scheynius A, Bauer J, Von Mutius E. Environmental bacteria and childhood asthma. Allergy. 2012;67:1565–1571. doi: 10.1111/all.12028. [DOI] [PubMed] [Google Scholar]
- Fisk WJ, Lei-Gomez Q, Mendell MJ. Meta-analyses of the associations of respiratory health effects with dampness and mold in homes. Indoor Air. 2007;17:284–296. doi: 10.1111/j.1600-0668.2007.00475.x. [DOI] [PubMed] [Google Scholar]
- Fujimura KE, Demoor T, Rauch M, Faruqi AA, Jang S, Johnson CC, Boushey HA, Zoratti E, Ownby D, Lukacs NW, Lynch SV. House dust exposure mediates gut microbiome Lactobacillus enrichment and airway immune defense against allergens and virus infection. Proc Natl Acad Sci USA. 2014;111:805–810. doi: 10.1073/pnas.1310750111. [DOI] [PMC free article] [PubMed] [Google Scholar]
- Fujimura KE, Johnson CC, Ownby DR, Cox MJ, Brodie EL, Havstad SL, Zoratti EM, Woodcroft KJ, Bobbitt KR, Wegienka G, Boushey HA, Lynch SV. Man’s best friend? The effect of pet ownership on house dust microbial communities. J Allergy Clin Immun. 2010;126:410–412.e413. doi: 10.1016/j.jaci.2010.05.042. [DOI] [PMC free article] [PubMed] [Google Scholar]
- Fyhrquist N, Ruokolainen L, Suomalainen A, Lehtimaki S, Veckman V, Vendelin J, Karisola P, Lehto M, Savinko T, Jarva H, Kosunen TU, Corander J, Auvinen P, Paulin L, Von Hertzen L, Laatikainen T, Makela M, Haahtela T, Greco D, Hanski I, Alenius H. Acinetobacter species in the skin microbiota protect against allergic sensitization and inflammation. J Allergy Clin Immun. 2014;134:1301–1309.e1311. doi: 10.1016/j.jaci.2014.07.059. [DOI] [PubMed] [Google Scholar]
- Gauch HG, Whittaker RH, Wentworth TR. A Comparative Study of Reciprocal Averaging and Other Ordination Techniques. J Ecol. 1977;65:157–174. [Google Scholar]
- Gent JF, Kezik JM, Hill ME, Tsai E, Li DW, Leaderer BP. Household mold and dust allergens: exposure, sensitization and childhood asthma morbidity. Environ Res. 2012;118:86–93. doi: 10.1016/j.envres.2012.07.005. [DOI] [PMC free article] [PubMed] [Google Scholar]
- Gotelli N, Entsminger G. EcoSim: null models software for ecology. Version. 2004;7:71. http://www.uvm.edu/~ngotelli/EcoSim/EcoSim.html. Accessed May 6 2014. [Google Scholar]
- Green JL. Can bioinformed design promote healthy indoor ecosystems? Indoor Air. 2014;24:113–115. doi: 10.1111/ina.12090. [DOI] [PubMed] [Google Scholar]
- Hanski I, Von Hertzen L, Fyhrquist N, Koskinen K, Torppa K, Laatikainen T, Karisola P, Auvinen P, Paulin L, Mäkelä MJ, Vartiainen E, Kosunen TU, Alenius H, Haahtela T. Environmental biodiversity, human microbiota, and allergy are interrelated. Proc Natl Acad Sci USA. 2012;109:8334–8339. doi: 10.1073/pnas.1205624109. [DOI] [PMC free article] [PubMed] [Google Scholar]
- Hesselmar Åberg, Eriksson, Björkstén Does early exposure to cat or dog protect against later allergy development? Clin Exp Allergy. 1999;29:611–617. doi: 10.1046/j.1365-2222.1999.00534.x. [DOI] [PubMed] [Google Scholar]
- Horn HS. Measurement of Overlap in Comparative Ecological Studies. Am Nat. 1966;100:419–424. [Google Scholar]
- Hospodsky D, Qian J, Nazaroff WW, Yamamoto N, Bibby K, Rismani-Yazdi H, Peccia J. Human Occupancy as a Source of Indoor Airborne Bacteria. PLoS ONE. 2012;7:e34867. doi: 10.1371/journal.pone.0034867. [DOI] [PMC free article] [PubMed] [Google Scholar]
- Hospodsky D, Yamamoto N, Nazaroff WW, Miller D, Gorthala S, Peccia J. Characterizing airborne fungal and bacterial concentrations and emission rates in six occupied children’s classrooms. Indoor Air. 2014 doi: 10.1111/ina.12172. [DOI] [PubMed] [Google Scholar]
- Kembel SW, Meadow JF, O’Connor TK, Mhuireach G, Northcutt D, et al. Architectural Design Drives the Biogeography of Indoor Bacterial Communities. PLoS ONE. 2014;9:e87093. doi: 10.1371/journal.pone.0087093. [DOI] [PMC free article] [PubMed] [Google Scholar]
- Kembel SW, Jones E, Kline J, Northcutt D, Stenson J, Womack AM, Bohannan BJM, Brown GZ, Green JL. Architectural design influences the diversity and structure of the built environment microbiome. ISME J. 2012;6:1469–1479. doi: 10.1038/ismej.2011.211. [DOI] [PMC free article] [PubMed] [Google Scholar]
- Klepeis NE, Nelson WC, Ott WR, Robinson JP, Tsang AM, Switzer P, Behar JV, Hern SC, Engelmann WH. The National Human Activity Pattern Survey (NHAPS): a resource for assessing exposure to environmental pollutants. J Expo Anal Env Epid. 2001;11:231. doi: 10.1038/sj.jea.7500165. [DOI] [PubMed] [Google Scholar]
- Larena I, Salazar O, Gonzalez V, Julian MC, Rubio V. Design of a primer for ribosomal DNA internal transcribed spacer with enhanced specificity for ascomycetes. J Biotechnol. 1999;75:187–194. doi: 10.1016/s0168-1656(99)00154-6. [DOI] [PubMed] [Google Scholar]
- Leaderer BP, Belanger K, Triche E, Holford T, Gold DR, Kim Y, Jankun T, Ren P, Mcsharry Je JE, Platts-Mills TA, Chapman MD, Bracken MB. Dust mite, cockroach, cat, and dog allergen concentrations in homes of asthmatic children in the northeastern United States: impact of socioeconomic factors and population density. Environ Health Perspect. 2002;110:419–425. doi: 10.1289/ehp.02110419. [DOI] [PMC free article] [PubMed] [Google Scholar]
- Lozupone C, Knight R. UniFrac: a New Phylogenetic Method for Comparing Microbial Communities. Appl Environ Microb. 2005;71:8228–8235. doi: 10.1128/AEM.71.12.8228-8235.2005. [DOI] [PMC free article] [PubMed] [Google Scholar]
- Manter D, Vivanco J. Use of the ITS primers, ITS1F and ITS4, to characterize fungal abundance and diversity in mixed-template samples by qPCR and length heterogeneity analysis. J Microbiol Meth. 2007;71:7–14. doi: 10.1016/j.mimet.2007.06.016. [DOI] [PubMed] [Google Scholar]
- Masoli M, Fabian D, Holt S, Beasley R. The global burden of asthma: executive summary of the GINA Dissemination Committee Report. Allergy. 2004;59:469–478. doi: 10.1111/j.1398-9995.2004.00526.x. [DOI] [PubMed] [Google Scholar]
- Mcdonald D, Price MN, Goodrich J, Nawrocki EP, Desantis TZ, Probst A, Andersen GL, Knight R, Hugenholtz P. An improved Greengenes taxonomy with explicit ranks for ecological and evolutionary analyses of bacteria and archaea. ISME J. 2012;6:610–618. doi: 10.1038/ismej.2011.139. [DOI] [PMC free article] [PubMed] [Google Scholar]
- Meadow JF, Altrichter AE, Kembel SW, Kline J, Mhuireach G, Moriyama M, Northcutt D, O’connor TK, Womack AM, Brown GZ, Green JL, Bohannan BJM. Indoor airborne bacterial communities are influenced by ventilation, occupancy, and outdoor air source. Indoor Air. 2014;24:41–48. doi: 10.1111/ina.12047. [DOI] [PMC free article] [PubMed] [Google Scholar]
- Mendell MJ, Mirer AG, Cheung K, Tong M, Douwes J. Respiratory and Allergic Health Effects of Dampness, Mold, and Dampness-Related Agents: A Review of the Epidemiologic Evidence. Environ Health Perspect. 2011;119:748–756. doi: 10.1289/ehp.1002410. [DOI] [PMC free article] [PubMed] [Google Scholar]
- Nilsson RH, Bok G, Ryberg M, Kristiansson E, Hallenberg N. A software pipeline for processing and identification of fungal ITS sequences. Source Code Biol Med. 2009;4:1. doi: 10.1186/1751-0473-4-1. [DOI] [PMC free article] [PubMed] [Google Scholar]
- Pitkäranta M, Meklin T, Hyvärinen A, Nevalainen A, Paulin L, Auvinen P, Lignell U, Rintala H. Molecular profiling of fungal communities in moisture damaged buildings before and after remediation–a comparison of culture-dependent and culture-independent methods. BMC Microbiol. 2011;11:235–235. doi: 10.1186/1471-2180-11-235. [DOI] [PMC free article] [PubMed] [Google Scholar]
- Qian J, Hospodsky D, Yamamoto N, Nazaroff WW, Peccia J. Size-resolved emission rates of airborne bacteria and fungi in an occupied classroom. Indoor Air. 2012;22:339–351. doi: 10.1111/j.1600-0668.2012.00769.x. [DOI] [PMC free article] [PubMed] [Google Scholar]
- Rook GA. Hygiene hypothesis and autoimmune diseases. Clin Rev Allergy Immunol. 2012;42:5–15. doi: 10.1007/s12016-011-8285-8. [DOI] [PubMed] [Google Scholar]
- Round JL, Lee SM, Li J, Tran G, Jabri B, Chatila TA, Mazmanian SK. The Toll-Like Receptor 2 Pathway Establishes Colonization by a Commensal of the Human Microbiota. Science. 2011;332:974–977. doi: 10.1126/science.1206095. [DOI] [PMC free article] [PubMed] [Google Scholar]
- Seppänen OA, Fisk WJ, Mendell MJ. Association of Ventilation Rates and CO2 Concentrations with Health and Other Responses in Commercial and Institutional Buildings. Indoor Air. 1999;9:226–252. doi: 10.1111/j.1600-0668.1999.00003.x. [DOI] [PubMed] [Google Scholar]
- Sharpe RA, Bearman N, Thornton CR, Husk K, Osborne NJ. Indoor fungal diversity and asthma: A meta-analysis and systematic review of risk factors. J Allergy Clin Immun. 2015;135:110–122. doi: 10.1016/j.jaci.2014.07.002. [DOI] [PubMed] [Google Scholar]
- Shendell DG, Mizan SS, Yamamoto N, Peccia J. Associations between Quantitative Measures of Fungi in Home Floor Dust and Lung Function among Older Adults with Chronic Respiratory Disease: A Pilot Study. J Asthma. 2012;49:502–509. doi: 10.3109/02770903.2012.682633. [DOI] [PubMed] [Google Scholar]
- Sokol H, Pigneur B, Watterlot L, Lakhdari O, Bermúdez-Humarán LG, Gratadoux JJ, Blugeon S, Bridonneau C, Furet JP, Corthier G, Grangette C, Vasquez N, Pochart P, Trugnan G, Thomas G, Blottière HM, Doré J, Marteau P, Seksik P, Langella P. Faecalibacterium prausnitzii is an anti-inflammatory commensal bacterium identified by gut microbiota analysis of Crohn disease patients. Proc Natl Acad Sci USA. 2008;105:16731–16736. doi: 10.1073/pnas.0804812105. [DOI] [PMC free article] [PubMed] [Google Scholar]
- Stone L, Roberts A. The checkerboard score and species distributions. Oecologia. 1990;85:74–79. doi: 10.1007/BF00317345. [DOI] [PubMed] [Google Scholar]
- Storey JD, Tibshirani R. Statistical significance for genomewide studies. Proc Natl Acad Sci USA. 2003;100:9440–9445. doi: 10.1073/pnas.1530509100. [DOI] [PMC free article] [PubMed] [Google Scholar]
- Strachan DP. Hay fever, hygiene, and household size. BMJ. 1989;299:1259–1260. doi: 10.1136/bmj.299.6710.1259. [DOI] [PMC free article] [PubMed] [Google Scholar]
- Sundell J, Levin H, Nazaroff WW, Cain WS, Fisk WJ, Grimsrud DT, Gyntelberg F, Li Y, Persily AK, Pickering AC, Samet JM, Spengler JD, Taylor ST, Weschler CJ. Ventilation rates and health: multidisciplinary review of the scientific literature. Indoor Air. 2011;21:191–204. doi: 10.1111/j.1600-0668.2010.00703.x. [DOI] [PubMed] [Google Scholar]
- Thorne PS, Kulhankova K, Yin M, Cohn R, Arbes SJ, Jr, Zeldin DC. Endotoxin exposure is a risk factor for asthma: the national survey of endotoxin in United States housing. Am J Respir Crit Care Med. 2005;172:1371–1377. doi: 10.1164/rccm.200505-758OC. [DOI] [PMC free article] [PubMed] [Google Scholar]
- Vellend BM. Conceptual Synthesis in Community Ecology. Q Rev Biol. 2010;85:183–206. doi: 10.1086/652373. [DOI] [PubMed] [Google Scholar]
- Wong NH, Huang B. Comparative study of the indoor air quality of naturally ventilated and air-conditioned bedrooms of residential buildings in Singapore. Build Environ. 2004;39:1115–1123. [Google Scholar]
- Yamamoto N, Bibby K, Qian J, Hospodsky D, Rismani-Yazdi H, Nazaroff WW, Peccia J. Particle-size distributions and seasonal diversity of allergenic and pathogenic fungi in outdoor air. ISME J. 2012;6:1801–1811. doi: 10.1038/ismej.2012.30. [DOI] [PMC free article] [PubMed] [Google Scholar]
- Yemaneberhan H, Bekele Z, Venn A, Lewis S, Parry E, Britton J. Prevalence of wheeze and asthma and relation to atopy in urban and rural Ethiopia. Lancet. 1997;350:85–90. doi: 10.1016/S0140-6736(97)01151-3. [DOI] [PubMed] [Google Scholar]
- Yergeau E, Lawrence JR, Sanschagrin S, Waiser MJ, Korber DR, Greer CW. Next-Generation Sequencing of Microbial Communities in the Athabasca River and Its Tributaries in Relation to Oil Sands Mining Activities. Appl Environ Microb. 2012;78:7626–7637. doi: 10.1128/AEM.02036-12. [DOI] [PMC free article] [PubMed] [Google Scholar]
- Zock JP, Jarvis D, Luczynska C, Sunyer J, Burney P. Housing characteristics, reported mold exposure, and asthma in the European Community Respiratory Health Survey. J Allergy Clin Immun. 2002;110:285–292. doi: 10.1067/mai.2002.126383. [DOI] [PubMed] [Google Scholar]
Associated Data
This section collects any data citations, data availability statements, or supplementary materials included in this article.