

Abstract
At high-altitude, small mammals are faced with the energetic challenge of sustaining thermogenesis and aerobic exercise in spite of the reduced O2 availability. Under conditions of hypoxic cold stress, metabolic demands of shivering thermogenesis and locomotion may require enhancements in the oxidative capacity and O2 diffusion capacity of skeletal muscle to compensate for the diminished tissue O2 supply. We used common-garden experiments involving highland and lowland deer mice (Peromyscus maniculatus) to investigate the transcriptional underpinnings of genetically based population differences and plasticity in muscle phenotype. We tested highland and lowland mice that were sampled in their native environments as well as lab-raised F1 progeny of wild-caught mice. Experiments revealed that highland natives had consistently greater oxidative fiber density and capillarity in the gastrocnemius muscle. RNA sequencing analyses revealed population differences in transcript abundance for 68 genes that clustered into two discrete transcriptional modules, and a large suite of transcripts (589 genes) with plastic expression patterns that clustered into five modules. The expression of two transcriptional modules was correlated with the oxidative phenotype and capillarity of the muscle, and these phenotype-associated modules were enriched for genes involved in energy metabolism, muscle plasticity, vascular development, and cell stress response. Although most of the individual transcripts that were differentially expressed between populations were negatively correlated with muscle phenotype, several genes involved in energy metabolism (e.g., Ckmt1, Ehhadh, Acaa1a) and angiogenesis (Notch4) were more highly expressed in highlanders, and the regulators of mitochondrial biogenesis, PGC-1α (Ppargc1a) and mitochondrial transcription factor A (Tfam), were positively correlated with muscle oxidative phenotype. These results suggest that evolved population differences in the oxidative capacity and capillarity of skeletal muscle involved expression changes in a small suite of coregulated genes.
Keywords: capillarity, hypoxia adaptation, muscle fiber type, oxygen transport, physiological genomics, RNA-seq
Introduction
High-altitude environments provide fertile ground for examining the integrative physiological and genomic mechanisms of adaptation. Patterns of animal diversity change substantially across elevational gradients (Sánchez-Cordero 2001; McGuire et al. 2014), and a high degree of species turnover occurs in part from adaptation to local environments (Jankowski et al. 2012). The concurrent declines in temperature and oxygen tension with elevation are a particular challenge to small highland mammals, which must sustain high rates of aerobic metabolism to support thermogenesis and locomotion in spite of a diminished oxygen supply (Hayes 1989). Both genotypic specialization and phenotypic plasticity in the physiological systems that mediate oxygen transport and utilization could be important for meeting this challenge in highland natives, but we are just beginning to understand the mechanisms involved (Storz, Scott, et al. 2010; Scott 2011; Cheviron and Brumfield 2012).
Evolved changes in skeletal-muscle phenotype have occurred in several highland vertebrate taxa. The locomotory muscle of high-altitude birds that are sampled in their native environment (León-Velarde et al. 1993; Hepple et al. 1998; Mathieu-Costello et al. 1998) or raised in captivity at sea level (Scott, Egginton, et al. 2009; Scott, Richards, et al. 2009) is typically highly capillarized and more oxidative than that of lowland birds. Highland mammals also exhibit increased oxidative capacity in the locomotory, respiratory, and/or cardiac muscles (Sheafor 2003; Cheviron et al. 2012, 2014; Schippers et al. 2012). These derived trait changes should increase the capacities for oxygen diffusion and aerobic metabolism in the muscle, and may therefore enhance fitness-related physiological performance under hypoxia.
Changes in gene regulation have been shown to contribute to evolved differences in locomotory muscle phenotypes that are related to organismal performance. For example, mice selected for high levels of voluntary wheel running exhibit increased aerobic exercise performance and possess more oxidative and capillarized gastrocnemius muscle (Audet et al. 2011; Templeman et al. 2012), which is associated with differential expression of many genes involved in muscle plasticity and calcium signaling (Burniston et al. 2013). Similarly, rats selected for high running endurance exhibit upregulation of several genes involved in lipid metabolism in comparison to low capacity runners (Bye et al. 2008). In high-altitude populations of deer mice, an enhanced thermogenic capacity in hypoxia is associated with higher activities of oxidative enzymes as well as both constitutive and plastic changes in gene expression in locomotory muscle compared with lowland deer mice (Cheviron et al. 2012, 2014). Although changes in capillarity and fiber composition of skeletal muscle have evolved in several highland taxa (León-Velarde et al. 1993; Scott, Egginton, et al. 2009), the transcriptomic underpinnings of these convergent changes in phenotype are not known.
The deer mouse (Peromyscus maniculatus) has the broadest altitudinal distribution of any North American mammal, stretching from below sea level in Death Valley, California to over 4,300 m above sea level in numerous mountain ranges (Hock 1964). Population genetic studies of deer mice in western North America have demonstrated that highland mice are often genetically distinct from lowland conspecifics, and estimates of gene flow between highland and lowland populations are very low across the interface between the western Great Plains and the Front Range of the Southern Rocky Mountains (<<0.01 migrants per generation) (Storz et al. 2012; Natarajan et al. 2015). Survivorship studies of high-altitude deer mice have documented strong directional selection for increased thermogenic capacity under hypoxia (Hayes and O’Connor 1999). Such selection is likely to have influenced the metabolic capacities of skeletal muscle because shivering thermogenesis requires high levels of muscle activity (Oufara et al. 1987; Van Sant and Hammond 2008).
The objective of this study was to determine whether the evolved increases in aerobic capacity and oxidative enzyme activities in the skeletal muscle of highland deer mice (Cheviron et al. 2012, 2014) are associated with a more capillarized and oxidative muscle phenotype. We then aimed to determine the relationship between various phenotypic traits and gene expression profiles in the skeletal muscle using whole transcriptome shotgun sequencing (RNA sequencing [RNA-seq]) in order to elucidate the regulatory changes that underlie adaptive modifications of muscle physiology in high-altitude mice. Because induced changes in muscle phenotype may occur at different ontogenetic stages, we used an experimental design that allowed us to account for the combined effects of developmental plasticity and physiological plasticity during adulthood. We made comparisons between highland (Mt. Evans CO, 4,350 m) and lowland (Lincoln NE, 430 m) mice that were sampled at their native elevations, and we also compared F1 progeny of wild-caught mice that were born and reared under common garden conditions at low elevation.
Results
Muscle Phenotype Differs between Highlanders and Lowlanders
High-altitude mice exhibited an enhanced oxidative phenotype of the locomotory (gastrocnemius) muscle (figs. 1 and 2). This result was reflected in significant main effects of population altitude on several oxidative phenotypes, including the areal and numerical densities of oxidative fibers. In pairwise comparisons between populations, highlanders exhibited greater areal and numerical densities of oxidative fibers (both slow oxidative fiber density as well as total oxidative fiber density) when mice were sampled in their native environment, and these differences were mirrored by nonsignificant trends in the F1 progeny of wild-caught mice that were reared in the common-garden lab environment. The total proportion of oxidative fibers in the muscle was greater in highland deer mice by approximately 14–25% as a proportion of the total transverse area of the muscle and it was greater by approximately 5–14% as a proportion of total fiber number (figs. 1 and 2). The main cause of these differences was a 23–83% higher abundance by area of slow oxidative (type I) muscle fibers (figs. 1 and 2) with no change in the abundance of fast oxidative (type IIa) muscle fibers (table 1). The population differences in areal density were generally greater than the differences in numerical density because slow oxidative fibers were larger in highland deer mice. There were no differences in the size of fast oxidative and fast glycolytic fibers between highland and lowland mice (table 1).
Fig. 1.
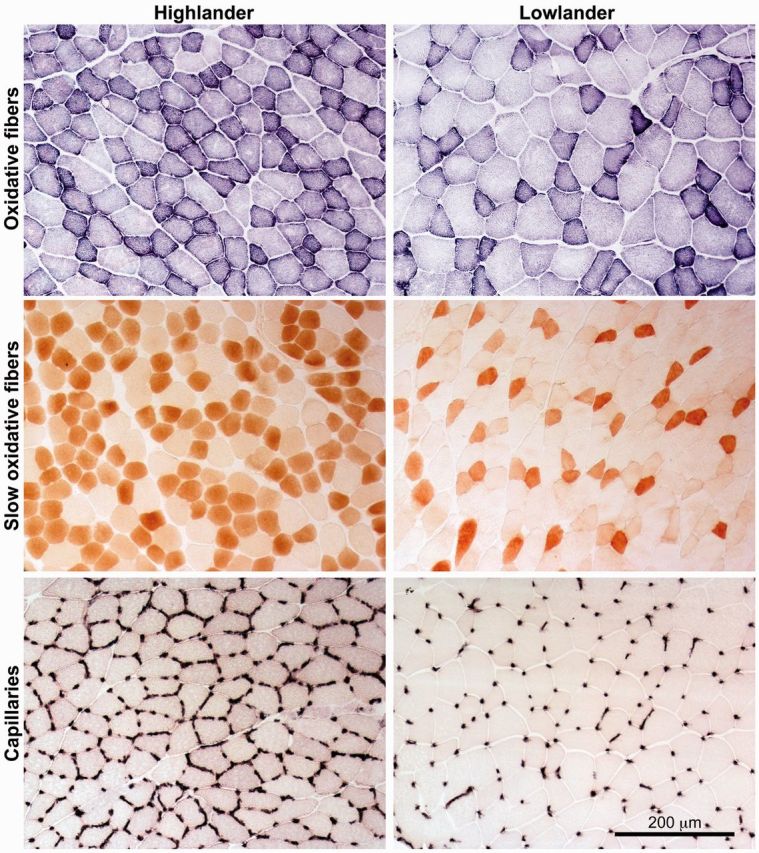
Histological analysis of fiber type and capillarity in the gastrocnemius muscle of deer mice. Representative images from individuals sampled in their native environment are shown. Oxidative muscle fibers were identified by staining for succinate dehydrogenase activity, slow oxidative (type I) muscle fibers were identified by staining for slow myosin ATPase protein using immunohistochemistry, and capillaries were identified by staining for alkaline phosphatase activity. There were clear differences in staining intensity between highland and lowland deer mice.
Fig. 2.

The gastrocnemius muscle has a more oxidative phenotype in highland deer mice. There were significant effects of population altitude on the areal density of oxidative fibers (AA(ox,m); area of oxidative fibers relative to the total transverse area of the muscle) (F[1,37] = 13.37, P < 0.001), the numerical density of oxidative fibers (NN(ox,m); number of oxidative fibers relative to the total number of fibers) (F[1,37] = 5.143, P = 0.029), and the areal (AA(type I,m); F[1,37] = 9.329, P = 0.004) and numerical (NN(type I,m); F[1,37] = 6.379, P = 0.016) densities of slow oxidative fibers. The effects of rearing environment (native vs. common-garden F1 raised in the lab) were not significant (AA(ox,m) F[1,37] = 1.168, P = 0.287; NN(ox,m) F[1,37] = 1.708, P = 0.199; AA(type I,m) F[1,37] = 0.133, P = 0.718; NN(type I,m) F[1,37] < 0.001, P = 0.990). The interactions between population and rearing environment were also not significant (AA(ox,m) F[1,37] = 0.694, P = 0.410; NN(ox,m) F[1,37] = 1.032, P = 0.316; AA(type I,m) F[1,37] = 2.259, P = 0.141; NN(type I,m) F[1,37] = 0.724, P = 0.400). *Significant pairwise difference between highlanders and lowlanders within an experimental group (native vs. F1). Native lowlanders, n = 12; F1 lowlanders, n = 9; native highlanders, n = 9; F1 highlanders, n = 11.
Table 1.
Fiber Types in the Gastrocnemius Muscle of Deer Mice.
| Variable | Tr. | Lowlanders | Highlanders | F | P | |
|---|---|---|---|---|---|---|
| AA(type IIa,m) | Native | 0.299 ± 0.024 | 0.288 ± 0.041 | Pop | 0.042 | 0.838 |
| Lab F1 | 0.316 ± 0.027 | 0.340 ± 0.029 | RE | 1.308 | 0.260 | |
| NN(type IIa,m) | Native | 0.353 ± 0.030 | 0.328 ± 0.044 | Pop | 0.556 | 0.461 |
| Lab F1 | 0.383 ± 0.023 | 0.359 ± 0.032 | RE | 0.885 | 0.353 | |
| Type I area | Native | 1,082 ± 114 | 1,503 ± 127* | Pop | 5.092 | 0.030 |
| Lab F1 | 1,329 ± 65 | 1,436 ± 136 | RE | 0.593 | 0.446 | |
| Type IIa area | Native | 1,448 ± 114 | 1,574 ± 134 | Pop | 0.948 | 0.337 |
| Lab F1 | 1,491 ± 115 | 1,598 ± 110 | RE | 0.077 | 0.783 | |
| Type IIb area | Native | 2,277 ± 178 | 2,404 ± 130 | Pop | 0.152 | 0.699 |
| Lab F1 | 2,561 ± 109 | 2,313 ± 161 | RE | 0.380 | 0.541 |
Note.—Transverse area of each fiber type (slow oxidative, type I; fast oxidative, type IIa; fast glycolytic, type IIb) is reported in μm2. AA(IIa,m), areal density of fast oxidative fibers; NN(IIa,m), numerical density of fast oxidative fibers; one degree of freedom for each main effect variable (Pop, population altitude; RE, rearing environment) and 36 for the residual.
*Significant pairwise difference between highlanders and lowlanders within an environment.
Highland mice also had an increased capillarity in the gastrocnemius muscle in comparisons involving both native and captive-reared individuals. Many indices of capillarity were higher in highland mice compared with lowland mice, including capillary surface density (∼23–37% higher), capillary density (∼10–21% higher), the ratio of capillary surface to muscle fiber surface (∼19–36% higher), and the capillary to fiber ratio (∼8–17% higher) (figs. 1 and 3). There was also a noticeably higher vessel tortuosity in the highland mice, as reflected by the greater discrepancy in capillary surface density than in capillary density and the qualitative difference in the pattern of capillary staining (fig. 3). The overall difference in capillarity between highland and lowland mice was greater than the difference between native and F1 mice with the same population-of-origin, indicating that the observed population difference is not attributable to phenotypic plasticity.
Fig. 3.

The gastrocnemius muscle has a higher capillarity in highland deer mice than in lowland deer mice. There were significant effects of population altitude on capillary surface density (CSD, μm of capillary surface per μm2 of transverse muscle area) (F[1,35] = 18.92, P < 0.001), the ratio of capillary surface to fiber surface (CS:FS) (F[1,35] = 19.20, P < 0.001), the density of capillaries (CD, capillaries per mm2 of transverse muscle area) (F[1,35] = 4.525, P = 0.041), and the number of capillaries per muscle fiber (C:F) (F[1,35] = 4.223, P = 0.0474). The effects of rearing environment (native vs. common-garden F1 raised in the lab) were not significant (CSD F[1,35] = 0.781, P = 0.383; CS:FS F[1,35] = 0.071, P = 0.792; CD F[1,35] = 1.688, P = 0.202; C:F F[1,35] = 0.517, P = 0.477). The interactions between population and rearing environment were also not significant (CSD F[1,35] = 0.942, P = 0.339; CS:FS F[1,35] = 1.337, P = 0.255; CD F[1,35] = 0.321, P = 0.575; C:F F[1,35] = 0.430, P = 0.516). *Significant pairwise difference between highlanders and lowlanders within an experimental group (native vs. F1). Native lowlanders, n = 12; F1 lowlanders, n = 9; native highlanders, n = 8; F1 highlanders, n = 10.
There was a positive correlation between capillary surface density and the areal density of oxidative fibers (fig. 4A). Thus, the increase in capillarity in highland deer mice could have resulted solely from the greater oxygen demands imposed by the increase in oxidative fibers in highland mice, and not to provide an additional improvement of oxygen diffusion capacity under hypoxia. To explore this possibility, we used the residuals from the regression of capillary surface density against the areal density of oxidative fibers to test for differences in capillarity while controlling for the difference in fiber composition between highland and lowland deer mice. Residuals from this regression were significantly greater in highlanders than in lowlanders (fig. 4B), suggesting that the enhanced capillarity of highland mice should increase oxygen diffusion capacity in hypoxia.
Fig. 4.
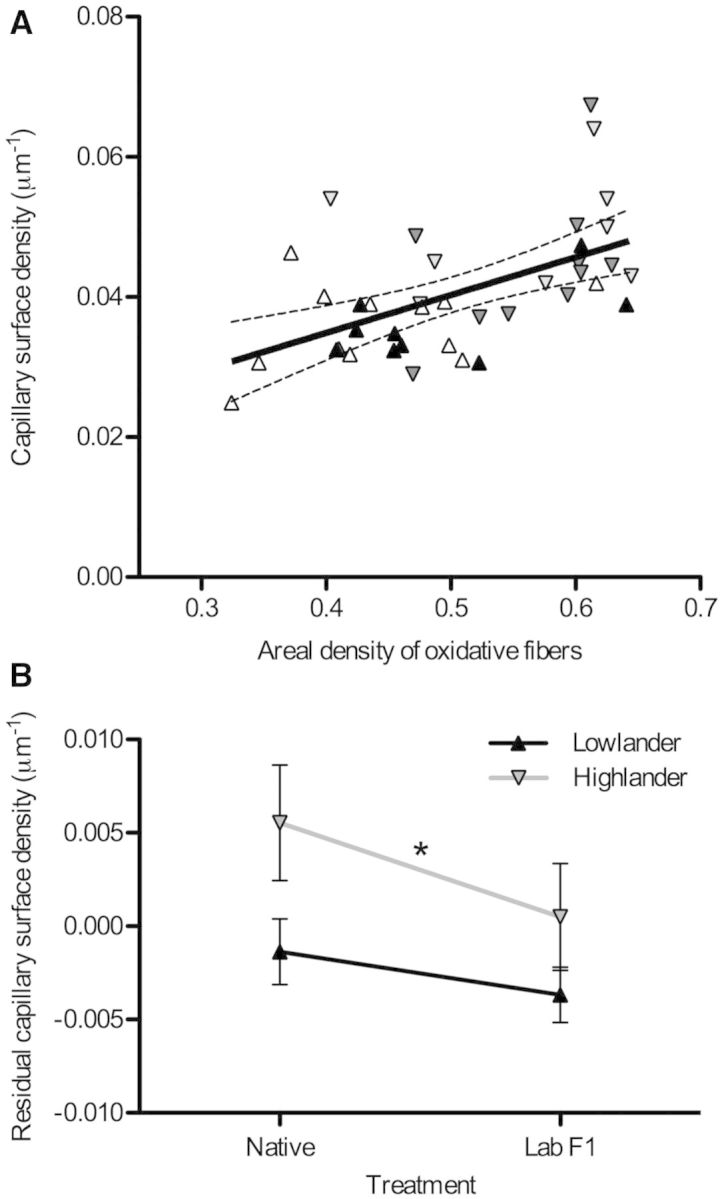
Capillarity in the gastrocnemius muscle is greater in highland deer mice than expected from the variation in muscle oxidative phenotype. (A) There was a strong linear correlation between capillary surface density (CSD) and the areal density of oxidative fibers (AA(ox,m)) (CSD = 0.0540 AA(ox,m) + 0.0133, P < 0.001). Dashed lines represent the 95% confidence intervals of the regression. Symbols are as follows: F1 lab-raised lowlanders, black upwards triangles; native lowlanders, white upwards triangles; F1 lab-raised highlanders, dark gray downwards triangles; native highlanders, light gray downwards triangles. (B) There was a significant effect of population altitude on the residual CSD from the regression in (A) (*F[1,35] = 5.558, P = 0.024), but there was no significant effect of rearing environment (F[1,35] = 2.453, P = 0.126) and no significant interaction between population and rearing environment (F[1,35] = 0.337, P = 0.566).
Population Differences and Plasticity in the Muscle Transcriptome
We used a general linear model to identify genes that exhibited persistent expression differences between highland and lowland populations across rearing environments and those that exhibited significant plasticity (as revealed by within-population comparisons between mice sampled in their native environment vs. F1 progeny of wild-caught mice). In total, 657 genes (5.4% of measured transcripts) exhibited significant expression differences between populations (highland vs. lowland) and/or between rearing environments (native vs. lab F1). Of these variable transcripts, the vast majority exhibited significant plasticity in expression as indicated by differences between rearing environments, without a significant population effect (89.7%—589 genes). A smaller number of genes were differentially expressed between populations, without significant effects of rearing environment (10.3%—68 genes). Twenty-nine genes (4.4% of variable transcripts) exhibited significant expression differences between populations and between rearing environments. We focused on this subset of 657 variable transcripts to investigate the transcriptomic basis of population differences in muscle phenotypes (supplementary tables S1 and S2, Supplementary Material online).
We calculated correlation coefficients for all pairwise comparisons of transcript abundance and we then used modulated modularity clustering (MMC) (Stone and Ayroles 2009) to identify transcriptional modules of coregulated genes (Rockman 2008; Ayroles et al. 2009). This analysis revealed a high degree of correlational structure among differentially expressed transcripts (fig. 5). The 68 genes with significant population effects clustered into two modules, the largest of which (module P2) contained 50 genes (fig. 5A). We recovered a similar pattern for the genes with significant differences in expression between rearing environments (i.e., native vs. lab F1) (fig. 5B). The 589 genes with significant effects of rearing environment clustered into a total of five modules, the largest of which (module T5) contained nearly 38% of the environmentally sensitive transcripts (224 genes).
Fig. 5.
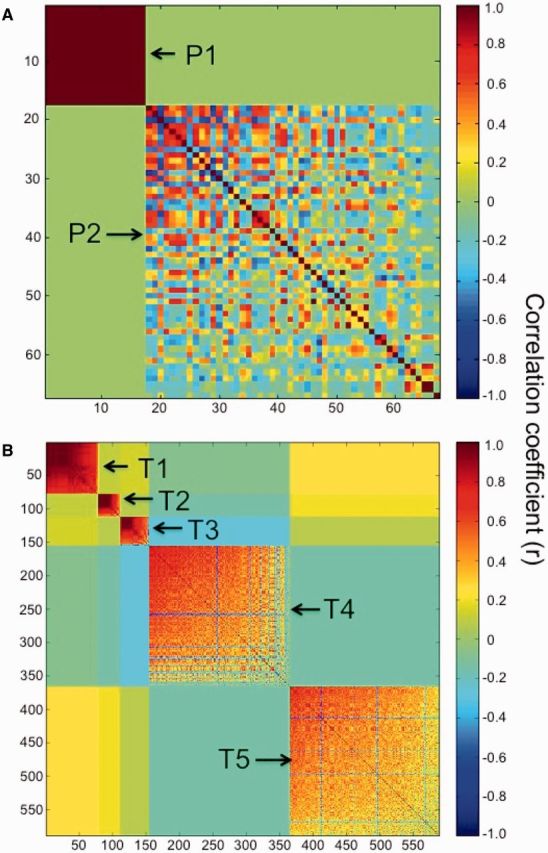
Correlated transcriptional modules. (A) Clustering of the 68 transcripts with significant population effects into two transcriptional modules. (B) Clustering of 589 transcripts with significant effects of rearing environment into five transcriptional modules.
Relationships between Muscle Phenotype and Transcriptomic Variation
Population-specific differences in gene expression were significantly associated with the observed differences in muscle phenotype. We used a combination of principal components analysis (PCA) and regression analysis to determine which transcriptional modules were most strongly associated with muscle phenotypes. Because genes within transcriptional modules are, by definition, highly correlated, PCA can be used to summarize expression patterns of particular transcriptional modules (Cheviron et al. 2014; Stager et al. 2015). For each of the transcriptional modules, the first principal component (PC1) accounted for 32.4–99.7% of the variance in gene expression among individuals (supplementary table S3, Supplementary Material online). Therefore, we used PC1 scores as an index of overall module expression to identify transcriptional modules that were significantly associated with muscle phenotypes. Of the two modules composed of genes with significant population effects, only one (P2) was significantly associated with any of the measured phenotypic traits. Module P2 expression scores were negatively associated with the total areal (R2 = 0.51, P = 0.00026) and numerical (R2 = 0.29, P = 0.0081) densities of oxidative fibers, capillary density (R2 = 0.23, P = 0.0223), capillary surface density (R2 = 0.46, P = 0.0009), and the ratio of capillary surface area to fiber surface area (R2 = 0.51, P = 0.0004) (table 2). The relationship between module P2 expression scores and capillary to fiber ratio were marginally significant (R2 = 0.16, P = 0.0513). Correspondingly, highland mice exhibited significantly lower module P2 expression scores than lowland mice, regardless of rearing environment (fig. 6). PC2 scores for module P1 were associated with several phenotypic traits, but this axis accounted for a trivial amount of the gene expression variance within this module (0.2%) (supplementary table S3, Supplementary Material online).
Table 2.
Transcriptomic Modules Associated with Muscle Phenotypes.
| Trait | Associated modules |
|---|---|
| Total areal density of oxidative fibers | P2*, T5 |
| Total numerical density of oxidative fibers | P2, T5 |
| Areal density of fast oxidative fibers | T5 |
| Numerical density of fast oxidative fibers | T5 |
| Capillary density | P2 |
| Capillary surface density | P2 |
| Capillary surface per fiber surface | P2* |
Note.—The genes that comprise each module are presented in supplementary tables S1 and S2, Supplementary Material online.
*Module phenotype associations that remain significant after Bonferroni correction for multiple tests (P < 0.00045).
Fig. 6.

Altitudinal variation in the expression of transcriptional modules that are statistically associated with muscle phenotypic traits. Module expression was summarized using PCA and PC1 scores are shown. There were significant effects of population altitude on modules P2 (F[1,17] = 238.0, P < 0.001) and T5 (F[1,17] = 10.19, P = 0.005). There was also a significant effect of rearing environment (native vs. common-garden F1 raised in the lab) on module T5 (F[1,17] = 29.64, P < 0.001) but not module P2 (F[1,17] = 0.937, P = 0.347). Transcriptional modules are shown in figure 5, and the genes that compose each module are presented in supplementary tables S1 and S2, Supplementary Material online. *Significant pairwise difference between highlanders and lowlanders within an experimental group (native vs. F1). Native lowlanders, n = 6; F1 lowlanders, n = 5; native highlanders, n = 5; F1 highlanders, n = 5.
Of the five environmentally sensitive transcriptional modules (i.e., those composed of genes exhibiting a significant effect of rearing environment), only one was statistically associated with several phenotypic traits. Module T5 expression was positively associated with the areal (R2 = 0.30, P = 0.007) and numerical (R2 = 0.32, P = 0.005) densities of slow oxidative fibers (table 2), and expression differences were highly significant in the comparison between highland and lowland mice in their native environments (fig. 6). PC2 scores for modules T1 and T2 were associated with several phenotypic traits, but again, this axis accounted for little of the explained variance in gene expression within modules (3.3% and 5.6%, respectively) (supplementary table S3, Supplementary Material online).
Enrichment analyses revealed that the transcriptional modules associated with muscle phenotypes contain a diverse assemblage of genes with a variety of molecular functions, many of which are relevant for metabolism, muscle fiber-type differentiation, and angiogenesis (supplementary table S4, Supplementary Material online). Module P2—the larger module comprising genes that were differentially expressed between populations regardless of rearing environment—was enriched (at a P value corrected for the false discovery rate [FDR], q < 0.10) for genes annotated with four gene ontology (GO) terms associated with metabolic processes, “secondary metabolic process” (q = 0.034), “oxidation–reduction process” (q = 0.064), “toxin metabolic process” (q = 0.016), and “organic acid metabolic process” (q = 0.094). Module T5 was significantly enriched for genes annotated with several GO terms related to muscle phenotype and oxygen transport, including “blood vessel development” (q = 0.016), “muscle structure development” (q = 0.020), “vascular development” (q = 0.028), and “negative regulation of vascular permeability” (q = 0.045). Module T5 was also enriched for many genes involved in energy metabolism, cell signaling, cell migration, and cell turnover. Modules T2, T3, and T4 were significantly enriched for genes that participate in immune function, apoptosis, and cell stress response, but these modules were not significantly associated with any of the measured muscle phenotypes.
Expression levels of 27 individual genes within modules P1 and P2 were greater in highlanders than in lowlanders, corresponding with the observed differences in muscle phenotype (fig. 7 and supplementary table S1, Supplementary Material online). Highland deer mice exhibited higher expression of several genes that are associated with oxidative energy metabolism, including enoyl-coA hydratase (Ehhadh) and acetyl-coenzyme A acyltransferase (Acaa1a) (enzymes involved in β-oxidation), mitochondrial creatine kinase (Ckmt1), a mitochondrial ribosomal protein (Mrpl22), and mannose receptor C type 1 (Mrc1). Expression of the latter is positively associated with mitochondrial gene expression in the muscle of humans (Moreno-Navarrete et al. 2013). Highlanders also exhibited higher expression of two aldehyde dehydrogenase paralogs (Aldh1a1 and Aldh1a7), which encode enzymes that can protect against ischemia-reperfusion injury by reducing oxidative stress, autophagy, and apoptosis during hypoxia (Ma et al. 2011; Contractor et al. 2013; Zhang et al. 2013). The expression of two genes that have been associated with angiogenesis, cadherin-7 (Cdh7) (Hayward et al. 2011) and Notch-4 (Notch4) (Lv et al. 2013), was also more highly expressed in highlanders. Most of the remaining genes with high expression in highlanders are uncharacterized (supplementary table S1, Supplementary Material online).
Fig. 7.

Some individual genes involved in metabolism and angiogenesis were more highly expressed in highlanders than in lowlanders. Reaction norms for gene expression are shown with native environment on the left and lab environment on the right, and data are shown relative to the average normalized read count for native lowlanders. There was a statistically significant effect of population altitude on all genes shown (see supplementary table S1, Supplementary Material online). The mean normalized read counts (cpm) for native lowlanders were as follows: enoyl-CoA hydratase (Ehhadh), 3.7; acetyl-Coenzyme A acyltransferase 1A (Acaa1a), 4.5; mitochondrial creatine kinase 1 (Ckmt1), 2.9; mitochondrial ribosomal protein L22 (Mrpl22), 8.5; aldehyde dehydrogenase 1A1 (Aldh1a1), 41.8; aldehyde dehydrogenase 1A7 (Aldh1a7), 20.2; mannose receptor C type 1 (Mrc1), 23.7; cadherin-7 (Cdh7), 3.8; and Notch-4 (Notch4), 45.8. There were also significant effects of rearing environment on Aldh1a1 and Cdh7 (†) (see supplementary table S2, Supplementary Material online). n = 6 for all groups.
Most of the genes that were differentially expressed between populations were expressed at a lower level in the highland mice (supplementary table S1, Supplementary Material online). Individual genes that encode proteins involved in the sarcomere (Actn1), peptide transport (Slc15a2), and muscle growth (Trf) were expressed at lower levels in highland mice, possibly because expression of these genes is more prevalent in fast glycolytic fibers (which are less abundant in the gastrocnemius of highlanders; figs. 1 and 2). Several transcripts for genes involved in cellular protection from reactive O2 species or xenobiotics were also lower in highlanders, such as transferrin (Trf), ceruloplasmin (CP), glutathione S-transferase (Gstt3), cytochrome P450 enzymes (9030605E09Rik), and flavin-containing monooxygenase (Fmo1). Curiously, some genes involved in oxidative energy metabolism (Atp6, ND3, ND4, Ndr1, and Pank1) as well as a potent vasodilator of arteries (urocortin, Ucn) (Diaz and Smani 2013) were also expressed at lower levels in highlanders.
Relationships between Muscle Phenotype and the Expression of Candidate Genes
In addition to the discovery-driven analyses of transcriptional variation, we tested for associations between muscle phenotype and expression level for a number of candidate genes involved in regulating energy metabolism, mitochondrial biogenesis, and/or angiogenesis (Lin et al. 2005; Lanza and Sreekumaran Nair 2010; Gustafsson 2011) (see Materials and Methods). There were functional similarities between our set of candidate genes and the set of genes that were overrepresented in the enrichment analyses, which is not surprising given that both sets of genes are associated with metabolism, muscle fiber-type differentiation, and angiogenesis. Six of the candidate genes exhibited positive associations with at least one phenotypic trait. Expression of the peroxisome proliferator-activated receptors (PPAR) γ coactivator 1α (PGC-1α) gene Ppargc1a, a purported master regulator of mitochondrial biogenesis, was associated with the numerical density of oxidative fibers in the muscle (R2 = 0.203, P = 0.046) and the ratio of capillary surface to fiber surface (R2 = 0.239, P = 0.034) (table 3). The association between Tfam, a key activator of mitochondrial gene expression, and the areal density of oxidative fibers was marginally significant (R2 = 0.197, P = 0.050). Several of the growth factors (Angpt1, Pdgfa, Pdgfd, and Vegfc) were positively associated with the size of a particular fiber type (table 3) (although only slow oxidative fiber area differed between populations; table 1).
Table 3.
Candidate Genes that Were Associated with Muscle Phenotypes.
| Trait | Positive Association | Negative Association |
|---|---|---|
| Areal density of oxidative fibers | Tfam | Fgf12, Pdgfra, Vegfc |
| Numerical density of oxidative fibers | Ppargc1a | Fgf12, Mmp2, Pdgfra, Pparg |
| Areal density of slow oxidative fibers | Fgfr2, Mmp2, Mmp14, Pdgfra, Tie1 | |
| Numerical density of slow oxidative fibers | Fgfr2*, Mmp2, Mmp13, Mmp14, Pdgfra, Tie1 | |
| Type I fiber area | Angpt1 | |
| Type IIa fiber area | Pdgfa | Fgf13, Fgf14 |
| Type IIb fiber area | Pdgfd, Vegfc | Fgf14 |
| Capillary density | Pdgfc, Ppara, Vegfa | |
| Capillary to fiber ratio | Fgfr2, Mmp2, Mmp14, Pdgfra, | |
| Capillary surface density (CSD) | Fgfr2, Ppara, Vegfb | |
| Capillary surface per fiber surface | Ppargc1a | Fgfr2 |
| Residual CSD | Ppara, Vegfa, Vegfb |
Note.—Residual CSDs are those calculated in figure 4.
*Association that remained significant after Bonferroni correction for multiple comparisons (P < 0.0001).
The majority of significant associations between candidate gene expression and muscle phenotype was negative (table 3). Fifteen of the 43 candidate genes showed significant negative associations with at least one phenotypic trait (Fgf12, Fgf13, Fgf14, Fgfr2, Mmp2, Mmp13, Mmp14, Pdgfc, Pdgfra, Ppara, Pparg, Tie1, Vegfa, Vegfb, and Vegfc). The strongest negative association was between Fgfr2 and the numerical (R2 = 0.574, P = 0.0001) and areal (R2 = 0.446, P = 0.0013) densities of slow oxidative fibers in the muscle (fig. 8).
Fig. 8.
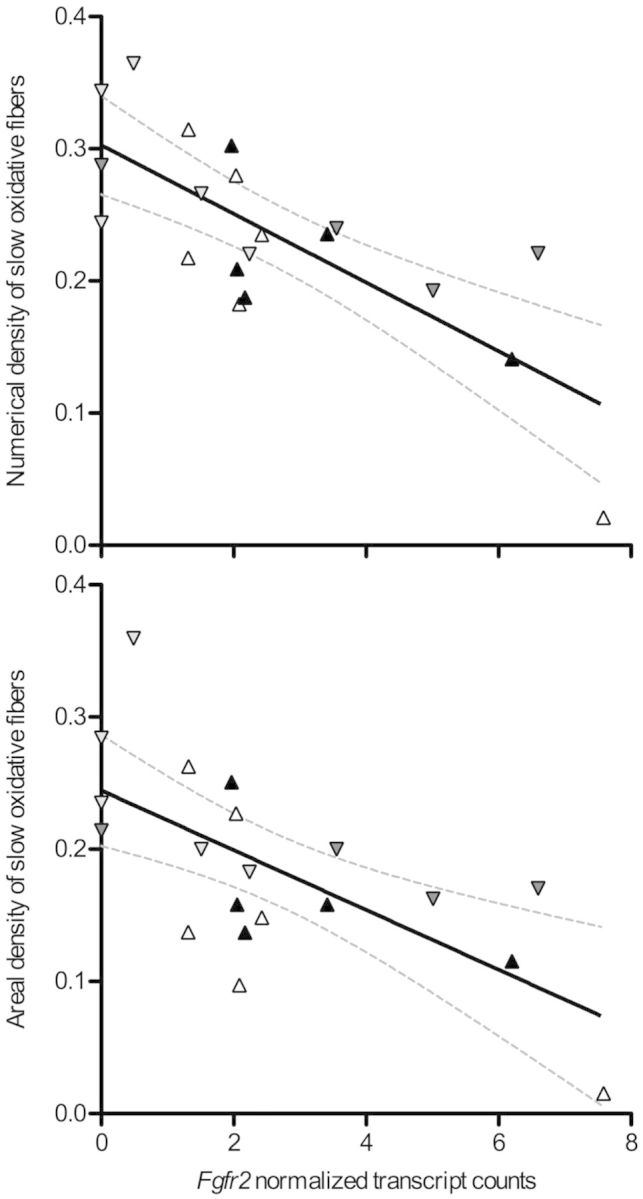
There was a strong negative association between the expression of fibroblast growth factor receptor 2 (Fgfr2) and the abundance of slow oxidative fibers. There was a significant linear correlation between Fgfr2 transcript abundance and both the numerical (R2 = 0.574, P = 0.0001) and areal (R2 = 0.446, P = 0.0013) densities of slow oxidative fibers in the gastrocnemius muscle. Dashed lines represent the 95% confidence intervals of the regression. Symbols are as follows: F1 lab-raised lowlanders, black upwards triangles; native lowlanders, white upwards triangles; F1 lab-raised highlanders, dark gray downwards triangles; native highlanders, light gray downwards triangles.
Discussion
Deer mice at high altitudes sustain high metabolic rates to support locomotion and thermogenesis (Hayes 1989) and enhanced performance capacities appear to be adaptive (Hayes and O’Connor 1999). Highland deer mice have therefore evolved an elevated aerobic capacity in hypoxia relative to their lowland counterparts (Cheviron et al. 2012, 2014). Here, we show that this is partly due to a substantial increase in capillarity and oxidative fiber abundance in the skeletal muscle. We also show that the derived muscle phenotype of highland deer mice is associated with significant variation in gene expression across the skeletal muscle transcriptome. For several candidate genes, population differences in expression levels were associated with specific muscle phenotypes, and many of the differentially expressed genes are known to play a role in energy metabolism, muscle fiber composition, and vascular development.
High-Altitude Adaptation and Muscle Phenotype
The highly oxidative phenotype of skeletal muscle in highland deer mice (figs. 1 and 2), which occurs in conjunction with an increase in the activity of several oxidative enzymes (Cheviron et al. 2012, 2014), could have multiple potential benefits at high altitudes. Highland animals must cope with cold temperatures, so the evolution of a more oxidative muscle phenotype could enhance the capacity for shivering and possibly nonshivering thermogenesis (Mineo et al. 2012). A highly oxidative muscle phenotype should also increase the total mitochondrial respiration of an entire muscle when intracellular O2 tensions fall (Hochachka 1985; Scott, Richards, et al. 2009). This is because mitochondrial respiration can be limited by O2 during intracellular hypoxia (Gnaiger 2001), which would reduce the maximum attainable respiration of individual muscle fibers. Therefore, having more oxidative fibers should counterbalance the inhibitory effects of hypoxia on individual muscle fibers. The adaptive significance of having a more oxidative phenotype could involve one or both of these mechanisms in highland taxa that have evolved this derived trait (León-Velarde et al. 1993; Mathieu-Costello et al. 1998; Scott, Egginton, et al. 2009).
The augmented capillarity in the locomotory muscle of highland mice (figs. 1 and 3) should increase the diffusion capacity for oxygen from the blood and should therefore confer an advantage for sustaining aerobic performance in hypoxia (Wagner 1996; Scott and Milsom 2006; Cano et al. 2013). There is generally a strong relationship between the mitochondrial oxygen demands of a tissue and the capacity for oxygen supply from the microcirculation (Hepple 2000). Interestingly, the magnitude of the increase in capillarity in highlanders appears to be greater than the increase in oxidative capacity (fig. 4). This suggests that oxygen diffusion capacity is further enhanced in highlanders to improve oxygen transport in hypoxia. This should also be advantageous in highland deer mice given that they have evolved an increased hemoglobin-O2 affinity (Chappell and Snyder 1984; Storz et al. 2009; Storz, Runck, et al. 2010; Natarajan et al. 2013, 2015), as the increased muscle diffusion capacity mitigates the trade-off between pulmonary O2 loading (which is important for safeguarding arterial O2 saturation under hypoxia) and O2 unloading in the peripheral circulation.
Despite considerable differences in a range of environmental factors between the two rearing environments (e.g., temperature, ambient partial pressure of O2, humidity, food type, food availability, and biotic interactions), population differences in capillarity persisted in comparisons of both native and lab-reared F1 individuals. Similarly, the difference in the proportional abundance of oxidative fibers was generally more pronounced in comparisons between highland and lowland deer mice than in comparisons between native versus lab-reared F1 individuals with the same population-of-origin, although this trait may have also been affected by rearing environment (as revealed by a lack of significant pairwise differences between populations in the F1 mice). Although we cannot entirely rule out transgenerational epigenetic effects, these results suggest that genetic differences between highland and lowland deer mice may underlie adaptive variation in muscle phenotype. It remains possible that these traits can be further modified by phenotypic plasticity; however, the effects of cold acclimation on oxidative capacity are not consistent across studies of domestic mice. Increases in the activity of oxidative enzymes in the muscle occur in response to cold acclimation in some studies (Mineo et al. 2012) but not others (Beaudry and McClelland 2010), and the respiratory capacity of isolated mitochondria does not seem to be altered by cold acclimation (Meyer et al. 2010; Mineo et al. 2012). Likewise, combining cold and hypoxia has no effect on the activity of oxidative enzymes in the gastrocnemius muscle in domestic mice (Beaudry and McClelland 2010). Furthermore, muscle capillarity and oxidative capacity often do not change or even decrease in response to high-altitude hypoxia exposure in lowland humans and other mammals (Mathieu-Costello 2001; Levett et al. 2012; Jacobs et al. 2013). Although muscle disuse (e.g., limb immobilization) is associated with substantial changes in muscle phenotype (Clark 2009), some wild rodents experience minimal changes in muscle form and function in response to large seasonal variations in activity during hibernation or torpor (Cotton and Harlow 2010). Therefore, evolved genotypic specializations may play a more important role than phenotypic plasticity in creating the muscle phenotype of native highlanders.
Transcriptomic Basis of the High-Altitude Phenotype
The evolved differences in gene expression between highland and lowland populations suggest that regulatory changes in genes involved in aerobic metabolism have contributed to high-altitude adaptation (fig. 7). Expression of the transcriptional coactivator PGC-1α (Ppargc1a), which activates the expression of genes involved in mitochondrial metabolism (Lin et al. 2005; Lanza and Sreekumaran Nair 2010), was positively associated with the abundance of oxidative fibers in the muscle (table 3), and was expressed at higher levels in highlanders than lowlanders. Mitochondrial creatine kinase (Ckmt1), which is prevalent in slow oxidative fibers and is important for controlling oxidative phosphorylation to promote energy supply-demand coupling and metabolite stability (Hochachka 1993; Ventura-Clapier et al. 1998), was expressed at higher levels in highlanders than lowlanders. The potential importance of this enzyme in regulating mitochondrial respiration under hypoxia is supported by experimental studies in humans (Ponsot et al. 2006), rats (Walsh et al. 2006), and birds (Scott, Richards, et al. 2009). The mitochondrial isoform of creatine kinase is associated with mitochondria and is highly expressed in tissues with high ATP demands (Wallimann et al. 1992), so its upregulation in highlanders could be associated with the observed variation in expression of Ppargc1a and Tfam. Genes that encode the metabolic enzymes acetyl-coenzyme A acyltransferase (Acaa1a) and aldehyde dehydrogenase 1A1 (Aldh1a1), which are upregulated in mice selected for high levels of voluntary wheel running (Burniston et al. 2013), were also more highly expressed in highlanders than in lowlanders. Expression of Acaa1 is known to be induced by PPAR transcription factors (Guo et al. 2007), for which PGC-1α is a coactivator, suggesting a potential relationship between the patterns of variation in expression of Ppargc1a and Acaa1a. However, not all genes involved in oxidative energy metabolism were upregulated. Some mitochondrially encoded transcripts, including two of complex I of the electron transport system (ND3 and ND4, transcripts of two of the 44 subunits of NADH dehydrogenase) and one of ATP synthase (Atp6, one of nine subunits of the FO region of ATP synthase), were downregulated in highlanders. The meaning of these changes in expression is unclear, because NADH dehydrogenase and ATP synthase are multisubunit enzymes whose functions require coordinated expression of all polypeptide subunits (Duggan et al. 2011; Suarez and Moyes 2012). Nevertheless, our findings suggest that high-altitude adaptation involves substantial transcriptomic restructuring in association with a more oxidative muscle phenotype.
Changes in the expression of genes involved in regulating the capillary network also appear to have contributed to evolved phenotypic differences between highland and lowland populations. Cadherin-7 and Notch-4 in particular are expressed at higher levels in highlanders than in lowlanders. Although cadherin-7 is a N-type cadherin that is found primarily in neural tissue (Faulkner-Jones et al. 1999), its expression increases in association with angiogenesis in response to ischemia in the brain (Hayward et al. 2011) and E-type cadherins are known to be extremely important cell adhesion molecules in angiogenesis. The Notch signaling pathway is important for coordinating cell behaviors that lead to the creation of stable and patent blood vessels during angiogenesis, and the notch-4 receptor is restricted to the vascular system (Sainson and Harris 2008; Lv et al. 2013). When notch-4 is bound by its ligand (delta-like 4), signaling by the receptor inhibits vascular endothelial growth factors (VEGF) expression as well as endothelial cell proliferation and migration (Williams et al. 2005). This is notable in light of the negative association we observed between capillarity and the expression of Vegfa and other growth factors involved in promoting the proliferative and migratory stages of angiogenesis (table 3). It is possible that the highly capillarized phenotype of skeletal muscle in highlanders is initiated by growth factor signaling at an earlier stage of development, and that it is maintained during adulthood by an upregulation of notch-4 expression to stabilize the mature capillary network.
There was a negative association between muscle phenotypes and the expression of many genes. PC1 scores of module P2 expression were lower in highlanders than in lowlanders (fig. 6) (corresponding to lower abundance in highlanders for roughly half of the transcripts in module P2) and were negatively associated with several of the oxidative and capillarity phenotypes. A similar observation was made for PC1 of module T5 expression. Collectively, these modules are enriched for genes assigned to several GO processes involved in metabolism, muscle plasticity, and vascular development. The majority of significant associations between muscle phenotypes and the expression of candidate genes involved in energy metabolism, mitochondrial biogenesis, or angiogenesis was also negative (table 3). These results were surprising and unexpected because the protein products of many of the genes that were expressed at lower levels in highlanders have been shown to contribute positively to capillarity or oxidative capacity in rodents and other mammals (Lin et al. 2005; Lanza and Sreekumaran Nair 2010; Gustafsson 2011). These seemingly paradoxical results may result from the effects that differences in muscle phenotype should have on intracellular signals of oxygen and energy homeostasis. For example, differential expression of a small number of other genes (such as Notch-4) could maintain the highly capillarized phenotype of highlanders, which would increase cellular O2 supply relative to lowlanders and would presumably dampen signaling by the factors that drive the responses to oxygen limitation (such as hypoxia-inducible factors and VEGF). A negative association between muscle phenotypes and expression could thus result for genes that do not cause the differences in muscle phenotype but are sensitive to its effects.
As the increased oxidative capacity and capillarity of skeletal muscle in highland mice were not primarily attributable to phenotypic plasticity, we reasoned that the underlying genes would not exhibit plasticity in expression. Nevertheless, a large number of genes were differentially expressed between mice in the native and lab environments (figs. 5 and 6). Most of the expression differences were not associated with any muscle phenotypes, and may instead reflect transcriptomic changes associated with different aspects of natural and lab environments (table 2). Indeed, environmentally sensitive modules that were not associated with muscle phenotype were enriched for genes involved in signaling, cell migration, cell turnover, immune function, and cell stress, which may reflect the substantial differences between native and lab environments in features such as food access, diet quality, exposure to pathogens, and a range of other factors in addition to differences in O2 tension. Determining which of these environmentally sensitive genes are responding to changes in elevation will require controlled reciprocal acclimation experiments.
Conclusions
One of the goals of evolutionary physiology is to elucidate the mechanistic basis of adaptive variation in organismal performance (Garland and Carter 1994; Dalziel et al. 2009). Populations and species that have diverged across altitudinal gradients are well suited to this endeavor. They provide an opportunity to elucidate how genotypic specialization, phenotypic plasticity, and their interaction can contribute to adaptive enhancements of physiological performance in challenging environments, particularly as cold and hypoxia have well-defined impacts on the physiological systems important for exercise and thermogenesis. In this study, we show that highland deer mice have a highly oxidative and capillarized muscle phenotype that is associated with population differences in expression for a small suite of genes involved in metabolism, muscle plasticity, and vascular development. The capacity for oxygen transport and utilization in the muscle is extremely important for thermogenesis (Oufara et al. 1987; Van Sant and Hammond 2008)—an organismal performance trait with demonstrated fitness benefits in high-altitude deer mice (Hayes and O’Connor 1999)—suggesting that the unique muscle phenotype and transcriptional profile of highland deer mice are adaptive. Consistent with previous work in deer mice (Cheviron et al. 2012, 2014), these results suggest that differences in both evolved and plastic gene expression patterns contribute to fitness-related variation in physiological performance at high altitudes by altering phenotypic traits at several levels of biological organization.
Materials and Methods
Populations of Highland and Lowland Deer Mice
Adult deer mice were live trapped on the summit of Mount Evans (Clear Creek County, CO at 39 °35′18″N, 105 °38′38″W, 4,350 m above sea level) (P. m. rufinus) and at low altitude in the Great Plains (Nine Mile Prairie, Lancaster County, NE at 40 °52′12″N, 96 °48′20.3″W, 430 m above sea level) (P. m. nebracensis) as previously described (Cheviron et al. 2013, 2014). One set of mice, the in situ group, from each locality was sampled on the day of capture at their native elevation for histology and transcriptomics. Another set of mice was transported to a common-garden lab environment at the University of Nebraska (elevation 360m) and used as a parental stock to establish captive bred highland and lowland lines. From each of these lines, we sampled full-sibling F1 progeny from one highland and one lowland breeding pair. All F1 mice were born and raised to adulthood in a common normoxic environment, and were then sampled for histology and transcriptomics. Lab-raised mice were held in standard holding conditions at 25 °C with unlimited access to mouse chow and water (12 h light:12 h dark photoperiod). All experimental protocols were approved by the University of Nebraska Institutional Animal Care and Use Committee (IACUC no. 522).
Muscle Histology
Muscle capillarity and oxidative phenotype were assessed as previously described (Scott, Egginton, et al. 2009; Scott and Johnston 2012). An entire gastrocnemius muscle was dissected, coated in embedding medium, frozen in liquid N2-cooled isopentane, and stored at −80 °C. The muscle was sectioned (10 μm) transverse to muscle fiber length in a cryostat at −20 °C. Alkaline phosphatase activity was used to identify capillaries by staining in assay buffer (concentrations in mM: 1.0 nitroblue tetrazolium, 0.5 5-bromo-4-chloro-3-indoxyl phosphate, 28 NaBO2, 7 MgSO4; pH 9.3) for 1 h at room temperature. Succinate dehydrogenase activity was used to identify oxidative muscle fibers (both slow and fast), also by staining for 1 h at room temperature (assay buffer concentrations in mM: 0.6 nitroblue tetrazolium, 2.0 KH2PO4, 15.4 Na2HPO4, 16.7 sodium succinate). Slow myosin immunoreactivity using the S58 antibody was used to identify oxidative muscle fibers (Developmental Studies Hybridoma Bank, Iowa City, IA) as follows. After an initial fixation in acetone for 10 min, sections were blocked in 10% normal goat serum (made up in phosphate-buffered saline [PBS] [0.15 mol l−1, pH 7.4] containing 1% Triton X-100 and 1.5% BSA [PBS/TX/BSA]) for 1 h. They were then incubated overnight at 2 °C in S58 antibody solution (1:10 dilution in PBS/TX/BSA). The next morning, sections were treated for 10 min with Peroxidase Blocking Reagent (Dako, Burlington, ON, Canada), incubated in secondary antibody (antimouse biotin IgA; Southern Biotech, Birmingham, AL) solution (1:20 dilution in PBS/TX/BSA) for 1 h, incubated in ExtrAvidin-Peroxidase solution (1:50 dilution in PBS/TX/BSA; Sigma-Aldrich, Oakville, ON, Canada) for 30 min, and finally developed in 0.4 mg ml−1 3-amino-9-ethyl-carbazole solution (containing 0.02% H2O2 in 0.05 M sodium acetate buffer, pH 5.0) for approximately 5 min. Sections were well rinsed in PBS between each of the above steps. Images were collected using light microscopy, and stereological quantification methods were used to make unbiased measurements (Weibel 1979; Egginton 1990). We analyzed a sufficient number of images for each sample to account for heterogeneity, determined by the number required to yield a stable mean value.
There is generally a strong relationship between the capacity for oxygen diffusion from capillaries and the mitochondrial oxygen demands they are meant to support (Hepple 2000). Therefore, our expectation was that differences in muscle oxidative capacity would be associated with corresponding differences in muscle capillarity. If increases in muscle capillarity arose in highland mice to enhance O2 transport in hypoxia, then capillarity would be greater in highland mice than predicted by the normal relationship between capillarity and oxidative capacity. To assess whether there was variation in capillarity that was independent of the variation in muscle oxidative phenotype we first regressed capillary surface density to the areal density of oxidative fibers, and we then used residuals from this regression for all subsequent statistical comparisons (see below).
Histology data are generally reported as means ± standard error (except when data points from individual samples are shown). Two-factor analysis of variance and Bonferroni multiple comparisons tests were used as appropriate to assess the main effects and interactions of population and acclimation environment, and significance level of P < 0.05 was used.
Muscle Transcriptomics
We utilized previously published gastrocnemius RNA-seq data (Cheviron et al. 2014) to quantify genome-wide patterns of gene expression for 24 individuals that were also used for muscle phenotyping to determine the transcriptomic basis of variation in muscle phenotypes (native elevation group: Highland mice, n = 6; lowland mice, n = 6; Lab F1 group: Highland mice, n = 6; lowland mice, n = 6) (NCBI SRA accession number SRA091630). These data were originally used to identify the genomic basis of thermogenic performance differences between high and low elevation populations. In this study, we present a reanalysis of a subset of these data to test for associations between transcriptomic profiles and muscle phenotypes (see supplementary table S5, Supplementary Material online, for the individuals that were used from this larger data set). We isolated mRNA from gastrocnemis muscle using a micro PolyA purist kit (Ambion), and generated Illumina sequencing libraries following standard protocols (available upon request). Libraries were sequenced as 76 nt single-end reads on the Illumina Genome Analyzer IIx, five individuals were multiplexed using Illumina index primers, and were sequenced in a single lane of a flow cell. Image analysis and base calling were performed using Illumina pipeline software. Our sequencing strategy produced an average of 5.9 million reads per individual (range = 1.05–15.7 million reads/individual).
Read Mapping, Normalization, and Statistical Analysis of RNA-seq Data
We performed a series of sequential filtering steps to remove low-quality reads and base calls as well as technical artifacts stemming from library preparation. First, reads with mean Phred quality scores less than 30 were removed from the data set. Second, low-quality bases (Phred score < 30) were trimmed from these remaining high-quality sequences using the “Trim Sequences” tool in CLC Genomics Workbench 6.0.4 (Trimming settings: Trim using quality scores limit: 0.001). Finally, reads were scanned for exact matches to the known Illumina adaptor sequences using the “Trim Adaptors” tool in CLC Genomics Workbench, and if detected, they were trimmed from the sequence read. We estimated transcript abundance by mapping sequence reads to the Mus musculus genome, build 36.1, using CLC Genomics workbench (mapping settings: minimum length fraction = 0.9, minimum similarity fraction = 0.8, and maximum number of hits for a read = 10). We chose to use the well-annotated and established Mus genome as reference instead of the draft P. maniculatus genome to avoid issues associated with poor assembly and annotations that are common in draft genome assemblies (Denton et al. 2014), but this may have prevented us from estimating expression of rapidly evolving genes that are highly divergent between Mus and Peromyscus. Finally, we excluded genes with less than an average of five reads per individual because genes with low count values are typically subject to increased measurement error and reduced power to detect differential expression (Robinson and Smyth 2007). Filtering low coverage transcripts has the benefit of increasing statistical power to detect differential expression for well-sampled (i.e., high coverage) genes by reducing the number of independent tests that are performed. This filtering strategy could potentially result in bias against short, lowly transcribed genes, but we are unlikely have sufficient power to detect differential expression of such genes anyway because of their low sequence coverage. These trimming and filtering steps resulted in a final data set of 12,175 detected genes and an average of 2.6 million sequence reads per individual (range of 0.5–6.7 million reads).
We used the function calcNormFactors in the program edgeR (Robinson et al. 2010; Robinson and Oshlack 2010) to normalize read counts among individuals, and to control for differences in the total library size (number of total reads) among individuals. Following this normalization procedure, we tested for differences in transcript abundance between populations (highland vs. lowland), and rearing environments (in situ and F1) using a generalized linear model approach in edgeR. Population and rearing environment were included as the main effects, and we included a term for their interaction. We estimated model dispersion for each gene separately using the function estimateTagwiseDisp in edgeR (McCarthy et al. 2012), and tested for genes that exhibited significant expression differences between populations and/or rearing environments using a general linear model (GLM) likelihood ratio test implemented in edgeR. We controlled for multiple tests by enforcing a genome-wide FDR of 0.05 (Benjamini and Hochberg 1995).
We assessed the degree of correlation in transcript abundance among the genes with significant population or environment effects (FDR < 0.05; n = 657 genes; see Results) to define putative transcriptional modules of coexpressed genes (Ayroles et al. 2009). To do this, we calculated Pearson correlation coefficients for all pairwise gene expression values, and then used MMC to group genes according to their pairwise correlation coefficients (Ayroles et al. 2009; Stone and Ayroles 2009). To determine which of these transcriptional modules were most strongly associated with muscle phenotypes, we used PCA to summarize overall module expression. Because the first two principal component axes (PC1 and PC2) accounted for 47–100% of the explained gene expression variance within modules, PC1 and PC2 scores were used as a proxy measure to summarize overall module expression. Module-specific PC1 and PC2 scores were then used in linear regression analyses to test for associations between module expression and each of the measured phenotypes. PCA and linear regressions were performed in R (ver. 3.1.1; R Development Core Team 2014), and we corrected for multiple tests using Bonferroni adjusted P values.
Once trait-associated modules were identified, we used a suite of functional annotation tools to identify specific “biological process” GO terms associated with each module. First, we used MGI GO Term Mapper (http://www.informatics.jax.org/tools.shtml, last accessed March 25, 2015) to identify GO Slim terms associated with each gene in a given module, then we used the MGI GO Term Mapper and GOrilla (Eden et al. 2009) to test for functional enrichment of specific terms within modules, and we visualized the GOrilla output using the program REViGO (Supek et al. 2011).
In addition to these discovery-driven enrichment analyses, we tested for associations between muscle phenotype and expression level for a number of candidate genes (using linear regression analyses, as described above). We considered gene families involved in regulating energy metabolism and/or mitochondrial biogenesis, including the PPAR (Ppara, Ppard, and Pparg), the PPARγ coactivators (PGC; Ppargc1a, Ppargc1b, and Pprc1), nuclear respiratory factors 1 (Nrf1) and 2 (Nfe2l2), and mitochondrial transcription factor A (Tfam) (Lin et al. 2005; Lanza and Sreekumaran Nair 2010). We also considered a number of gene families in which one or more members are involved in angiogenesis, including VEGF (Vegfa, Vegfb, and Vegfc) and their receptors (VEGFR1, Flt1, and VEGFR2, Kdr), angiopoietins (Angpt1, Angptl2, and Angptl4) and their receptors (Tie1 and Tek), fibroblast growth factors (FGF; Fgf1, Fgf6, Fgf7, Fgf10, Fgf12, Fgf13, and Fgf14) and their receptors (FGFR; Fgfr1, Fgfr2, Fgfr3, and Fgfrl1), platelet-derived growth factors (PDGF; Pdgfa, Pdgfb, Pdgfc, and Pdgfd) and their receptors (PDGFR; Pdgfra, Pdgfrb, and Pdgfrl), and matrix metalloproteinases (MMP; Mmp2, Mmp9, Mmp13, Mmp14, Mmp15, and Mmp24) (Gustafsson 2011). We targeted all members of each particular family that were expressed in the muscle, including genes whose influence on muscle phenotype has not been previously documented.
Supplementary Material
Supplementary tables S1–S5 are available at Molecular Biology and Evolution online (http://www.mbe.oxfordjournals.org/).
Acknowledgments
The authors thank Colin Nurse, Cathy Vollmer, and Danielle Tufts for technical assistance. This research was supported by a Natural Sciences and Engineering Research Council of Canada (NSERC) Discovery Grant to G.R.S., a National Institutes of Health grant to J.F.S. (HL087216), and National Science Foundation grants to Z.A.C. (IOS-1354934) and J.F.S. (IOS-1354390).
References
- Audet GN, Meek TH, Garland T, Jr, Olfert IM. Expression of angiogenic regulators and skeletal muscle capillarity in selectively bred high aerobic capacity mice. Exp Physiol. 2011;96:1138–1150. doi: 10.1113/expphysiol.2011.057711. [DOI] [PubMed] [Google Scholar]
- Ayroles JF, Carbone MA, Stone EA, Jordan KW, Lyman RF, Magwire MM, Rollmann SM, Duncan LH, Lawrence F, Anholt RR, et al. Systems genetics of complex traits in Drosophila melanogaster. Nat Genet. 2009;41:299–307. doi: 10.1038/ng.332. [DOI] [PMC free article] [PubMed] [Google Scholar]
- Beaudry JL, McClelland GB. Thermogenesis in CD-1 mice after combined chronic hypoxia and cold acclimation. Comp Biochem Physiol B Biochem Mol Biol. 2010;157:301–309. doi: 10.1016/j.cbpb.2010.07.004. [DOI] [PubMed] [Google Scholar]
- Benjamini Y, Hochberg Y. Controlling the false discovery rate: a practical and powerful approach to multiple testing. J R Stat Soc B. 1995;57:289–300. [Google Scholar]
- Burniston JG, Meek TH, Pandey SN, Broitman-Maduro G, Maduro MF, Bronikowski AM, Garland T, Chen Y-W. Gene expression profiling of gastrocnemius of “minimuscle” mice. Physiol Genomics. 2013;45:228–236. doi: 10.1152/physiolgenomics.00149.2012. [DOI] [PMC free article] [PubMed] [Google Scholar]
- Bye A, Hoydal MA, Catalucci D, Langaas M, Kemi OJ, Beisvag V, Koch LG, Britton SL, Ellingsen Ø, Wisløff U. Gene expression profiling of skeletal muscle in exercise-trained and sedentary rats with inborn high and low VO2max. Physiol Genomics. 2008;35:213–221. doi: 10.1152/physiolgenomics.90282.2008. [DOI] [PMC free article] [PubMed] [Google Scholar]
- Cano I, Mickael M, Gomez-Cabrero D, Tegnér J, Roca J, Wagner PD. Importance of mitochondrial in maximal O2 transport and utilization: a theoretical analysis. Respir Physiol Neurobiol. 2013;189:477–483. doi: 10.1016/j.resp.2013.08.020. [DOI] [PMC free article] [PubMed] [Google Scholar]
- Chappell MA, Snyder LRG. Biochemical and physiological correlates of deer mouse α-chain hemoglobin polymorphisms. Proc Natl Acad Sci U S A. 1984;81:5484–5488. doi: 10.1073/pnas.81.17.5484. [DOI] [PMC free article] [PubMed] [Google Scholar]
- Cheviron ZA, Bachman GC, Connaty AD, McClelland GB, Storz JF. Regulatory changes contribute to the adaptive enhancement of thermogenic capacity in high-altitude deer mice. Proc Natl Acad Sci U S A. 2012;109:8635–8640. doi: 10.1073/pnas.1120523109. [DOI] [PMC free article] [PubMed] [Google Scholar]
- Cheviron ZA, Bachman GC, Storz JF. Contributions of phenotypic plasticity to differences in thermogenic performance between highland and lowland deer mice. J Exp Biol. 2013;216:1160–1166. doi: 10.1242/jeb.075598. [DOI] [PMC free article] [PubMed] [Google Scholar]
- Cheviron ZA, Brumfield RT. Genomic insights into high-altitude adaptation in vertebrates. Heredity. 2012;108:354–361. doi: 10.1038/hdy.2011.85. [DOI] [PMC free article] [PubMed] [Google Scholar]
- Cheviron ZA, Connaty AD, McClelland GB, Storz JF. Functional genomics of adaptation to hypoxic cold-stress in high-altitude deer mice: transcriptomic plasticity and thermogenic performance. Evolution. 2014;68:48–62. doi: 10.1111/evo.12257. [DOI] [PMC free article] [PubMed] [Google Scholar]
- Clark BC. In vivo alterations in skeletal muscle form and function after disuse atrophy. Med Sci Sports Exerc. 2009;41:1869–1875. doi: 10.1249/MSS.0b013e3181a645a6. [DOI] [PubMed] [Google Scholar]
- Contractor H, Stottrup NB, Cunnington C, Manlhiot C, Diesch J, Ormerod JO, Jensen R, Botker HE, Redington A, Schmidt MR, et al. Aldehyde dehydrogenase-2 inhibition blocks remote preconditioning in experimental and human models. Basic Res Cardiol. 2013;108:343. doi: 10.1007/s00395-013-0343-3. [DOI] [PubMed] [Google Scholar]
- Cotton CJ, Harlow HJ. Avoidance of skeletal muscle atrophy in spontaneous and facultative hibernators. Physiol Biochem Zool. 2010;83:551–560. doi: 10.1086/650471. [DOI] [PubMed] [Google Scholar]
- Dalziel AC, Rogers SM, Schulte PM. Linking genotypes to phenotypes and fitness: how mechanistic biology can inform molecular ecology. Mol Ecol. 2009;18:4997–5017. doi: 10.1111/j.1365-294X.2009.04427.x. [DOI] [PubMed] [Google Scholar]
- Denton JF, Lugo-Martinez J, Tucker AE, Schrider DR, Warren WC, Hahn MW. Extensive error in the number of genes inferred from draft genome assemblies. PLoS Comput. Biol. 2014;10:e1003998. doi: 10.1371/journal.pcbi.1003998. [DOI] [PMC free article] [PubMed] [Google Scholar]
- Diaz I, Smani T. New insights into the mechanisms underlying vascular and cardiac effects of urocortin. Curr Vasc Pharmacol. 2013;11:457–464. doi: 10.2174/1570161111311040009. [DOI] [PubMed] [Google Scholar]
- Duggan AT, Kocha KM, Monk CT, Bremer K, Moyes CD. Coordination of cytochrome c oxidase gene expression in the remodelling of skeletal muscle. J Exp Biol. 2011;214:1880–1887. doi: 10.1242/jeb.053322. [DOI] [PubMed] [Google Scholar]
- Eden E, Navon R, Steinfeld I, Lipson D, Yakhini Z. GOrilla: a tool for discovery and visualization of enriched GO terms in ranked gene lists. BMC Bioinformatics. 2009;10:48. doi: 10.1186/1471-2105-10-48. [DOI] [PMC free article] [PubMed] [Google Scholar]
- Egginton S. Numerical and areal density estimates of fibre type composition in a skeletal muscle (rat extensor digitorum longus) J Anat. 1990;168:73–80. [PMC free article] [PubMed] [Google Scholar]
- Faulkner-Jones BE, Godinho LNM, Reese BE, Pasquini GF, Ruefli A, Tan SS. Cloning and expression of mouse cadherin-7, a type-II cadherin isolated from the developing eye. Mol Cell Neurosci. 1999;14:1–16. doi: 10.1006/mcne.1999.0764. [DOI] [PubMed] [Google Scholar]
- Garland TJ, Carter PA. Evolutionary physiology. Annu Rev Physiol. 1994;56:579–621. doi: 10.1146/annurev.ph.56.030194.003051. [DOI] [PubMed] [Google Scholar]
- Gnaiger E. Bioenergetics at low oxygen: dependence of respiration and phosphorylation on oxygen and adenosine diphosphate supply. Respir Physiol. 2001;128:277–297. doi: 10.1016/s0034-5687(01)00307-3. [DOI] [PubMed] [Google Scholar]
- Guo Y, Jolly RA, Halstead BW, Baker TK, Stutz JP, Huffman M, Calley JN, West A, Gao H, Searfoss GH, et al. Underlying mechanisms of pharmacology and toxicity of a novel PPAR agonist revealed using rodent and canine hepatocytes. Toxicol Sci. 2007;96:294–309. doi: 10.1093/toxsci/kfm009. [DOI] [PubMed] [Google Scholar]
- Gustafsson T. Vascular remodelling in human skeletal muscle. Biochem Soc Trans. 2011;39:1628–1632. doi: 10.1042/BST20110720. [DOI] [PubMed] [Google Scholar]
- Hayes JP. Field and maximal metabolic rates of deer mice (Peromyscus maniculatus) at low and high altitudes. Physiol Zool. 1989;62:732–744. [Google Scholar]
- Hayes JP, O’Connor CS. Natural selection on thermogenic capacity of high-altitude deer mice. Evolution. 1999;53:1280–1287. doi: 10.1111/j.1558-5646.1999.tb04540.x. [DOI] [PubMed] [Google Scholar]
- Hayward NM, Yanev P, Haapasalo A, Miettinen R, Hiltunen M, Grohn O, Jolkkonen J. Chronic hyperperfusion and angiogenesis follow subacute hypoperfusion in the thalamus of rats with focal cerebral ischemia. J Cereb Blood Flow Metab. 2011;31:1119–1132. doi: 10.1038/jcbfm.2010.202. [DOI] [PMC free article] [PubMed] [Google Scholar]
- Hepple RT. Skeletal muscle: microcirculatory adaptation to metabolic demand. Med Sci Sports Exerc. 2000;32:117–123. doi: 10.1097/00005768-200001000-00018. [DOI] [PubMed] [Google Scholar]
- Hepple RT, Agey PJ, Hazelwood L, Szewczak JM, MacMillen RE, Mathieu-Costello O. Increased capillarity in leg muscle of finches living at altitude. J Appl Physiol. 1998;85:1871–1876. doi: 10.1152/jappl.1998.85.5.1871. [DOI] [PubMed] [Google Scholar]
- Hochachka PW. Exercise limitations at high altitude: the metabolic problem and search for its solution. In: Gilles R, editor. Circulation, respiration, and metabolism. Berlin (Germany): Springer-Verlag; 1985. pp. 240–249. [Google Scholar]
- Hochachka PW. Energy demand–energy supply coupling: efficiency and adaptability. In: Bicudo JEPW, editor. The vertebrate gas transport cascade: adaptations to environment and mode of life. Boca Raton (FL): CRC Press; 1993. 265-278. [Google Scholar]
- Hock RJ. The physiological effects of high altitude. New York: Macmillan; 1964. Physiological responses of deer mice to various native altitudes; Weihe WH; pp. 59–72. [Google Scholar]
- Jacobs RA, Boushel R, Wright-Paradis C, Calbet JA, Robach P, Gnaiger E, Lundby C. Mitochondrial function in human skeletal muscle following high-altitude exposure. Exp Physiol. 2013;98:245–255. doi: 10.1113/expphysiol.2012.066092. [DOI] [PubMed] [Google Scholar]
- Jankowski JE, Londoño GA, Robinson SK, Chappell MA. Exploring the role of physiology and biotic interactions in determining elevational ranges of tropical animals. Ecography. 2012;36:1–12. [Google Scholar]
- Lanza IR, Sreekumaran Nair K. Regulation of skeletal muscle mitochondrial function: genes to proteins. Acta Physiol. 2010;199:529–547. doi: 10.1111/j.1748-1716.2010.02124.x. [DOI] [PMC free article] [PubMed] [Google Scholar]
- León-Velarde F, Sanchez J, Bigard AX, Brunet A, Lesty C, Monge C. High altitude tissue adaptation in Andean coots: capillarity, fiber area, fiber type and enzymatic activities of skeletal muscle. J Comp Physiol B. 1993;163:52–58. doi: 10.1007/BF00309665. [DOI] [PubMed] [Google Scholar]
- Levett DZ, Radford EJ, Menassa DA, Graber EF, Morash AJ, Hoppeler H, Clarke K, Martin DS, Ferguson-Smith AC, Montgomery HE, et al. Acclimatization of skeletal muscle mitochondria to high-altitude hypoxia during an ascent of Everest. FASEB J. 2012;26:1431–1441. doi: 10.1096/fj.11-197772. [DOI] [PubMed] [Google Scholar]
- Lin J, Handschin C, Spiegelman BM. Metabolic control through the PGC-1 family of transcription coactivators. Cell Metab. 2005;1:361–370. doi: 10.1016/j.cmet.2005.05.004. [DOI] [PubMed] [Google Scholar]
- Lv S, Cheng G, Zhou Y, Xu G. Thymosin beta4 induces angiogenesis through Notch signaling in endothelial cells. Mol Cell Biochem. 2013;381:283–290. doi: 10.1007/s11010-013-1713-8. [DOI] [PubMed] [Google Scholar]
- Ma H, Guo R, Yu L, Zhang Y, Ren J. Aldehyde dehydrogenase 2 (ALDH2) rescues myocardial ischaemia/reperfusion injury: role of autophagy paradox and toxic aldehyde. Eur Heart J. 2011;32:1025–1038. doi: 10.1093/eurheartj/ehq253. [DOI] [PMC free article] [PubMed] [Google Scholar]
- Mathieu-Costello O. Muscle adaptation to altitude: tissue capillarity and capacity for aerobic metabolism. High Alt Med Biol. 2001;2:413–425. doi: 10.1089/15270290152608598. [DOI] [PubMed] [Google Scholar]
- Mathieu-Costello O, Agey PJ, Wu L, Szewczak JM, MacMillen RE. Increased fiber capillarization in flight muscle of finch at altitude. Respir Physiol. 1998;111:189–199. doi: 10.1016/s0034-5687(97)00119-9. [DOI] [PubMed] [Google Scholar]
- McCarthy D, Chen Y, Smyth G. Differential expression analysis of multifactor RNA-Seq experiments with respect to biological variation. Nucleic Acids Res. 2012;40:4288–4297. doi: 10.1093/nar/gks042. [DOI] [PMC free article] [PubMed] [Google Scholar]
- McGuire JA, Witt CC, Remsen JV, Jr, Corl A, Rabosky DL, Altshuler DL, Dudley R. Molecular phylogenetics and the diversification of hummingbirds. Curr Biol. 2014;24:910–916. doi: 10.1016/j.cub.2014.03.016. [DOI] [PubMed] [Google Scholar]
- Meyer CW, Willershäuser M, Jastroch M, Rourke BC, Fromme T, Oelkrug R, Heldmaier G, Klingenspor M. Adaptive thermogenesis and thermal conductance in wild-type and UCP1-KO mice. Am J Physiol Regul Integr Comp Physiol. 2010;299:R1396–R1406. doi: 10.1152/ajpregu.00021.2009. [DOI] [PMC free article] [PubMed] [Google Scholar]
- Mineo PM, Cassell EA, Roberts ME, Schaeffer PJ. Chronic cold acclimation increases thermogenic capacity, non-shivering thermogenesis and muscle citrate synthase activity in both wild-type and brown adipose tissue deficient mice. Comp Biochem Physiol A. 2012;161:395–400. doi: 10.1016/j.cbpa.2011.12.012. [DOI] [PMC free article] [PubMed] [Google Scholar]
- Moreno-Navarrete JM, Ortega F, Gomez-Serrano M, Garcia-Santos E, Ricart W, Tinahones F, Mingrone G, Peral B, Fernandez-Real JM. The MRC1/CD68 ratio is positively associated with adipose tissue lipogenesis and with muscle mitochondrial gene expression in humans. PLoS One. 2013;8:e70810. doi: 10.1371/journal.pone.0070810. [DOI] [PMC free article] [PubMed] [Google Scholar]
- Natarajan C, Hoffmann FG, Lanier HC, Wolf CJ, Cheviron ZA, Spangler ML, Weber RE, Fago A, Storz JF. Intraspecific polymorphism, interspecific divergence, and the origins of function-altering mutations in deer mouse hemoglobin. Mol Biol Evol. 2015;32:978–997. doi: 10.1093/molbev/msu403. [DOI] [PMC free article] [PubMed] [Google Scholar]
- Natarajan C, Inoguchi N, Weber RE, Fago A, Moriyama H, Storz JF. Epistasis among adaptive mutations in deer mouse hemoglobin. Science. 2013;340:1324–1327. doi: 10.1126/science.1236862. [DOI] [PMC free article] [PubMed] [Google Scholar]
- Oufara S, Barre H, Rouanet JL, Chatonnet J. Adaptation to extreme ambient temperatures in cold-acclimated gerbils and mice. Am J Physiol Regul Integr Comp Physiol. 1987;253:R39–R45. doi: 10.1152/ajpregu.1987.253.1.R39. [DOI] [PubMed] [Google Scholar]
- Ponsot E, Dufour SP, Zoll J, Doutrelau S, N’Guessan B, Geny B, Hoppeler H, Lampert E, Mettauer B, Ventura-Clapier R, et al. Exercise training in normobaric hypoxia in endurance runners. II. Improvement of mitochondrial properties in skeletal muscle. J Appl Physiol. 2006;100:1249–1257. doi: 10.1152/japplphysiol.00361.2005. [DOI] [PubMed] [Google Scholar]
- R Development Core Team. 2014. R: A language and environment for statistical computing. R Foundation for Statistical Computing, Vienna (Austria). Available from: http://www.R-project.org/
- Robinson M, McCarthy D, Smyth G. edgeR: a Bioconductor package for differential expression analysis of digital gene expression data. Bioinformatics. 2010;26:139–140. doi: 10.1093/bioinformatics/btp616. [DOI] [PMC free article] [PubMed] [Google Scholar]
- Robinson M, Oshlack A. A scaling normalization method for differential expression analysis of RNA-seq data. Genome Biol. 2010;11:R25. doi: 10.1186/gb-2010-11-3-r25. [DOI] [PMC free article] [PubMed] [Google Scholar]
- Robinson M, Smyth G. Moderated statistical tests for assessing differences in tag abundance. Bioinformatics. 2007;23:2881–2887. doi: 10.1093/bioinformatics/btm453. [DOI] [PubMed] [Google Scholar]
- Rockman MV. Reverse engineering the genotype-phenotype map with natural genetic variation. Nature. 2008;456:738–744. doi: 10.1038/nature07633. [DOI] [PubMed] [Google Scholar]
- Sainson RC, Harris AL. Regulation of angiogenesis by homotypic and heterotypic notch signalling in endothelial cells and pericytes: from basic research to potential therapies. Angiogenesis. 2008;11:41–51. doi: 10.1007/s10456-008-9098-0. [DOI] [PubMed] [Google Scholar]
- Sánchez-Cordero V. Elevation gradients of diversity for rodents and bats in Oaxaca, Mexico. Global Ecol Biogeogr. 2001;10:63–76. [Google Scholar]
- Schippers M-P, Ramirez O, Arana M, Pinedo-Bernal P, McClelland GB. Increase in carbohydrate utilization in high-altitude Andean mice. Curr Biol. 2012;22:2350–2354. doi: 10.1016/j.cub.2012.10.043. [DOI] [PubMed] [Google Scholar]
- Scott GR. Elevated performance: the unique physiology of birds that fly at high altitudes. J Exp Biol. 2011;214:2455–2462. doi: 10.1242/jeb.052548. [DOI] [PubMed] [Google Scholar]
- Scott GR, Egginton S, Richards JG, Milsom WK. Evolution of muscle phenotype for extreme high altitude flight in the bar-headed goose. Proc R Soc Lond B Biol Sci. 2009;276:3645–3653. doi: 10.1098/rspb.2009.0947. [DOI] [PMC free article] [PubMed] [Google Scholar]
- Scott GR, Johnston IA. Temperature during embryonic development has persistent effects on thermal acclimation capacity in zebrafish. Proc Natl Acad Sci U S A. 2012;109:14247–14252. doi: 10.1073/pnas.1205012109. [DOI] [PMC free article] [PubMed] [Google Scholar]
- Scott GR, Milsom WK. Flying high: a theoretical analysis of the factors limiting exercise performance in birds at altitude. Respir Physiol Neurobiol. 2006;154:284–301. doi: 10.1016/j.resp.2006.02.012. [DOI] [PubMed] [Google Scholar]
- Scott GR, Richards JG, Milsom WK. Control of respiration in flight muscle from the high-altitude bar-headed goose and low-altitude birds. Am J Physiol Regul Integr Comp Physiol. 2009;297:R1066–R1074. doi: 10.1152/ajpregu.00241.2009. [DOI] [PubMed] [Google Scholar]
- Sheafor BA. Metabolic enzyme activities across an altitudinal gradient: an examination of pikas (genus Ochotona) J Exp Biol. 2003;206:1241–1249. doi: 10.1242/jeb.00226. [DOI] [PubMed] [Google Scholar]
- Stager M, Swanson D, Cheviron ZA. Regulatory mechanisms of metabolic flexibility in the Dark-eyed Junco (Junco hyemalis) J Exp Biol. 2015;218:767–777. doi: 10.1242/jeb.113472. [DOI] [PubMed] [Google Scholar]
- Stone EA, Ayroles JF. Modulated modularity clustering as a tool for functional genomic inference. PLoS Genet. 2009;5:e1000479. doi: 10.1371/journal.pgen.1000479. [DOI] [PMC free article] [PubMed] [Google Scholar]
- Storz JF, Natarajan C, Cheviron ZA, Hoffmann FG, Kelly JK. Altitudinal variation at duplicated beta-globin genes in deer mice: effects of selection, recombination, and gene conversion. Genetics. 2012;190:203–216. doi: 10.1534/genetics.111.134494. [DOI] [PMC free article] [PubMed] [Google Scholar]
- Storz JF, Runck AM, Moriyama H, Weber RE, Fago A. Genetic differences in hemoglobin function between highland and lowland deer mice. J Exp Biol. 2010;213:2565–2574. doi: 10.1242/jeb.042598. [DOI] [PMC free article] [PubMed] [Google Scholar]
- Storz JF, Runck AM, Sabatino SJ, Kelly JK, Ferrand N, Moriyama H, Weber RE, Fago A. Evolutionary and functional insights into the mechanism underlying high-altitude adaptation of deer mouse hemoglobin. Proc Natl Acad Sci U S A. 2009;106:14450–14455. doi: 10.1073/pnas.0905224106. [DOI] [PMC free article] [PubMed] [Google Scholar]
- Storz JF, Scott GR, Cheviron ZA. Phenotypic plasticity and genetic adaptation to high-altitude hypoxia in vertebrates. J Exp Biol. 2010;213:4125–4136. doi: 10.1242/jeb.048181. [DOI] [PMC free article] [PubMed] [Google Scholar]
- Suarez RK, Moyes CD. Metabolism in the age of “omes.” J Exp Biol. 215. 2012:2351–2357. doi: 10.1242/jeb.059725. [DOI] [PubMed] [Google Scholar]
- Supek F, Bosnjak M, Skunca N, Sumc T. REVIGO summaries and visualizes long lists of Gene Ontology terms. PLos One. 2011;6:e21800. doi: 10.1371/journal.pone.0021800. [DOI] [PMC free article] [PubMed] [Google Scholar]
- Templeman NM, Schutz H, Garland TJ, McClelland GB. Do mice bred selectively for high locomotor activity have a greater reliance on lipids to power submaximal aerobic exercise? Am J Physiol Regul Integr Comp Physiol. 2012;303:R101–R111. doi: 10.1152/ajpregu.00511.2011. [DOI] [PubMed] [Google Scholar]
- Van Sant MJ, Hammond KA. Contribution of shivering and nonshivering thermogenesis to thermogenic capacity for the deer mouse (Peromyscus maniculatus) Physiol Biochem Zool. 2008;81:605–611. doi: 10.1086/588175. [DOI] [PubMed] [Google Scholar]
- Ventura-Clapier R, Kuznetsov A, Veksler V, Boehm E, Anflous K. Functional coupling of creatine kinases in muscles: species and tissue specificity. Mol Cell Biochem. 1998;184:231–247. [PubMed] [Google Scholar]
- Wagner PD. Determinants of maximal oxygen transport and utilization. Annu Rev Physiol. 1996;58:21–50. doi: 10.1146/annurev.ph.58.030196.000321. [DOI] [PubMed] [Google Scholar]
- Wallimann T, Wyss M, Brdiczka D, Nicolay K, Eppenberger HM. Intracellular compartmentation, structure and function of creatine kinase isoenzymes in tissues with high and fluctuating energy demands: the “phosphocreatine circuit” for cellular energy homeostasis. Biochem J. 1992;281(Pt 1):21–40. doi: 10.1042/bj2810021. [DOI] [PMC free article] [PubMed] [Google Scholar]
- Walsh B, Hooks RB, Hornyak JE, Koch LG, Britton SL, Hogan MC. Enhanced mitochondrial sensitivity to creatine in rats bred for high aerobic capacity. J Appl Physiol. 2006;100:1765–1769. doi: 10.1152/japplphysiol.01533.2005. [DOI] [PubMed] [Google Scholar]
- Weibel ER. Toronto (ON): 1979. Stereological methods. Academic Press. [Google Scholar]
- Williams CK, Li J-L, Murga M, Harris AL, Tosato G. Up-regulation of the Notch ligand Delta-like 4 inhibits VEGF-induced endothelial cell function. Blood. 2005;107:931–939. doi: 10.1182/blood-2005-03-1000. [DOI] [PMC free article] [PubMed] [Google Scholar]
- Zhang B, Zhang Y, La Cour KH, Richmond KL, Wang XM, Ren J. Mitochondrial aldehyde dehydrogenase obliterates endoplasmic reticulum stress-induced cardiac contractile dysfunction via correction of autophagy. Biochim Biophys Acta. 2013;1832:574–584. doi: 10.1016/j.bbadis.2013.01.013. [DOI] [PMC free article] [PubMed] [Google Scholar]
Associated Data
This section collects any data citations, data availability statements, or supplementary materials included in this article.