Abstract
Objective
The purpose of this study is to determine the relationship between cortical electrophysiological (CE) signals recorded from the surface of the brain (subdural electrocorticography, or ECoG) and signals recorded extracranially from the subgaleal (SG) space.
Methods
We simultaneously recorded several hours of continuous ECoG and SG signals from 3 human pediatric subjects, and compared power spectra of signals between a differential SG montage and several differential ECoG montages to determine the nature of the transfer function between them.
Results
We demonstrate the presence of CE signals in the SG montage in the high-gamma range (HG, 70–110 Hz), and the transfer function between 70 and 110 Hz is best characterized as a linear function of frequency. We also test an alternative transfer function, i.e. a single pole filter, to test the hypothesis of frequency dependent attenuation in that range, but find this model to be inferior to the linear model.
Conclusions
Our findings indicate that SG electrodes are capable of recording HG signals without frequency distortion compared with ECoG electrodes.
Significance
HG signals could be recorded minimally invasively from outside the skull, which could be important for clinical care or brain-computer interface applications.
Keywords: High-gamma, brain machine interface, brain computer interface, electrocorticography, electroencephalography, subgaleal
1 Introduction
Cortical electrophysiological (CE) signals are measures of local brain activity that are important for Brain-Machine Interfaces (Leuthardt et al., 2004) and numerous clinical and research applications such as the diagnosis and monitoring of neurological diseases, and building on our ever-increasing understanding of systems neuroscience (Wander et al., 2014). Low frequency bands up to approximately 50 Hz, which include canonical bands (alpha, beta, theta) are important in clinical electroencephalographic (EEG) monitoring, and are commonly recorded with scalp-surface EEG in clinical settings (Teplan, 2002). In addition to the well established utility of low frequency CE bands, high-frequency (HF) signals in the high-gamma (HG) range are becoming increasingly important in our understanding of systems neurophysiology (Wander et al., 2014), clinical applications such as seizure detection and localization (Fisher et al., 1992, Worrell et al., 2004) and in Brain-Machine Interface (BMI) applications (Leuthardt et al., 2004, Leuthardt et al., 2006, Miller et al., 2011, Wander et al., 2013), and seizure detection and localization (Zelmann et al., 2014). Compared to low frequency oscillations, HG signals in the range of 70–110 Hz are held to represent focal areas of neuronal activity that are spatially localized with high temporal resolution (Crone et al., 1998, Miller et al., 2007, Miller et al., 2014). However, activity in the HF range is low amplitude and is difficult to resolve with non-invasive methods (Darvas et al., 2010), but comparatively easy to record with invasive methods such as intracranial electrocorticography (ECoG) (Crone et al., 1998, Freeman et al., 2000). ECoG is commonly used for long-term monitoring (days to weeks) for seizure localization in with medically intractable epilepsy, and ECoG generally yields the highest quality signals of the long term recording methods commonly used in humans. Although intra-cortical (electrodes that penetrate the cortex) recording methods exist and yield very high quality single unit activity or local field potentials (LFPs), we will exclude these methods from this discussion.
A main goal of CE recording is to obtain the highest fidelity signals with the least degree of invasiveness. Electrocorticography (ECoG) is capable of providing excellent signal-to-noise-ratio (SNR) for CE signals over 100 Hz (Crone et al., 1998) and is much less susceptible to external artifacts than EEG (Ball et al., 2009). However, ECoG requires invasive surgery to place the electrodes inside the skull on the surface of the brain, and there are potential risks such as central nervous system (CNS) infection. On the other hand, the most common non-invasive method, EEG, is typically used for recording lower frequency signals (<50 Hz), although gamma (~50–70 Hz) and HG are also present in the signal at low amplitude (Darvas et al., 2010). However, placing surface electrodes is time consuming, must be repeated for each recording session and it requires skill and patience to obtain high quality electrode contact with low impedance, which are all barriers to clinical translation of BMI applications. Further, surface electrodes are much more susceptible to external (non-cortical) electrical noise from other sources such as muscles, heartbeat, and physical movement of the leads.
An alternative to existing intracranial or skin-surface recording methods is to record CE signals in the intermediate space between the skin surface and the skull, which could improve the signal quality and long-term ease of use over traditional scalp EEG with less invasiveness than ECoG. Prior modeling studies suggest that subdermal electrodes could provide accurate measurements CE signals (Subramaniyam et al., 2011). Clinical studies have been done to record low frequency oscillations with subdermally placed electrodes (Young et al., 2006, Martz et al., 2009), and Pfurtscheller and Cooper in 1975 showed frequency-dependent attenuation up to 30 Hz in humans. However, the signal properties of subdermal recording methods are still poorly understood, particularly the spectral transfer function of the HG signal as it passes through the skull. In an attempt to understand the attenuation of higher frequencies, some researchers have done in-vitro measurements. Oostendorp, Delbeke et al. (2000) showed relative frequency independent impedance from 100 Hz–10 kHz with some decrease in impedance from 1–100 Hz. A study by Akhtari et al. (2002) showed very little phase change across frequencies in the impedance measurements of live skull, suggesting a lack of filtering by this tissue. Together, these studies provide some understanding of the electrical properties of the skull, however the in-vitro nature leaves an incomplete understanding of the actual transfer function from the continuous brain activity to detector space on the skull, especially in the HG frequency range. For instance, additional factors such as the nature of these sources (e.g. amount of synchronization among a population of neurons as well as size of active cortex) and geometry of the human head could also play a major role in shaping ground-truth transfer functions.
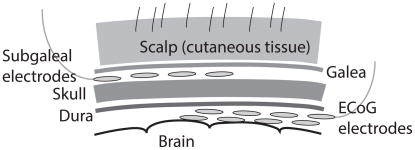
In this study we seek to quantify the in-vivo measurement sensitivity to the continuous human CE signal over a prolonged period as recorded by electrodes in the extracranial subgaleal (SG) space (beneath the skin and galea scalp layers, just superficial to the skull) as compared with intracranial ECoG electrodes in human patients undergoing invasive seizure monitoring (Figure 1). By simultaneously recording SG and ECoG CE signals, we can explore the nature of the transfer function between live cortex and skull, specifically the absence or presence of filtering properties and the range of attenuation between these two types of recordings, by recording the simultaneous SG and ECoG CE signals. In this study, we fit the SG signal to the ECoG signal in the HG range using a linear transfer function and a single pole filter transfer function, and compare the fit in the lower frequencies (outside the HG range) to assess goodness of fit.
Figure 1.
Schematic of recording electrodes. Electrodes were implanted extracranially between the skull and the galea, in the subgaleal space. Signals were compared with electrocorticography (ECoG) electrodes implanted intracranially in the subdural space.
2 Materials and Methods
2.1 Subjects and Neural Recordings
Three subjects, ages 5, 11, and 11, were studied at Seattle Children’s Hospital (SCH) while undergoing intracranial seizure localization and functional brain mapping. The study complied with the Code of Ethics of the World Medical Association (Declaration of Helsinki), and The Seattle Children’s Hospital Institutional Review Board approved the study procedures. All subjects gave informed assent to participate, and informed consent was obtained from the parent or guardian.
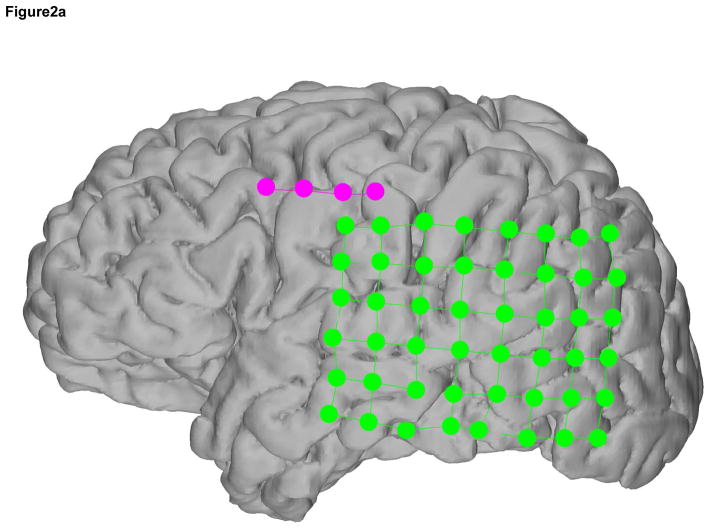
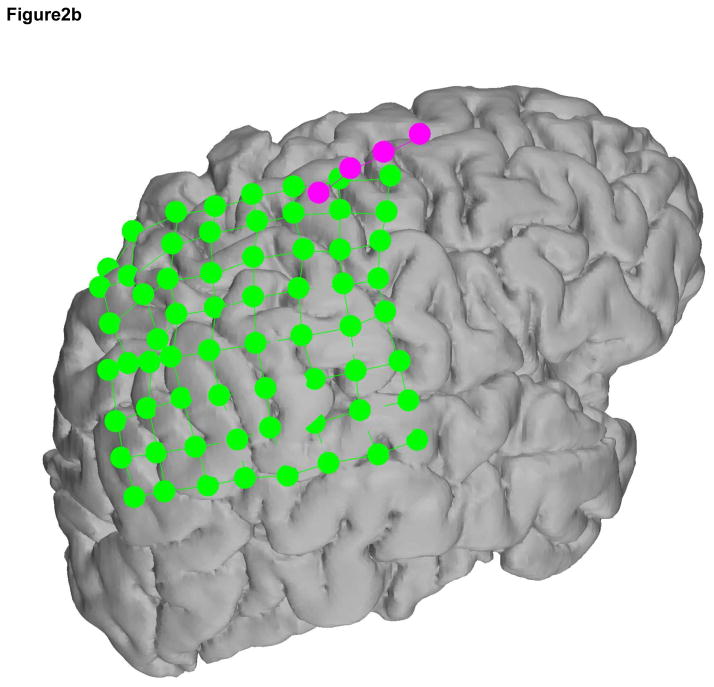
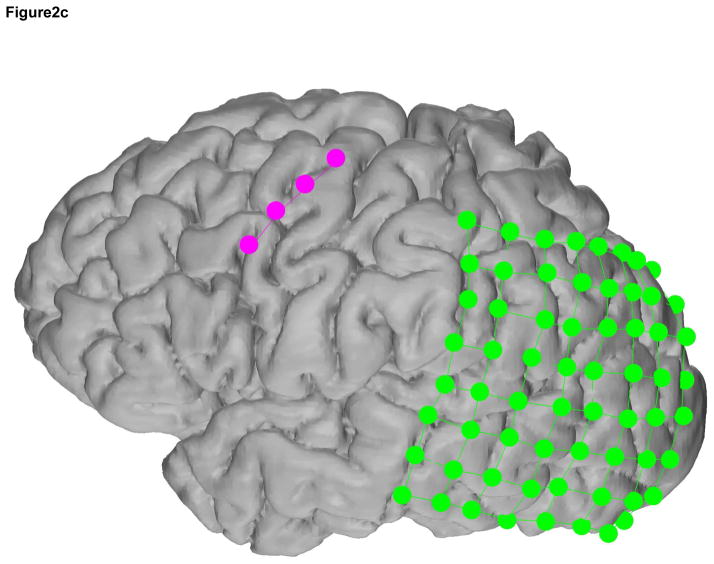
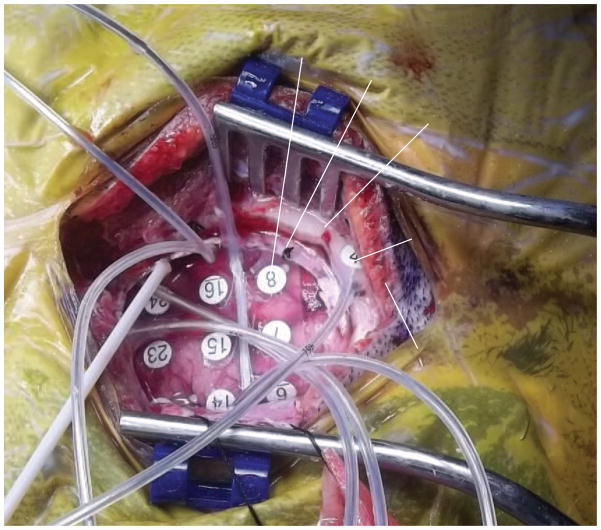
The ECoG and SG electrode locations were based on the clinical requirements for seizure localization (Integra, Plainsboro NJ, 8×8 or 8×6 arrays, 1 cm inter-electrode distance) (Figure 2, individual reconstructions in 2a, 2b, and 2c). SG 1×4 strip electrodes were placed facing the skull as ground and reference for the clinical recordings, which is standard clinical practice at SCH (Figure 3). Within the 4-electrode SG strip, the two outermost electrodes were used as ground and reference while the innermost two electrodes recorded SG neural signals (Figure 4). In all cases the two inner electrodes were a centimeter removed from the edge of the craniotomy and the skull piece that was removed during surgery was put back in place and no major open gaps in the skull were present. SG electrodes were sewed to the peri-cranium.
Figure 2.
Recording montage used in each subject a, b, and c. In each case, the 4-electrode SG strip, in magenta, contained the differential channels in the middle 2 electrodes and the ground and reference electrodes were located on the ends. The ECoG electrodes are in green.
Figure 3.
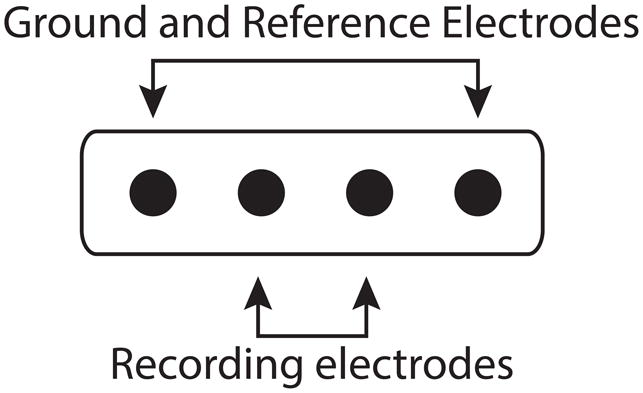
Strip electrode recording montage. Within the strip, the innermost 2 electrodes recorded the subgaleal neural signals. The outermost 2 electrodes were used as the ground and reference for the recording system.
Figure 4.
Craniotomy window with electrodes and relevant anatomy.
Cortical reconstructions were performed using custom MATLAB code as previously described by Hermes and colleagues using the clinical preoperative MRI and postoperative CT scans to co-register the electrode locations with the cortical surface renderings (Hermes et al., 2010).
Continuous data were recorded at a sampling rate of 2 kHz using an XLTEK biosignal acquisition system (Natus Medical Incorporated, San Carlos, CA). The ECoG and SG electrodes used the same SG ground and reference to minimize systemic error. This data is recorded routinely in patients before epilepsy surgery and covers a potentially wide range of behaviors.
2.2 Data Preprocessing and Segmentation
In total, we analyzed 306 pairs of ECoG electrodes in nearest-neighbor differential montages (82, 112, and 112, electrode pairs) and compared them to the 3 available SG differential pairs (1 pair in each subject). The data were split into single segments, each 50 seconds long, ranging from 21 h to 125 h per subject for a total of 1508 to 9025 single segment spectra per channel. Over such a long period, we expected some data segments to be excessively noisy, particularly in the subcutaneous bipolar channel, due to e.g. subject movement, muscle artifacts and seizure events. In all three data sets we find that over a large number of segments the standard deviation of the signal rises slowly, but has an excessively sharp increase towards the inclusion of all segments (Figure 5), which represents the noisy segments. By setting an empirical threshold at the 87th percentile of the noise floor over all segments, we find a clean subcutaneous average spectrum for all three data sets, which yielded 17–109 h of data per subject. Consequently, we also chose the 87th percentile of the noise floor for the bipolar ECoG spectra. A similar technique was used by Schumacher et al. (2011).
Figure 5.
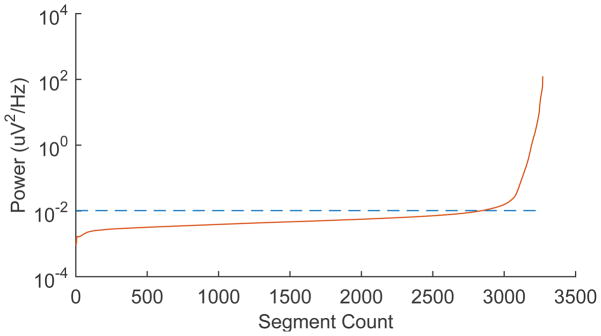
Selection criteria for low-artifact segments. ECoG and subgaleal time segments were sorted by power level. Empirical threshold was empirically set at the 87th percentile of segments to minimize the effect of artifacts.
We collected many hours of total recording time in order to approximate the “average” CE activity over very long periods relative to the time scale of interest, which ranged from ~10 ms to ~300 ms. This assumed that spatially grouped areas of the brain generated similar frequency content averaged over time. A Hanning window was applied and the power spectrum was computed via the Thomson multitaper method (Thomson, 1982) to optimize stability of the spectral estimate in the higher frequencies. For each segment, we computed the median signal power for an interval between 380 Hz and 700 Hz as an estimate of a system noise floor, i.e. a region of the spectrum at a frequency greater than 380 Hz, beyond the assumed HG range (Miller et al., 2009). The particular interval 380–700 Hz was chosen to compute the power in a range of the spectrum to avoid the anti-aliasing filter roll-off of the amplifiers. We chose the median value instead of the mean to make the power estimate of the noise floor insensitive to harmonics of the 60 Hz line noise.
2.3 Spectra Matching
In order to account for line noise when matching the SG and ECoG spectra, we removed line noise contamination from the average spectra by eliminating a 10 Hz wide window around the 60 Hz line noise frequency and harmonics. The gaps were linearly interpolated, and we smoothed the spectra with a 7.3 Hz wide moving average window to stabilize the results of the subsequent spectral matching algorithms.
We used two alternative methods to match the SG spectrum to the ECoG spectrum. In the first method, we used a linear scaling of the SG spectrum after subtracting a noise floor and the gain and noise floor of the SG spectrum were fitted. The relationship between the spectra for this model was given by:
Where Ssub(f) and SECoG(f) with f>70 Hz and f<110 Hz were the respective computed spectra for the ECoG and subcutaneous channel pairs, g represents the gain or scale, and n represents the noise floor. An exact comparison of the two types of spectra would require also a noise floor subtraction from the ECoG spectrum, but for the frequency range of interest (i.e. f< 110 Hz), the ECoG has very large power compared to the system noise floor and could be neglected without significantly changing results, hence we set nECoG = 0.
In the second method, we used a single pole Butterworth low pass filter with a variable corner frequency and gain applied to the ECoG spectrum, which was then matched to the subcutaneous spectrum, from which again a variable noise floor was subtracted. The relationship between the spectra for this model was given by:
Where fc represents the corner frequency. Method 1 has two parameters, i.e. gain or scale (g) and noise floor (n), and method 2 has three, i.e. corner frequency (fc), gain (g) and noise floor (n). Method 1 models our hypothesis, that there was only linear attenuation of the HG signal when moving from the cortex to the outer surface of the skull. Method 2 models an alternative hypothesis, and assumes that some frequency-dependent attenuation takes place in the cerebrospinal fluid (CSF)/skull layer. We formalized this assumption by using the single-pole Butterworth filter, a simple low-pass filter with the smallest number of parameters.
In the two cases, we fit the model parameters over a range from 70 to 110 Hz, i.e. we minimized:
Again, here Ssub(f) and SECoG(f) with f>70 Hz and f<110 Hz were the respective computed spectra for the ECoG and subcutaneous channel pairs. We then compared each model in the low frequency band (outside the HG band) to assess the goodness of fit.
3 Results
3.1 Noise Floor Estimation
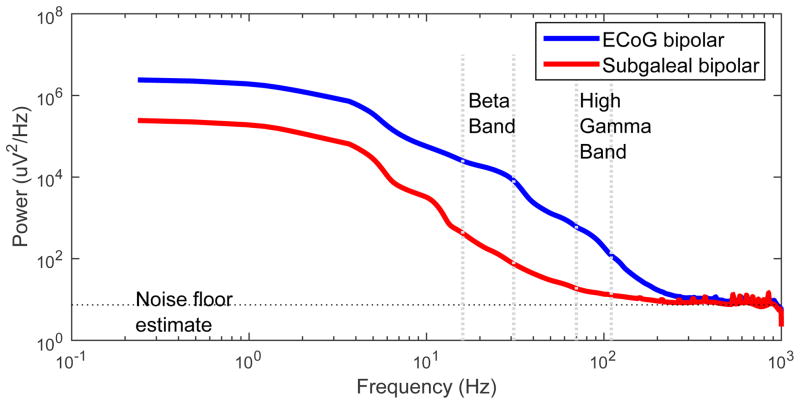
In order to approximate the signal power that can be picked up by SG electrodes, we first estimated the noise floor of the recording system. We found a similar noise floor across all ECoG electrodes within subjects: 2.35 +/− 0.04 uVfor S1, 2.027 +/−0.002 uV for S2, 2.75 +/− 0.24 uV for S3 (mean +/− standard deviation). The noise floor of the ECoG electrodes was slightly higher when compared with the SG electrodes, but very similar for the purposes of this analysis (Figure 6). Even though the noise floors between different electrode types are comparable, for fitting a model, the noise floor for the ECoG fit can be neglected, as it is much smaller than the signal in the fitting range (see Figure 6). Still, for the SG model, this noise floor value has to be taken into account, since the signal is much smaller here.
Figure 6.
Log-Log Power spectrum comparison of ECoG to SG electrodes in one example subject. Noise floor estimate is demarcated with the horizontal line. Beta (16–31 Hz) and HG (70–110 Hz) frequency bands are labeled with the vertical lines. The area under the curve but above the noise floor represents the power of neural signals in each band. Note that the ECoG and SG signals have essentially the same noise floor, and HG signal is present above the noise floor in the SG electrode.
3.2 Linear vs. Non-Linear Attenuation Across the Skull
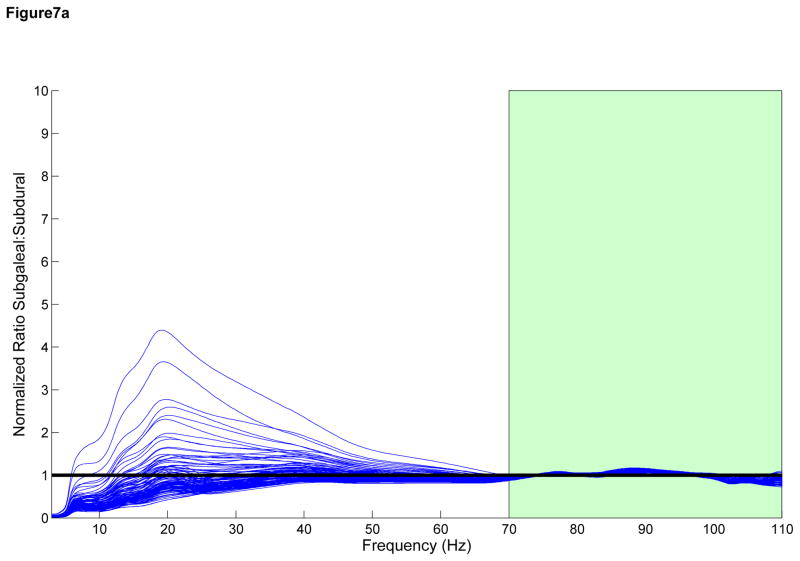
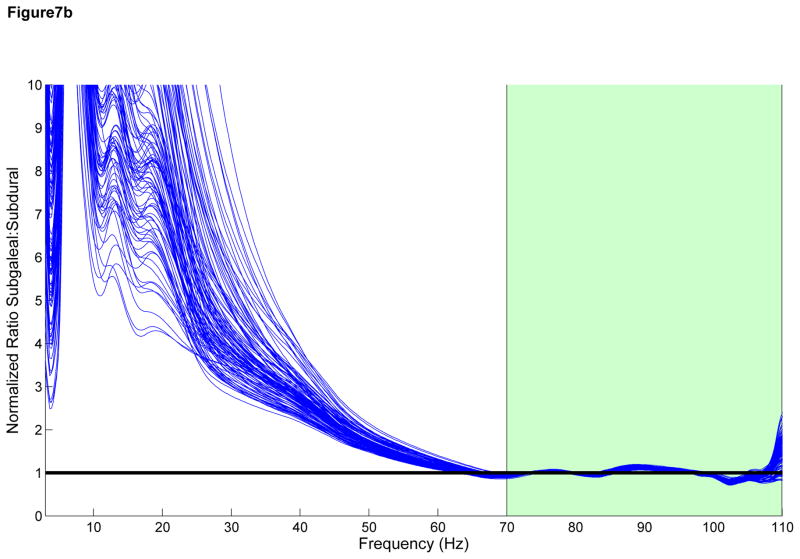
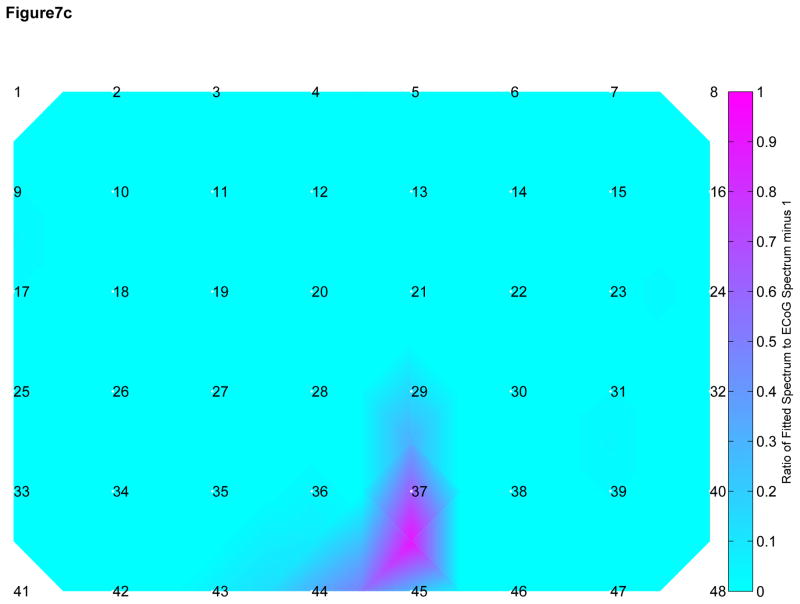
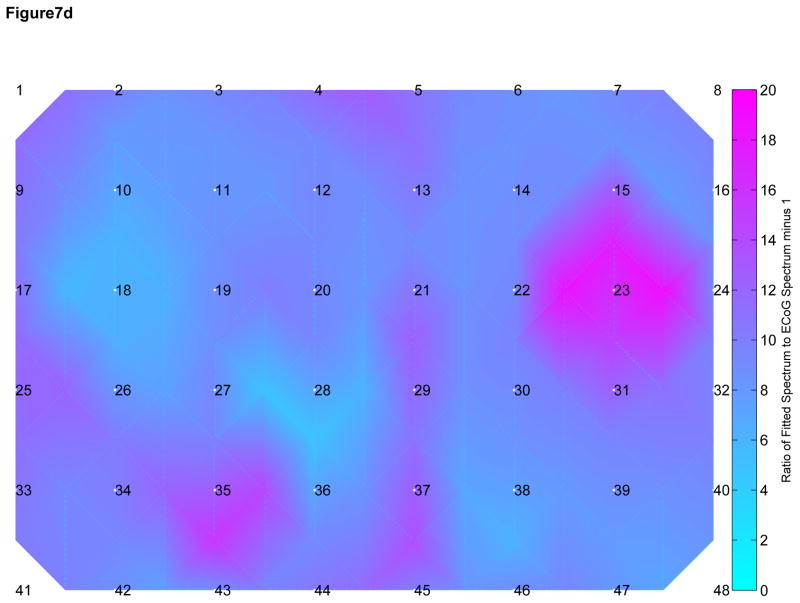
We attempted to develop a model for observed attenuation in CE signals as they pass through the skull by comparing the observed frequency spectra recorded by ECoG and SG electrodes in the range of 70 to 110 Hz. We multiplied the SG spectra by a constant to obtain an approximation of the neighboring ECoG spectra (Figure 7A). The close approximation to the ECoG spectra suggests a linear attenuation effect across the skull across all frequencies <110 Hz, including the HG range. In a similar fashion, we convolved the SG spectra with the envelope of a single-pole filter and were unable to reproduce the ECoG spectra outside of the region of fit (Figure 7B) suggesting that a single pole model may be incorrect. Within a subject, the linear fit model also resulted in more consistent fit ratios across the spatial distribution of electrodes when compared with the single pole filter model (Figure 7C and 7D), suggesting that there is little difference among electrodes within each subject.
Figure 7.
A) Subgaleal-to-ECoG normalized ratio using linear scaling model. The spectrum used to fit the model is in green, 70–110 Hz. Each line represents one SG/ECoG comparison. Note the similarity in shape among electrode pairs though there is some difference in the scaling factor. B) Subgaleal-to-ECoG normalized ratio single pole filter model for the same subject and data set. Single pole filter was chosen as the most likely type of filtering effect resulting from tissue attenuation. Note the improved fit in the frequency ranges from 30–70 Hz using the linear scaling model compared with the single pole filter (Normalized ratio of 1 indicates no difference between SG and ECoG recordings). C) Cortical spatial mapping of the ratio of subgaleal vs ECoG spectra for a linear scale factor in the range 30 to 50 Hz for one subject, plot is zero centered for visualization. Note the uniform nature of the ratio when fit with a linear scale factor compared with inhomogeneity in the single-pole filter fit in Figure 7D (note difference in color scale). Electrodes are numbered. The bipolar electrode pair (37–45) which has a slightly different linear scale factor from other electrodes, however it still exhibits good fit to the linear model. D) Cortical Mapping of the ratio of subgaleal vs. ECoG spectra for single-pole filter in one subject. Again, electrodes are numbered, note difference in scale compared to Figure 4C, where there is an order of magnitude difference.
4 Discussion
4.1 Linear Attenuation of Signal as a Function of Source Distance
In this human study of cortical signals, we found linear attenuation of HG signals without frequency dependence when recording with electrodes in the extracranial SG space as compared with intracranial ECoG electrodes. SG power spectra matched the simultaneously recorded ECoG power spectra most closely by using a linear scaling factor when compared with a single pole filter. Notably, all frequency bands of interest in human ECoG up to 110 Hz could be detected, and there was appreciable dynamic range in the HG band. Although there was some difference in the linear scale factor among electrodes, the quality of fit with the linear model was much better compared with the single pole filter model.
There is some disagreement in the literature about the nature of the transfer function across the skull. On one hand, Oostendorp et al. (2000) showed relative frequency independent in-vitro impedance from 100 Hz–10 kHz with some decrease in impedance from 1–100 Hz, and also measured in-vivo conductivities across the entire human head and found a lack of frequency dependency from 10 Hz to 1000 Hz. Akhtari et al. (2002) demonstrated very little phase change across frequencies in the impedance measurements of live skull, suggesting a lack of frequency dependent filtering.
On the other hand, some studies suggest frequency-specific filtering by the skull. Faes et al demonstrated that bone attenuates signals in a non-linear, frequency dependent fashion suggesting a capacitive, filtering effect at very high frequencies (100 Hz–10 MHz) (Faes et al., 1999), although this is mostly above our frequency range of interest. Pfurtscheller and Cooper in 1975 showed frequency-dependent attenuation up to 30 Hz (Pfurtscheller et al., 1975), which is mostly below our frequency range of interest. More recently, Duun-Henriksen et al. performed in vivo comparison of the ECoG and EEG signals by calculating the coherence, and concluded that the skull is a spatial average, but preferentially attenuates high frequencies up to 70 Hz (Duun-Henriksen et al., 2013).
In contrast, we demonstrated that the differences between the long-term averaged SG and ECoG signals can be best explained with a linear scaling factor across all frequencies, rather than a single-pole filter fit, suggesting the absence of a low-pass filtering effect of the skull. There are potential reasons for the observed differences between the two studies. In the present study, we quantified the power at each frequency whereas Duun-Henriksen used coherence of ECoG vs EEG signals to quantify similarities in the signals. While at first glance these two techniques would appear similar, there are fundamental physiological differences between low and high frequency signals that would lead to differing conclusions.
As demonstrated in prior studies (Pfurtscheller, 1988, Pfurtscheller et al., 2003, Goncalves et al., 2006), dynamic low frequency phenomena such as alpha and beta oscillations are found across relatively large areas of the cortex, similarly represented in groups of electrodes. In comparison, high frequencies in the HG range are focal phenomena representing local neuronal activity, and can be significantly different even at adjacent ECoG electrodes (Pfurtscheller et al., 2003). Therefore, as opposed to low frequency signals, HG signals recorded from a single electrode may be coherent when spatially localized (e.g. a point source), but incoherent when spatially averaged over larger areas of cortex (summation of many point sources) as occurs when recording with electrodes that are not in direct contact with the cortex. However, incoherent, spatially averaged signals would still contribute to the overall HG power, as observed in this study.
4.2 Limitations
4.2.1 Assumption that brain areas have similar frequency content over very long periods of recording
We assume in this study that all brain areas generate similar frequency content over very long recording periods (several days) and thus recording sites are spatially interchangeable between subgaleal and ECoG electrodes. This assumption allows comparison of the spectra between modalities, without having to place electrodes over the same cortical region, which e.g. could distort the recordings, as the SG electrodes would record signal from an area of cortex obscured by ECoG electrodes. While the brain is an imperfect signal generator and it is known that instantaneous high-gamma frequency content is a function of brain state, when signals are averaged over many days and types of behavior (awake, asleep, attentive, rest) it is possible that differences between neighboring electrodes are less pronounced. However, it is also important to note that our electrode coverage includes areas such as motor cortex where beta is preferentially found (Pfurtscheller et al., 2003), and the posterior-temporal and parietal-occipital regions where alpha is prominent (Niedermeyer, 1997). These could be reasons why the linear fit is not better in the frequency range <30 Hz. Additionally, the scaling factor is different among the ECoG differential pairs, which could be a result of local electrode-tissue interface variation, such as the presence of blood vessels between the cortical tissue and recording electrodes (Bleichner et al., 2011). It is important to note here that we only compare a single SG differential electrode montage with many differential ECoG electrode montages, which leads to an estimate of model parameters for each ECoG electrode, yet does not imply we have made measurements for many SG configurations, e.g. under ideal circumstances covering the whole skull. However, we compare different cortical locations with the same subgaleal site and find that the linear model, albeit with spatially variable attenuation factors, does produce the best fitting model for the transfer function. We are sufficiently far from the craniotomy site that the high gamma portion of the spectrum we used to fit should not be affected. Comparing different SG sites with different ECoG sites might produce different attenuation factors due to the spatial variability of the skull thickness, or placement of the ECoG electrode. However, based on our current observations, we expect the same linear relationship between arbitrary sites to hold. However, the well documented effects of the breach rhythm (Brigo et al., 2011) are known to affect alpha and beta rhythms (Cobb et al., 1979) and could contribute to the observed variability in the lower frequencies. Breach rhythm effects have not been characterized in the HG to our knowledge and therefore the possible impact on these findings is unknown. The SG electrodes were more than 10 mm from the craniotomy, so we would expect this impact to be small.
4.2.2 Hardware and choice of ground and reference can affect recordings
CE signal data acquisition is inherently sensitive to the choice of the hardware, as well as the circuit ground and reference. The hardware was kept constant across subjects, and we used the same ground and reference sources in our study to try to minimize the systematic error. Since signal power in the ECoG channels at HG frequencies is much stronger than the SG HG power, an ECoG reference montage for the SG electrodes would have been dominated by the power in the ECoG reference channel. For this reason, a SG ground and electrode pair was used to avoid contamination of the SG signal with intracranial recorded signal. Surface ground and reference were considered, but in an attempt to match the impedance of the recording electrode and to minimize muscle artifact, these were not used.
4.2.3 Attenuation is a function of electrical and geometrical properties
Every effort was made in this study to isolate the electrical (resistive and capacitive) component of the broadband attenuation, however the geometrical differences between the ECoG and SG electrodes, especially the lateral displacement between the groups of electrodes can also affect the results. Unfortunately, given the constraints of human ECoG research, we were not able to move the location of recording electrodes to characterize the sensitivity to lateral displacement. Another source of potential error in this study is the relative location of the SG electrodes relative to skull features such as suture lines or non-cancellous bone, which could significantly change the relative powers of the SG vs the ECoG electrodes because of differences in resistivity across suture lines compared with cancellous bone (Law, 1993), but would not likely be frequency dependent.
4.2.4 Age may impact the measurement quality
Notably, these results were obtained from pediatric subjects. Prior modeling studies by Wendel et al. (2010) suggest that subdermally recorded signals may be easier to obtain in younger subjects due to changes in skull conductivity with age. Furthermore, prior studies in this field also involved pediatric subjects. Future studies with adult subjects are warranted.
4.3 Future studies
These findings are based on time-averaged frequency content of the brain and by design obscure the time-variant nature of CE signals such as the event-related desynchronization of beta waves, or event-related activity changes in HG. Additional studies are warranted to further characterize the time-variant response of individual frequency bands such as activity-dependent changes in the primary motor area HG response during contralateral hand movement. We would expect that activity-locked HG changes would produce a higher instantaneous power when compared to HG averaged over long time periods, therefore the results of this study likely underrepresent the activity-dependent HG changes.
4.4 Implications
HF signals are known to be important in clinical care, neuroscience research, and BCI applications, and these findings suggest that we can obtain meaningful HF cortical signals in a minimally invasive fashion from outside the skull. As discussed above, these findings are from a relatively small sample of pediatric subjects and it is difficult to generalize from these results alone. On the other hand, we found the linear model to be a very good approximation of the transfer function in all three cases over a number of cortical sites. Application of these concepts could improve techniques in seizure detection and localization. It could also enable in vivo human studies of cortical activity in subjects who would not otherwise be candidates for intracranial electrodes, such as healthy subjects or clinical populations such as stroke patients. Lastly, these findings could help enable new HG brain-computer interface devices that do not require intracranial electrode placement, or the high caregiver attention associated with surface electrode placement and care.
5 Conclusion
CE frequencies in the HG band up to approximately 110 Hz are present in the signals recorded from subgaleal electrodes, and the signals appear to be linearly attenuated from the cortical surface without substantial frequency distortion.
Highlights.
We compare high-gamma (70–110 Hz) brain signals recorded with subdural and subgaleal electrodes.
Signal attenuation is modeled with linear and 1-pole filter transfer functions.
Findings suggest that the skull does not distort or selectively filter signals.
Acknowledgments
NIH R01 NS065186, NIH K01MH08611805, K12 2K12HD001097, and 5T90DA03243602, the University of Washington Department of Rehabilitation Medicine Walter C and Anita C Stolov Fund, and the University of Washington Royalty Research Fund. Award number EEC-1028725 from the National Science Foundation, and the W.M. Keck Foundation. None of the funding agencies had any role in the collection, analysis or interpretation of data, or in the writing of the manuscript.
Special thanks to Larry Sorensen, Rajesh Rao, Kai Miller, Eberhard Fetz, and our generous research subjects without whom these studies would be impossible. Thank you for support from the Center for Sensorimotor Neural Engineering (CSNE), University of Washington Department of Computer Science and Engineering, and the Rehabilitation Medicine Scientist Training Program.
Abbreviations
- CE
Cortical electrophysiological
- BMI
Brain machine interface
- ECoG
Electrocorticography
- EEG
Electroencephalography
- HF
High frequency
- HG
High-gamma
- SG
subgaleal
Footnotes
Conflict of Interest Statement
None of the authors have potential conflicts of interest to be disclosed.
The content is solely the responsibility of the authors and does not necessarily represent the official views of the National Institutes of Health.
Publisher's Disclaimer: This is a PDF file of an unedited manuscript that has been accepted for publication. As a service to our customers we are providing this early version of the manuscript. The manuscript will undergo copyediting, typesetting, and review of the resulting proof before it is published in its final citable form. Please note that during the production process errors may be discovered which could affect the content, and all legal disclaimers that apply to the journal pertain.
References
- Akhtari M, Bryant HC, Mamelak AN, Flynn ER, Heller L, Shih JJ, et al. Conductivities of three-layer live human skull. Brain Topogr. 2002;14:151–67. doi: 10.1023/a:1014590923185. [DOI] [PubMed] [Google Scholar]
- Ball T, Kern M, Mutschler I, Aertsen A, Schulze-Bonhage A. Signal quality of simultaneously recorded invasive and non-invasive EEG. Neuroimage. 2009;46:708–16. doi: 10.1016/j.neuroimage.2009.02.028. [DOI] [PubMed] [Google Scholar]
- Bleichner MG, Vansteensel MJ, Huiskamp GM, Hermes D, Aarnoutse EJ, Ferrier CH, et al. The effects of blood vessels on electrocorticography. J Neural Eng. 2011;8:044002. doi: 10.1088/1741-2560/8/4/044002. [DOI] [PubMed] [Google Scholar]
- Brigo F, Cicero R, Fiaschi A, Bongiovanni LG. The breach rhythm. Clin Neurophysiol. 2011;122:2116–20. doi: 10.1016/j.clinph.2011.07.024. [DOI] [PubMed] [Google Scholar]
- Cobb WA, Guiloff RJ, Cast J. Breach rhythm: the EEG related to skull defects. Electroencephalogr Clin Neurophysiol. 1979;47:251–71. doi: 10.1016/0013-4694(79)90278-5. [DOI] [PubMed] [Google Scholar]
- Crone NE, Miglioretti DL, Gordon B, Lesser RP. Functional mapping of human sensorimotor cortex with electrocorticographic spectral analysis. II. Event-related synchronization in the gamma band. Brain. 1998;121:2301–15. doi: 10.1093/brain/121.12.2301. [DOI] [PubMed] [Google Scholar]
- Darvas F, Scherer R, Ojemann JG, Rao RP, Miller KJ, Sorensen LB. High gamma mapping using EEG. Neuroimage. 2010;49:930–8. doi: 10.1016/j.neuroimage.2009.08.041. [DOI] [PMC free article] [PubMed] [Google Scholar]
- Duun-Henriksen J, Kjaer TW, Madsen RE, Jespersen B, Duun-Henriksen AK, Remvig LS, et al. Subdural to subgaleal EEG signal transmission: the role of distance, leakage and insulating affectors. Clin Neurophysiol. 2013;124:1570–7. doi: 10.1016/j.clinph.2013.02.112. [DOI] [PubMed] [Google Scholar]
- Faes TJ, van der Meij HA, de Munck JC, Heethaar RM. The electric resistivity of human tissues (100 Hz–10 MHz): a meta-analysis of review studies. Physiol Meas. 1999;20:R1–10. doi: 10.1088/0967-3334/20/4/201. [DOI] [PubMed] [Google Scholar]
- Fisher RS, Webber WR, Lesser RP, Arroyo S, Uematsu S. High-frequency EEG activity at the start of seizures. J Clin Neurophysiol. 1992;9:441–8. doi: 10.1097/00004691-199207010-00012. [DOI] [PubMed] [Google Scholar]
- Freeman WJ, Rogers LJ, Holmes MD, Silbergeld DL. Spatial spectral analysis of human electrocorticograms including the alpha and gamma bands. J Neurosci Methods. 2000;95:111–21. doi: 10.1016/s0165-0270(99)00160-0. [DOI] [PubMed] [Google Scholar]
- Goncalves SI, de Munck JC, Pouwels PJ, Schoonhoven R, Kuijer JP, Maurits NM, et al. Correlating the alpha rhythm to BOLD using simultaneous EEG/fMRI: inter-subject variability. Neuroimage. 2006;30:203–13. doi: 10.1016/j.neuroimage.2005.09.062. [DOI] [PubMed] [Google Scholar]
- Hermes D, Miller KJ, Noordmans HJ, Vansteensel MJ, Ramsey NF. Automated electrocorticographic electrode localization on individually rendered brain surfaces. J Neurosci Methods. 2010;185:293–8. doi: 10.1016/j.jneumeth.2009.10.005. [DOI] [PubMed] [Google Scholar]
- Law SK. Thickness and resistivity variations over the upper surface of the human skull. Brain Topogr. 1993;6:99–109. doi: 10.1007/BF01191074. [DOI] [PubMed] [Google Scholar]
- Leuthardt EC, Miller KJ, Schalk G, Rao RP, Ojemann JG. Electrocorticography-based brain computer interface--the Seattle experience. IEEE Trans Neural Syst Rehabil Eng. 2006;14:194–8. doi: 10.1109/TNSRE.2006.875536. [DOI] [PubMed] [Google Scholar]
- Leuthardt EC, Schalk G, Wolpaw JR, Ojemann JG, Moran DW. A brain-computer interface using electrocorticographic signals in humans. J Neural Eng. 2004;1:63–71. doi: 10.1088/1741-2560/1/2/001. [DOI] [PubMed] [Google Scholar]
- Martz GU, Hucek C, Quigg M. Sixty day continuous use of subdermal wire electrodes for EEG monitoring during treatment of status epilepticus. Neurocrit Care. 2009;11:223–7. doi: 10.1007/s12028-009-9215-y. [DOI] [PubMed] [Google Scholar]
- Miller KJ, Abel TJ, Hebb AO, Ojemann JG. Rapid online language mapping with electrocorticography. J Neurosurg Pediatr. 2011;7:482–90. doi: 10.3171/2011.2.PEDS1156. [DOI] [PMC free article] [PubMed] [Google Scholar]
- Miller KJ, Honey CJ, Hermes D, Rao RP, denNijs M, Ojemann JG. Broadband changes in the cortical surface potential track activation of functionally diverse neuronal populations. Neuroimage. 2014;85:711–20. doi: 10.1016/j.neuroimage.2013.08.070. [DOI] [PMC free article] [PubMed] [Google Scholar]
- Miller KJ, Leuthardt EC, Schalk G, Rao RP, Anderson NR, Moran DW, et al. Spectral changes in cortical surface potentials during motor movement. J Neurosci. 2007;27:2424–32. doi: 10.1523/JNEUROSCI.3886-06.2007. [DOI] [PMC free article] [PubMed] [Google Scholar]
- Miller KJ, Sorensen LB, Ojemann JG, den Nijs M. Power-law scaling in the brain surface electric potential. PLoS Comput Biol. 2009;5:e1000609. doi: 10.1371/journal.pcbi.1000609. [DOI] [PMC free article] [PubMed] [Google Scholar]
- Niedermeyer E. Alpha rhythms as physiological and abnormal phenomena. Int J Psychophysiol. 1997;26:31–49. doi: 10.1016/s0167-8760(97)00754-x. [DOI] [PubMed] [Google Scholar]
- Oostendorp TF, Delbeke J, Stegeman DF. The conductivity of the human skull: results of in vivo and in vitro measurements. IEEE Trans Biomed Eng. 2000;47:1487–92. doi: 10.1109/TBME.2000.880100. [DOI] [PubMed] [Google Scholar]
- Pfurtscheller G. Mapping of event-related desynchronization and type of derivation. Electroencephalogr Clin Neurophysiol. 1988;70:190–3. doi: 10.1016/0013-4694(88)90119-8. [DOI] [PubMed] [Google Scholar]
- Pfurtscheller G, Cooper R. Frequency dependence of the transmission of the EEG from cortex to scalp. Electroencephalogr Clin Neurophysiol. 1975;38:93–6. doi: 10.1016/0013-4694(75)90215-1. [DOI] [PubMed] [Google Scholar]
- Pfurtscheller G, Graimann B, Huggins JE, Levine SP, Schuh LA. Spatiotemporal patterns of beta desynchronization and gamma synchronization in corticographic data during self-paced movement. Clin Neurophysiol. 2003;114:1226–36. doi: 10.1016/s1388-2457(03)00067-1. [DOI] [PubMed] [Google Scholar]
- Schumacher EM, Westvik AS, Larsson PG, Lindemann R, Westvik J, Stiris TA. Feasibility of long-term continuous EEG monitoring during the first days of life in preterm infants: an automated quantification of the EEG activity. Pediatr Res. 2011;69:413–7. doi: 10.1203/PDR.0b013e31821267d2. [DOI] [PubMed] [Google Scholar]
- Subramaniyam NP, Wendel K, Joutsen A, Hyttinen J. Investigating the measurement capability of densely-distributed subdermal EEG electrodes. 2011 8th International Symposium on Noninvasive Functional Source Imaging of the Brain and Heart & 2011 8th International Conference on Bioelectromagnetism (NFSI & ICBEM); 2011; pp. 109–113. [DOI] [Google Scholar]
- Teplan M. Fundamentals of EEG measurement. Meas Sci Rev. 2002;2:1–11. [Google Scholar]
- Thomson DJ. Spectrum Estimation and Harmonic-Analysis. Proceedings of the IEEE. 1982;70:1055–96. [Google Scholar]
- Wander JD, Blakely T, Miller KJ, Weaver KE, Johnson LA, Olson JD, et al. Distributed cortical adaptation during learning of a brain-computer interface task. Proc Natl Acad Sci U S A. 2013;110:10818–23. doi: 10.1073/pnas.1221127110. [DOI] [PMC free article] [PubMed] [Google Scholar]
- Wander JD, Rao RP. Brain-computer interfaces: a powerful tool for scientific inquiry. Curr Opin Neurobiol. 2014;25:70–5. doi: 10.1016/j.conb.2013.11.013. [DOI] [PMC free article] [PubMed] [Google Scholar]
- Wendel K, Vaisanen J, Seemann G, Hyttinen J, Malmivuo J. The influence of age and skull conductivity on surface and subdermal bipolar EEG leads. Comput Intell Neurosci. 2010;2010:397272. doi: 10.1155/2010/397272. [DOI] [PMC free article] [PubMed] [Google Scholar]
- Worrell GA, Parish L, Cranstoun SD, Jonas R, Baltuch G, Litt B. High-frequency oscillations and seizure generation in neocortical epilepsy. Brain. 2004;127:1496–506. doi: 10.1093/brain/awh149. [DOI] [PubMed] [Google Scholar]
- Young GB, Ives JR, Chapman MG, Mirsattari SM. A comparison of subdermal wire electrodes with collodion-applied disk electrodes in long-term EEG recordings in ICU. Clin Neurophysiol. 2006;117:1376–9. doi: 10.1016/j.clinph.2006.02.006. [DOI] [PubMed] [Google Scholar]
- Zelmann R, Lina JM, Schulze-Bonhage A, Gotman J, Jacobs J. Scalp EEG is not a blur: it can see high frequency oscillations although their generators are small. Brain Topogr. 2014;27:683–704. doi: 10.1007/s10548-013-0321-y. [DOI] [PubMed] [Google Scholar]


