

Abstract
Background
Asthma is heterogeneous, and airway dysbiosis is associated with clinical features in mild-moderate asthma. Whether similar relationships exist among patients with severe asthma is unknown.
Objective
To evaluate relationships between the bronchial microbiome and features of severe asthma.
Methods
Bronchial brushings from 40 participants in the BOBCAT study (Bronchoscopic Exploratory Research Study of Biomarkers in Corticosteroid-refractory Asthma) were evaluated using 16S rRNA-based methods. Relationships to clinical and inflammatory features were analyzed among microbiome-profiled subjects. Secondarily, bacterial compositional profiles were compared between severe asthmatics, and previously studied healthy controls (n=7), and mild-moderate asthma subjects (n=41).
Results
In severe asthma, bronchial bacterial composition was associated with several disease-related features, including body-mass index (BMI; Bray-Curtis distance PERMANOVA, p < 0.05), changes in Asthma Control Questionnaire (ACQ) scores (p < 0.01), sputum total leukocytes (p = 0.06) and bronchial biopsy eosinophils (per mm2; p = 0.07). Bacterial communities associated with worsening ACQ and sputum total leukocytes (predominantly Proteobacteria) differed markedly from those associated with BMI (Bacteroidetes/Firmicutes). In contrast, improving/stable ACQ and bronchial epithelial gene expression of FKBP5, an indicator of steroid responsiveness, correlated with Actinobacteria. Mostly negative correlations were observed between biopsy eosinophils and Proteobacteria. No taxa were associated with a T-helper type 2-related epithelial gene expression signature, but expression of Th17-related genes was associated with Proteobacteria. Severe asthma subjects, compared to healthy controls or mild-moderate asthmatics, were significantly enriched in Actinobacteria, although the largest differences observed involved a Klebsiella genus member (7.8 fold-increase in severe asthma, padj < 0.001)
Conclusions
Specific microbiota are associated with and may modulate inflammatory processes in severe asthma and related phenotypes. Airway dysbiosis in severe asthma appears to differ from that observed in milder asthma in the setting of inhaled corticosteroid use.
Keywords: Microbiota, lung, inflammation, 16S rRNA, body-mass index, asthma control, steroids, T-helper type 2
Introduction
The spectrum of heterogeneity in asthma includes patients with severe disease, whose symptoms remain inadequately controlled despite treatment with current therapies1, 2. Importantly, heterogeneity within severe asthma also has been described3, 4. Different pathologic mechanisms have been proposed to underlie various asthma phenotypes5, including those meeting criteria for severe disease6.
Recent studies have expanded considerations of the role of microbial infection or colonization in asthma7–10. Reported observations include differences in lower airway bacterial composition between asthmatic and healthy individuals 7–9, 11, characterized by a greater prevalence in asthma of Proteobacteria, a large phylum that includes many potential respiratory pathogens. This prevalence of Proteobacteria also has been observed among mild asthmatics not taking regular inhaled corticosteroid (ICS) therapies7, suggesting that the presence of airway dysbiosis is associated with asthma itself and not simply a reflection of concurrent corticosteroid treatment.
In mild-moderate asthma, relationships between the airway microbiome and clinical features have been observed8. Whether similar relationships exist in severe asthma are unknown. To address this knowledge gap, we examined the bacterial microbiome in protected bronchial brushings collected from subjects with severe asthma in the BOBCAT study12. Bacterial composition was analyzed using 16S ribosomal RNA-based methods, followed by in silico predictive metagenomic analysis of bacterial groups of interest. We identified significant relationships between airway microbiota members and features of severe asthma. Additional analyses demonstrated differences in bronchial microbiota composition between this severe asthma cohort, and healthy controls and mild-moderate asthmatics, whose bronchial microbiomes were examined in an earlier study8. Our primary findings invite speculation that features of the bronchial microbiome may contribute to endotypes of severe asthma.
Materials and Methods
Severe asthma subjects and sample processing for microbiome analysis
As previously described12, BOBCAT was a multicenter, 3-visit study that enrolled 67 subjects with severe asthma defined by an FEV1 of 40% to 80% of predicted value, an Asthma Control Questionnaire (ACQ) score > 1.50 and daily ICS dose equivalent to ≥ 1000 μg beclomethasone. Subjects underwent sputum induction (Visit 2), bronchoscopy (Visit 3), and blood sampling. Medications were kept constant during the study; no corticosteroids or antibiotics were started or changed from thirty days before visit 1 through visit 3.
To ensure total DNA was extracted from the same number of protected brushes (PBs) for all evaluated subjects, and from our prior experience8 that brush extractions yield variable amounts of DNA, we required at least two brushes to evaluate for microbiome analysis. Forty subjects fulfilled this criterion, and two PBs (stored in RNALater at −80°C) were extracted. Subject characteristics were analyzed for differences between subjects whose samples were (n = 40) or were not evaluated (n = 27) for microbiome analysis, using non-parametric or parametric tests. Amplified 16S rRNA gene products (using universal primers, 27F and 1492R13) were processed for profiling using the 16S rRNA-based PhyloChip platform (Second Genome; South San Francisco, CA), as previously described8, 14.
Data analysis
Raw array data were processed as previously described 15–17, including scaling to spiked-in quantitative standards and normalization to the mean intensity of all samples. Bacterial taxa were identified based on ≥ 97% identity in 16S rRNA gene sequences (Greengenes 2011 iteration18), using published methods14, 15, 19. Details are available in the Supplement. Log2-transformed fluorescence intensities, correlative with the relative abundance of taxa20, were used for all analyses in R. Array data were normalized separately for exploratory analyses of microbiota differences between severe asthma, and previously studied8 healthy and mild-moderate asthmatics from whom PB-sampled bacterial composition had been profiled by the same platform (datasets in Table E1). The healthy control dataset included two subjects not in the earlier study8, but who had been evaluated at UCSF by the same criteria to exclude asthma.
Alpha-diversity for each sample was calculated21, 22, including Shannon and inverse Simpson indices (number and relative distribution of taxa) and Faith’s phylogenetic diversity which additionally weights phylogenetic relationships23. Bray-Curtis and Unifrac distance measures24,25 were calculated to evaluate between-sample compositional differences by ordination analyses and in PERMANOVA tests with clinical and inflammatory variables26. To identify specific taxa-to-variable relationships, correlation analyses or the Significance of Analysis of Microarrays (SAM) method, based on a univariate penalized regression approach27, were used. Adjustments for multiple comparisons were applied (Benjamini-Hochberg correction or q-values28). For predictive metagenomic analyses, PICRUSt29 was used to predict gene functions and KEGG pathways.
Airway epithelial gene expression analysis
RNA extracted from a separate epithelial brush was amplified for Agilent (Santa Clara, CA) 2-color Whole Human Genome 4×44k gene expression microarray analysis. Universal Human Reference RNA (Stratagene, La Jolla, CA) was used for the reference channel. Th2 (i.e. T-helper type 2) and Th17 scores were calculated by case-wise averaging of zero-centered gene expression data after annotation-based independent filtering30, i.e. if multiple probes correspond to an Entrez gene, the probe with the highest inter-quartile range was selected. SERPINB2, CLCA1, and POSTN were used as IL13-responsive Th2 signature genes as described previously31. CXCL1, CXCL2, CXCL3, IL8, and CSF3 were used as IL17-responsive Th17 signature genes, based on previous evidence that expression of these genes are involved in IL-17 driven pathways32–34. The data have been deposited in the NCBI GEO database (accession no. GSE65584).
Quantitative PCR (Q-PCR) studies
Total 16S rRNA gene copies as well as copy-number determinations to validate specific species of interest were assessed by Q-PCR. Further details are in the Supplemental Methods.
Results
Severe asthma subject characteristics
PBs from 40/67 subjects in BOBCAT underwent evaluation for bacterial microbiome analysis. Bacterial evaluation was not pursued in the other 27 subjects, as they lacked the requisite number of two PBs for technical consistency in source DNA extractions. Of the evaluated subjects, 30 demonstrated sufficient amplified 16S rRNA product (pre-specified threshold of ≥100 ng) for array-based profiling. Characteristics of these subjects are summarized in Table 1. Mean FEV1 % predicted (average of visit 1 and visit 2) was 59%, with a mean Asthma Control Questionnaire (ACQ) score of 2.4, indicative of poor control. Q-PCR experiments confirmed that this group had significantly higher total 16S rRNA copy numbers, compared to the other ten evaluated subjects who had insufficient 16S rRNA amplicon (i.e. low bacterial burden) for array-based profiling (Wilcoxon rank-sum test, p < 0.05).
Table 1.
Characteristics of the 30 severe asthma subjects for whom bronchial microbiome analysis was performed.
| Age (y) | 46 (20–63) |
| Caucasian (%) | 24 (80) |
| Female sex, no. (%) | 11 (37) |
| BMI (kg/m2) | 28.7 ± 6.9 (19.3–52.1) |
| FEV1:FVC | 0.73 (0.55–1.0) |
| FEV1 % predicted (visit 1) | 59.9 (34.3 – 77.7) |
| FEV1 % predicted (visit 2) | 58.3 (33.6 – 82.8) |
| Bronchodilator reversibility (%) | 13.7 (−8.6 – 38.9) |
| ACQ score visit 1 | 2.4 ± 0.6 |
| ACQ score visit 2 | 2.4 ± 0.8 |
| Prednisolone use, no. (%) | 6 (20) |
| FeNO (ppb) | 42.8 ± 37.9 (9.7–141.5) |
| Sputum eosinophil % | 5.5 ± 5.9 (0.0 – 18.8) |
| Sputum neutrophil % | 52.4 ± 28.3 (0 – 88.3) |
| Blood absolute eosinophils | 0.29 ± 0.2 (×103/μL) |
| Serum IgE (IU/mL) | 180.8 ± 202.9 (9–835.2) |
| Serum periostin (ng/mL) | 24.2 ± 7.3 |
Values are mean ± SD (% or range).
Abbrev: BMI, body-mass index; FEV1, forced expiratory volume in 1 sec; FVC, forced vital capacity; ACQ, Asthma Control Questionnaire; FeNO, fraction of exhaled nitric oxide representing the mean from visits 1 and 2.
We examined whether among the evaluated subjects, characteristics differed between those in whom bacterial compositional profiles were or were not successfully obtained. The subjects in whom microbiome analysis could be performed had significantly lower sputum eosinophil percentages (5.5% ± 5.9% vs. 17.3% ± 21.1%; p < 0.05), and a trend toward lower bronchial biopsy eosinophil numbers (31.8 ± 33.7 vs. 45.2 ± 19.3 eosinophils/mm2; p = 0.09). We also analyzed whether characteristics differed between BOBCAT participants whose samples were (n = 40) or were not evaluated (n = 27) for microbiome profiling. The evaluated group had lower mean BMI (29 vs. 34, p < 0.01) but higher numbers of biopsied IL17A- and IL17F-positive cells (p < 0.001 and p < 0.05, respectively). In both sets of analyses, there were no significant differences between compared subgroups in other clinical and inflammatory parameters, including three examined gene-expression patterns (FKBP5, Th2, and Th17).
Severe asthma features are associated with differences in airway bacterial composition
Distance-based PERMANOVA26 analyses (Bray-Curtis or weighted Unifrac distances), were performed to identify factors that might explain variation in microbial community composition amongst samples (Table 2). Identified factors included body-mass index (BMI; p < 0.05), ACQ scores at visit 2 (p < 0.05), and changes in ACQ during the study (visit 2 – visit 1, p < 0.01). Associations that trended towards significance included sputum total leukocytes (p = 0.06) and bronchial biopsy eosinophil numbers (per mm2; p = 0.07). These observations indicate that specific bacterial compositions are associated with particular disease features in this cohort. No associations with other assessed variables, including inflammatory measures from blood or bronchoalveolar lavage fluid, were found (results for all evaluated variables are available in Table E2). To visualize these relationships, ordination analysis was used [non-metric multidimensional scaling (NMDS)] (Figure 1). Regression-based linear fits to this ordination indicated that change in ACQ and sputum total leukocytes were associated with microbiome compositions distinct from those associated with BMI and with biopsy eosinophil numbers.
Table 2.
Clinical and inflammatory features of severe asthma demonstrating associations with differences in bacterial community composition, based on Bray-Curtis distance measures.
| Variable | distance-based PERMANOVA result |
|---|---|
| BMI | p < 0.05 |
| ACQ visit 2 score | p < 0.05 |
| ACQ change (visit 2 – visit 1) | p < 0.01 |
| Sputum total leukocytes | p = 0.06 |
| Biopsy eosinophil cells (mm−2) | p = 0.07 |
Figure 1.

Non-metric multidimensional scaling analysis (NMDS) based on Bray-Curtis distances showing differences in bronchial bacterial composition among 30 severe asthma subjects. Each dot represents the overall bacterial community in each subject. Vectors indicate linear regression-based fits for variables found by independent distance-based PERMANOVA testing to be associated with distinct bacterial compositions. Vector directions indicate that the specific communities associated with differences in ACQ score (ACQdiff) and sputum total leukocytes (SputLeuk) are similar to each other, and differ from specific communities associated with body-mass index (BMI) and with biopsy eosinophils (BxEos).
Distinct microbiota members are associated with different features of severe asthma
To identify specific bacterial taxa associated with these variables of interest, taxon-level correlation analyses were performed between the relative abundance of each detected taxon and each variable across all subjects. Results confirmed the ordination analyses in that taxa significantly associated with BMI were distinct from those associated with the other features. Bacteroidetes and Firmicutes comprised 54% and 26%, respectively, of the 98 taxa significantly correlated with BMI (Pearson R = 0.5 – 0.8; BH-adjusted p < 0.05; Figure 2A). This contrasted with the predominant representation of Proteobacteria among taxa uncorrelated with BMI (chi-square test, p < 0.01). Further analysis for specific compositional differences between obese (BMI ≥ 30) and non-obese subjects identified several taxa more abundant among obese subjects (Fig. 2B; R package limma moderated t-test, BH-adjusted p < 0.05). These included members of the Prevotellaceae, Mycoplasmataceae, Lachnospiraceae (Clostridium), and Spirochaetaceae (Treponema) (Table E3). Given this we explored whether obese and non-obese subjects in this microbiome-profiled group differed in other characteristics. The only significant finding was that obese subjects had fewer biopsy eosinophils than non-obese subjects (mean biopsy eosinophil#: 11.9/mm2 in high BMI vs. 45.3/mm2 in low BMI subjects; p < 0.01).
Figure 2.
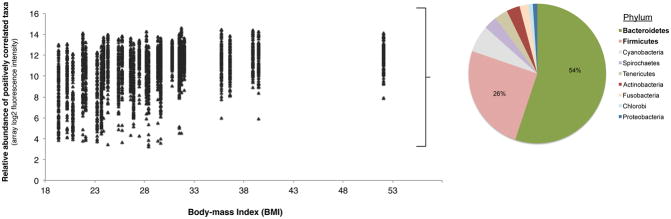

A. Relative abundance plotted against BMI for the 98 taxa found to be significantly correlated with BMI among the severe asthma subjects studied (R = 0.5 – 0.8, Benjamini-Hochberg adjusted p < 0.05). The distribution of bacterial phyla representing these taxa are shown, which are mainly Bacteroidetes and Firmicutes.
B. Differences in the relative abundance of all detected taxa between obese (BMI ≥ 30, n=10) and non-obese (n=19) severe asthma subjects. Taxa significantly enriched among obese subjects (≥ 2-fold, adjusted p < 0.10) include members of the Bacteroidetes and Firmicutes, e.g. Prevotella spp. Dashed lines indicate, respectively, 2-fold difference (log2 = 1.0) and FDR significance level of 10%. Asterisks indicate taxa most significantly greater in abundance among obese subjects (adjusted p < 0.05), also represented by larger circles in the plot.
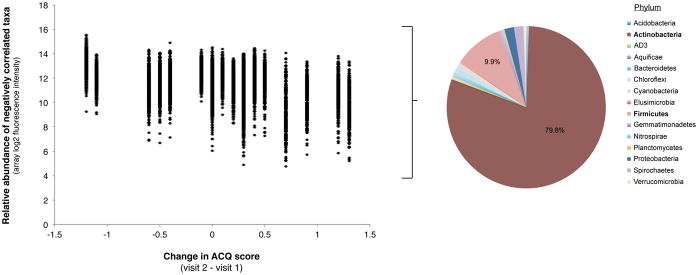
In contrast to BMI, Proteobacteria represented the majority of taxa (> 90%) whose relative abundance correlated with worsening ACQ (visit 2 – visit 1 scores; R 0.5 – 0.7, BH-adjusted p<0.05; Figure 3A). These included families representing known respiratory pathogens, such as Pasteurellaceae, Enterobacteriaceae, Neisseriaceae, Burkholderiaceae, and Pseudomonadaceae. Similar results were observed among communities significantly correlated with higher visit 2 ACQ scores (Figure E1). In contrast, taxa correlated with improving or stable ACQ were primarily Actinobacteria (80%) (Fig. 3B) such as Streptomycetaceae, Nocardiaceae, and Mycobacteriaceae. Analyses using absolute values of the change in ACQ – presumably a reflection of instability in asthma control – also showed Proteobacteria to most represent positively correlated communities (40/91 taxa; R = 0.4 – 0.6, q-value < 0.15). Total 16S rRNA copy numbers demonstrated an inverse relationship to absolute values of the change in ACQ (Spearman ρ = − 0.54; p < 0.01; Figure 3C), with a similar trend observed with inverse Simpson diversity (R = − 0.37; p = 0.09), suggesting that greater bacterial burden, in general, is associated with less variation in asthma control.
Figure 3.
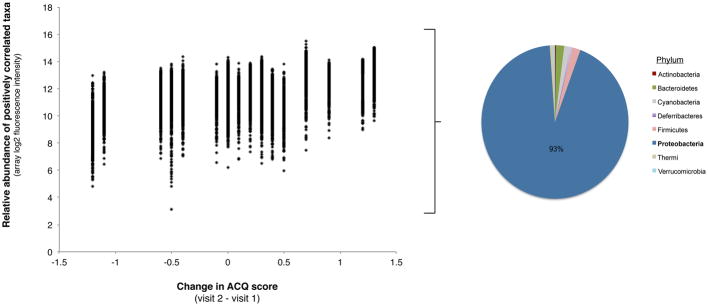

A. Relative abundance plotted against changes in ACQ score for the bacterial taxa (n=448) found to be positively correlated with this parameter (R = 0.5 – 0.7, Benjamini-Hochberg adjusted p < 0.05). Increasing values of the change in ACQ are associated with greater relative abundance predominantly of Proteobacteria phylum members.
B. Relative abundance plotted against change in ACQ score for the bacterial taxa (n=362) found to be negatively correlated with changes in ACQ score (R = −0.5 to −0.8, Benjamini-Hochberg adjusted p < 0.05). Decreasing values of the change in ACQ are associated with greater relative abundance of predominantly members of the Actinobacteria followed by Firmicutes phyla.
C. Total 16S rRNA copy numbers, a proxy for bacterial burden, are inversely correlated with absolute values of the change in ACQ (Spearman ρ = −0.54; p < 0.01).
Proteobacteria also constituted the majority of taxa (71%; 73/103 taxa) significantly correlated with sputum total leukocytes (mean ± SD: 812 ± 678 cells/mL). Families with members demonstrating strong correlations with this parameter (R = 0.6 – 0.8; BH-adjusted p < 0.05) included the Enterobacteriaceae and Moraxellaceae. Total 16S rRNA copy numbers significantly correlated with sputum total leukocytes (R = 0.4, p < 0.05), indicative that bacterial burden is associated with increased numbers of inflammatory cells.
In contrast, significant but predominantly negative associations were seen between biopsy eosinophils and the relative abundance of specific bacteria (71 taxa, R = −0.5 to − 0.74, q-value < 0.10). These negatively correlated communities were mostly Proteobacteria (64%, 45/71 taxa), followed by Firmicutes and included members of the Moraxellaceae and Helicobacteraceae (Table E4). Only two taxa demonstrated a significant positive correlation with biopsy eosinophils, both Actinobacteria (Streptomyces and Propionicimonas). Total 16S rRNA copy numbers were also inversely correlated with biopsy eosinophils (R = − 0.50, p < 0.01; Fig. 4A), suggesting that higher bacterial burden is associated with less eosinophil infiltration in bronchial tissue. We did not observe relationships between bacterial composition and other indicators of eosinophilic inflammation (e.g. sputum or blood eosinophils, FeNO, periostin).
Figure 4.

A. Total 16S rRNA copy numbers, a proxy for bacterial burden, are inversely correlated with biopsy eosinophil cells numbers (R = − 0.50, p < 0.01). Data shown represent 29/40 subjects, including the subjects in whom array-based bacterial community profiling could not be performed due to low bacterial content.
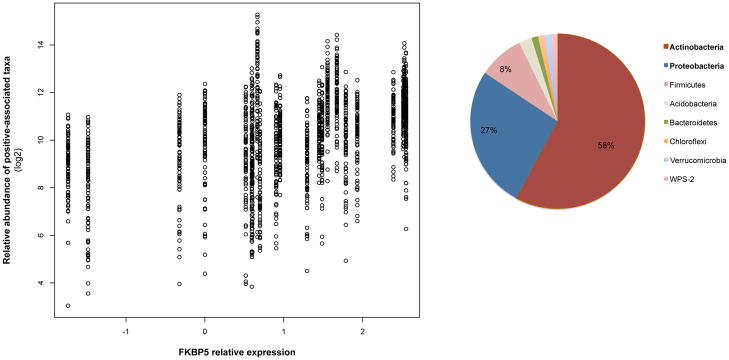
B. The relative abundance of bacterial taxa (n=83; q < 0.10) associated with FKBP5 expression plotted against the relative expression values for this gene. The phylum-level classification of these correlated communities are shown.
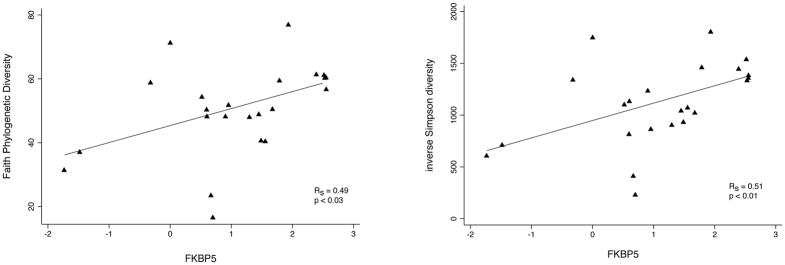
C. Strongly significant correlations are seen between FKBP5 expression and two different measures of bacterial community diversity, Faith’s phylogenetic diversity and inverse Simpson diversity index. The former weights phylogenetic relationships among communities in the diversity determination, while the latter reflects primarily community richness and evenness.
Bacterial microbiota are associated with specific airway epithelial gene expression signatures
For 33 of the 40 subjects evaluated for bacterial profiling, matched airway epithelial gene expression microarray analysis was performed (23/30 microbiome-profiled and 10/10 non-microbiome-profiled subjects). Brushes analyzed for epithelial gene expression were collected concurrently with those evaluated for microbiome profiling, presenting a unique opportunity to explore contemporaneous relationships between the microbiome and local host epithelial gene expression. We specifically explored relationships to three gene expression patterns identified by microarray analysis: a marker of steroid-response (FKBP5), T-helper type 2-associated inflammation (POSTN, CLCA1, SERPINB2)5 and Th17-associated inflammation involving genes previously shown to be involved in IL-17-driven pathways (CXCL1, CXCL2, CXCL3, CXCL8, CSF3)32–34.
Positive associations were observed between FKBP5 expression and the relative abundance of 83 taxa (SAM q-value < 0.10), largely Actinobacteria (58%) and Proteobacteria (27%) (Figure 4B). Bacterial diversity measures were also significantly correlated with FKBP5 expression (R = 0.5, p < 0.01; Figs. 4C), indicating that transcriptional evidence of steroid response is associated with increased community diversity.
No significant associations were observed between microbiota members and the T-helper type 2-related gene signature (at FDR thresholds up to 0.20). At a higher cutoff (q < 0.25), sixteen taxa demonstrated negative associations with this gene signature. These included members of the Moraxellaceae and Helicobacteraceae, which interestingly were also represented among taxa negatively correlated with biopsy eosinophils (Table E4).
Positive correlations with the Th17-associated gene expression pattern were observed for a number of taxa. These communities were mainly Proteobacteria (72%, 80/110 taxa; R = 0.5–0.7, p < 0.04, q-value < 0.20) such as Pasteurellaceae, Enterobacteriaceae, and Bacillaceae (Table E5). Although Proteobacteria also represented a proportion of taxa correlated with FKBP5 expression, the particular families largely did not overlap with those Proteobacteria families positively associated with the Th17 expression pattern. Only 11 Proteobacteria families were represented in both gene signatures among correlated taxa, in contrast to the many more Proteobacteria families associated with either signature (41 families represented only among FKBP5-correlated taxa; 57 families represented only among Th17-correlated taxa). The compositional dissimilarity of taxa correlated with these two expression patterns was also evident by NMDS analysis (Figure 5). This suggests particular airway microbiota may promote Th17 inflammation, resulting in neutrophil recruitment and contributing to neutrophilic airway inflammation independent of steroid-induced effects.
Figure 5.

Compositionally distinct bacterial taxa are positively associated with FKBP5 expression (green Fs; n=83; 58% Actinobacteria) and with the Th17-related gene expression pattern (red Ts; n=110; 72% Proteobacteria). The NMDS ordination is based on a Bray-Curtis distance matrix for all associated taxa in both expression patterns. Ellipses represent the 95% CI for the standard deviation of the distances for each group.
Predicted community functions of specific taxa related to severe asthma features
Shotgun metagenomic sequencing approaches can provide insight into functional capacities of microbiota, but to do so at high-resolution is challenging. To explore the predicted functional capacity of identified taxa of interest in this study, we applied an alternative, informatics-based approach called PICRUSt29, which utilizes 16S rRNA sequence information to infer bacterial metagenomes and was shown to recapitulate results of actual metagenomic sequencing from the Human Microbiome Project.
Representative 16S rRNA sequences for taxa demonstrating significant associations (positive and negative) with variables of interest in this study were inputted into PICRUSt. The outputs are predicted functions defined as KEGG gene orthologs and represented as KEGG pathways where these functions are known to be involved. For example, predicted functions present among taxa correlated with BMI (Figure E2), included pathways in carbohydrate digestion and absorption, insulin signaling, and microbially-related signaling and inflammation (e.g. NOD-like receptor signaling, bacterial toxins, and epithelial cell signaling in Helicobacter infection). This suggests that particular airway-associated microbiota may incite inflammatory responses among overweight/obese asthmatics in this cohort. Analysis results for predicted functions among taxa associated with asthma control (ACQ change), and with FKBP5 and Th17-related gene expression pattern are shown in Figures E3 and E4).
Bronchial microbiota differences between severe asthma, healthy controls, and mild-moderate asthma subjects
We explored whether bronchial bacterial composition differs in severe asthmatics from that profiled from previously studied healthy controls (n=7) or mild-moderate asthmatics who were on low-dose inhaled steroids (n=41; 88 μg fluticasone propionate twice daily)8. Compared to healthy controls (Figure 6A, Table E6), severe asthmatics were enriched in several taxa, with the largest fold-difference seen in a Klebsiella species (moderated t-statistic linear models, R package limma, BH-adjusted p < 0.001). Compared to mild-moderate asthmatics (Figure 6B, Table E6), severe asthma subjects also were significantly enriched in 53 taxa, the majority being Actinobacteria members (47/53) and the remaining five taxa classifying to Gammaproteobacteria (all Enterobacteriaceae). The latter included a Klebsiella species that, like in the comparison to healthy controls, exhibited the highest fold-difference in relative abundance (7.9-fold-increase in severe asthma, BH-adj p < 0.0001). Conversely, 42 taxa were more abundant in mild-moderate asthmatics relative to the severe group. These taxa represented members from multiple phyla, with several different families of Proteobacteria (19 taxa) being most represented. This contrasted from the reverse comparison wherein Enterobacteriaceae was the sole family of Proteobacteria with enriched members in severe asthma.
Figure 6.


A. Heatmap of the ten taxa found significantly enriched among severe asthmatics (n=30) compared to healthy controls (n=7) (Benjamini-Hochberg padj < 0.15; R package limma)
B. Heatmap of the 95 total taxa found to significantly differ in relative abundance between severe asthma (n=30) and mild-moderate asthma subjects (n=41) (≥ 2-fold-difference; Benjamini-Hochberg padj < 0.01; R package limma). Relative to the other group, severe asthmatics were enriched in 53 taxa, while mild-moderate asthmatics were conversely enriched in 42 taxa.
Quantitative PCR studies
QPCR using primers specific for H. influenzae14, a Pasteurellaceae member associated with worsening ACQ and also expression of Th17-related genes, confirmed a significant correlation between β-actin-normalized log-copies of H. influenzae and fluorescence intensities for the H. influenzae-represented taxon (ρ = 0.67, p < 0.02). QPCR also confirmed a strong correlation between Prevotella species abundance in samples and increased BMI (ρ = 0.61, p < 0.05; Figure E5), using primers targeting specific Prevotella spp. represented in the BMI-associated taxa. Prevotella copy numbers were also significantly higher in obese versus non-obese subjects (p < 0.05).
Discussion
In this cohort of adults with severe asthma, we observed significant relationships between the bronchial airway microbiome and clinical and inflammatory features. The findings suggest that specific members of the airway microbiota are associated with putative phenotypes of severe asthma, such as those characterized by obesity-associated disease, corticosteroid-responsive disease, or Th17-associated airway inflammation. Interestingly, microbiome-associated clinical features in this study (e.g. obesity, poor symptom control) are characteristics previously described among some severe asthma phenotypes4. A key strength of this study was the capacity to explore microbiome relationships to severe asthma-related clinical and inflammatory measures in different compartments, including blood and the lower airways. This enabled a comprehensive examination of possible microbiota relationships to underlying pathophysiologic processes reflected in these measures. We additionally explored and identified differences in bronchial bacterial composition between severe asthmatics, and healthy controls and mild-moderate asthmatic subjects whose bronchial microbiota had previously been characterized8. Our findings overall invite speculation that patterns of airway dysbiosis may contribute to putative endotypes of severe asthma or even of asthma in general.
Among severe asthmatics, BMI was strongly correlated with particular microbiota members, specifically Bacteroidetes and Firmicutes. This pattern is in striking contrast to the increased prevalence of Proteobacteria observed in milder asthma7–9, and other feature correlations observed in this study. Obese severe asthmatics also had fewer biopsy eosinophils than low BMI subjects. This invites speculation whether members of the Bacteroidetes and Firmicutes might influence the degree of eosinophilic inflammation seen in airway biopsies or alternatively, stimulate non-eosinophil-associated immune responses. These two phyla also represent gastrointestinal microbiota, suggesting the possibility of aspiration. Whether the observed BMI-associated taxa contribute to asthmatic airway inflammation cannot be answered from this study, but other lines of evidence suggest they could. Species of Prevotella represented among these taxa are potential pathogens previously associated with periodontitis and arthritis35, 36, while Lachnospiraceae belong to a Clostridia clade known to induce colonic CD4+-FOXP3+ regulatory T cells37, 38. There is thus precedence for the capacity of these organisms to potentially promote or regulate inflammation in the respiratory tract. This paralleled results from our predictive metagenomic analysis suggesting the inflammation-eliciting potential of these communities.
Worsening ACQ among severe asthmatics was associated with greater relative abundance of Proteobacteria (e.g. Enterobacteriaceae, Neisseriaceae and Pasteurellaceae, families representing potential respiratory pathogens), while improving/stable ACQ was associated with Actinobacteria. Actinobacteria are metabolically diverse and prolific producers of secondary metabolites including many with antimicrobial and anti-inflammatory properties39. Interestingly, Actinobacteria also were the main group of organisms associated with molecular evidence of response to steroids (FKBP5 expression). This suggests the possibility of certain airway microbiota being indicative of asthma responsive to steroids, of adherence to prescribed therapy, or even their involvement in mechanisms of steroid-response.
Study limitations include the site and timing of PB collection and the exclusion of other parent study subjects. PBs evaluated for microbiome analysis sampled at least two mucosal sites, with concurrently collected brushes used for gene-expression studies, a strength of this study. While bronchoscopy followed earlier visit measurements of variables considered in our analyses (e.g. ACQ), there were no respiratory illnesses or medication changes to have influenced the bacteria identified. We cannot completely rule out possible biases related to the exclusion of, for technical reasons, other parent study subjects. However, a systematic analysis found only significant differences between evaluated and non-evaluated BOBCAT subjects in BMI and biopsied numbers of IL17(+) cells. Finally, the primary aim of our study was to examine bronchial microbiome relationships to features of severe asthma. No control group was enrolled and identically studied in BOBCAT. We therefore performed a focused comparison of bronchial bacterial composition in severe asthma to that profiled previously by the same methods from PBs of healthy controls and mild-moderate asthmatics, studied earlier8. Despite study differences and other potential biases that cannot be completely controlled, our findings suggest the following. First, airway dysbiosis is a feature of severe asthma and differs from that seen in milder asthma on lower doses of inhaled corticosteroids. Secondly, different microbiota, even within the same bacterial phylum (e.g. Proteobacteria), family, or even genus are implicated in different phenotypic features of asthma, from putative disease-driving mechanisms (e.g. Th17-related or non-type 2 airway inflammation) to potential modulation of treatment responses (e.g. corticosteroids).
A surprising observation was the overall absence of positive relationships between bacterial composition and indicators of type 2-driven inflammation, from epithelial expression of type 2-responsive genes to various markers of eosinophil-related inflammation. Indeed, only biopsy eosinophils demonstrated significant but predominantly negative correlations with bacterial microbiota members. The use of high-dose inhaled corticosteroids could suppress these measures, although mean sputum eosinophil percentage was elevated among subjects in whom microbiome profiling could be performed and these percentages correlated with relative expression of the type 2-responsive epithelial gene signature (Spearman ρ = 0.53, p < 0.05). Other markers (e.g. FeNO, periostin, and blood or sputum eosinophils) also did not demonstrate relationships to bacterial composition. Anti-bacterial effects of eosinophils is a consideration for these findings. However, since DNA-based detection methods were used, we expect that any DNA present from killed bacteria should still be detectable. Other possibilities include that heterogeneity within the cohort masked bacterial associations with type 2-related inflammation, or that other microbial kingdoms such as fungi, previously observed to be reciprocally related to bacterial abundance40, play a larger role in driving these responses.
Finally, we identified a group of mainly Proteobacteria significantly associated with epithelial expression of Th17 inflammation-related genes41. Th17 cells, via IL-17A and IL-17F, promote neutrophil recruitment and have been invoked as a non-eosinophilic/non-type 2 pathway in asthma42. Asthmatics without evident type 2-driven inflammation are less responsive to inhaled corticosteroids5. In mice Th17 cell-mediated airway inflammation is resistant to steroid treatment43. Our finding suggests that neutrophil-predominant airway inflammation in asthma could also represent responses to bacterial infection, and not solely reflect steroidal effects. Although we did not identify specific taxa associated with sputum neutrophils, this is not entirely surprising for in this cohort, sputum neutrophil percentage was not found to be concordant with other measures of airway inflammation44.
In summary, results of this study suggest the airway microbiome may be highly pertinent to non-type 2 pathways in severe asthma and influence manifestations of particular disease features. Further dissection of the microbiome’s role in asthma-related immune responses will require additional study of asthma patients with varying disease severity and phenotypes, and consideration of other microbiota (e.g. fungi). Our findings also suggest future mechanism-oriented investigations of specific microbial targets. Future investigations involving larger cohorts of patients with well-characterized asthma will likely be necessary to dissect the complex relationships between the airway microbiome and distinct asthma phenotypes.
Supplementary Material
Bacterial phyla representing taxa positively (n=166) and negatively (n=85) correlated with ACQ visit 2 scores (Pearson R = 0.5 – 0.7, q-value < 0.05).
Predicted bacterial community functions represented among taxa positively and negatively correlated with BMI. Representative 16S rRNA gene sequences for taxa significantly correlated with BMI were used as inputs for PICRUSt (Langille et al. 2013). KEGG pathways shown in the figure are biologic pathways in which the predicted functions are known to participate.
Predicted bacterial community functions (KEGG pathways) represented among taxa significantly associated with change in ACQ.
Predicted bacterial community functions represented among taxa positively associated with FKBP5 expression and the Th17 inflammation gene signature.
Significant correlation is observed between body mass index (BMI) and Prevotella spp. copy numbers (normalized to b-actin) determined by quantitative PCR.
G2 PhyloChip dataset used for primary analyses of severe asthma cohort (normalized, log2-transformed fluorescence intensities).
G2 PhyloChip dataset used for comparison of severe asthma (SA) vs. healthy subjects. Values are normalized, log2-transformed fluorescence intensities.
G2 PhyloChip dataset used for comparison of severe asthma vs. mild-moderate asthma subjects (Ref.8) (normalized, log2-transformed fluorescence intensities).
Results of distance-based PERMANOVA testing for bacterial microbiome associations with all clinical inflammatory data assessed of severe asthma subjects in the BOBCAT study (Jia et al. JACI 2012)
Airway bacterial communities demonstrating the largest fold-differences in relative abundance in obese vs. non-obese severe asthma subjects (Benjamini-Hochberg adjusted p < 0.10).
Bacterial taxa significantly correlated with bronchial biopsy eosinophil numbers. The majority of correlations were negative (Pearson R = −0.5 to −0.7, q-value <0.10). Only two taxa exhibited positive correlations at the specified level of significance.
Bacterial taxa demonstrating the strongest correlations with the Th17/neutrophilic inflammation gene signature (Pearson R 0.5 – 0.7, q-value ≤ 0.20). Taxa are sorted by the magnitude of correlation from positive (110 taxa) to negative (186 taxa).
Bacterial taxa significantly enriched or depleted in severe asthma vs. healthy controls or mild-moderate asthmatics, per the comparisons shown. (≥ 2-fold difference, Benjamini-Hochberg adjusted p values; linear models based on moderated t-statistics, R package limma).
Clinical Implications.
In severe asthma, specific airway bacterial microbiota, are associated with clinical and inflammatory features, including obesity and asthma control but not markers of eosinophilic or type 2-related airway inflammation.
Acknowledgments
Funding: Genentech (to H. Boushey), NIH/NHLBI (Y.J. Huang; HL105572), and support from the Sandler Family Foundation (Boushey),
Support for this study was funded by Genentech (investigator award to H.A. Boushey), NIH/NHLBI (HL105572 to Y.J. Huang), and the Sandler Family Foundation (Boushey). The authors thank Ali Faruqi for his guidance in the PICRUSt analyses.
Abbreviations
- 16S rRNA
16S ribosomal RNA
- ACQ
Asthma Control Questionnaire
- BMI
body-mass index
- BOBCAT
Bronchoscopic Exploratory Research Study of Biomarkers in Corticosteroid-refractory Asthma
- FKBP5 gene
FK506 binding protein
- ICS
inhaled corticosteroids
- NMDS
non-metric multidimensional scaling
- PICRUSt
Phylogenetic Investigation of Communities by Reconstruction of Unobserved States
Footnotes
Publisher's Disclaimer: This is a PDF file of an unedited manuscript that has been accepted for publication. As a service to our customers we are providing this early version of the manuscript. The manuscript will undergo copyediting, typesetting, and review of the resulting proof before it is published in its final citable form. Please note that during the production process errors may be discovered which could affect the content, and all legal disclaimers that apply to the journal pertain.
References
- 1.Wener RR, Bel EH. Severe refractory asthma: an update. Eur Respir Rev. 2013;22:227–35. doi: 10.1183/09059180.00001913. [DOI] [PMC free article] [PubMed] [Google Scholar]
- 2.Chung KF, Wenzel SE, Brozek JL, Bush A, Castro M, Sterk PJ, et al. International ERS/ATS guidelines on definition, evaluation and treatment of severe asthma. Eur Respir J. 2014;43:343–73. doi: 10.1183/09031936.00202013. [DOI] [PubMed] [Google Scholar]
- 3.Wu W, Bleecker E, Moore W, Busse WW, Castro M, Chung KF, et al. Unsupervised phenotyping of Severe Asthma Research Program participants using expanded lung data. J Allergy Clin Immunol. 2014;133:1280–8. doi: 10.1016/j.jaci.2013.11.042. [DOI] [PMC free article] [PubMed] [Google Scholar]
- 4.Moore WC, Meyers DA, Wenzel SE, Teague WG, Li H, Li X, et al. Identification of asthma phenotypes using cluster analysis in the Severe Asthma Research Program. Am J Respir Crit Care Med. 2010;181:315–23. doi: 10.1164/rccm.200906-0896OC. [DOI] [PMC free article] [PubMed] [Google Scholar]
- 5.Woodruff PG, Modrek B, Choy DF, Jia G, Abbas AR, Ellwanger A, et al. T-helper type 2-driven inflammation defines major subphenotypes of asthma. Am J Respir Crit Care Med. 2009;180:388–95. doi: 10.1164/rccm.200903-0392OC. [DOI] [PMC free article] [PubMed] [Google Scholar]
- 6.Wenzel S. Severe asthma: from characteristics to phenotypes to endotypes. Clin Exp Allergy. 2012;42:650–8. doi: 10.1111/j.1365-2222.2011.03929.x. [DOI] [PubMed] [Google Scholar]
- 7.Marri PR, Stern DA, Wright AL, Billheimer D, Martinez FD. Asthma-associated differences in microbial composition of induced sputum. J Allergy Clin Immunol. 2013;131:346–52. e1–3. doi: 10.1016/j.jaci.2012.11.013. [DOI] [PMC free article] [PubMed] [Google Scholar]
- 8.Huang YJ, Nelson CE, Brodie EL, Desantis TZ, Baek MS, Liu J, et al. Airway microbiota and bronchial hyperresponsiveness in patients with suboptimally controlled asthma. J Allergy Clin Immunol. 2011;127:372–81. 3. doi: 10.1016/j.jaci.2010.10.048. [DOI] [PMC free article] [PubMed] [Google Scholar]
- 9.Hilty M, Burke C, Pedro H, Cardenas P, Bush A, Bossley C, et al. Disordered microbial communities in asthmatic airways. PLoS One. 2010;5:e8578. doi: 10.1371/journal.pone.0008578. [DOI] [PMC free article] [PubMed] [Google Scholar]
- 10.Gollwitzer ES, Saglani S, Trompette A, Yadava K, Sherburn R, McCoy KD, et al. Lung microbiota promotes tolerance to allergens in neonates via PD-L1. Nat Med. 2014;20:642–7. doi: 10.1038/nm.3568. [DOI] [PubMed] [Google Scholar]
- 11.Slater M, Rivett DW, Williams L, Martin M, Harrison T, Sayers I, et al. The impact of azithromycin therapy on the airway microbiota in asthma. Thorax. 2014;69:673–4. doi: 10.1136/thoraxjnl-2013-204517. [DOI] [PMC free article] [PubMed] [Google Scholar]
- 12.Jia G, Erickson RW, Choy DF, Mosesova S, Wu LC, Solberg OD, et al. Periostin is a systemic biomarker of eosinophilic airway inflammation in asthmatic patients. J Allergy Clin Immunol. 2012;130:647–54. e10. doi: 10.1016/j.jaci.2012.06.025. [DOI] [PMC free article] [PubMed] [Google Scholar]
- 13.Lane DJ. 16S/23S rRNA sequencing. Chichester, United Kingdom: Wiley; 1991. [Google Scholar]
- 14.Huang YJ, Sethi S, Murphy T, Nariya S, Boushey HA, Lynch SV. Airway microbiome dynamics in exacerbations of chronic obstructive pulmonary disease. J Clin Microbiol. 2014;52:2813–23. doi: 10.1128/JCM.00035-14. [DOI] [PMC free article] [PubMed] [Google Scholar]
- 15.Hazen TC, Dubinsky EA, DeSantis TZ, Andersen GL, Piceno YM, Singh N, et al. Deep-sea oil plume enriches indigenous oil-degrading bacteria. Science. 2010;330:204–8. doi: 10.1126/science.1195979. [DOI] [PubMed] [Google Scholar]
- 16.DeSantis TZ, Brodie EL, Moberg JP, Zubieta IX, Piceno YM, Andersen GL. High-density universal 16S rRNA microarray analysis reveals broader diversity than typical clone library when sampling the environment. Microb Ecol. 2007;53:371–83. doi: 10.1007/s00248-006-9134-9. [DOI] [PubMed] [Google Scholar]
- 17.Brodie EL, Desantis TZ, Joyner DC, Baek SM, Larsen JT, Andersen GL, et al. Application of a high-density oligonucleotide microarray approach to study bacterial population dynamics during uranium reduction and reoxidation. Appl Environ Microbiol. 2006;72:6288–98. doi: 10.1128/AEM.00246-06. [DOI] [PMC free article] [PubMed] [Google Scholar]
- 18.McDonald D, Price MN, Goodrich J, Nawrocki EP, DeSantis TZ, Probst A, et al. An improved Greengenes taxonomy with explicit ranks for ecological and evolutionary analyses of bacteria and archaea. ISME J. 2012;6:610–8. doi: 10.1038/ismej.2011.139. [DOI] [PMC free article] [PubMed] [Google Scholar]
- 19.Vilchez-Vargas R, Geffers R, Suarez-Diez M, Conte I, Waliczek A, Kaser VS, et al. Analysis of the microbial gene landscape and transcriptome for aromatic pollutants and alkane degradation using a novel internally calibrated microarray system. Environ Microbiol. 2013;15:1016–39. doi: 10.1111/j.1462-2920.2012.02752.x. [DOI] [PubMed] [Google Scholar]
- 20.DeSantis TZ, Stone CE, Murray SR, Moberg JP, Andersen GL. Rapid quantification and taxonomic classification of environmental DNA from both prokaryotic and eukaryotic origins using a microarray. FEMS Microbiol Lett. 2005;245:271–8. doi: 10.1016/j.femsle.2005.03.016. [DOI] [PubMed] [Google Scholar]
- 21.Oksanen J, Kindt T, Legendre P, O’Hara B, Simpson GL, Solymos P, Henry M, Stevens H, Wagner H Vegan: community ecology package. R project for Statistical Computing. Vienna, Austria: R package; 2008. [Google Scholar]
- 22.Kembel SW, Cowan PD, Helmus MR, Cornwell WK, Morlon H, Ackerly DD, et al. Picante: R tools for integrating phylogenies and ecology. Bioinformatics. 2010;26:1463–4. doi: 10.1093/bioinformatics/btq166. [DOI] [PubMed] [Google Scholar]
- 23.Faith DP. Conservation Evaluation and Phylogenetic Diversity. Biological Conservation. 1992;61:1–10. [Google Scholar]
- 24.Lozupone C, Knight R. UniFrac: a new phylogenetic method for comparing microbial communities. Appl Environ Microbiol. 2005;71:8228–35. doi: 10.1128/AEM.71.12.8228-8235.2005. [DOI] [PMC free article] [PubMed] [Google Scholar]
- 25.Gotelli N, Ellison A. A primer of ecological statistics. Sunderland, MA: Sinauer Associates, Inc; 2004. [Google Scholar]
- 26.Anderson MJ. A new method for non-parametric multivariate analysis of variance. Austral Ecology. 2001;26:32–46. [Google Scholar]
- 27.Tusher VG, Tibshirani R, Chu G. Significance analysis of microarrays applied to the ionizing radiation response. Proc Natl Acad Sci U S A. 2001;98:5116–21. doi: 10.1073/pnas.091062498. [DOI] [PMC free article] [PubMed] [Google Scholar]
- 28.Storey JD, Tibshirani R. Statistical significance for genomewide studies. Proc Natl Acad Sci U S A. 2003;100:9440–5. doi: 10.1073/pnas.1530509100. [DOI] [PMC free article] [PubMed] [Google Scholar]
- 29.Langille MG, Zaneveld J, Caporaso JG, McDonald D, Knights D, Reyes JA, et al. Predictive functional profiling of microbial communities using 16S rRNA marker gene sequences. Nat Biotechnol. 2013;31:814–21. doi: 10.1038/nbt.2676. [DOI] [PMC free article] [PubMed] [Google Scholar]
- 30.Bourgon R, Gentleman R, Huber W. Independent filtering increases detection power for high-throughput experiments. Proc Natl Acad Sci U S A. 2010;107:9546–51. doi: 10.1073/pnas.0914005107. [DOI] [PMC free article] [PubMed] [Google Scholar]
- 31.Woodruff PG, Boushey HA, Dolganov GM, Barker CS, Yang YH, Donnelly S, et al. Genome-wide profiling identifies epithelial cell genes associated with asthma and with treatment response to corticosteroids. Proc Natl Acad Sci U S A. 2007;104:15858–63. doi: 10.1073/pnas.0707413104. [DOI] [PMC free article] [PubMed] [Google Scholar]
- 32.Ye P, Rodriguez FH, Kanaly S, Stocking KL, Schurr J, Schwarzenberger P, et al. Requirement of interleukin 17 receptor signaling for lung CXC chemokine and granulocyte colony-stimulating factor expression, neutrophil recruitment, and host defense. J Exp Med. 2001;194:519–27. doi: 10.1084/jem.194.4.519. [DOI] [PMC free article] [PubMed] [Google Scholar]
- 33.Sun D, Novotny M, Bulek K, Liu C, Li X, Hamilton T. Treatment with IL-17 prolongs the half-life of chemokine CXCL1 mRNA via the adaptor TRAF5 and the splicing-regulatory factor SF2 (ASF) Nat Immunol. 2011;12:853–60. doi: 10.1038/ni.2081. [DOI] [PMC free article] [PubMed] [Google Scholar]
- 34.Hartupee J, Liu C, Novotny M, Li X, Hamilton T. IL-17 enhances chemokine gene expression through mRNA stabilization. J Immunol. 2007;179:4135–41. doi: 10.4049/jimmunol.179.6.4135. [DOI] [PubMed] [Google Scholar]
- 35.Scher JU, Sczesnak A, Longman RS, Segata N, Ubeda C, Bielski C, et al. Expansion of intestinal Prevotella copri correlates with enhanced susceptibility to arthritis. Elife. 2013;2:e01202. doi: 10.7554/eLife.01202. [DOI] [PMC free article] [PubMed] [Google Scholar]
- 36.de Aquino SG, Abdollahi-Roodsaz S, Koenders MI, van de Loo FA, Pruijn GJ, Marijnissen RJ, et al. Periodontal pathogens directly promote autoimmune experimental arthritis by inducing a TLR2- and IL-1-driven Th17 response. J Immunol. 2014;192:4103–11. doi: 10.4049/jimmunol.1301970. [DOI] [PubMed] [Google Scholar]
- 37.Atarashi K, Tanoue T, Shima T, Imaoka A, Kuwahara T, Momose Y, et al. Induction of colonic regulatory T cells by indigenous Clostridium species. Science. 2011;331:337–41. doi: 10.1126/science.1198469. [DOI] [PMC free article] [PubMed] [Google Scholar]
- 38.Atarashi K, Tanoue T, Oshima K, Suda W, Nagano Y, Nishikawa H, et al. Treg induction by a rationally selected mixture of Clostridia strains from the human microbiota. Nature. 2013;500:232–6. doi: 10.1038/nature12331. [DOI] [PubMed] [Google Scholar]
- 39.Ventura M, Canchaya C, Tauch A, Chandra G, Fitzgerald GF, Chater KF, et al. Genomics of Actinobacteria: tracing the evolutionary history of an ancient phylum. Microbiol Mol Biol Rev. 2007;71:495–548. doi: 10.1128/MMBR.00005-07. [DOI] [PMC free article] [PubMed] [Google Scholar]
- 40.Fujimura KE, Johnson CC, Ownby DR, Cox MJ, Brodie EL, Havstad SL, Zoratti EM, Woodcroft KJ, Bobbitt KR, Wegienka G, Boushey HA, Lynch SV. Man’s best friend? The effect of pet ownership on house dust microbial communities. J Allergy Clin Immunol. 2010;126(2):410–2. 412.e1–3. doi: 10.1016/j.jaci.2010.05.042. [DOI] [PMC free article] [PubMed] [Google Scholar]
- 41.Choy D, Shikotra A, Siddiqui S, Nagarkar D, Abbas A, Ohri C, et al. Mutually exclusive Th2 and Th17 bronchial gene expression signatures are associated with eosinophilia in asthma. European Respiratory Society International Congress; Munich, Germany. 2014. [Google Scholar]
- 42.Cosmi L, Liotta F, Maggi E, Romagnani S, Annunziato F. Th17 cells: new players in asthma pathogenesis. Allergy. 2011;66:989–98. doi: 10.1111/j.1398-9995.2011.02576.x. [DOI] [PubMed] [Google Scholar]
- 43.McKinley L, Alcorn JF, Peterson A, Dupont RB, Kapadia S, Logar A, et al. TH17 cells mediate steroid-resistant airway inflammation and airway hyperresponsiveness in mice. J Immunol. 2008;181:4089–97. doi: 10.4049/jimmunol.181.6.4089. [DOI] [PMC free article] [PubMed] [Google Scholar]
- 44.Arron JR, Choy DF, Laviolette M, Kelsen SG, Hatab A, Leigh R, et al. Disconnect between sputum neutrophils and other measures of airway inflammation in asthma. Eur Respir J. 2014;43:627–9. doi: 10.1183/09031936.00117013. [DOI] [PubMed] [Google Scholar]
Associated Data
This section collects any data citations, data availability statements, or supplementary materials included in this article.
Supplementary Materials
Bacterial phyla representing taxa positively (n=166) and negatively (n=85) correlated with ACQ visit 2 scores (Pearson R = 0.5 – 0.7, q-value < 0.05).
Predicted bacterial community functions represented among taxa positively and negatively correlated with BMI. Representative 16S rRNA gene sequences for taxa significantly correlated with BMI were used as inputs for PICRUSt (Langille et al. 2013). KEGG pathways shown in the figure are biologic pathways in which the predicted functions are known to participate.
Predicted bacterial community functions (KEGG pathways) represented among taxa significantly associated with change in ACQ.
Predicted bacterial community functions represented among taxa positively associated with FKBP5 expression and the Th17 inflammation gene signature.
Significant correlation is observed between body mass index (BMI) and Prevotella spp. copy numbers (normalized to b-actin) determined by quantitative PCR.
G2 PhyloChip dataset used for primary analyses of severe asthma cohort (normalized, log2-transformed fluorescence intensities).
G2 PhyloChip dataset used for comparison of severe asthma (SA) vs. healthy subjects. Values are normalized, log2-transformed fluorescence intensities.
G2 PhyloChip dataset used for comparison of severe asthma vs. mild-moderate asthma subjects (Ref.8) (normalized, log2-transformed fluorescence intensities).
Results of distance-based PERMANOVA testing for bacterial microbiome associations with all clinical inflammatory data assessed of severe asthma subjects in the BOBCAT study (Jia et al. JACI 2012)
Airway bacterial communities demonstrating the largest fold-differences in relative abundance in obese vs. non-obese severe asthma subjects (Benjamini-Hochberg adjusted p < 0.10).
Bacterial taxa significantly correlated with bronchial biopsy eosinophil numbers. The majority of correlations were negative (Pearson R = −0.5 to −0.7, q-value <0.10). Only two taxa exhibited positive correlations at the specified level of significance.
Bacterial taxa demonstrating the strongest correlations with the Th17/neutrophilic inflammation gene signature (Pearson R 0.5 – 0.7, q-value ≤ 0.20). Taxa are sorted by the magnitude of correlation from positive (110 taxa) to negative (186 taxa).
Bacterial taxa significantly enriched or depleted in severe asthma vs. healthy controls or mild-moderate asthmatics, per the comparisons shown. (≥ 2-fold difference, Benjamini-Hochberg adjusted p values; linear models based on moderated t-statistics, R package limma).