

Abstract
Choice of network topology for gene regulation has been a question of interest for a long time. How do simple and more complex topologies arise? In this work, we analyze the topology of the marRAB operon in Escherichia coli, which is associated with control of expression of genes associated with conferring resistance to low-level antibiotics to the bacterium. Among the 2102 promoters in E. coli, the marRAB promoter is the only one that encodes for an autoactivator and an autorepressor. What advantages does this topology confer to the bacterium? In this work, we demonstrate that, compared to control by a single regulator, the marRAB regulatory arrangement has the least control cost associated with modulating gene expression in response to environmental stimuli. In addition, the presence of dual regulators allows the regulon to exhibit a diverse range of dynamics, a feature that is not observed in genes controlled by a single regulator.
Introduction
Network topology influences gene regulation dynamics (1,2). For example, a single negative feedback in a network is known to introduce oscillations, reduce noise, and linearize response, whereas a single positive feedback is capable of exhibiting switchlike response and memory storage (3–8). However, what benefit can an interlinked negative and positive feedback confer to a cell? Studies have reported that interlinked positive and negative feedback in a system may act as a tunable motif when exposed to a varying environment (9–14). One such system operating under both a positive and a negative feedback loop is the multiple antibiotic resistance (marRAB) operon in Escherichia coli.
The locus was discovered during studies of mechanisms leading to increased resistance to antibiotic tetracycline in E. coli, and is used as a template for understanding the mechanisms of intrinsic resistance in enteric bacteria (15–17). The mar system consists of two divergently positioned transcriptional units: marC, which encodes for a putative integral membrane protein with no known function in antibiotic resistance; and the marRAB operon, which encodes genes for three proteins (MarR, MarA, and MarB) (18,19). While MarA and MarR are transcription factors, the role of MarB was not characterized until 2013, when it was reported to repress expression from the marRAB operon by reducing the rate of marA transcription via an unknown mechanism (20).
MarR and MarA are DNA-binding transcriptional regulatory proteins (18,21). In absence of stress signals (inducers, like weak organic acids and other phenolic compounds, present in the surrounding cellular environment, or intracellular metabolic intermediates/products), MarR binds the marRAB promoter and negatively regulates gene expression (22). In presence of inducers, MarR binds these inducers and is then unable to bind DNA (23,24). In such a situation, MarA binds the marRAB promoter and acts as an activator of the system (25).
MarR belongs to the MarR family of transcriptional regulators (26). It contains a conserved helix-turn-helix DNA binding motif and directly binds to palindromic sequences (TTGCC and GGCAA) as a homodimer on two sites in the marRAB promoter resulting in repression of the marRAB operon (22,27). In the presence of small molecules like salicylate and other phenolic compounds, MarR binds these compounds resulting in the loss of DNA-binding ability, leading to increased transcription of the marRAB operon via MarA activation (23,25). MarA belongs to AraC/XylS family of transcriptional regulators and contains two helix-turn-helix DNA binding domains (28,29). MarA is also regulated at protein level via rapid degradation by ATP-dependent Lon protease (30). This rapid degradation of MarA helps the bacterium rapidly minimize the cytotoxicity caused due to MarA-dependent activation of downstream target genes involved in stress response, as soon as the stress is removed.
The target genes are regulated positively or negatively by MarA. This control is exhibited by MarA binding a degenerate 19-basepair sequence known as “marbox” (AYNGCACNNWNNRYYAAAY) in the promoter regions of the target genes (31). The resultant target proteins control cellular physiology in a number of ways, including upregulating expression of efflux pumps (e.g., acrAB and tolC); downregulating expression of porin ompF via control of transcription of small RNA micF; pH response genes like inaA; and genes involved in metabolism (like zwf and purA) (32–37). Interestingly, cellular response to stress in E. coli is controlled by two more homologous transcriptional regulators, SoxS and Rob (36,38,39). Together, the three (MarA, SoxS, and Rob) control expression of >80 genes in E. coli (40–43). While the three systems have their independent inducers and targets, considerable cross talk is known to exist between the Mar, Sox, and Rob systems; however, the precise mechanistic details and physiological significance of these interactions is yet to be fully understood (44–46).
The marRAB operon has a unique topology. The operon encodes for an autoactivator and an autorepressor—something that is unique among all operons in E. coli (25,47). In this work, we analyze the potential benefits conferred to the cell by this unique topological design. Our work highlights the richness in the qualitative responses that the wild-type marRAB system is able to offer, and we demonstrate that the wild-type design is also able to dynamically respond to the changing inducer concentration via a lower control cost.
Materials and Methods
The wild-type mar system produces two autoregulators, the MarR and MarA proteins. MarA positively, and MarR negatively, regulate the system (22,25,48). MarA regulates expression of various downstream genes in turn to perform cellular functions. Along with wild-type mar design, two alternative designs (activator-only and repressor-only) having a single feedback loop were studied and compared in terms of various performance factors, described below. Target expression in the activator-only design is regulated by an induced activator (A.I), and the repressor-only design is regulated by an uninduced repressor (R). In our work, we assume that the target expression is solely dependent on MarA, or A.I, or the absence of R in the three designs. Hence, we ignore the basal (or expression via other mechanisms) expression of the target protein. This assumption, however, does not change our results in any manner. The three designs are as shown in Fig. 1.
Figure 1.
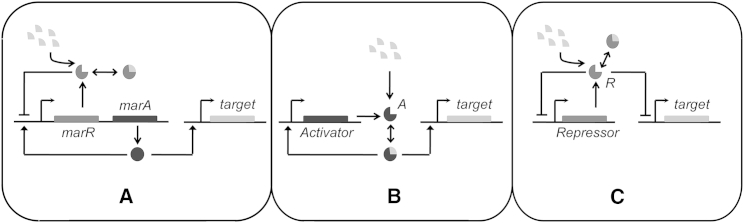
(A) Wild-type network design. MarR is an autorepressor (dark shaded). When bound to Inducer (light shaded), MarR is unable to control gene expression. MarA (solid) is an autoactivator. MarA also activates target gene expression. (B) Activator-only network design. Activator protein, A, is unable to control gene expression. When bound with inducer, A autoactivates and also activates target expression. (C) Repressor-only network design. Repressor protein, R represses its own and target expression. R bound with Inducer is unable to control gene expression.
We setup a computational framework where we formulated ordinary differential equations to deterministically model these three different designs, and simulated them using ODE45 in the software MATLAB (The MathWorks, Natick, MA).
Mathematical formulation
Model equations for wild-type design
In this design, it was assumed that MarR binds the marRAB promoter and represses expression. MarR bound to inducers is unable to bind DNA. MarA activates transcription from the marRAB promoter as well as the target promoter. The degradation constant for free MarR was kept the same as that for MarR bound to inducers. MarA degraded 10 times faster compared to MarR, as reported previously in the literature (22–25,27,30,49–51):
| (1) |
| (2) |
| (3) |
| (4) |
Model equations for activator-only design
In this design, it was assumed that A, activator, is unable to activate transcription. However, in the presence of inducers (I), A bound to I can bind DNA and trigger transcription. A bound to I is also able to control target expression (T):
| (5) |
| (6) |
| (7) |
Model equations for repressor-only design
R is a repressor, and in the absence of inducers, it binds DNA and prevents transcription. On addition of inducers, R binds I, and the complex R.I is unable to bind DNA, resulting in R and target expression (T):
| (8) |
| (9) |
| (10) |
The description and values of parameters have been listed in Table 1. The values of parameters in alternative designs were kept same as the corresponding parameters in the wild-type design.
Table 1.
Parameter values used in this study
| Parameter | Description | Value |
|---|---|---|
| B | basal activation rate constant of mar, R, and A promoters | 0.1 time−1 |
| K | activation rate constant of mar, R, and A promoters under regulation | 2 time−1 |
| kDA | dissociation constant of MarA and A.I to respective promoters (25) | 0.5 concentration |
| kDR | dissociation constant of MarR and R.I to respective promoters (22) | 0.025 concentration |
| kdA | degradation constant of MarA, MarA.I, A and A.I (30) | 0.3 time−1 |
| kdR | degradation constant of MarR, MarR.I, R and R.I | 0.03 time−1 |
| kf | binding rate of MarA, MarR, A, and R to inducers (22,23) | 100 concentration−1 ⋅ time−1 |
| kr | unbinding rate of MarA, MarR, A, and R to inducers (22,23) | 1 time−1 |
| kT | activation rate constant of target promoter under regulation | 5 time−1 |
| kDT | dissociation constant of regulator to target promoter (fitted) | 1 concentration |
| kdT | degradation constant of target protein | 0.1 time−1 |
There is insufficient experimental data to uniquely determine all the parameter values. Therefore, the relative sense of some parameter values have been estimated from previous studies (22–25,27,30,49–51) and the rest are estimated to fit the kinetic data of expression from our group.
Evolving activator-only and repressor-only designs using a genetic algorithm to mimic wild-type response
Our genetic algorithm evolves activator-only and repressor-only networks to mimic wild-type response, and we then compute and compare various performance indicators associated with the evolved networks. In our genetic algorithm, all parameters of the activator- and the repressor-only designs were allowed to acquire a mutation except the one associated with the degradation of the target protein as we assumed that all three designs regulate expression of same target gene. Upon mutation, a parameter is allowed to acquire a new value from the given range with a uniform probability. Only one parameter can acquire mutation in single step. Activator- and repressor-only designs were evolved and a response curve to inducers was computed. Deviation from the wild-type dose-response curve to inducers was calculated for each evolved network. Networks with the minimum average deviations (error) from the wild-type curve were selected for the next generation in the algorithm. The mutation and selection steps were repeated until the mutant network did not evolve any further toward lower deviation from the wild-type curve. More than 500 parallel evolutions were done independent of each other to ensure that the results were not biased by the initial mutations selected for. The error between the evolved variant and wild-type design was calculated by Eq. 11 (where n is number of inducer concentrations at which the system response was tested):
| (11) |
Factors that affect performance
Steady-state response
Steady-state expression of regulators and targets in all three designs was captured against varying inducers in environment.
Response time
Time required for reaching half of the total difference between the two steady states of target expression when a system transitioned from one dose of inducers to another. A number of switches from one state to another state were simulated in this study.
Control cost
The control cost was determined by the total number of regulators required to 1) maintain a response at a particular inducer level and 2) switch the response when system moves from one inducer level to another. All three designs were simulated in randomly fluctuating environment in terms of stress level and time. A time profile of all regulatory molecules in response to the inducer profile was generated. The area under this curve was taken as a proxy of the control cost of a particular network. A realistic environment for E. coli is unlikely to see constant inducer concentrations over long periods. Therefore, we simulate all three network designs in an environment where the inducer concentration is changing from one level to another in a discrete fashion. Our results remain independent of frequency of change or magnitude of inducer levels.
Heterogeneity in the population
To study heterogeneity, we simulated all three designs stochastically using Gillespie’s algorithm (52). The model for each design was simultaneously simulated in 1000 cells and dynamics was captured when cells move from OFF to ON and ON to OFF.
Hysteresis in the system
To study whether and how long a system keeps memory against inducer level, we experimentally and computationally exposed systems to a range of inducer levels from low to high (switching ON) and high to low (switching OFF) and captured steady-state expression of target.
Stochastic simulation of wild-type design
We formulated a kinetic model by writing an ordinary differential equation for each interaction individually in the wild-type design (listed below). Gillespie’s algorithm has been adopted to account for stochasticity (52,53). The simulation starts with initial concentrations of all species (MarA, MarR, MarR.I, and T) at zero time step. All concentrations were represented as the number of molecules of a species divided by the cellular volume. Relative probabilities of each reaction were estimated at each time step. One interaction can only take place at each time step based on the relative probabilities. The concentrations of all species are then updated accordingly, leading to new set of relative probabilities for the next time step. This is repeated until the system reaches equilibrium (54). All simulations were done for 1000 cells.
Production of MarR and MarA proteins
| (12) |
Degradation of MarR
| (13) |
Binding of inducers to MarR
| (14) |
Unbinding of inducers to MarR
| (15) |
Degradation of MarR.I
| (16) |
Degradation of MarA
| (17) |
Production of target
| (18) |
Degradation of target
| (19) |
Experimental methods
Strains and plasmids
The strain used was E. coli K12 MG1655 and the promoter fusion plasmid was pMS201 (55,56).
Growth condition
The experiments were performed in Luria Bertani (LB) broth at 37°C. Kanamycin and chloramphenicol antibiotics were used at concentrations 25 and 34 μg/mL, respectively. Sodium salicylate (Sigma Aldrich, St. Louis, MO) was used as an inducer (23,24) and 1 M stock was prepared and filtered with a 0.22-μm membrane filter and stored at −20°C.
Fluorescence assay at single-cell resolution
Escherichia coli containing Pmar promoter fusion (MG1655: 1,618,818–1,619,243 bps) with green fluorescent protein (GFP) and PinaA promoter fusion (MG1655: 2,349,723–2,349,441 bps) with GFP were grown in separate tubes containing LB media with kanamycin at 37°C with shaking. E. coli with no GFP was used as negative control. Both cultures were subcultured in separate tubes in 1:500 dilution in LB media with kanamycin and grown at 37°C with shaking. When the cultures had OD at ∼0.2, sodium salicylate was added in each tube, except one with no inducer (control tube), at different concentrations of 1, 2.5, 5, and 7.5 mM, respectively, and incubated at 37°C with shaking for 10 h. Samples were collected from all the tubes, stored in phosphate-buffered saline (containing 34 μg/mL chloramphenicol) and kept on ice in a dark condition. The endpoint fluorescence values were plotted against respective salicylate concentrations to understand the response of Pmar and target PinaA with a varying dosage of inducers.
To study transition of cells from high to low inducer levels, the tube with inducer concentration 7.5 mM culture was centrifuged, the cell pellet was resuspended in fresh LB media containing kanamycin, and distributed in five new tubes for each promoter. Sodium salicylate was added in each tube at different concentrations 1, 2.5, 5, and 7.5 mM, except one with no inducer (control tube). After 10 h of growth, samples were prepared and stored in phosphate-buffered saline (containing 34 μg/mL chloramphenicol). The previous samples and new samples were then analyzed with a BD SORP FACSAria (BD Biosciences, San Jose, CA) to get expression values at a single-cell resolution. The same exercise was repeated for highest sodium salicylate concentration at 15 mM.
Results and Discussion
The dynamic range of wild-type design is larger as compared to an activator-only or a repressor-only design
Among the 2102 promoters in E. coli, the marRAB promoter is unique in its design (25,47,57,58). It is the only promoter in the organism that encodes for an autoactivator (MarA), and an autorepressor (MarR). While dual control by a single regulator has been well characterized in a number of systems in E. coli and other organisms (10,59,60), no other operon in E. coli is known to encode an autoactivator and an autorepressor. In this work, we use experiments and simulations to explore the advantages that the wild-type marRAB design confers to the organism.
To begin, we simulate expression of a target protein T (which is activated by MarA) in the presence of a range of inducers. MarRAB system is known to control expression of a number of downstream genes, and in our simulations, protein T is a representative from among these targets. As shown in Fig. 2 A, we note that the wild-type design is able to exhibit a graded target response to the presence of inducers in the environment. While the wild-type design starts to respond to an inducer concentration of 0.1 A.U., its response saturates at a concentration of 10 A.U. To compare the sensitivity and the dynamic range of wild-type response with alternate designs, we compared the wild-type simulation results with two alternate designs. For the first, an activator-only design, the target expression was assumed to be controlled by a positive regulator that acts as a transcription factor when bound with an inducer (Fig. 1 B). For the second, a repressor-only design, a repressor was included that shuts off gene expression in the absence of inducers. Repression in this design is relieved in the presence of inducers, when a repressor bound to inducers is no longer able to control gene expression (Fig. 1 C). Essentially, these designs equate to rewiring MarR or MarA from the wild-type design, and thus, reducing the regulatory design to a more widely observed arrangement for gene expression control. All biochemical parameters associated with the three proteins (MarR, MarA, and Target T) were kept the same for all three designs.
Figure 2.
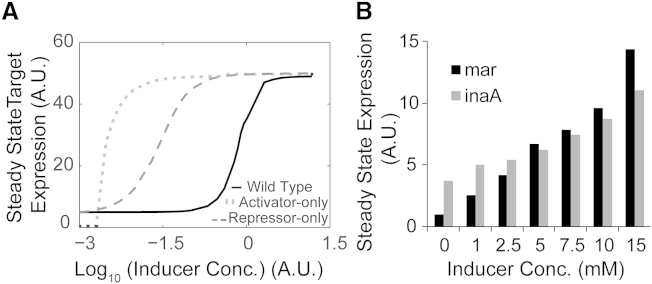
Dose response curve. (A) Wild-type, activator-only, and repressor-only designs curves as obtained computationally; the x axis represents Inducer concentration in logarithmic terms and the y axis represents steady-state expression of target. (B) Wild-type Pmar and PinaA expression in the presence of varying concentrations of sodium salicylate obtained experimentally.
On comparing the two alternate designs with the wild-type steady-state data at different inducer concentrations, we noted two important differences. First, for both alternate systems, the dynamic range of response to inducers was far smaller than in the wild-type (Fig. 2 A); and second, the activator-only design exhibits a switchlike induction, where it transitions from a fully OFF to a fully ON state over a very small range of inducer values—hence, seemingly unable to exhibit a graded response. Systems with positive feedback have previously been reported to exhibit such dynamic behavior (10,61,62). Experimentally, the graded induction of gene expression in the wild-type regulatory arrangement can be seen for regulator PmarA and target PinaA in Fig. 2 B.
The repressor-only and activator-only designs can be evolved to mimic the wild-type dose-response to inducers
However, comparisons between wild-type design and the two alternate designs (generated by just deleting one of the two regulators) were seemingly unfair. In the alternate designs, we kept the biochemical parameters associated with all the interactions equal to those in the wild-type design. Presumably, the response (in terms of expression of target, T) of wild-type E. coli to the inducers is optimal in the actual environment in which E. coli has evolved. Hence, any alternate design will, over time, tune its interactions, and evolve toward a state that enables it to mimic the target T response comparable to that in the wild-type (63–71). Hence, for a more realistic comparison between designs, we let the two alternate designs evolve to tune their biochemical interactions, which enable them to mimic the wild-type response shown in Fig. 3.
Figure 3.

Dose response curves for (the three best) evolved activator-only and repressor-only network designs. Activator-only and repressor-only designs were evolved using a genetic algorithm and selected for to match the wild-type response. The x axis represents Inducer concentration in logarithmic terms and the y axis represents steady-state expression of Target.
A genetic algorithm was used for this purpose (see Materials and Methods for more details), and the topologies were evolved to minimize the area between curves of the target expression at different inducer concentrations in wild-type and the alternate designs. More than 500 evolved networks were generated for the activator-only and repressor-only regulatory designs. Of these, the best three parameter sets (in terms of minimum error) were selected from each design (activator-only and repressor-only, as shown in the Fig. 3) and chosen for further analysis and comparison with the wild-type design. We note that in our attempts using the genetic algorithm, we were able to generate networks that closely matched the wild-type behavior in the repressor-only design. However, in the activator-only design, despite repeated attempts, we were unable to generate networks in that topology that matched the wild-type behavior more closely than shown in Fig. 3. In all designs with the activator as the sole regulator, positive feedback leads to a switchlike induction of the target expression, resulting in rapid induction of the target protein beyond a certain inducer concentration—a well-characterized observation regarding systems with positive feedback (10,61,62,72).
Given the evolved networks, which closely match the wild-type target response to inducers, we compared performance of the wild-type design with the evolved networks. The performance of a network was characterized by the indicators, as mentioned in Materials and Methods.
Repressor-only design is able to match the dynamics of wild-type response (population average) but the activator-only design is much slower (especially from ON to OFF cases)
We quantify response time as the time it takes for the network to reach 50% of the total change in the target value as the network moves from one steady state to another. We note that in wild-type and the evolved networks in repressor-only design, the time of response exhibits a similar characteristic pattern. In general, the response times are much faster in these two designs compared to the evolved networks in an activator-only design. In the wild-type and the evolved networks in a repressor-only design, the time of response increases as the cells move to higher inducer concentrations. However, this increase is marginal, and does not qualitatively change the response time of the system (Fig. S1 in the Supporting Material).
In contrast, the evolved activator-only networks exhibit a qualitatively longer response time when shifted from a higher to a lower inducer concentration (Fig. 4). Thus, the time to switch OFF the evolved activator-only networks was much longer compared to the wild-type and evolved repressor-only networks. This likely has a detrimental effect on cellular growth, as the cell is producing target T for a time longer than necessary/optimal. When moving to lower inducer concentrations, all three evolved networks in the activator-only design have long response times. The longer response times when switching the system OFF in the activator-only design is likely due to the positive feedback (73,74). Active production of activator A (by itself) results in only a gradual decrease of intracellular levels of A with time, resulting in a longer response time and consequently, a higher cytotoxic effect on the cell.
Figure 4.

Response time for transition of systems from one Inducer concentration to another. (A) Wild-type. (B–D) Best three evolved activator-only. (E–G) Best three evolved repressor-only designs. The x and z axes represent the start and end Inducer concentration, respectively, in a logarithm where a network moves from start to end during a switch. The y axis captures the response time required to switch (the scale for the y axis was kept same in all graphs to make comparisons between them easy).
Cost of response for varying inducer concentrations in the environment; cost of control of target gene expression is lower in the wild-type design compared to the evolved networks
Next, we quantified and compared the cost of response among networks in the three different designs. We define the cost of response as the number of regulator molecules that need to be produced to launch an optimal (or wild-type) target response to inducers, as shown in Fig. 2 A. Synthesis of unwanted proteins is known to retard the cellular growth rate (75–77), and here we wanted to study the cost of response to a time-varying inducer signal to the cell. In this regard, we generated three different inducer concentration profiles in time—where both the inducer levels and the time for which the level was sustained were randomly varied (Fig. 5 A). More than 500 networks (in terms of minimum error) were selected for each of the activator-only and repressor-only designs. Simulations were then carried out to generate the target response to each inducer-time profile in wild-type and all networks in the two alternate topologies (evolved activator-only and evolved repressor-only designs). Similarly, a time-profile of all regulatory molecules in response to the inducer profile was generated. The area under this curve was taken as a proxy of the control cost of a particular network. Cost of each evolved network in three different inducer time-profiles, and the average cost of both activator-only (solid dots) and repressor-only designs (shaded dots) (in multiples of cost of wild-type design) against percent error, is shown in Figs. S2 B and S5 B.
Figure 5.

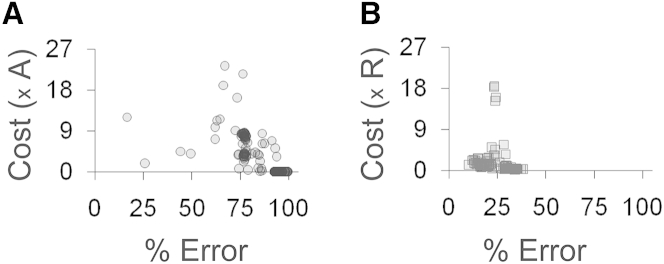
Comparison of control cost of response between wild-type, evolved activator-only, and evolved repressor-only designs. (A) Inducer concentration profiles generated where both the Inducer levels and the time for which the level was sustained were randomly varied. (B) Average control cost (across the three profiles) in the evolved activator-only (solid) and evolved repressor-only (shaded) designs was computed (in multiples of control cost of the wild-type design) and plotted against % error in mimicking response of wild-type design. The time of these simulations is assumed to be much smaller than the cell cycle time of the bacteria.
Because the wild-type design has two regulators (MarR and MarA), whereas the evolved repressor-only and evolved activator-only have a single regulator (repressor R and activator A respectively), we had, before these simulations, intuitively assumed that the control cost of the wild-type design would be higher than that in the activator-only and repressor-only designs. The results from our evolved strains demonstrate that this is not the case. On comparing the average costs of the wild-type and the evolved repressor-only designs, we note that in the three inducer time-profiles tested, a few evolved repressor-only networks (shaded dots) that are capable of closely mimicking the wild-type response with ∼20% error, but are expensive compared to wild-type design.
Similar simulations were done with the networks in an activator-only design. However, as shown in Fig. 3, the evolved networks in an activator-only design poorly matched wild-type in terms of the amount of target produced in response to inducers. As shown in Figs. 5 B and S2 B, networks in the activator-only design (solid dots), although closely mimicking the wild-type, were more expensive than the wild-type. Some of the evolved networks in an activator-only design could show the same or even lower cost than the wild-type, but were found to have a higher percentage of deviation from the wild-type response.
The genetic algorithm failed to evolve into an activator-only or a repressor-only topology that exhibited target response similar to that of the wild-type and a control cost lower than that of the wild-type. Thus, we conclude that despite encoding for an additional regulator, the wild-type design is able to launch a cheaper response (target production) to inducers.
Hence, our simulations suggest that for a particular response (target expression versus inducer concentration), the wild-type design could be optimal in terms of control cost, when compared against designs with a single regulator (activator- or repressor-only). This suggests that for a given response curve, the choice of topology with the minimal control cost is a nontrivial result—a result likely to dictate a choice of topology in cells.
Having interlinked positive and negative feedback loops confers many advantages to the cell, but what could be the possible disadvantages? For example, will a wild-type cell still be able to exhibit optimal cost if it has to mimic the response of a design having a single regulator? To understand this, we independently evolved the wild-type design 200 times toward mimicking the dose-response of a randomly selected set of activator-only and repressor-only designs. As shown in Fig. 6 A, when wild-type cells were evolved to mimic activator-only design, most of the evolved wild-type networks either failed to mimic or they instead exhibited higher cost than the activator-only design. On the other hand, the wild-type design could be evolved to mimic the response of a repressor-only design but is more expensive than a repressor-only design (Fig. 6 B). Hence, optimality of a topology in terms of response might be dictated by the dose response associated with its inducer. In terms of control cost, Garcia-Bernardo and Dunlop (48) has shown that, in an uninduced state, the interlocked positive- and negative-feedback loops in the Mar system are responsible for pulselike response in the network (43). This is thought to be achieved, via the Mar topology, through expenditure of minimum control cost. Our results show, that this result perhaps also extends to the induced state of the system.
Figure 6.
Comparison of control cost of response among activator-only, repressor-only, and evolved wild-type designs. Wild-type design was evolved to mimic response of activator-only and repressor-only design. Control cost in each evolved wild-type design was computed (in multiples of control cost of the activator-only and repressor-only designs) and plotted against % error in mimicking response of (A) activator-only and (B) repressor-only design.
Wild-type design stores memory over a range of inducer concentrations
Positive feedback is known to impart memory to the system (8,10,78). In addition, at a single-cell resolution, positive feedback can cause a switchlike induction of gene expression in cells (10,61,62). On the other hand, negative feedback is known to speed-up response dynamically (74). Because the wild-type design of the MarRAB system in E. coli is composed of both a positive and a negative feedback loop, we were interested in exploring the dynamics of gene expression in these regards.
To study this, we simulated transition of cells from an initial inducer level equal to zero, to a range of final inducer levels. To study transition from the ON to OFF state, simulations were carried out with initial conditions corresponding to cells at steady state in the presence of the highest inducer level. The simulations covered the transition of these cells to a range of lower inducer concentrations. The steady-state target expressions at various inducer concentrations, when moved from the OFF (inducer concentration equal to zero) to ON state, are as shown in Fig. S3. As expected, the steady-state target expression levels increase with inducer concentration before exhibiting a plateau. When the cells at the highest inducer concentration were transitioned to lower inducer concentration (ON to OFF transition), the steady state of target molecules was noted at all intermediate concentrations. The two curves thus generated (OFF to ON, and ON to OFF) did not overlap, exhibiting the ability of the network to store memory.
As expected, in the repressor-only design, no evolved network is able to exhibit memory, while in the activator-only design, all evolved networks exhibited memory. However, all activator-only networks exhibited memory over a narrow range at very low inducer concentration. The range of inducer concentration over which the evolved networks exhibited memory was larger, compared to the original activator-only network (Fig. S3), but still much lower than the wild-type range (Fig. 7 A). This ability to store memory for a range of inducer values was observed for both marRAB and the target promoters in wild-type as well as activator-only networks.
Figure 7.

Comparison of memory storing capability in wild-type and all activator-only designs. (A) The x axis represents various designs (wild-type; the original activator-only design, A; and best three evolved activator-only designs, A1, A2, A3) and the y axis represents corresponding range of Inducer concentration in which they exhibit hysteresis. (B and C) The x axis represents the concentration of sodium salicylate (in mM) and the y axis represents the steady-state expression of (B) Pmar (square) and (C) PinaA (circle) during OFF to ON (solid) and ON to OFF (open) conditions.
This prediction from the model was confirmed experimentally with the marRAB promoter and the inaA promoter (a representative target promoter) with a highest inducer (sodium salicylate) concentration of 7.5 mM (Fig. 7, B and C) and 15 mM (Fig. S4). Depending on the initial state of the cells, both promoters exhibited different steady-state expression levels for the marRAB and the target promoter. The presence of memory in the cell indicates that the cells are reluctant to move from the state that they are in at a particular moment. This is likely to ensure the cells 1) do not respond to any signal that is transient in nature (cellular topologies have been previously shown to exhibit this property (79)); and 2) changes in overall cellular physiology are minimized (as MarA is known to control >50 genes in E. coli (43)).
Wild-type design is capable of exhibiting a wide range of dynamic behavior
Overall, the MarRAB control offers intriguing possibilities of dynamics of gene expression. To explore the full range of these dynamics, we simulated the system for a large number of conditions while varying two parameters: 1) the fraction of expression that is expressed as basal transcription rate from the marRAB promoter, and 2) ratio of the degradation rates of the activator (MarA) and repressor (MarR). The wild-type topology was simulated under various values of these parameters for a variety of inducer concentrations. The results are as shown in Fig. 8.
Figure 8.
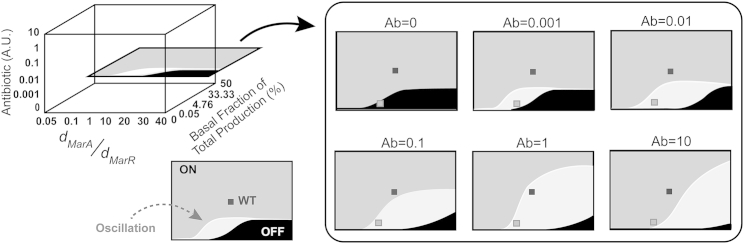
Dynamic behavior of wild-type design in three-dimensional parameter space. The x axis represents ratio of degradation constants of MarA and MarR, the y axis represents inducer concentration, and z axis represents basal fraction of total production of regulators. (Solid and shaded) Region where the end-point target expression is almost zero (<1) and the region where the steady-state target expression is ≥1, respectively. (Open) Region in the figure represents area with a sustained oscillatory target response. (Small solid square) Wild-type design; (small shaded square) a single point in the parameter space that lies in qualitatively different response types.
Under the range of parameter values covered, the topology exhibits three distinct types of behavior in terms of target expression. As shown in Fig. 8, the solid region highlights the region where the end-point target expression is almost zero (<1), i.e., the system is switched OFF. The shaded region, on the other hand, highlights the area where the steady-state target expression is equal to or more than one. In addition, the system is also able to exhibit oscillations (open region). This is observed for a narrow range of the two parameters—although the range of the parameter changes with the changing inducer concentration. The oscillations could either be damped or sustained, depending on their precise location on the parameter space. In addition, the damped oscillations were observed to settle at either a zero or nonzero value (>1) of the target steady-state expression.
What is critical is that this diversity in the qualitative nature of response to inducers in the wild-type is exhibited for the same set of parameters. For instance, the small shaded square in Fig. 8 represents a single point in the parameter space that lies in qualitatively different response types, depending on the inducers in the surrounding environment. In our simulations, the wild-type design is represented by the small solid square in Fig. 8.
Target gene expression at single-cell resolution
The wild-type design responds with a rheostatlike response at a single-cell resolution (experimentally and computationally; see Fig. S5) during activation. This effectively means that the MarR-enforced negative feedback is strong enough to prevent a switchlike activation. When simulations were performed with a network where the MarR protein degradation was made infinitely stronger than that taken in the wild-type model, this behavior still persists. This is likely because the MarA-dependent activation is independent of the inducer, and the system always operates at a steady-state ON condition. None of the evolved activator-only designs exhibited a switchlike transition from the OFF to the ON state—likely because, to match the wild-type response, the positive feedback in the evolved networks is insufficiently strong to induce a switchlike transition from OFF to ON. Negative feedback is known to lead to a more homogeneous population (4,80), and hence, none of the evolved repressor-only topologies exhibited a switchlike dynamic response in either the OFF-to-ON or the ON-to-OFF switch. The dynamic transition of the wild-type from the OFF to ON state was also captured experimentally at a single-cell resolution, and found to be consistent with the model.
As the cells transitioned from the ON to the OFF state, the wild-type design exhibited a switchlike transition with two clear populations at intermediate times. However, the negative feedback in the network slows the separation of the two peaks and hence, they are only distinct for a small window of time during the transition (Fig. S5). All evolved networks based on activator-only topology exhibited a switchlike transition from the ON to the OFF state. However, the separation in the two peaks was much greater in the evolved networks compared to the wild-type. Additionally, one of the two peaks in the population histogram was the OFF state, where cells did not have any target protein molecules. Eventually, all cells move toward this state. The physiological significance of heterogeneity when switching the MarRAB system OFF is not known.
Conclusion
This study was motivated by the unique topology of the marRAB promoter in E. coli. This promoter is the only one in the organism that encodes for an autoactivator as well as an autorepressor. What benefits does this topology confer to the organism? Our analysis shows that mixing a positive and a negative feedback loop in the system enables the bacterium to exhibit dynamic features associated with both positive- and negative-feedback loops.
Cellular response to stress signals in E. coli is controlled by two more homologous transcriptional regulators, SoxS and Rob (36,38,39). Together, the three (MarA, SoxS, and Rob) control expression of >80 genes in E. coli, many of which are controlled by more than one regulator (40–43). How these three integrate the signals (inducers) and then translate them into the accurate and timely expression of a large number of target genes remains unknown.
A key and rather surprising finding from our study was that the control cost (defined by the number of regulator molecules required by the system to generate an optimum target profile) was lower in the wild-type design compared to the activator- and the repressor-only design. Our naive assumption was that because the wild-type design involved two regulators instead of one in the other two designs, its control cost would likely be significantly higher compared to the other designs. However, using a genetic algorithm, we demonstrate that if a cell were to generate a particular (wild-type) target expression profile (in response to particular dose of inducers), the wild-type design is less expensive. This result likely has implications on how a cell chooses regulatory topologies for particular functions. On the other hand, evolving the wild-type design to match the activator-only or the repressor-only dose-response curve resulted in expensive wild-type topology networks. These results suggest links among the optimum dose-response curve, a regulatory topology, and the associated control cost.
The wild-type design exhibits oscillations and heterogeneity (but only during transition from the ON to OFF state). We were unable to demonstrate these features of dynamics experimentally. However, we speculate that because all target proteins act at a single-cell level (rather than being exported as shared goods), the transition from OFF to ON is homogeneous. However, as the signal is removed, heterogeneity is likely to create two subpopulations where one quickly turns off gene expression, and the other is maintained at higher target values (which might be useful in an instance where the stress were only switched OFF for a short time). On the other hand, we speculate that oscillations might be useful for the cell when expression of the target protein is highly detrimental to cellular growth but is necessary for countering the inducer stress. Exhibition of different states in an isogenic population is well known to be a strategy employed by bacteria to aid chances of survival in fluctuating environment (81–83). These probabilities remain to be tested experimentally in the framework of the marRAB operon in E. coli.
Author Contributions
M.K.P. performed simulations; K.J. did all experiments; S.S. designed research; and M.K.P., K.J., and S.S. wrote the article.
Acknowledgments
The authors acknowledge the Innovative Young Biotechnologist Award Program, Department of Biotechnology, Government of India, for funding this work.
Editor: Reka Albert.
Footnotes
Mahendra Kumar Prajapat and Kirti Jain contributed equally to this work.
Five figures are available at http://www.biophysj.org/biophysj/supplemental/S0006-3495(15)00828-0.
Supporting Material
References
- 1.Thieffry D., Huerta A.M., Collado-Vides J. From specific gene regulation to genomic networks: a global analysis of transcriptional regulation in Escherichia coli. BioEssays. 1998;20:433–440. doi: 10.1002/(SICI)1521-1878(199805)20:5<433::AID-BIES10>3.0.CO;2-2. [DOI] [PubMed] [Google Scholar]
- 2.Shen-Orr S.S., Milo R., Alon U. Network motifs in the transcriptional regulation network of Escherichia coli. Nat. Genet. 2002;31:64–68. doi: 10.1038/ng881. [DOI] [PubMed] [Google Scholar]
- 3.Wolf D.M., Arkin A.P. Motifs, modules and games in bacteria. Curr. Opin. Microbiol. 2003;6:125–134. doi: 10.1016/s1369-5274(03)00033-x. [DOI] [PubMed] [Google Scholar]
- 4.Nevozhay D., Adams R.M., Balázsi G. Negative autoregulation linearizes the dose-response and suppresses the heterogeneity of gene expression. Proc. Natl. Acad. Sci. USA. 2009;106:5123–5128. doi: 10.1073/pnas.0809901106. [DOI] [PMC free article] [PubMed] [Google Scholar]
- 5.Becskei A., Serrano L. Engineering stability in gene networks by autoregulation. Nature. 2000;405:590–593. doi: 10.1038/35014651. [DOI] [PubMed] [Google Scholar]
- 6.Novák B., Tyson J.J. Design principles of biochemical oscillators. Nat. Rev. Mol. Cell Biol. 2008;9:981–991. doi: 10.1038/nrm2530. [DOI] [PMC free article] [PubMed] [Google Scholar]
- 7.Mitrophanov A.Y., Groisman E.A. Positive feedback in cellular control systems. BioEssays. 2008;30:542–555. doi: 10.1002/bies.20769. [DOI] [PMC free article] [PubMed] [Google Scholar]
- 8.Cheng Z., Liu F., Wang W. Robustness analysis of cellular memory in an autoactivating positive feedback system. FEBS Lett. 2008;582:3776–3782. doi: 10.1016/j.febslet.2008.10.005. [DOI] [PubMed] [Google Scholar]
- 9.Kim D., Kwon Y.K., Cho K.H. Coupled positive and negative feedback circuits form an essential building block of cellular signaling pathways. BioEssays. 2007;29:85–90. doi: 10.1002/bies.20511. [DOI] [PubMed] [Google Scholar]
- 10.Tian X.J., Zhang X.P., Wang W. Interlinking positive and negative feedback loops creates a tunable motif in gene regulatory networks. Phys. Rev. E Stat. Nonlin. Soft Matter Phys. 2009;80:011926. doi: 10.1103/PhysRevE.80.011926. [DOI] [PubMed] [Google Scholar]
- 11.Ramsey S.A., Smith J.J., Aitchison J.D. Dual feedback loops in the GAL regulon suppress cellular heterogeneity in yeast. Nat. Genet. 2006;38:1082–1087. doi: 10.1038/ng1869. [DOI] [PubMed] [Google Scholar]
- 12.Bhalla U.S., Iyengar R. Robustness of the bistable behavior of a biological signaling feedback loop. Chaos. 2001;11:221–226. doi: 10.1063/1.1350440. [DOI] [PubMed] [Google Scholar]
- 13.Pomerening J.R., Sontag E.D., Ferrell J.E., Jr. Building a cell cycle oscillator: hysteresis and bistability in the activation of Cdc2. Nat. Cell Biol. 2003;5:346–351. doi: 10.1038/ncb954. [DOI] [PubMed] [Google Scholar]
- 14.Shearman L.P., Sriram S., Reppert S.M. Interacting molecular loops in the mammalian circadian clock. Science. 2000;288:1013–1019. doi: 10.1126/science.288.5468.1013. [DOI] [PubMed] [Google Scholar]
- 15.Randall L.P., Woodward M.J. The multiple antibiotic resistance (mar) locus and its significance. Res. Vet. Sci. 2002;72:87–93. doi: 10.1053/rvsc.2001.0537. [DOI] [PubMed] [Google Scholar]
- 16.George A.M., Levy S.B. Amplifiable resistance to tetracycline, chloramphenicol, and other antibiotics in Escherichia coli: involvement of a non-plasmid-determined efflux of tetracycline. J. Bacteriol. 1983;155:531–540. doi: 10.1128/jb.155.2.531-540.1983. [DOI] [PMC free article] [PubMed] [Google Scholar]
- 17.George A.M., Levy S.B. Gene in the major cotransduction gap of the Escherichia coli K-12 linkage map required for the expression of chromosomal resistance to tetracycline and other antibiotics. J. Bacteriol. 1983;155:541–548. doi: 10.1128/jb.155.2.541-548.1983. [DOI] [PMC free article] [PubMed] [Google Scholar]
- 18.Alekshun M.N., Levy S.B. Regulation of chromosomally mediated multiple antibiotic resistance: the mar regulon. Antimicrob. Agents Chemother. 1997;41:2067–2075. doi: 10.1128/aac.41.10.2067. [DOI] [PMC free article] [PubMed] [Google Scholar]
- 19.Martin R.G., Nyantakyi P.S., Rosner J.L. Regulation of the multiple antibiotic resistance (mar) regulon by marORA sequences in Escherichia coli. J. Bacteriol. 1995;177:4176–4178. doi: 10.1128/jb.177.14.4176-4178.1995. [DOI] [PMC free article] [PubMed] [Google Scholar]
- 20.Vinué L., McMurry L.M., Levy S.B. The 216-bp marB gene of the marRAB operon in Escherichia coli encodes a periplasmic protein which reduces the transcription rate of marA. FEMS Microbiol. Lett. 2013;345:49–55. doi: 10.1111/1574-6968.12182. [DOI] [PMC free article] [PubMed] [Google Scholar]
- 21.Cohen S.P., Hächler H., Levy S.B. Genetic and functional analysis of the multiple antibiotic resistance (mar) locus in Escherichia coli. J. Bacteriol. 1993;175:1484–1492. doi: 10.1128/jb.175.5.1484-1492.1993. [DOI] [PMC free article] [PubMed] [Google Scholar]
- 22.Martin R.G., Rosner J.L. Binding of purified multiple antibiotic-resistance repressor protein (MarR) to mar operator sequences. Proc. Natl. Acad. Sci. USA. 1995;92:5456–5460. doi: 10.1073/pnas.92.12.5456. [DOI] [PMC free article] [PubMed] [Google Scholar]
- 23.Alekshun M.N., Levy S.B. Alteration of the repressor activity of MarR, the negative regulator of the Escherichia coli marRAB locus, by multiple chemicals in vitro. J. Bacteriol. 1999;181:4669–4672. doi: 10.1128/jb.181.15.4669-4672.1999. [DOI] [PMC free article] [PubMed] [Google Scholar]
- 24.Cohen S.P., Levy S.B., Rosner J.L. Salicylate induction of antibiotic resistance in Escherichia coli: activation of the mar operon and a mar-independent pathway. J. Bacteriol. 1993;175:7856–7862. doi: 10.1128/jb.175.24.7856-7862.1993. [DOI] [PMC free article] [PubMed] [Google Scholar]
- 25.Martin R.G., Jair K.W., Rosner J.L. Autoactivation of the marRAB multiple antibiotic resistance operon by the MarA transcriptional activator in Escherichia coli. J. Bacteriol. 1996;178:2216–2223. doi: 10.1128/jb.178.8.2216-2223.1996. [DOI] [PMC free article] [PubMed] [Google Scholar]
- 26.Sulavik M.C., Gambino L.F., Miller P.F. The MarR repressor of the multiple antibiotic resistance (mar) operon in Escherichia coli: prototypic member of a family of bacterial regulatory proteins involved in sensing phenolic compounds. Mol. Med. 1995;1:436–446. [PMC free article] [PubMed] [Google Scholar]
- 27.Seoane A.S., Levy S.B. Characterization of MarR, the repressor of the multiple antibiotic resistance (mar) operon in Escherichia coli. J. Bacteriol. 1995;177:3414–3419. doi: 10.1128/jb.177.12.3414-3419.1995. [DOI] [PMC free article] [PubMed] [Google Scholar]
- 28.Tobes R., Ramos J.L. AraC-XylS database: a family of positive transcriptional regulators in bacteria. Nucleic Acids Res. 2002;30:318–321. doi: 10.1093/nar/30.1.318. [DOI] [PMC free article] [PubMed] [Google Scholar]
- 29.Rhee S., Martin R.G., Davies D.R. A novel DNA-binding motif in MarA: the first structure for an AraC family transcriptional activator. Proc. Natl. Acad. Sci. USA. 1998;95:10413–10418. doi: 10.1073/pnas.95.18.10413. [DOI] [PMC free article] [PubMed] [Google Scholar]
- 30.Griffith K.L., Shah I.M., Wolf R.E., Jr. Proteolytic degradation of Escherichia coli transcription activators SoxS and MarA as the mechanism for reversing the induction of the superoxide (SoxRS) and multiple antibiotic resistance (Mar) regulons. Mol. Microbiol. 2004;51:1801–1816. doi: 10.1046/j.1365-2958.2003.03952.x. [DOI] [PubMed] [Google Scholar]
- 31.Martin R.G., Gillette W.K., Rosner J.L. Structural requirements for marbox function in transcriptional activation of mar/sox/rob regulon promoters in Escherichia coli: sequence, orientation, and spatial relationship to the core promoter. Mol. Microbiol. 1999;34:431–441. doi: 10.1046/j.1365-2958.1999.01599.x. [DOI] [PubMed] [Google Scholar]
- 32.Okusu H., Ma D., Nikaido H. AcrAB efflux pump plays a major role in the antibiotic resistance phenotype of Escherichia coli multiple-antibiotic-resistance (Mar) mutants. J. Bacteriol. 1996;178:306–308. doi: 10.1128/jb.178.1.306-308.1996. [DOI] [PMC free article] [PubMed] [Google Scholar]
- 33.Schneiders T., Barbosa T.M., Levy S.B. The Escherichia coli transcriptional regulator MarA directly represses transcription of purA and hdeA. J. Biol. Chem. 2004;279:9037–9042. doi: 10.1074/jbc.M313602200. [DOI] [PubMed] [Google Scholar]
- 34.Fralick J.A. Evidence that TolC is required for functioning of the Mar/AcrAB efflux pump of Escherichia coli. J. Bacteriol. 1996;178:5803–5805. doi: 10.1128/jb.178.19.5803-5805.1996. [DOI] [PMC free article] [PubMed] [Google Scholar]
- 35.White S., Tuttle F.E., Slonczewski J.L. pH dependence and gene structure of inaA in Escherichia coli. J. Bacteriol. 1992;174:1537–1543. doi: 10.1128/jb.174.5.1537-1543.1992. [DOI] [PMC free article] [PubMed] [Google Scholar]
- 36.Jair K.W., Martin R.G., Wolf R.E., Jr. Purification and regulatory properties of MarA protein, a transcriptional activator of Escherichia coli multiple antibiotic and superoxide resistance promoters. J. Bacteriol. 1995;177:7100–7104. doi: 10.1128/jb.177.24.7100-7104.1995. [DOI] [PMC free article] [PubMed] [Google Scholar]
- 37.White D.G., Goldman J.D., Levy S.B. Role of the acrAB locus in organic solvent tolerance mediated by expression of marA, soxS, or robA in Escherichia coli. J. Bacteriol. 1997;179:6122–6126. doi: 10.1128/jb.179.19.6122-6126.1997. [DOI] [PMC free article] [PubMed] [Google Scholar]
- 38.Jair K.W., Yu X., Wolf R.E., Jr. Transcriptional activation of promoters of the superoxide and multiple antibiotic resistance regulons by Rob, a binding protein of the Escherichia coli origin of chromosomal replication. J. Bacteriol. 1996;178:2507–2513. doi: 10.1128/jb.178.9.2507-2513.1996. [DOI] [PMC free article] [PubMed] [Google Scholar]
- 39.Li Z., Demple B. SoxS, an activator of superoxide stress genes in Escherichia coli. Purification and interaction with DNA. J. Biol. Chem. 1994;269:18371–18377. [PubMed] [Google Scholar]
- 40.Martin R.G., Bartlett E.S., Wall M.E. Activation of the Escherichia coli marA/soxS/rob regulon in response to transcriptional activator concentration. J. Mol. Biol. 2008;380:278–284. doi: 10.1016/j.jmb.2008.05.015. [DOI] [PMC free article] [PubMed] [Google Scholar]
- 41.Martin R.G., Gillette W.K., Rosner J.L. Promoter discrimination by the related transcriptional activators MarA and SoxS: differential regulation by differential binding. Mol. Microbiol. 2000;35:623–634. doi: 10.1046/j.1365-2958.2000.01732.x. [DOI] [PubMed] [Google Scholar]
- 42.Martin R.G., Rosner J.L. Genomics of the marA/soxS/rob regulon of Escherichia coli: identification of directly activated promoters by application of molecular genetics and informatics to microarray data. Mol. Microbiol. 2002;44:1611–1624. doi: 10.1046/j.1365-2958.2002.02985.x. [DOI] [PubMed] [Google Scholar]
- 43.Barbosa T.M., Levy S.B. Differential expression of over 60 chromosomal genes in Escherichia coli by constitutive expression of MarA. J. Bacteriol. 2000;182:3467–3474. doi: 10.1128/jb.182.12.3467-3474.2000. [DOI] [PMC free article] [PubMed] [Google Scholar]
- 44.Chubiz L.M., Glekas G.D., Rao C.V. Transcriptional cross talk within the mar-sox-rob regulon in Escherichia coli is limited to the Rob and marRAB operons. J. Bacteriol. 2012;194:4867–4875. doi: 10.1128/JB.00680-12. [DOI] [PMC free article] [PubMed] [Google Scholar]
- 45.McMurry L.M., Levy S.B. Evidence that regulatory protein MarA of Escherichia coli represses rob by steric hindrance. J. Bacteriol. 2010;192:3977–3982. doi: 10.1128/JB.00103-10. [DOI] [PMC free article] [PubMed] [Google Scholar]
- 46.Michán C., Manchado M., Pueyo C. SoxRS down-regulation of rob transcription. J. Bacteriol. 2002;184:4733–4738. doi: 10.1128/JB.184.17.4733-4738.2002. [DOI] [PMC free article] [PubMed] [Google Scholar]
- 47.Martin R.G., Rosner J.L. Transcriptional and translational regulation of the marRAB multiple antibiotic resistance operon in Escherichia coli. Mol. Microbiol. 2004;53:183–191. doi: 10.1111/j.1365-2958.2004.04080.x. [DOI] [PubMed] [Google Scholar]
- 48.Garcia-Bernardo J., Dunlop M.J. Tunable stochastic pulsing in the Escherichia coli multiple antibiotic resistance network from interlinked positive and negative feedback loops. PLOS Comput. Biol. 2013;9:e1003229. doi: 10.1371/journal.pcbi.1003229. [DOI] [PMC free article] [PubMed] [Google Scholar]
- 49.Alekshun M.N., Levy S.B., Head J.F. The crystal structure of MarR, a regulator of multiple antibiotic resistance, at 2.3 Å resolution. Nat. Struct. Biol. 2001;8:710–714. doi: 10.1038/90429. [DOI] [PubMed] [Google Scholar]
- 50.Ariza R.R., Cohen S.P., Demple B. Repressor mutations in the marRAB operon that activate oxidative stress genes and multiple antibiotic resistance in Escherichia coli. J. Bacteriol. 1994;176:143–148. doi: 10.1128/jb.176.1.143-148.1994. [DOI] [PMC free article] [PubMed] [Google Scholar]
- 51.Wilkinson S.P., Grove A. Ligand-responsive transcriptional regulation by members of the MarR family of winged helix proteins. Curr. Issues Mol. Biol. 2006;8:51–62. [PubMed] [Google Scholar]
- 52.Gillespie D.T. Exact stochastic simulation of coupled chemical reactions. J. Phys. Chem. 1977;81:2340–2361. [Google Scholar]
- 53.Gillespie D.T. A general method for numerically simulating the stochastic time evolution of coupled chemical reactions. J. Comput. Phys. 1976;22:403–434. [Google Scholar]
- 54.Prajapat M.K., Saini S. Role of feedback and network architecture in controlling virulence gene expression in Bordetella. Mol. Biosyst. 2013;9:2635–2644. doi: 10.1039/c3mb70213h. [DOI] [PubMed] [Google Scholar]
- 55.Blattner F.R., Plunkett G., 3rd, Shao Y. The complete genome sequence of Escherichia coli K-12. Science. 1997;277:1453–1462. doi: 10.1126/science.277.5331.1453. [DOI] [PubMed] [Google Scholar]
- 56.Kalir S., McClure J., Alon U. Ordering genes in a flagella pathway by analysis of expression kinetics from living bacteria. Science. 2001;292:2080–2083. doi: 10.1126/science.1058758. [DOI] [PubMed] [Google Scholar]
- 57.Prajapat, M. K., K. Jain, …, S. Saini. 2015. Revisiting demand rules for gene regulation. bioRxiv 01/2015. [DOI] [PubMed]
- 58.Salgado H., Peralta-Gil M., Collado-Vides J. REGULONDB Ver. 8.0: omics data sets, evolutionary conservation, regulatory phrases, cross-validated gold standards and more. Nucleic Acids Res. 2013;41:D203–D213. doi: 10.1093/nar/gks1201. [DOI] [PMC free article] [PubMed] [Google Scholar]
- 59.Acar M., Becskei A., van Oudenaarden A. Enhancement of cellular memory by reducing stochastic transitions. Nature. 2005;435:228–232. doi: 10.1038/nature03524. [DOI] [PubMed] [Google Scholar]
- 60.Mohamed H.A., Yao W., Byrne J.H. cAMP-response elements in Aplysia creb1, creb2, and Ap-uch promoters: implications for feedback loops modulating long term memory. J. Biol. Chem. 2005;280:27035–27043. doi: 10.1074/jbc.M502541200. [DOI] [PubMed] [Google Scholar]
- 61.Zhang X.P., Cheng Z., Wang W. Linking fast and slow positive feedback loops creates an optimal bistable switch in cell signaling. Phys. Rev. E Stat. Nonlin. Soft Matter Phys. 2007;76:031924. doi: 10.1103/PhysRevE.76.031924. [DOI] [PubMed] [Google Scholar]
- 62.Brandman O., Ferrell J.E., Jr., Meyer T. Interlinked fast and slow positive feedback loops drive reliable cell decisions. Science. 2005;310:496–498. doi: 10.1126/science.1113834. [DOI] [PMC free article] [PubMed] [Google Scholar]
- 63.Babu M.M., Luscombe N.M., Teichmann S.A. Structure and evolution of transcriptional regulatory networks. Curr. Opin. Struct. Biol. 2004;14:283–291. doi: 10.1016/j.sbi.2004.05.004. [DOI] [PubMed] [Google Scholar]
- 64.Price M.N., Dehal P.S., Arkin A.P. Horizontal gene transfer and the evolution of transcriptional regulation in Escherichia coli. Genome Biol. 2008;9:R4. doi: 10.1186/gb-2008-9-1-r4. [DOI] [PMC free article] [PubMed] [Google Scholar]
- 65.Cosentino Lagomarsino M., Jona P., Isambert H. Hierarchy and feedback in the evolution of the Escherichia coli transcription network. Proc. Natl. Acad. Sci. USA. 2007;104:5516–5520. doi: 10.1073/pnas.0609023104. [DOI] [PMC free article] [PubMed] [Google Scholar]
- 66.Teichmann S.A., Babu M.M. Gene regulatory network growth by duplication. Nat. Genet. 2004;36:492–496. doi: 10.1038/ng1340. [DOI] [PubMed] [Google Scholar]
- 67.Rajewsky N., Socci N.D., Siggia E.D. The evolution of DNA regulatory regions for proteo-γ bacteria by interspecies comparisons. Genome Res. 2002;12:298–308. doi: 10.1101/gr.207502. [DOI] [PMC free article] [PubMed] [Google Scholar]
- 68.Lozada-Chávez I., Janga S.C., Collado-Vides J. Bacterial regulatory networks are extremely flexible in evolution. Nucleic Acids Res. 2006;34:3434–3445. doi: 10.1093/nar/gkl423. [DOI] [PMC free article] [PubMed] [Google Scholar]
- 69.Gelfand M.S. Evolution of transcriptional regulatory networks in microbial genomes. Curr. Opin. Struct. Biol. 2006;16:420–429. doi: 10.1016/j.sbi.2006.04.001. [DOI] [PubMed] [Google Scholar]
- 70.Zaret K.S. Stability and evolution of transcriptional regulatory networks. Mol. Syst. Biol. 2006;2 doi: 10.1038/msb4100066. 2006-0021. [DOI] [PMC free article] [PubMed] [Google Scholar]
- 71.Cases I., de Lorenzo V. Promoters in the environment: transcriptional regulation in its natural context. Nat. Rev. Microbiol. 2005;3:105–118. doi: 10.1038/nrmicro1084. [DOI] [PubMed] [Google Scholar]
- 72.Angeli D., Ferrell J.E., Jr., Sontag E.D. Detection of multistability, bifurcations, and hysteresis in a large class of biological positive-feedback systems. Proc. Natl. Acad. Sci. USA. 2004;101:1822–1827. doi: 10.1073/pnas.0308265100. [DOI] [PMC free article] [PubMed] [Google Scholar]
- 73.Kim J.R., Yoon Y., Cho K.H. Coupled feedback loops form dynamic motifs of cellular networks. Biophys. J. 2008;94:359–365. doi: 10.1529/biophysj.107.105106. [DOI] [PMC free article] [PubMed] [Google Scholar]
- 74.Rosenfeld N., Elowitz M.B., Alon U. Negative autoregulation speeds the response times of transcription networks. J. Mol. Biol. 2002;323:785–793. doi: 10.1016/s0022-2836(02)00994-4. [DOI] [PubMed] [Google Scholar]
- 75.Koch A.L. The protein burden of lac operon products. J. Mol. Evol. 1983;19:455–462. doi: 10.1007/BF02102321. [DOI] [PubMed] [Google Scholar]
- 76.Kurland C.G., Dong H. Bacterial growth inhibition by overproduction of protein. Mol. Microbiol. 1996;21:1–4. doi: 10.1046/j.1365-2958.1996.5901313.x. [DOI] [PubMed] [Google Scholar]
- 77.Shachrai I., Zaslaver A., Dekel E. Cost of unneeded proteins in E. coli is reduced after several generations in exponential growth. Mol. Cell. 2010;38:758–767. doi: 10.1016/j.molcel.2010.04.015. [DOI] [PubMed] [Google Scholar]
- 78.Xiong W., Ferrell J.E., Jr. A positive-feedback-based bistable ‘memory module’ that governs a cell fate decision. Nature. 2003;426:460–465. doi: 10.1038/nature02089. [DOI] [PubMed] [Google Scholar]
- 79.Saini S., Ellermeier J.R., Rao C.V. The role of coupled positive feedback in the expression of the SPI1 type three secretion system in Salmonella. PLoS Pathog. 2010;6:e1001025. doi: 10.1371/journal.ppat.1001025. [DOI] [PMC free article] [PubMed] [Google Scholar]
- 80.Paszek P., Ryan S., White M.R. Population robustness arising from cellular heterogeneity. Proc. Natl. Acad. Sci. USA. 2010;107:11644–11649. doi: 10.1073/pnas.0913798107. [DOI] [PMC free article] [PubMed] [Google Scholar]
- 81.Beaumont H.J., Gallie J., Rainey P.B. Experimental evolution of bet hedging. Nature. 2009;462:90–93. doi: 10.1038/nature08504. [DOI] [PubMed] [Google Scholar]
- 82.Grimbergen A.J., Siebring J., Kuipers O.P. Microbial bet-hedging: the power of being different. Curr. Opin. Microbiol. 2015;25:67–72. doi: 10.1016/j.mib.2015.04.008. [DOI] [PubMed] [Google Scholar]
- 83.Veening J.W., Smits W.K., Kuipers O.P. Bistability, epigenetics, and bet-hedging in bacteria. Annu. Rev. Microbiol. 2008;62:193–210. doi: 10.1146/annurev.micro.62.081307.163002. [DOI] [PubMed] [Google Scholar]
Associated Data
This section collects any data citations, data availability statements, or supplementary materials included in this article.