

Abstract
Metazoan development depends on accurate execution of differentiation programs that allow pluripotent stem cells to adopt specific fates 1. Differentiation requires changes to chromatin architecture and transcriptional networks, yet whether other regulatory events support cell fate determination is less well understood. Here, we have identified the vertebrate-specific ubiquitin ligase CUL3KBTBD8 as an essential regulator of neural crest specification. CUL3KBTBD8 monoubiquitylates NOLC1 and its paralog TCOF1, whose mutation underlies the neurocristopathy Treacher Collins Syndrome 2,3. Ubiquitylation drives formation of a TCOF1-NOLC1 platform that connects RNA polymerase I with ribosome modification enzymes and remodels the translational program of differentiating cells in favor of neural crest specification. We conclude that ubiquitin-dependent regulation of translation is an important feature of cell fate determination.
Keywords: ubiquitin, Cul3, monoubiquitylation, neural crest, ribosome
Cullin-RING ligases (CRLs), the largest class of ubiquitylation enzymes, play critical roles in metazoan development 4–10. CRLs recognize their substrates through ~300 adaptor proteins, several of which are differentially expressed during development 11–13. Although mutations in CRL adaptors have been linked to human pathology 14–16, little is known about how distinct CRLs ensure robust differentiation into specialized cell types.
To discover CRLs with crucial roles in development, we employed genome-wide transcript analysis of differentiating human embryonic stem cells (hESCs). These experiments revealed a strong reduction in the abundance of the vertebrate-specific CUL3 adaptor KBTBD8 during hESC differentiation (Extended Data Fig. 1a–c), which we confirmed for KBTBD8 mRNA and protein by qRT-PCR and Western analysis (Extended Data Fig. 1d–g). Consistent with evolutionary conservation, downregulation of KBTBD8 was observed in differentiating mouse ESCs (Extended Data Fig. 1h, i), as well as during Xenopus tropicalis development 17.
Depletion of KBTBD8 did not affect the cell cycle, survival, or pluripotency programs of hESCs (Extended Data Fig. 2a–e). Instead, gene expression profiles of hESCs subjected to embryoid body-differentiation suggested that KBTBD8 was required for neural crest specification (Extended Data Fig. 2f; Table S1). qRT-PCR experiments confirmed that loss of KBTBD8 reduced expression of neural crest markers, including FOXD3 and SOX10, which was accompanied by an increase in transcripts associated with central nervous system (CNS) precursor and forebrain identity (FOXG1, SIX3; Extended Data Fig. 2g).
Based on these observations, we subjected hESCs to dual-SMAD inhibition (“neural conversion”), which directs differentiation towards CNS precursor and neural crest cells 18. As during embryoid body differentiation, depletion of KBTBD8 caused a striking loss of neural crest cells and an increase in CNS precursors (Fig. 1a, b), which was seen for multiple shRNAs and rescued by shRNA-resistant KBTBD8 (Fig. 2c; Extended Data Fig. 3g). We corroborated these results with single-cell resolution using the neural crest marker SOX10 (Fig. 1c) or AP2, p75, and HNK1, which are co-expressed in most neural crest cells (Extended Data Fig. 3a). KBTBD8 was required for early neural crest specification, with CNS precursor markers accumulating in KBTBD8-depleted cells when neural crest markers were first detected in control experiments (Extended Data Fig. 3b–h). KBTBD8 was accordingly critical for differentiation of hESC-derived neural crest cells into glia, mesenchymal cells, melanocytes, or chondrocytes (Extended Data Fig. 4a, b). Also in Xenopus tropicalis, downregulation or inhibition of CUL3KBTBD8 prevented neural crest formation and caused an expansion of the CNS precursor territory in the manipulated part of the embryo (Fig. 1d; Extended Data Fig. 4c). Thus, CUL3KBTBD8 regulates a developmental switch that controls the generation of the neural crest, an embryonic cell population that is found only in vertebrates (Fig. 1e).
Figure 1. CUL3KBTBD8 drives neural crest specification.

a. hESCs stably depleted of KBTBD8 were subjected to neural conversion and analyzed by qRT-PCR. (mean of 3 technical replicates, +/− s.e.m) b. Depletion of KBTBD8 results in loss of neural crest cells, as determined by Western analysis (full scans in Supplementary Fig. 1). c. KBTBD8-depleted hESCs were subjected to neural conversion and analyzed by immunofluorescence microscopy (mean of 3 biological replicates, +/− s.e.m; ~1500 cells/condition). d. X. tropicalis embryos injected with translation-blocking morpholinos against KBTBD8 were analyzed by in situ-hybridization. e. Model of the CUL3KBTBD8-controlled developmental switch.
Figure 2. CUL3KBTBD8 monoubiquitylates TCOF1 and NOLC1.

a. High-confidence interactors of wt- or mutant KBTBD8. Left: normalized TSCs per interactor of wt-KBTBD8 (sum of 3 biological replicates/condition). Right: heatmap depicting binding relative to wt-KBTBD8. b. Verification of KBTBD8 interactions in 293T cells by αFLAG-immunoprecipitation and Western. c. Immunoprecipitation of KBTBD8 from hESCs (full scans in Supplementary Fig. 1). d. Ubiquitylated HATCOF1 detected after denaturing Ni-NTA purification in 293T cells reconstituted with KBTBD8 variants e. Monoubiquitylation of HANOLC1 by CUL3KBTBD8 in 293T cells. f. Monoubiquitylation of endogenous TCOF1 and NOLC1 in 293T cells reconstituted with KBTBD8 variants and HISubiquitinL73P.
To isolate essential targets of CUL3KBTBD8, we used CompPASS mass spectrometry to capture proteins that bound wild-type KBTBD8, but not variants with a mutant substrate-binding domain (KBTBD8W579A; Extended Data Fig. 5a–d). These interaction networks identified the paralogs NOLC1 and TCOF1 as predominant interactors of KBTBD8, which were not recognized by KBTBD8W579A (Fig. 2a). Using Western analysis, we confirmed binding of TCOF1 and NOLC1 to KBTBD8, but not KBTBD8W579A (Fig. 2b), and showed that the same association occurred between endogenous proteins in hESCs (Fig. 2c) and in reconstituted in vitro systems (Extended Data Fig. S5e, f). Denaturing purification of ubiquitin conjugates revealed that KBTBD8, but neither KBTBD8W579A nor CUL3-binding deficient KBTBD8Y74A, induced the robust monoubiquitylation of TCOF1 and NOLC1 (Fig. 2d–f). These events required a cofactor, β-arrestin, whose depletion prevented KBTBD8-recognition and monoubiquitylation of TCOF1 and NOLC1 (Extended Data Fig. 5g–j).
Similar to loss of KBTBD8, hESCs expressing only KBTBD8W579A or KBTBD8Y74A failed to support neural crest specification and showed increased abundance of CNS precursors (Fig. 3a, b; Extended Figure 6a, b). The same aberrant differentiation program was observed if we depleted TCOF1 or NOLC1 (Fig. 3a, c; Extended Data Fig. 6a, c, d), but not other KBTBD8-binding partners (Fig. 3a; Extended Data Fig. 6e, f). Demonstrating that these proteins act in a common pathway, co-depletion of KBTBD8 and TCOF1 or NOLC1, respectively, mirrored the differentiation program of singly depleted hESCs (Fig. 3d). We therefore conclude that TCOF1 and NOLC1 are critical monoubiquitylation substrates of CUL3KBTBD8 during neural crest specification. Consistent with this notion, mutations in TCOF1 cause Treacher Collins Syndrome, a craniofacial disorder characterized by loss of cranial neural crest cells 2,3.
Figure 3. CUL3KBTBD8 controls neural crest specification through TCOF1- and NOLC1.

a. hESCs were reconstituted with shRNA-resistant KBTBD8 variants or depleted of KBTBD8-binding partners; subjected to neural conversion (9d); and analyzed by qRT-PCR and unsupervised clustering. b. Protein expression during neural conversion of hESCs reconstituted with shRNA-resistant KBTBD8 variants (full scans in Supplementary Fig. 1). c. Protein expression in hESCs stably depleted of KBTBD8, TCOF1, or NOLC1 and subjected to neural conversion. d. hESCs were stably depleted of the indicated combinations of KBTBD8, TCOF1, or NOLC1, subjected to neural conversion (9d), and analyzed by qRT-PCR.
To understand how CUL3KBTBD8 drives neural crest specification, we identified proteins that selectively recognized ubiquitylated, but not unmodified TCOF1, using cells that were reconstituted with either wt-KBTBD8, inactive KBTBD8Y74A, or empty vector. Strikingly, NOLC1 emerged as the major effector that was recruited to ubiquitylated TCOF1 (Fig. 4a), an observation that was confirmed by affinity-purification coupled to Western analysis (Fig. 4b). Monoubiquitylation often stabilizes binding partners, and indeed, depletion of KBTBD8 caused degradation of both TCOF1 and NOLC1 at later stages of neural conversion (Fig. 3c; Extended Data Fig. 7a, b).
Figure 4. Ubiquitylation-dependent TCOF1/NOLC1-complexes couple RNA polymerase I to ribosome modification enzymes.

a. Interactors of TCOF1 in 293T cells reconstituted with KBTBD8 or KBTBD8Y74A (sum of 3 biological replicates/condition). b. Validation of CUL3KBTBD8-dependent formation of TCOF1/NOLC1 complexes. c. CompPASS mass spectrometry analysis of sequential immunoprecipitation of FLAGTCOF1/HANOLC1-complexes. d. Validation of sequential affinity-purification of KBTBD8-dependent TCOF1/NOLC1-complexes (full scans in Supplementary Figure 1). e. Immunoprecipitation of RNA polymerase I from 293T cells reconstituted with KBTBD8 variants. f. Immunoprecipitation of RNA polymerase I from hESCs depleted of KBTBD8. g. Model of ubiquitin-dependent formation of a TCOF1/NOLC1-platform.
Based on these results, we established a sequential affinity purification protocol to determine the composition of ubiquitylation-dependent TCOF1/NOLC1-complexes. We found that TCOF1/NOLC1-assemblies engaged RNA polymerase I; the H/ACA complex catalyzing rRNA pseudouridylation; and the SSU processome controlling maturation and modification of the small ribosomal subunit (Fig. 4c, d; Extended Data Fig. 7c). Accordingly, ubiquitylation by CUL3KBTBD8 brought endogenous RNA polymerase I into complexes with the SSU processome (Fig. 4e), which required TCOF1 and NOLC1 (Extended Data Fig. 7d). Similar observations were made in hESCs, where a robust interaction between RNA polymerase I and SSU processome was lost upon depletion of KBTBD8 (Fig. 4f). Thus, CUL3KBTBD8 induces the ubiquitin-dependent formation of TCOF1/NOLC1-complexes that serve as a platform to connect RNA polymerase I with enzymes responsible for ribosomal processing and modification (Fig. 4g). This observation supports a role of ubiquitylation in neural crest specification, as mutations in RNA polymerase I also cause Treacher Collins Syndrome 19.
Although KBTBD8 targets proteins linked to ribosome biogenesis, its depletion did not affect the abundance of rRNAs or mRNAs encoding ribosomal proteins; levels of ribosomal proteins; processing of precursor rRNAs; nucleolar integrity; export of the small ribosomal subunit; ribosome binding to mRNA judged by polysome gradient analysis; global mRNA translation detected by metabolic labeling; or cell survival (Fig. 5a, d; Extended Data Fig. 8a–h). Accordingly, a global reduction in translation caused by rapamycin did not phenocopy the loss of KBTBD8 (Extended Data Fig. 9a, b). Depletion of TCOF1 also did not affect rRNA synthesis, p53 activation, or cell survival at the time of neural crest specification (Extended Data Fig. 9c–e), although consistent with previous work 3,20, it reduced rRNA levels and triggered cell death at late stages of neural conversion (Extended Data Fig. 9f, g). These observations implied that KBTBD8 and TCOF1 initially specify neural crest fate without altering ribosome abundance, global mRNA translation, or cell survival.
Figure 5. CUL3KBTBD8 remodels translational programs during differentiation.

a. 36S-methionine incorporation into newly synthesized proteins in hESCs lacking KBTBD8. (3 biological replicates +/− s.e.m.) b. RNA seq and ribosomal profiling of hESCs lacking KBTBD8 (blue: transcripts significantly changed in ribosome footprints but not mRNA; n>7725, q<0.1). c. Translation efficiency of ATRX1 and PCM1 in hESCs lacking KBTBD8. Orange: translation efficiency change; grey inserts: mRNA abundance change (mean of two biological replicates). d. Protein expression in hESCs lacking KBTBD8 during neural conversion (full scans in Supplementary Figure 1). e. Model of CUL3KBTBD8-dependent neural crest specification.
We therefore considered the possibility that CUL3KBTBD8-dependent assembly of a ribosome modification platform might produce ribosomes with distinct translational output. Indeed, as seen by RNA sequencing and ribosome profiling, depletion of KBTBD8 changed the translational program of cells undergoing neural conversion, whereas it had no effect on protein synthesis in hESCs (Fig. 5b; Extended Data Fig. 10a). Similar observations were made for TCOF1, and the translation efficiency profiles of differentiating hESCs lacking KBTBD8 or TCOF1 were correlated (Extended Data Fig. S10b). Loss of KBTBD8 caused changes in translation immediately after initiation of differentiation, and thus, prior to specification of hESCs into neural crest or CNS precursor cells (Fig. 5c).
Analysis of regulated mRNAs showed that KBTBD8 suppressed the production of proteins specifying CNS precursors, whereas it did not affect translation of mRNAs connected to neural crest specification (Extended Data Fig. S10c). In this manner, KBTBD8 or TCOF1 prevented the accumulation of CNS precursor proteins, including ATRX and PCM1, until neural crest specification had occurred (Fig. 5d; Extended Data Fig. 10d). Underscoring the role of translational control, KBTBD8 enforced the correct timing of ATRX- and PCM1-production without regulating their mRNA levels or protein stability (Fig. 5c, d; Extended Data Fig. S10d–f). The depletion of KBTBD8 also reduced the translation of mRNAs encoding histones or ribosomal components (Fig. 5b), yet as expected from their long half lives 21,22, the levels of the corresponding proteins were not diminished during our differentiation experiment (Fig. 5d). Thus, the CUL3KBTBD8-dependent formation of a ribosome modification platform alters translation of specific mRNAs, which delays accumulation of CNS precursor proteins until hESCs have accomplished neural crest specification.
Our work, therefore, documents an important role for ubiquitylation in remodeling translational programs during differentiation and defines an early function for the CUL3KBTBD8-substrate and Treacher-Collins Syndrome protein TCOF1 in neural crest specification. We hypothesize that CUL3KBTBD8 and TCOF1 may govern the production of differentially modified ribosomes, potentially including post-transcriptional changes in rRNA pseudouridylation and base methylation, or phosphorylation and ubiquitylation of ribosomal proteins or ribosome-associated factors. Such modifications may affect the interactions of ribosomes with select mRNAs, with factors that deliver specific mRNAs to the ribosome, or with proteins that control the synthesis or degradation of distinct mRNAs 23–25.
Together with studies implying specific functions for ribosomal proteins during differentiation 26,27, developmental switches controlled by ribosomal regulation might explain why mutations in ribosome biogenesis factors result in tissue-specific ribosomopathies 2,19,20,28–30. Manipulating such switches could lead to therapeutic strategies for pediatric diseases: as Treacher Collins Syndrome is caused by mutation of a single TCOF1 allele, increasing the efficiency of KBTBD8-dependent ubiquitylation of the remaining wt-TCOF1 might reconstitute ribosomal regulation and neural crest formation.
Methods
Plasmids, shRNAs, siRNAs, morpholinos
Full length KBTBD8 was cloned into pCDNA5 untagged, with a C-terminal 3xFLAG tag, or a C-terminal HA-tag, for expression in human cells, into pMAL with an N-terminal MBP-tag for expression in E. coli, and into pFastBac with an N-terminal 6xHis-tag for expression in Sf9 ES insect cells using the Bac-to-Bac baculovirus expression system (Invitrogen). For expression in human embryonic stem cells, KBTBD8 was cloned into pENTR1A with a C-terminal FLAG tag and recombined into pLenti-PGK-Hygro. Point mutants in KBTBD8’s BTB-BACK domain (Y74A, M78D, L73D, ST86,87AA, Y43A) and KBTBD8’s propeller domain (I352A, F450A, MF496,497AA, F550A, and W579A) were introduced into these vectors by site-directed mutagenesis and digestion of parental DNA with DpnI. Full length coding sequences of TCOF1 and NOLC1 were cloned into pCMV-3xFLAG or pCS2-HA-vectors for expression in human cells and in vitro transcription/translation (IVT/T), respectively, as described 31. His-Ubiquitin was cloned into a pCS2 vector for expression in cells 32. To generate a deubiquitylation-resistant ubiquitin variant, a L73P mutation was introduced in this vector by site-directed mutagenesis as described above. pLKO1-Puro Mission shRNA constructs targeting KBTBD8 (#1: TRCN0000130280, #2: TRCN0000128536), NOLC1 (#1: TRCN000061971, #2: TRCN0000298197), TCOF1 (#1: TRCN000008630), and BRD2 (#1 TRCN0000006310, #2 TRCN0000381007), DHX15 (#1: TRCN0000000006, #2: TRCN0000425479), PCNT (#1: TRCN0000162352, #2: TRCN0000162298), and ANKUB1 (#1: TRCN0000336646) were purchased from Sigma. siRNAs were from Dharmacon and sequences were as follows: Scrambled control (UAGCGACUAAACACAUCAAUU), ARRB1 (#1 CGGAGAAUUUGGAGGAGAAUU, #2 UCAUAGAACUUGACAAAUU), ARRB2 (#1 ACAAGGAGGUGCUGGGAAUUU, #2 CUAAAUCACUAGAAGAGAAUU), NOLC1 (#1 CCAAGAAGGCUGUGGAGAAUU, #2 CAGUUAAAGCUCAGAUAAUU, #3 UCUCAGAGGUGGCCAAUAAUU), TCOF1 (#1 CCAUCAAGCAUGAAAGAAUU, #2 GGAAAGGCCUCCAGGUGAAUU, #3 GGAAUCA-GACAGUGAGGAAUU).
Four morpholino oligonucleotides (Gene Tools, LLC) were used: kbtbd8 translation blocking: 5′-GTGCAGGAAACGTCACTTACTTCCT-3′, kbtbd8 splice blocking: 5′-TCTCCCAGCCCCAAACAACC-3′, cul3 splice blocking: 5′-AAGTATCCTATGAGTCTCACCGGGA-3′, and a control tracer morpholino with 3′-fluorescein modification: 5′-CCTCTTACCTCAGTTACAATTTATA-3′. Dominant negative CUL3 (N-terminal 250 amino acids of human CUL3) was cloned into pCS2+ and mRNA was synthesized for injection using an in vitro transcription system.
Proteins
KBTBD8, KBTBD8Y74A, and KBTBD8W579A were purified from ES Sf9 cells 72h after transduction. Lysates were prepared in 50 mM sodium phosphate, pH 8, 500 mM NaCl, and 10 mM imidazole by incubation with 200 μg/ml lysozyme and sonication. Lysates were cleared by centrifugation and incubated with Ni-NTA (QIAGEN) for 2h at 4°C. Beads were washed with lysis buffer containing 0.1% Triton. Proteins were eluted in 200 mM imidazole in 50 mM sodium phosphate, pH 8, 500 mM NaCl. TEV protease for His-tag removal was added and proteins were dialyzed overnight into 50 mM Tris pH 8.0, 100 mM NaCl, 2 mM DTT. Proteins were further purified by molecular sieving over a preparative Superdex 200 column in 50 mM Tris pH 8.0, 100 mM NaCl, 2 mM DTT. KBTBD8 or KBTBD8 mutant fractions were concentrated, aliquoted, flash-frozen in liquid nitrogen, and stored at −80°C.
MBP-tagged KBTBD8, KBTBD8Y74A, KBTBD8F550A, and KBTBD8W579A were expressed and purified from BL21/DE3 (RIL) cells. Cells were grown in LB-medium to OD600nm 0.5 followed by addition of 0.5mM IPTG and protein production for 16h at 18°C. Cells were harvested, lysed in 50mM sodium phosphate, pH 8, 500 mM NaCl, by incubation with 200μg/ml lysozyme and sonication, and cleared by centriguation. MBP-tagged proteins were isolated using amylose resin (NEB), washed with lysis buffer, and eluted in lysis buffer containing 10 mM maltose followed by dialysis into PBS containing 2 mM DTT.
Antibodies
Mouse monoclonal anit-KBTBD8 antibodies were produced with Promab using MBP-KBTBD8-250-601 as antigen (1 μg / mL in IB and 10 μg / mg lysate in IP). Anti-PAX6 (DSHB, clone P3U1, 1:1,000 in IB), anti-PAX6 (Biolegend, PRB-278B, 1:300 in IF), anti-TDGF (#4193, clone D81B12, Cell Signaling, 1:1,1000 in IB), anti-TFAP2 (#2509, Cell Signaling, 1:1000 in IB, 1:100 in IF), anti-CDH1 (#3195, clone 24E10, Cell Signaling, 1:1,000 in IB), anti-FOXG1 (ab18259, Abcam, 1:250 in IB), anti-p75 (AB-N07, clone ME20.4, Advanced Targeting Systems, 1:100 in IF), anti-HNK1 (C6680, clone VC1.1, Sigma, 1:500 in IF), anti-SOX10 (ab155279, Abcam, 1:2,000 in IB), anti-SOX10 (ab27655, Abcam, 1:100 in IF), anti-GFAP (#3670, clone GA5, Cell Signaling, 1:100 in IF), anti-SMA (A2547, clone 1A4, 1:100 in IF), anti-NF-L (#2837, clone C28E10, Cell Signaling, 1:100), anti-Tuj1 (#5568, clone D71G9, Cell Signaling, 1:100 in IF), anti-rRNA 5.8 (ab347144, clone Y10b, Abcam, 1:1,000 in IF), anti-TCOF1 (11003-1-AP, Proteintech, 1:250 in IB), anti-TCOF1 (sc-49529, Santa Cruz, 1:100 in IF), anti-FBL (ab5821, Abcam, 1:100 in IF)anti-NOLC1 (11815-1-P, Proteintech, 1:1,000 in IB), anti-ARRB1/2 (#4674, clone D24H9, Cell Signaling, 1:1,000 in IB), anti-PKN1 (610687, clone 49/PRK1, BD Bioscience, 1:1,000 in IB), anti-CUL3 (Bethyl, 1:1,000 in IB), anti-NANOG (#3580, Cell Signaling, 1:1,000 in IB), anti-OCT4 (ac-8628, Santa Cruz, 1:1,000 in IB), anti-SNAIL2 (#9585, clone C19G7, Cell Signaling, 1:500 in IB), anti-GAPDH (#2118, clone 14C10, Cell Signaling, 1:10,000 in IB), anti-BRD2 (#5848, clone D89B4, Cell Signaling, 1:500 in IB), anti-PCNA (Santa Cruz, 1:5,000 in IB), anti-RPA1 (Santa Cruz, 1:100 in IB, 4 μg / 1 mg lysate in IP), anti-RPA2 (sc-17913, Santa Cruz, 1:100 in IB), anti-RPB1 (sc-5943, Santa Cruz, 1:100 in IB), anti-DKC1 (sc-48794, Santa Cruz, 1:1,000 in IB), anti-NHP2 (sc-366967, Santa Cruz, 1:500 in IB), anti-NOP56 (A302-720A, Bethyl, 1:1,000 in IB), anti-NOP58 (A302-719A, Bethyl, 1:1,000 in IB), anti-CSK2A (#2656, Cell Signaling, 1:500 in IB), anti-cleaved Caspase-3 (#9664, clone 5A1E, Cell Signaling, 1:100 in IB), anti-ATRX (A301-045A, Bethyl, 1:500 in IB), anti-PCM1 (A301-149A, Bethyl, 1:500 in IB), anti-SNF2L (#12438, clone D4Q7V, Cell Signaling, 1:500 in IB), anti-HA (clone C29F4; Cell Signaling, 1:3,000 in IB), anti-Flag (F1804, clone M2, Sigma, 1:2,000 in IB), and anti-Flag (F7425, Sigma, 1:2,000 in IB) antibodies were commercially purchased.
Mammalian cell culture and transfections
Human embryonic kidney (HEK) 293T cells were maintained in DMEM with 10% fetal bovine serum. Plasmid transfections of HEK 293T cells were with calcium phosphate and siRNA transfections were with Lipofectamine RNAiMAX (Invitrogen) according to manufacturer’s instructions using 10 nM for each siRNA.
hES cell culture, lentiviral infections, and hES differentiations
Human embryonic stem (hES) H1 cells were obtained from the Wisconsin stem cell bank, routinely characterized for mycoplasma contamination, and maintained under feeder free conditions on Matrigel-coated plates (#354277, BD Biosiences) in mTeSRTM1, (#05871/05852, StemCell Technologies Inc.) and were routinely passaged with collagenase (#07909, StemCell Technologies Inc.) and ReLesR (#05872, StemCell Technologies Inc.).
Lentiviruses were produced in 293T cells by cotransfection of lentiviral constructs with packaging plasmids (Addgene) for 48–72 hr. Transduction was carried out by infecting <30% confluent hES H1 cells with lentiviruses in the presence of 6 μg/ml Polybrene (Sigma). After 7d of selection with appropriate antibiotic (0.5 μg/ml puromycin for pLKO1-puro-shRNA constructs, 500 μg/ml hygromycin for pLKO1-hygro-shRNA or pLenti-Hygro constructs), hES H1 cells were analyzed and used in differentiation experiments.
Embryoid body (EB) formation from hES H1 cells and hES H1 cells expressing control shRNA or shRNAs targeting KBTBD8 was performed using AggrewellTM800 plates (#27865, StemCell Technologies Inc.) and APEL medium (#05210, StemCell Technologies Inc.) following the guidelines of the manufacturer’s technical manual (#29146). In brief, single cell suspensions were prepared by treatment of hES cells with accutase (#07920, StemCell Technologies Inc.) and 1 x 10⁶ cells were seeded per well of an AggrewellTM800 plate in APEL medium supplemented with 10 μM Y-27632 ROCK inhibitor (Calbiochem). 24h after seeding, EBs were harvested and transferred into ultra-low adherence culture dishes (Corning) with < 1,000 EBs per well of a 6-well plate and differentiated in APEL medium for 3 and 6 d. Medium was replaced every other day.
Neural induction of hES H1 cells expressing different shRNA constructs was performed using STEMdiffTM Neural Induction Medium (#05831, StemCell Technologies Inc.) in combination with a monolayer culture method according to the manufacturer’s technical bulletin (#28044) and as previously described 18. In brief, single cell suspensions were prepared by treatment of hES cells with accutase and 1.25 – 1.5 x 10⁶ cells were seeded per well of a 6-well plate in STEMdiffTM Neural Induction Medium supplemented with 10 μM Y-27632 ROCK inhibitor. Neural induction was performed for 1, 3, 6, and 9 d with daily medium change. For inhibition of general protein translation, hESCs were subjected to the neural conversion protocol in the presence of 50 or 100 nM rapamycin.
For long term neural conversion experiments to assess spontaneous differentiation of neural crest cells into derivatives, hESCs were subjected to neural conversion using STEMdiffTM Neural Induction Medium as described above for 43d. Medium was changed daily until 18d, then every other day.
Microinjections and in situ hybridizations
Morpholinos (20ng) and mRNA (100pg) with 2ng of tracer morpholino were injected into the animal cap in 1 blastomere of 2-cell stage Xenopus tropicalis embryos. At stage 10–14, embryos were sorted by left or right injection side via tracer morpholino fluorescence. Embryos were developed to stage 16–18 and fixed for 4–6 hours in MEMFA at room temperature. In situ hybridization of X. tropicalis embryos with digoxygenin-labeled RNA probes were performed using a multi-basket method as described in ref. 33. Sorting and imaging were performed on a Zeiss SteREO Lumar.V12 microscope.
Cycloheximide (CHX) chase assays
For cycloheximide chase assays, control or KBTBD8-depleted hES H1 cells and cells that had undergone neural induction for 3 d were treated with 40 μg/mL CHX for 2, 4, and 6 h. Cells were lysed in 8M urea, 50mM sodium phosphate, pH 8.0. Lysates were diluted in SDS loading buffer, sonicated, and were analysed by immunoblotting. For quantification, immunoblot signals for respective proteins were quantified using ImageJ (NIH, http://rsbweb.nih.gov/ij/) and normalized to GAPDH or β-ACTIN.
Gene expression analysis by microarray
To compare gene expression profiles of hES H1 cells versus embryoid bodies (6 d), gene expression profiles of control versus KBTBD8-depleted hES H1 cells, and gene expression profiles of control versus KBTBD8-depleted embryoid bodies (6 d), we isolated and purified total RNA from respective samples using the RNeasy Mini Kit (Qiagen, catalogue no. 74104). Microarray analysis was performed in biological triplicates by the Functional Genomics Laboratory (UC Berkeley) using Affymetrix HUMAN GENE 1.0 ST ARRAY.
Quantitative real-time PCR (qRT-PCR) analysis
For qRT-PCR analysis, total RNA was extracted and purified from cells using the RNeasy Mini Kit (Qiagen, catalogue no. 74104) and transcribed into cDNA using the RevertAid first strand cDNA synthesis kit (#K1621, Thermo Scientific). Gene expression was quantified by Maxima SYBR Green/Rox qPCR (#K0221, Thermo scientific) on a StepOnePlus Real-Time PCR System (Applied Biosystems). Nonspecific signals caused by primer dimers were excluded by dissociation curve analysis and use of non-template controls. To normalize for loaded cDNA, β-ACTIN or RPS6 was used as endogenous control. Gene-specific primers for qRT–PCR were designed by using NCBI Primer-Blast or ordered pre-designed from Integrated DNA Technologies. Primer sequences can be found in Table S2.
Cluster analysis
To determine shRNA treatments that caused similar effects on neural conversion of hESCs, we performed cluster analysis of mRNA expression profiles. We stably transduced H1 hESCs with lentiviruses expressing various shRNAs and/or shRNA-resistant cDNAs and subjected these cells to neural conversion by dual SMAD inhibition for 9 days. We then measured the mRNA abundance of neural progenitor and neural crest markers by RT-qPCR. Data sets were clustered using the heatmap.2 function of the gplots package on R.
In vivo ubiquitylation assays
To detect ubiquitylation of ectopic TCOF1 or NOLC1, HEK 293T cells were transiently transfected with 6xHis-tagged Ubiquitin and HA-tagged TCOF1 or NOLC1. For detection of ubiquitylation of endogenous TCOF1 or NOLC1, HEK 293T cells were transiently transfected with 6xHis-tagged Ubiquitin-L73P. Cells were harvested, washed with PBS, lysed in in 8M urea, 50mM sodium phosphate, pH 8.0 and sonicated. His-Ubiquitin conjugates were purified using Ni-NTA agarose (Qiagen) and ubiquitylated NOLC1 or TCOF1 were detected by immunoblotting using anti-HA, anti-TCOF1, or anti-NOLC1 antibodies. For analysis of the influence of beta;-arrestin proteins on KBTBD8-mediated ubiquitlylation, HEK 293T cells were transfected with control siRNAs or a pool of siRNAs targeting ARRB1 (#1 and #2) and ARRB2 (#1 and #2) 24 h prior to plasmid transfection.
Immunoprecipitations for mass spectrometry
Anti-FLAG immunoprecipitations (IPs) for mass spectrometry analysis were performed from extracts of HEK293T cells transiently expressing KBTBD8-3xFLAG versions or 3xFLAG-TCOF1 in the presence and absence of KBTBD8 versions (20 x 15 cm dishes per condition). Lysis was in two pellet volumes of 20 mM HEPES pH 7.3, 150 mM NaCl 110 mM KOAc, 2 mM Mg(OAc)2, 5 mM EDTA, 5 mM EGTA, 0.2% NP-40, and protease inhibitors (Roche) on ice. Lysates were sonicated, cleared by centrifugation, passaged through a 0.45 μm membrane filter, and incubated with ANTI-FLAG-M2 agarose (Sigma) for 2 h at 4 °C. After washing with lysis buffer, FLAG-tagged protein complexes were eluted with lysis buffer containing 0.5 mg/mL 3xFLAG peptide in three 15 min incubations at 30°C, 800rpm. Eluates were either analysed by immunoblotting or further processed for multi dimensional protein identification technology (MUDPIT) mass spectrometry. Sequential NOLC1-TCOF1 IPs were performed from extracts of HEK293T cells transiently expressing 3xHA-NOLC1, 3xFLAG-TCOF1, and untagged KBTBD8 (120 x 15 cm plates for mass spectrometry). Lysates were prepared as described above and incubated with ANTI-HA agarose (Sigma) for 2 h at 4 °C. After washing with lysis buffer, bound proteins were eluted with lysis buffer containing 0.5 mg/mL 3xHA peptide in three 15 min incubations at 30°C, 800rpm. HA-eluates were subjected to anti-FLAG immunoprecipitation followed by FLAG peptide elution (see above).
Endogenous immunoprecipitations
Anti-KBTBD8 IPs were performed from hES H1 cells (5 x 15 cm dishes per condition) and lysates were prepared as described above. After incubation with KBTBD8 or control antibodies (mIgGs, Santa Cruz) at 4°C for 1h, Protein G beads (Roche) were added for 2 h. After washing with lysis buffer, bound proteins were eluted with 2x SDS sample buffer and analyzed by immunoblotting. anti-RPA1 IPs were performed in the same way but from either HEK 293T cells transiently expressing KBTBD8-flag, KBTBD8W579A-flag, or KBTBD8Y74A-flag (2x 15cm plates for each condition) or from control or KBTBD8-depleted hES H1 cells (5x 15cm plates for each condition).
Mass spectrometry and compPASS analysis
For mass spectrometry analysis, flag-immunoprecipitates were prepared as described above and precipitated with 20% Trichloroacetic acid (TCA, Fisher) overnight. Proteins were resolubilized and denatured in 8M Urea (Fisher), 100 mM Tris (pH 8.5), followed by reduction with 5 mM TCEP (Sigma), alkylation with 10 mM iodoacetamide (Sigma), and overnight digestion with trypsin (0.5 mg/ml, Fisher). Samples were analyzed by the Vincent J. Coates Proteomics/Mass Spectrometry Laboratory at UC Berkeley and compared with ~100 reference immunoprecipitations against different FLAG-tagged bait proteins using a Java script programmed according to the CompPASS software suite 34. For determination of the KBTBD8 interaction network, three independent KBTBD8-flag IPs were compared as replicates against the reference IPs. Thresholds for high confidence interaction partners (HCIPs) were top 5% of interactors with highest Z-score and highest WD score. To narrow down putative substrates of KBTBD8 in the interaction map, we compared relative total spectral counts for each HCIP found in wild type KBTBD8 immunprecipitates to the ones found in KBTBD8Y74A, KBTBD8F550A, and KBTBD8W579A immunoprecipitates. For identification of effector proteins recruited to TCOF1 upon ubiquitylation, we determined the TCOF1 interaction network as described above for KBTBD8 and compared relative total spectral counts for each TCOF1 HCIP to those found upon co-expression of KBTBD8 or KBTBD8Y74A. We then plotted relative TSC changes upon KBTBD8 expression against the difference of relative TSC changes upon KBTBD8 and KBTBD8Y74A expression.
Immunofluorescence microscopy
For immunofluorescence analysis, hES H1 cells or hES H1 cells expressing different shRNA were seeded on Matrigel-coated converslips using accutase, fixed with 3.7% formaldehyde for 10 min, permabilized with 0.1% Triton for 20 min, and stained with indicated antibodies or Hoechst. Images were taken using Zeiss LSM 710 confocal microscope or Olympus IX81 microscope, deconvolved using Metamorph, and processed using ImageJ.
Determination of average nucleolar size
To analyze nucleolar integrity, we performed indirect immunofluorescence microscopy using antibodies against fibrillarin, an established nucleolar marker. We stained nucleoli of control and KBTBD8-depleted hESCs or of hESCs that were subjected to neural conversion for 3 days. Images were taken for each condition using a Zeiss LSM 710 confocal microscope with a 20x objective followed by quantification of average nucleolar and nuclear size using ImageJ. Average nucleolar size was expressed relative to average nuclear area. Error bars represent standard deviation of three different images (~100 cells per image).
Analysis of cell cycle progression
For DNA content analysis, control or KBTBD8-depleted hES H1 cells or control or KBTBD8-depleted cells that had undergone neural induction for 3 or 6 d were fixed in 70% ethanol in PBS overnight. Cells were pelleted and resuspended in PBS containing 1mg/ml RNase (Sigma) and 10 μg/ml propidium iodide (PI), incubated at room temperature for 30 min, then analyzed using a Beckman-Coulter EPICS XL Flow Cytometer (575 nm band pass filter).
Cell proliferation assays
To compare the division rate of control and KBTBD8-depleted hES cells, we seeded 3 × 10⁵ cells per well of a 6-well plate using accutase. Cells were accutased at 2, 3, and 4 days post seeding and counted using a haemocytometer.
RNA sequencing and ribosome profiling
RNA-seq libraries was prepared with Tru-seq Ribo-zero gold kit (Illumina). The preparation of ribosome profiling library and the data analysis were performed according to the method previously described 35. The libraries were sequenced on a HiSeq 2000 (Illumina). The reads were aligned to the hg19 human genome reference and the resulting aligned reads were mapped to UCSC known reference genes. Based on length of each footprint, specific A-site offsets were estimated as 14 for 26–28 nucleotides and 15 for 29–31 nucleotides. For mRNA fragments, we used offset 14. For measuring footprint density and mRNA fragments between samples, we restricted our analysis to genes, which have at least 128 summed counts in each sample, only including the genomic positions 15 codons following the start codon and the position 5 codons preceding the stop codon. DESeq 36 was used to calculate fold change enrichment of genes by KBTBD8 or TCOF1 knockdown at each time point after neural induction.
Polysome profiling
Cells lysate was prepared as described 35. Lysate containing 3 μg total RNA was loaded on to 10–50% linear sucrose gradients containing 20 mM Tris pH 7.4, 150 mM NaCl, 5 mM MgCl2, 1 mM DTT, 100 μg/ml cycloheximide, and 2 U/ml SUPERase• In RNase Inhibitor and centrifuged at 36,000 rpm for 2.5 hrs at 4°C with SW41 rotor (Beckman Coulter). UV absorbance of fractionated gradient with Gradient station (Biocomp) was detected by ECONO UV monitor (Biorad). Monosome/Polysome ratio was determined by integration of the area under the respective peaks using Igor Pro software (WaveMetrics).
Metabolic labelling
To determine global mRNA translation in control or KBTBD8-depleted hESCs, hESCs subjected to embryoid body formation for 3 days, or hESCs subjected to neural conversion for 3 days, we employed metabolic labelling. Cells were pre-equilibrated in labelling medium (RPMI without methionine containing 10% dialyzed FBS) for 15 min, followed by preparation of single cell suspensions by accutase treatment. 0.6 x 10⁶ cells for hESCs and NC3s and ~300 EBs (initial seeding cell number: 3,000 cells per EB) were pulsed with 100 μL labelling medium containing 0.1 mCi/mL [36S]-methionine at 37°C for 20 min. After washing with PBS, cells were lysed in 8 M urea, 100 mM TRIS pH 8.0, diluted in SDS loading buffer, sonicated, and lysates were analysed by SDS page and audioradiography. [36S]-methionine incorporation was quantified using Image J software, normalized to total protein amount, and expressed relative to the control hESC sample (set to 1). Error bars denote standard deviation of three biological replicates.
Extended Data
Extended Data Figure 1. KBTBD8 is a developmentally regulated CUL3 adaptor.

a. Gene expression analysis by microarray of hESCs differentiated into embryoid bodies (EB) for 6 days (n > 30,000 transcripts, mean of 3 biological replicates, Anova p-value < 0.05; blue: downregulated genes; red: upregulated genes). b. Expression analysis of all CRL substrate adaptors, including KBTBD8, with data derived from experiment described above c. Expression analysis of CUL3 adaptors during hESC differentiation into hEBs (blue: downregulation; yellow: upregulation). d. mRNA levels of pluripotency markers and KBTBD8 during hESC differentiation into EBs, as determined by qRT-PCR (mean of 3 technical replicates +/− s.e.m.). e. Protein levels of KBTBD8 during hESC differentiation into EBs, as seen by Western (OCT4, NANOG: pluripotency; PAX6: CNS precursors; TFAP2: neural crest marker). f. KBTBD8 is expressed in hESCs, but not in somatic cell lines, as determined by qRT-PCR (mean of 3 technical replicates +/− s.e.m.). g. Abundance of KBTBD8 in H9 hESCs, D3 mESCs, or somatic cell lines was determined by Western. h. KBTBD8 expression is downregulated during mouse embryonic stem cell (mESC) differentiation into mouse embryoid bodies, as determined by qRT-PCR (mean of 3 technical replicates +/− s.e.m.). i. KBTBD8 protein levels are reduced during mESC differentiation, as shown by Western.
Extended Data Figure 2. KBTBD8 controls neural crest formation.

a. Stable depletion of KBTBD8 from H1 hESCs, as determined by Western. b. KBTBD8 depletion does not significantly change the cell cycle profile of hESCs, as determined by propidium iodide staining and FACS. c. Control or KBTBD8-depleted hESCs were counted at indicated times after seeding. (mean of 3 biological replicates, +/− s.d.). d. KBTBD8 depletion does not induce apoptosis in hESCs, as shown by immunostaining against cleaved caspase 3 (red) or DNA (blue). (200 cells/condition; scale bar 10μm) e. KBTBD8 depletion does not affect the gene expression profile of hESCs, as determined by microarray analysis (genes > 2.5-fold change, n>30,000; mean of 3 biological replicates, Anova p –value < 0.05). f. Loss of KBTBD8 causes a decrease in the expression of neural crest cell markers during EB formation, as shown by comparative microarray analysis (genes > 2.5-fold change, n>30,000; mean of 3 biological replicates, Anova p –value < 0.05). g. mRNA levels of pluripotency and differentiation markers in EBs stably expressing control- or KBTBD8-shRNAs were measured by qRT-PCR (3 technical replicates +/− s.e.m.).
Extended Data Figure 3. KBTBD8 controls neural crest specification.

a. Depletion of KBTBD8 from hESCs subjected to neural conversion results in loss of neural crest cells, as determined by immunofluorescence against HNK1, TFAP2, and p75 (n>200 cells, mean of 3 biological replicates +/− s.d.). b. H1 hESCs transduced with control- (green) or KBTBD8-shRNAs (red) were subjected to neural conversion, and expression of neural crest markers SOX10 (circles) and SNAIL2 (boxes) was monitored by qRT-PCR (mean of 3 technical replicates +/− s.e.m.). c. H1 hESCs described above were subjected to neural conversion and abundance of CNS precursor markers SOX2 (circles) and PAX6 (boxes) was measured by qRT-PCR. d. H1 hESCs described above were subjected to neural conversion and abundance of telencephalon markers SIX3 (circles) and FOXG1 (boxes) was measured by qRT-PCR. e. Expression of OCT4 was monitored by qRT-PCR during neural conversion in the presence or absence of KBTBD8. f. hESCs stably expressing control- or KBTBD8-shRNAs were subjected to neural conversion and analyzed for expression of pluripotency (OCT4, CDH1), neural crest (SOX10, SNAIL2, AP2), or CNS precursor markers (PAX6) by Western blotting. To provide consistency, samples were taken from the same experiment as shown in Figure 5d (* marks blots also shown in Figure 5d). g. Loss of neural crest occurs in response to KBTBD8 depletion by two independent shRNAs, as shown by Western. h. hESCs were subjected to neural conversion and analyzed by immunofluorescence microscopy against SOX10- (neural crest), PAX6- (CNS precursor), and OCT4 (pluripotency).
Extended Data Figure 4. KBTBD8 is required for differentiation into functional neural crest cells.

a. H1 hESCs stably expressing control- or KBTBD8-shRNAs were subjected to neural conversion for 43 days and analyzed by immunofluorescence microscopy against GFAP (glia), smooth muscle actin (SMA; mesenchymal cells), and neurofilament L (neurons). b. Control H1 hESCs or hESCs depleted of KBTBD8 were subjected to neural conversion for 43 days and expression of markers for glia (GFAP), mesenchyme (smooth muscle actin, SMA), melanocytes (TYRP1, DCT), chondrocytes (COL2A1), or CNS derivatives (PAX6, NESTIN, neurofilament L) was analyzed by qRT-PCR (mean of 3 technical replicates +/− s.e.m.). c. X. tropicalis embryos were injected at the two-cell stage with splice-blocking morpholinos (sMO) against CUL3 or KBTBD8, or with a dominant-negative construct of CUL3 that allows KBTBD8 to bind, but not ubiquitylate substrates. Neural crest formation was monitored by SOX10 in situ hybridization. Quantification included experiment shown in Fig. 1d (mean of 3 biological replicates +/− s.d; ~20 embryos per condition and replicate).
Extended Figure 5. Biochemical characterization of the substrate adaptor role of KBTBD8.

a. Domain structure of KBTBD8, including the residues mutated to generate ubiquitylation- (Y74A) and substrate-binding-deficient KBTBD8 (F550A; W579A). b. Effects of point mutations in predicted KELCH domain loops on binding of KBTBD8 to candidate substrates were determined by affinity-purification and Western. c. Effects of point mutations in BTB domain on binding of KBTBD8 to CUL3 were determined by affinity-purification and Western. Dimerization of FLAGKBTBD8 with KBTBD8HA was analyzed in the same experiment to provide a folding control. d. Binding of recombinant CUL3 to immobilized recombinant MBPKBTBD8 variants was analyzed by Coomassie. e. Binding of in vitro-transcribed/translated 36S-NOLC1 to immobilized recombinant KBTBD8 variants was analyzed by autoradiography. f. Binding of in vitro-transcribed/translated 36S-TCOF1 to immobilized recombinant KBTBD8 variants was analyzed by autoradiography. g. Endogenous β-arrestin proteins in reticulocyte lysates binds immobilized, recombinant KBTBD8, as detected by Western. h. 293T cells were transfected with control- or β-arrestin 1/2-siRNAs and reconstituted with FLAGKBTBD8. Binding of KBTBD8 to endogenous TCOF1 and NOLC1 was analyzed by αFLAG-affinity purification and Western. i. Ubiquitylation of HATCOF1 in 293T cells depleted of β-arrestin 1/2 and reconstituted with KBTBD8 was determined after denaturing NiNTA-purification by Western blotting as described above. i. Ubiquitylation of HANOLC1 was detected in 293T cells depleted of β-arrestins and reconstituted with KBTBD8, as described above.
Extended Data Figure 6. KBTBD8 specifies neural crest fate through TCOF1 and NOLC1.

a. mRNA levels of KBTBD8, NOLC1, and TCOF1 were determined in hESCs or differentiating cells transduced with lentiviruses expressing the indicated shRNAs by qRT-PCR (mean of 3 technical replicates +/− s.e.m.). b. hESCs stably depleted of KBTBD8 and reconstituted with either wt-KBTBD8, KBTBD8W579A, or KBTBD8Y74A were subjected to neural conversion (9d) and analyzed for the expression of marker proteins by qRT-PCR (mean of 3 technical replicates +/− s.e.m.). c. hESCs stably depleted of KBTBD8, TCOF1, or NOLC1 were subjected to neural conversion (9d) and analyzed for marker expression by qRT-PCR (mean of 3 technical replicates +/− s.e.m.). d. Depletion of TCOF1 or NOCL1 from hESCs results in loss of neural crest cells, as determined by triple staining immunofluorescence against the neural crest markers HNK1, TFAP2, and p75 (n>200 cells, mean of 3 biological replicates +/− s.d.). e. hESCs were transduced with lentiviruses expressing control- or BRD2-hRNAs, subjected to puromycin selection for 7d, and analyzed by Western. f. Depletion efficiency for shRNAs against various KBTBD8 binding partners, as determined by qRT-PCR (mean of 3 technical replicates +/− s.e.m.).
Extended Data Figure 7. Characterization of TCOF1-regulation by ubiquitylation.

a. hESCs depleted of either KBTBD8 or TCOF1 were subjected to neural conversion and analyzed for expression of indicated proteins by Western. b. Control or KBTBD8-depleted hESCs were fixed and subjected to indirect immunofluorescence analysis against endogenous TCOF1 or NOLC1. Scale bar = 10 μm. c. Total spectral counts of proteins associated with TCOF1/NOLC1-complexes purified by sequential immunoprecipitation in the presence of KBTBD8 compared to single TCOF1 affinity-purification in the absence of KBTBD8, as determined by mass spectrometry (sum of 3 biological replicates) d. 293T cells were reconstituted with CUL3KBTBD8 and depleted of TCOF1 and NOLC1 by siRNAs. Endogenous RNA polymerase I was immunoprecipitated and binding to the SSU processome (NOP58, CSK2A) was analyzed by Western.
Extended Data Figure S8. KBTBD8 is not required for general ribosome biogenesis.

a. hESCs stably depleted of KBTBD8 were subjected to neural conversion and levels of 5S rRNA, 18S rRNA, and mRNAs encoding RPS6, RPS28, RPL10A, and RPL28 were measured by qRT-PCR (mean of 3 technical replicates +/− s.e.m.). b. hESCs stably depleted of KBTBD8 were subjected to neural conversion, and total RNA was subjected to a bioanalyzer assay to monitor processing of ribosomal RNAs. c. hESCs stably depleted of KBTBD8 were subjected to neural conversion (3d), and nucleoli were analyzed by αfibrillarin immunofluorescence microscopy. d. Quantification of nucleolar analysis described above (mean of 3 technical replicates +/− s.e.m.). e. hESCs stably depleted of KBTBD8 were analyzed for localization of 5.8S rRNA by α5.8S rRNA immunofluorescence microscopy. f. hESCs depleted of KBTBD8 were subjected to neural conversion and analyzed by α5.8S rRNA immunofluorescence microscopy. g. Polysomes were purified from control or KBTBD8-depleted hESCs and differentiated counterparts subjected to neural conversion via sucrose gradient centrifugation followed by fractionation and UV detection. h. KBTBD8-depleted hESCs were subjected to neural conversion for 9 days and analyzed for apoptosis by immunofluorescence analysis against cleaved caspase 3 (red) and DNA (Hoechst, blue). Cells with active caspase 3 staining were quantified. (~200 cells/condition; scale bar 10μm)
Extended Data Figure 9. Characterization of KBTBD8- and TCOF1-depleted hESCs during neural conversion.

a. hESCs were treated with increasing concentrations of rapamycin, subjected to neural conversion for 9 days, and analyzed for expression of neural crest or CNS precursor markers by qRT-PCR. For comparison, effects of KBTBD8, TCOF1, or NOLC1 depletion (extracted from Fig. 3a) are shown. b. hESCs were treated with rapamycin, subjected to neural conversion, and analyzed for marker expression by Western blotting. c. hESCs were depleted of KBTBD8 or TCOF1, subjected to neural conversion for 3 days, and analyzed for expression of 5S and 18S rRNA by qRT-PCR (mean of 3 technical replicates +/− s.e.m.). d. hESCs depleted of KBTBD8 or TCOF1 were subjected to neural conversion for 3 days and analyzed for p53 activation by RNA seq against p53 targets. e. hESCs were depleted of KBTBD8 or TCOF1, subjected to neural conversion for 3 days, and analyzed for apoptosis by immunofluorescence microscopy against cleaved caspase 3. Quantification shown below (~200 cells/condition). f. hESCs depleted of KBTBD8 were subjected to neural conversion for 9 days and analyzed for expression levels of 5S and 18S rRNA by qRT-PCR (mean of 3 technical replicates +/− s.e.m.). g. hESCs stably depleted of NOLC1 or TCOF1 were subjected to neural conversion for 9 days and analyzed by immunofluorescence microscopy against cleaved caspase 3 (red) or DNA (Hoechst, blue). Quantification is shown below (~200 cells/condition; scale bar 10μm).
Extended Data Figure 10. KBTBD8 controls translation.

a. hESCs stably depleted of KBTBD8 were subjected to neural conversion for 3 days, and hESCs and differentiating cells were analyzed by RNA deep sequencing and ribosomal profiling to determine translation efficiency. Distribution of translation efficiency changes for 7725 mRNAs brought about by KBTBD8 depletion is shown. b. hESCs stably depleted of either TCOF1 or KBTBD8 were subjected to neural conversion for 3 days, and translation efficiency was determined by RNAseq and ribosome profiling. c. Translation efficiency blot of differentiating hESCs transduced with control- or KBTBD8-shRNAs were labeled for significantly affected transcripts in general (blue), with links to CNS precursor formation (gold), or with links to neural crest formation (green). d. hESCs stably depleted of KBTBD8 or TCOF1 were subjected to neural conversion for 3 days, and expression levels of indicated proteins were analyzed by Western. e. hESCs stably depleted of KBTBD8 were subjected to neural conversion for 3 days, and levels of ATRX1 and PCM1 mRNA were determined by qRT-PCR (mean of 3 technical replicates +/− s.e.m.). f. hESCs stably depleted of KBTBD8 were subjected to neural conversion for 3 days, and protein stability of ATRX1 and PCM1 was determined by cycloheximide chase and Western (mean of 3 biological replicates +/− s.d., ATRX1 and PCM1 levels were normalized relative to actin levels and 0h time point set to 100%).
Supplementary Material
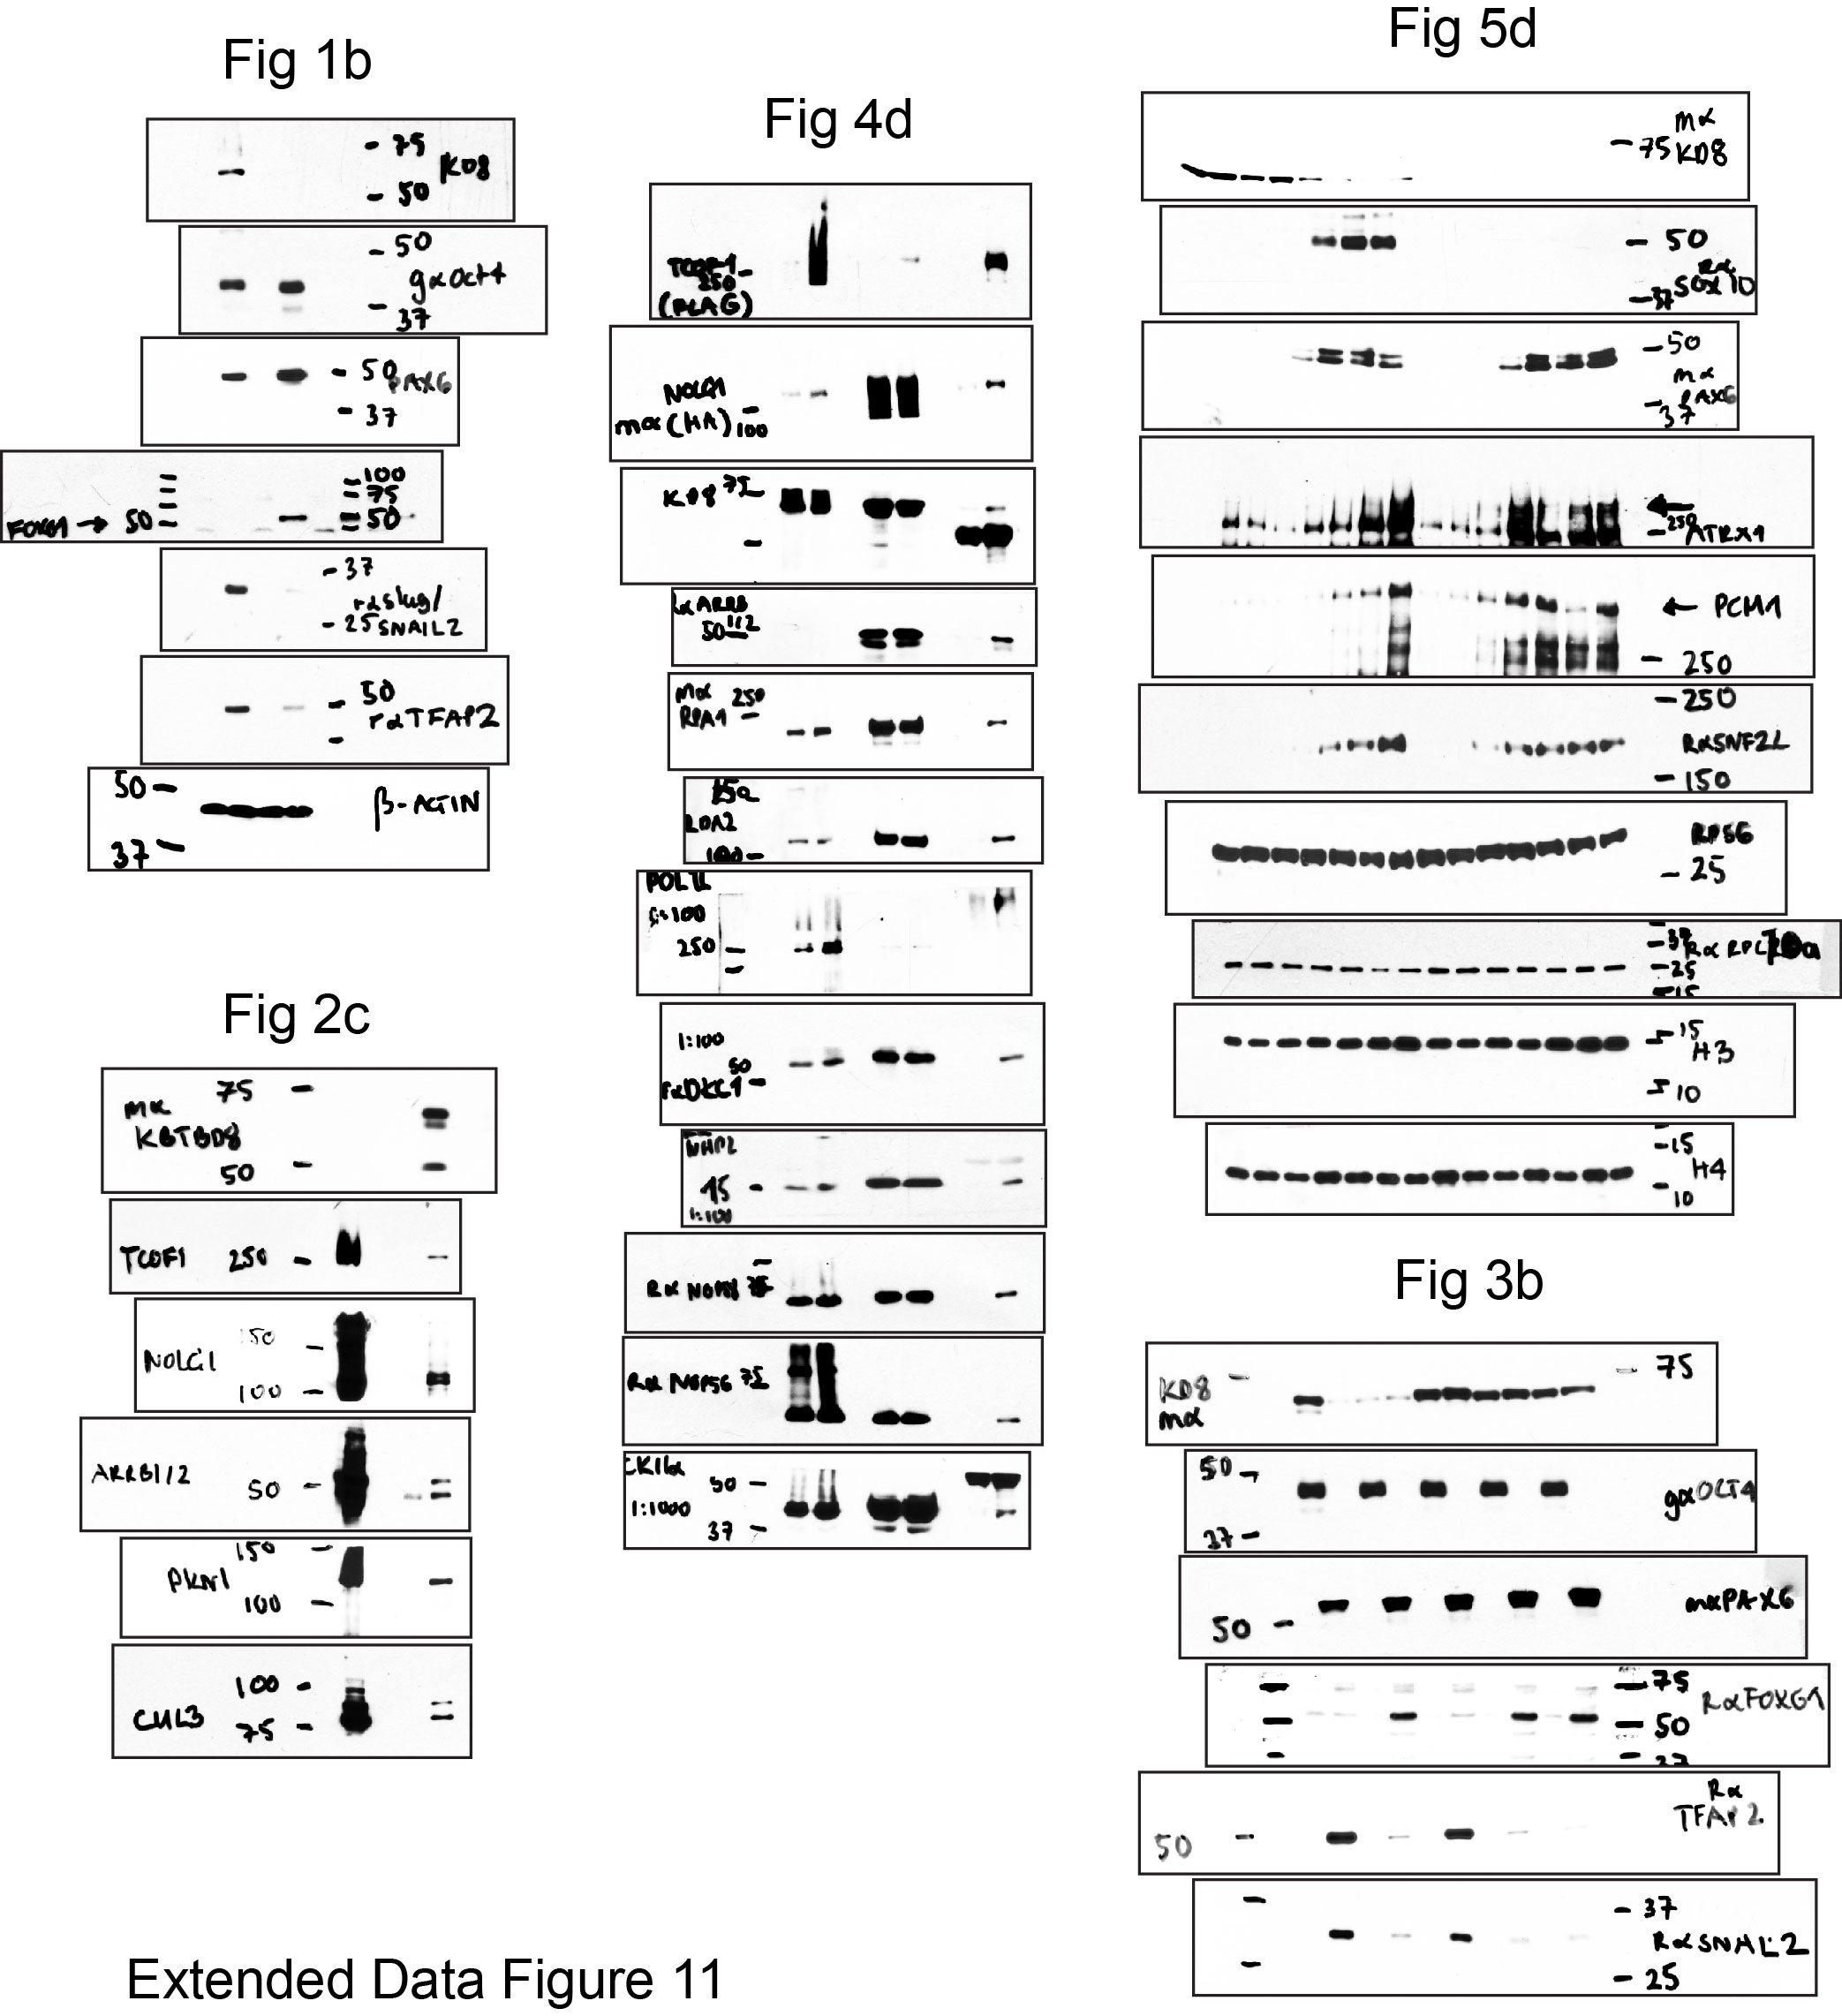
Supplementary Figure 1: Original Western blots of key figures.
Acknowledgments
We thank Richard Harland, Julia Schaletzky, Roberto Zoncu, Jacob Corn, Andrew Manford and Eugene Oh for advice and critical reading of the manuscript, and all members of the Rape and Ingolia labs for helpful discussions. AW was funded in part by a postdoctoral fellowship the California Institute of Regenerative Medicine, SI is supported by a Human Frontier Science Fellowship, CM was supported by an NSF graduate student fellowship, and SMR was supported by a UC Mexus-Conacyt fellowship and NIH GM42341. This work used the Vincent J. Coates Genomics Sequencing Laboratory and Proteomics/Mass Spectrometry Laboratory at UC Berkeley (NIH grants S10RR029668, S10RR027303, and S10RR025622). This work was funded by a Basic Biology Award from the California Institute of Regenerative Medicine to MR (RB-02222). MR is an investigator of the Howard Hughes Medical Institute.
Footnotes
Author contributions
AW designed and performed most experiments and helped to write the manuscript; SI performed ribosomal profiling and RNA processing experiments; CM and SMR performed frog experiments; NT performed binding studies; IF wrote code for analysis of CompPASS mass spectrometry; NTI supervised ribosomal profiling studies; MR helped design experiments and wrote the manuscript.
Raw data for microarray, RNA seq, and ribosome profiling was deposited in the NCBI Gene Expression Omnibus under accession numbers GSE62123 (microarray data) and GSE62247 (RNA seq and footprinting data).
MR is a co-founder and consultant to Nurix, a biotech company in the ubiquitin space.
References
- 1.Gurdon JB. The egg and the nucleus: a battle for supremacy. Development. 2013;140:2449–2456. doi: 10.1242/dev.097170. [DOI] [PubMed] [Google Scholar]
- 2.Positional cloning of a gene involved in the pathogenesis of Treacher Collins syndrome. The Treacher Collins Syndrome Collaborative Group. Nat Genet. 1996;12:130–136. doi: 10.1038/ng0296-130. [DOI] [PubMed] [Google Scholar]
- 3.Dixon J, et al. Tcof1/Treacle is required for neural crest cell formation and proliferation deficiencies that cause craniofacial abnormalities. Proc Natl Acad Sci U S A. 2006;103:13403–13408. doi: 10.1073/pnas.0603730103. [DOI] [PMC free article] [PubMed] [Google Scholar]
- 4.Petroski MD, Deshaies RJ. Function and regulation of cullin-RING ubiquitin ligases. Nat Rev Mol Cell Biol. 2005;6:9–20. doi: 10.1038/nrm1547. nrm1547 [pii] [DOI] [PubMed] [Google Scholar]
- 5.Silverman JS, Skaar JR, Pagano M. SCF ubiquitin ligases in the maintenance of genome stability. Trends in biochemical sciences. 2012;37:66–73. doi: 10.1016/j.tibs.2011.10.004. [DOI] [PMC free article] [PubMed] [Google Scholar]
- 6.Wang Y, et al. Deletion of the Cul1 gene in mice causes arrest in early embryogenesis and accumulation of cyclin E. Curr Biol. 1999;9:1191–1194. doi: 10.1016/S0960-9822(00)80024-X. [DOI] [PubMed] [Google Scholar]
- 7.Arai T, et al. Targeted disruption of p185/Cul7 gene results in abnormal vascular morphogenesis. Proc Natl Acad Sci U S A. 2003;100:9855–9860. doi: 10.1073/pnas.1733908100. [DOI] [PMC free article] [PubMed] [Google Scholar]
- 8.Singer JD, Gurian-West M, Clurman B, Roberts JM. Cullin-3 targets cyclin E for ubiquitination and controls S phase in mammalian cells. Genes Dev. 1999;13:2375–2387. doi: 10.1101/gad.13.18.2375. [DOI] [PMC free article] [PubMed] [Google Scholar]
- 9.Jiang B, et al. Lack of Cul4b, an E3 ubiquitin ligase component, leads to embryonic lethality and abnormal placental development. PLoS One. 2012;7:e37070. doi: 10.1371/journal.pone.0037070. [DOI] [PMC free article] [PubMed] [Google Scholar]
- 10.Voigt J, Papalopulu N. A dominant-negative form of the E3 ubiquitin ligase Cullin-1 disrupts the correct allocation of cell fate in the neural crest lineage. Development. 2006;133:559–568. doi: 10.1242/dev.02201. [DOI] [PubMed] [Google Scholar]
- 11.Jin L, et al. Ubiquitin-dependent regulation of COPII coat size and function. Nature. 2012;482:495–500. doi: 10.1038/nature10822. [DOI] [PMC free article] [PubMed] [Google Scholar]
- 12.Lander R, Nordin K, LaBonne C. The F-box protein Ppa is a common regulator of core EMT factors Twist, Snail, Slug, and Sip1. J Cell Biol. 2011;194:17–25. doi: 10.1083/jcb.201012085. [DOI] [PMC free article] [PubMed] [Google Scholar]
- 13.Skaar JR, Pagan JK, Pagano M. Mechanisms and function of substrate recruitment by F-box proteins. Nat Rev Mol Cell Biol. 2013;14:369–381. doi: 10.1038/nrm3582. [DOI] [PMC free article] [PubMed] [Google Scholar]
- 14.Barbieri CE, et al. Exome sequencing identifies recurrent SPOP, FOXA1 and MED12 mutations in prostate cancer. Nat Genet. 2012;44:685–689. doi: 10.1038/ng.2279. [DOI] [PMC free article] [PubMed] [Google Scholar]
- 15.Louis-Dit-Picard H, et al. KLHL3 mutations cause familial hyperkalemic hypertension by impairing ion transport in the distal nephron. Nat Genet. 2012;44:456–460. S451–453. doi: 10.1038/ng.2218. [DOI] [PubMed] [Google Scholar]
- 16.Welcker M, Clurman BE. FBW7 ubiquitin ligase: a tumour suppressor at the crossroads of cell division, growth and differentiation. Nat Rev Cancer. 2008;8:83–93. doi: 10.1038/nrc2290. [DOI] [PubMed] [Google Scholar]
- 17.Yanai I, Peshkin L, Jorgensen P, Kirschner MW. Mapping gene expression in two Xenopus species: evolutionary constraints and developmental flexibility. Dev Cell. 2011;20:483–496. doi: 10.1016/j.devcel.2011.03.015. [DOI] [PMC free article] [PubMed] [Google Scholar]
- 18.Chambers SM, et al. Highly efficient neural conversion of human ES and iPS cells by dual inhibition of SMAD signaling. Nat Biotechnol. 2009;27:275–280. doi: 10.1038/nbt.1529. [DOI] [PMC free article] [PubMed] [Google Scholar]
- 19.Dauwerse JG, et al. Mutations in genes encoding subunits of RNA polymerases I and III cause Treacher Collins syndrome. Nat Genet. 2011;43:20–22. doi: 10.1038/ng.724. [DOI] [PubMed] [Google Scholar]
- 20.Jones NC, et al. Prevention of the neurocristopathy Treacher Collins syndrome through inhibition of p53 function. Nat Med. 2008;14:125–133. doi: 10.1038/nm1725. [DOI] [PMC free article] [PubMed] [Google Scholar]
- 21.Price JC, Guan S, Burlingame A, Prusiner SB, Ghaemmaghami S. Analysis of proteome dynamics in the mouse brain. Proc Natl Acad Sci U S A. 2010;107:14508–14513. doi: 10.1073/pnas.1006551107. [DOI] [PMC free article] [PubMed] [Google Scholar]
- 22.Cambridge SB, et al. Systems-wide proteomic analysis in mammalian cells reveals conserved, functional protein turnover. Journal of proteome research. 2011;10:5275–5284. doi: 10.1021/pr101183k. [DOI] [PubMed] [Google Scholar]
- 23.Tuck AC, Tollervey D. A transcriptome-wide atlas of RNP composition reveals diverse classes of mRNAs and lncRNAs. Cell. 2013;154:996–1009. doi: 10.1016/j.cell.2013.07.047. [DOI] [PMC free article] [PubMed] [Google Scholar]
- 24.Jack K, et al. rRNA pseudouridylation defects affect ribosomal ligand binding and translational fidelity from yeast to human cells. Mol Cell. 2011;44:660–666. doi: 10.1016/j.molcel.2011.09.017. [DOI] [PMC free article] [PubMed] [Google Scholar]
- 25.Yoon A, et al. Impaired control of IRES-mediated translation in X-linked dyskeratosis congenita. Science. 2006;312:902–906. doi: 10.1126/science.1123835. [DOI] [PubMed] [Google Scholar]
- 26.Kondrashov N, et al. Ribosome-mediated specificity in Hox mRNA translation and vertebrate tissue patterning. Cell. 2011;145:383–397. doi: 10.1016/j.cell.2011.03.028. [DOI] [PMC free article] [PubMed] [Google Scholar]
- 27.Xue S, Barna M. Specialized ribosomes: a new frontier in gene regulation and organismal biology. Nat Rev Mol Cell Biol. 2012;13:355–369. doi: 10.1038/nrm3359. [DOI] [PMC free article] [PubMed] [Google Scholar]
- 28.McCann KL, Baserga SJ. Genetics. Mysterious ribosomopathies. Science. 2013;341:849–850. doi: 10.1126/science.1244156. [DOI] [PMC free article] [PubMed] [Google Scholar]
- 29.Freed EF, Prieto JL, McCann KL, McStay B, Baserga SJ. NOL11, implicated in the pathogenesis of North American Indian childhood cirrhosis, is required for pre-rRNA transcription and processing. PLoS Genet. 2012;8:e1002892. doi: 10.1371/journal.pgen.1002892. [DOI] [PMC free article] [PubMed] [Google Scholar]
- 30.Sondalle SB, Baserga SJ. Human diseases of the SSU processome. Biochim Biophys Acta. 2014;1842:758–764. doi: 10.1016/j.bbadis.2013.11.004. [DOI] [PMC free article] [PubMed] [Google Scholar]
- 31.Rape M, Reddy SK, Kirschner MW. The processivity of multiubiquitination by the APC determines the order of substrate degradation. Cell. 2006;124:89–103. doi: 10.1016/j.cell.2005.10.032. S0092-8674(05)01232-8 [pii] [DOI] [PubMed] [Google Scholar]
- 32.Jin L, Williamson A, Banerjee S, Philipp I, Rape M. Mechanism of ubiquitin-chain formation by the human anaphase-promoting complex. Cell. 2008;133:653–665. doi: 10.1016/j.cell.2008.04.012. S0092-8674(08)00503-5 [pii] [DOI] [PMC free article] [PubMed] [Google Scholar]
- 33.Khokha MK, et al. Techniques and probes for the study of Xenopus tropicalis development. Developmental dynamics: an official publication of the American Association of Anatomists. 2002;225:499–510. doi: 10.1002/dvdy.10184. [DOI] [PubMed] [Google Scholar]
- 34.Sowa ME, Bennett EJ, Gygi SP, Harper JW. Defining the human deubiquitinating enzyme interaction landscape. Cell. 2009;138:389–403. doi: 10.1016/j.cell.2009.04.042. S0092-8674(09)00503-0 [pii] [DOI] [PMC free article] [PubMed] [Google Scholar]
- 35.Ingolia NT, Brar GA, Rouskin S, McGeachy AM, Weissman JS. The ribosome profiling strategy for monitoring translation in vivo by deep sequencing of ribosome-protected mRNA fragments. Nature protocols. 2012;7:1534–1550. doi: 10.1038/nprot.2012.086. [DOI] [PMC free article] [PubMed] [Google Scholar]
- 36.Anders S, Huber W. Differential expression analysis for sequence count data. Genome biology. 2010;11:R106. doi: 10.1186/gb-2010-11-10-r106. [DOI] [PMC free article] [PubMed] [Google Scholar]
Associated Data
This section collects any data citations, data availability statements, or supplementary materials included in this article.
Supplementary Materials
Supplementary Figure 1: Original Western blots of key figures.