Supplemental Digital Content is available in the text
Abstract
Patients with antineutrophil cytoplasmic autoantibody associated vasculitis (AAV) have a high prevalence of infection during immunosuppressive therapy, and the total lymphocyte count (TLC) has been demonstrated to be an independent predictor of infection. The current study investigated the value of the TLC and its subsets, particularly the CD4 count, for predicting infections of AAV in a single Chinese cohort.
A total of 124 AAV patients were retrospectively recruited in our department from December 1997 to October 2013. Multivariate Cox models with the CD4 count or TLC measured at three typical time points, that is, at baseline, at the beginning of immunosuppressant dose reduction, and at the last visit before infection or censoring, or with the measurements included as time-varying covariates, were compared to select the most predictive time point for infection. A time-dependent area under the receiver operating characteristic curve (AUC(t)) for the TLC (AUC(t)TLC) and the CD4 count (AUC(t)CD4count) measured at the most predictive time point were calculated and compared.
During an average follow-up of 11.5 (range 0.5–142) months, 55 of the 124 patients (44.3%) experienced a microbiologically confirmed infection. Independent predictors of overall infection were initial creatinine clearance (P = 0.02 and 0.04), pulmonary interstitial fibrosis (P = .04 and .05), pulmonary nodule or cavity (P = 0.002 and .002), CD4 count (P < 0.001) or TLC (P = 0.05) from the last visit. The comparison of Cox models fitted at different time points confirmed the last visit to be the most predictive one for overall infection. The predictive value of the CD4 count or TLC from the last visit measured by AUC showed that the AUC(t)CD4count (62.8–70.2%) was almost always higher than AUC(t)TLC (55.2–58.1%) during the first 2 years of immunosuppressive therapy (P = 0.01–0.2). In terms of different pathogens, both the CD4 count and TLC performed well for non-bacterial infection (AUC(t) 69.2–82.7%), and the difference between them was not significant (P > 0.1).
The TLC and CD4 count were both independent risk factors of overall infection and non-bacterial infection in AAV patients. The CD4 count had a higher predictive value than the TLC for overall infections, particularly during the first 2 years of immunosuppressive therapy.
INTRODUCTION
Antineutrophil cytoplasmic antibody (ANCA)-associated vasculitis (AAV) comprises granulomatosis with polyangiitis (GPA), microscopic polyangiitis (MPA), eosinophilic granulomatosis with polyangiitis (EGPA), and renal-limited vasculitis (RLV). AAV is characterized by pauci-immune necrotizing small-vessel vasculitis and glomerulonephritis, combined with granulomatous inflammation in the airways in GPA and EGPA. The presence of ANCA is a hallmark of AAV. The main target antigens of ANCAs in the AAV are proteinase 3 (PR3) and myeloperoxidase (MPO).
Untreated AAV has a poor prognosis, with a mortality of approximately 80% in the first year. The introduction of cyclophosphamide and corticosteroids substantially improves the prognosis,1,2 with cumulative survival rates at 1 and 5 years of approximately 82% and 76%, respectively.3 Nevertheless, secondary infections, rather than active vasculitis, have become the main cause of early mortality.4,5 Therefore, identifying risk factors for infection is of great clinical significance.
A variety of markers, including serum IgG concentration,6,7 leukocyte count,6–8 neutrophil count,4,7,9 total lymphocyte count (TLC),7,10,11 lymphocyte subsets count7,12 and cytokine release,13 have been investigated to evaluate the immune status and infection risk of the immunocompromised population with different conditions. Among them, the TLC and CD4 count are commonly used as markers of immune status in predicting opportunistic infections in HIV-infected patients and Pneumocystis pneumonia infection in other immunocompromised populations.13–16 The CD4 count has been confirmed to be superior to the TLC in HIV-infected patients.14 Whether this finding is also the case for predicting the overall infectious complications in AAV was unclear, although lymphopenia has been identified to be an important risk factor for infection in AAV patients.10,11 Therefore, the current study aimed to investigate the role of the CD4 count in predicting infections in AAV and to compare its predictive value with that of the TLC.
METHODS
Study Population
A total of 444 patients with ANCA-associated vasculitis were diagnosed at the Institute of Nephrology, Peking University First Hospital from December 1997 to October 2013. All patients met the Chapel Hill Consensus Conference nomenclature for AAV.17 The exclusion criteria were defined as follows: (1) patients with negative ANCA serology; (2) patients with EGPA, which is increasingly considered a distinct type of AAV with different manifestations and outcomes compared to GPA, MPA and RLV;18 and (3) patients with secondary vasculitis, such as propylthiouracil-induced ANCA-associated vasculitis, or with comorbid renal diseases, such as anti-glomerular basement membrane (GBM) disease, IgA nephropathy, diabetic nephropathy, lupus nephritis, or membranous glomerulopathy. By these criteria, 14 patients were excluded. Among the remaining 430 patients, 59 were excluded because of uncertain outcome status, that is, clinically suspected infection without microbiological confirmation, and then 247 were excluded because their CD4 counts were not measured. Therefore, there were a total of 124 patients recruited in the current study. The details for recruitment are shown in Figure 1. This research was conducted in compliance with the Declaration of Helsinki and was approved by the ethics committee of our hospital. Informed consent was obtained from each patient.
FIGURE 1.
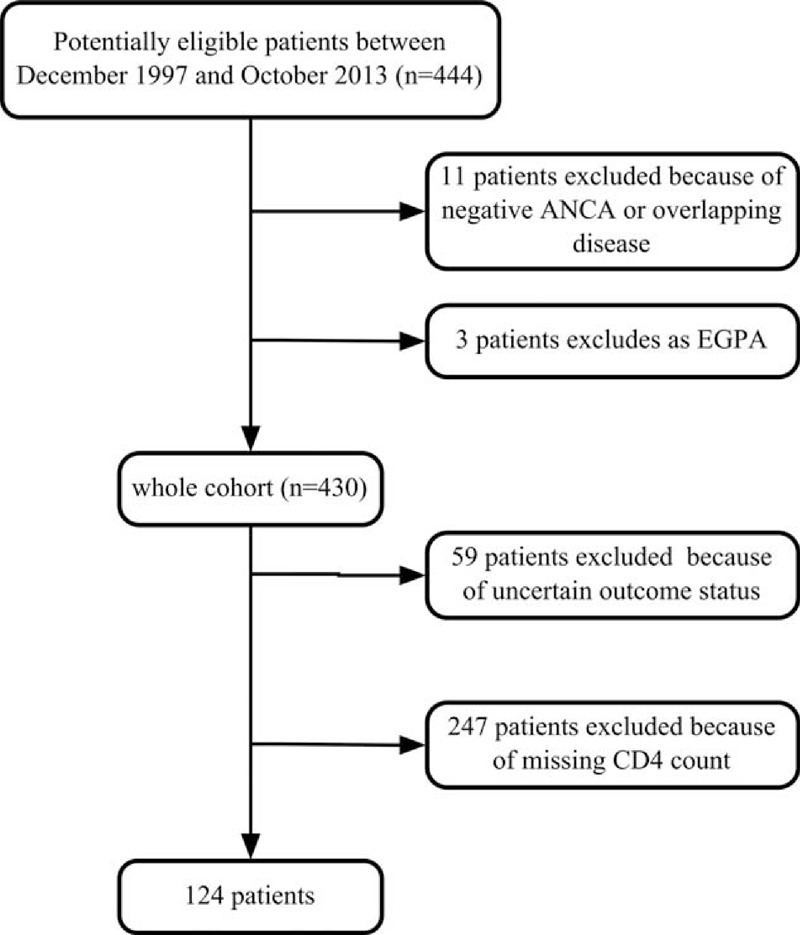
Flowchart for recruitment. ANCA = antineutrophil cytoplasmic antibody, EGPA = eosinophilic granulomatosis with polyangiitis.
Treatment
The treatment protocols have been described previously.19,20 The induction therapy included corticosteroids in combination with cyclophosphamide (CTX). Oral prednisone was prescribed at an initial dosage of 1 mg/kg/d for 4–6 weeks, with a reduction of the dose over time to 12.5–15 mg by 3 months. CTX was administered orally at a dose of 2 mg/kg every day or intravenously at a dose of 0.7 g/m2 once a month. The dose of CTX was reduced by 25% for patients who were over 65 years in age, those who developed leukopenia (less than 4000 cells/mm3) or those with renal insufficiency. Patients with acute renal failure or pulmonary hemorrhage received 3 pulses of intravenous methylprednisolone (7–15 mg/kg/day) before the above standard induction therapy. Patients with severe pulmonary hemorrhage received plasma exchanges. For maintenance therapy, daily oral azathioprine (AZA, 2 mg/kg/day) was given.
Follow-Up
Patients were followed in our out-patient clinic for AAV patients at regular intervals of approximately 1 month during the induction therapy and approximately 3 months during the maintenance therapy or whenever clinically indicated. Clinical and laboratory data were collected at the time of diagnosis and during follow-up. The overall outcomes were not available for 4 patients (4/124, 3.2%), and they were also included as right-censored data in the survival analysis because they were all followed for more than one year.
Measurements
ANCA tests were performed by both an indirect immunofluorescence (IIF) assay and an antigen-specific enzyme-linked immunosorbent assay (ELISA). A standard IIF assay was performed according to the manufacturer's instructions (EUROIMMUN, Lübeck, Germany). In the antigen-specific ELISA, two ANCA antigens, PR3 and MPO, were used in solid-phase assays. The disease activity was assessed using the Birmingham Vasculitis Activity Score (BVAS).21
CD4 counts were performed using a Becton Dickinson FACSCalibfur (Becton Dickson Immunocytometry Systems, San Jose, CA). The TLC was easily obtained from the routine complete blood count (CBC). Because the TLC and CD4 counts were not performed with uniform intervals in each patient, 3 sets of simultaneously measured TLC and CD4 counts from typical time points were chosen to be included in the survival analysis of major infection, that is, at baseline before immunosuppressive therapy, at the beginning of immunosuppressive dose reduction, and at the last follow-up visit before infection or censoring (substitution of the second time point by the third one was allowed in patients with a very early infection). The first and second time points were chosen to reflect the intense immunosuppressive therapy during the induction therapy, which may predispose patients to infection. The measurement from the last visit was selected because it is the most up-to-date measurement and should theoretically be the most reflective of the current immune status.
Outcome Variable
We assessed the first major infectious episode during follow-up as the outcome. Infections were documented by clinical evidence with microbiological confirmation, such as cultures of pathogens from normally sterile sites, positive microscopic visualization, positive antigen or antibody detection test and positive polymerase chain reaction for the suspected microorganism.22 Major infectious episodes were defined as those requiring hospitalization or treatment with intravenous and/or prolonged antibiotics, as previously described23 (hereinafter referred to as “infection” unless noted otherwise). Additionally, herpes zoster recurrences were also considered major infections as they reflected consistent treatment-induced immunosuppression.23 Mild infections, such as rhinitis or bronchitis, were not considered major infections. In the cause-specific Cox analysis for infection, the outcome was classified as a bacterial or non-bacterial infection, where bacterial infection referred to infections with solely bacterial pathogens and non-bacterial infection included fungal, viral or mixed infections (with or without concomitant bacterial infection, as long as one fungal or viral infection was documented).
Statistical Analysis
Quantitative variables were expressed as the mean ± SD (for data that were normally distributed) or as the median with interquartile range (for data that were not normally distributed), and were compared using the t-test (for data that were normally distributed) or the Mann–Whitney U test (for data that were not normally distributed). The normality of distribution was tested with the Shapiro-Wilk test. Qualitative variables were reported as frequency (percentages), and were compared using the chi-square test (or Fisher exact test when appropriate). Kaplan-Meier curves were used to demonstrate the survival associated with the major infections. Cox proportional hazard models were used to analyze risk factors for infection, and the Anderson-Gill model, as an extended Cox model, was used to include time-varying covariate. The predictive value of these models was assessed by concordance or time-dependent area under the receiver operating characteristic (ROC) curve (AUC(t)).
As there was a large amount of variability in the CD4 count and TLC, they were log10 transformed to stabilize the variance24 (abbreviated as log10TLC and log10CD4 count, respectively).
To evaluate the influence of missing CD4 count data, missing pattern analysis was performed in the whole cohort of 371 AAV patients (124 patients with a CD4 count and 247 patients without a CD4 count) with t test, Mann–Whitney U test and univariate binary logistic analysis (see Supplemental Digital Content 1, http://links.lww.com/MD/A267, which demonstrated the results of univariate binary logistic analysis and t test). The identified factors associated with the missing of CD4 count data were then analyzed for their role in predicting infection with univariate Cox analysis. Additionally, the CD4 count was included as a categorical covariate with a special value indicating that the CD4 count was missing in the multivariate Cox analysis in 371 patients to evaluate its association with infection (see Supplemental Digital Content 1, http://links.lww.com/MD/A267, Table 2, which demonstrates the results of multivariate Cox analysis).
The impact of the exclusion of patients with uncertain outcome status was examined by repeating the Cox analysis in a larger dataset, which added those clinically suspected infections lacking microbiological evidence to the endpoint of overall major infections.
To investigate the independent predictive value of TLC or CD4 count for infections, we first included the measurements from the last visit before infection or censoring, which intuitively should be more closely related to the immunosuppressive status at that time. We performed univariate Cox analysis for infection in 124 patients with complete CD4 count data, the variables included were the CD4 count and TLC collected at the last follow-up visit before infection or censoring, baseline demographic data, vasculitis classification, ANCA types, initial BVAS value, initial creatinine clearance rate (CCr), organ involvement at presentation, prophylactic trimethoprim-sulfamethoxazole (SMZ/TMP) use, and immunosuppressive therapy regimen. Parameters associated with infection at P < 0.1 on univariate Cox analysis, as well as those reported in the literature, were entered into a multivariate Cox proportional hazards model (forward conditional) to quantify independent predictors of infection (verified using a backward conditional model). The results were expressed as the hazard ratio (HR) with a 95% confidence interval (CI). Furthermore, we replicated the multivariate Cox model with the CD4 count or TLC measured at two other typical time points, that is, at baseline before the initiation of immunosuppressive therapy and at the beginning of dose reduction. The decrease of CD4 count or TLC from the baseline to the second time point or to the last visit was also calculated to replicate the multivariate Cox models. In addition, we also fitted the Anderson-Gill model to include the CD4 count or TLC as a time-varying covariate (with measurements from the 3 above-mentioned time points). These multivariate Cox models were then compared by their concordance. The potential interaction of time with the CD4 count or TLC was examined by the test of proportionality with the cox.zph function of the survival package in R software.
To compare the ability of the CD4 count with TLC for predicting infection, the AUC(t) of these two markers measured at the most predictive time point were estimated and compared in Kaplan-Meier analyses.25 The AUC(t) of this cumulative/dynamic time-dependent ROC curve quantifies how well a marker can distinguish subjects who fail by a given time from subjects who fail after this time.26 The results were expressed as the AUC(t) with a 95% point-wise CI and standard error (SE). The difference was considered significant if the P value was <0.05. Cutoff values for the CD4 count and TLC in the Kaplan-Meier analysis for infection were also calculated using a method that defines the most significant (log-rank test) split or the minimal P value.27
Then, the analyses for infection risk were repeated for different pathogens, that is, bacterial infection and non-bacterial infection, by Cox models with competing risks. In these analyses, controls were defined as subjects that were free of any event (e.g., in the analysis of non-bacterial infection, the patients with bacterial infections were not included as the uninfected controls but rather only used for estimating weights of the probability of each case being observed in the survival analysis).
The Cox regression analysis of major infections and the comparison of the predictive values of the TLC and CD4 count with AUC(t) was performed with R software (version 3.0.2). Additional analysis was performed with the SPSS statistical software package (version 13.0, Chicago, IL).
RESULTS
General Data of the Patients
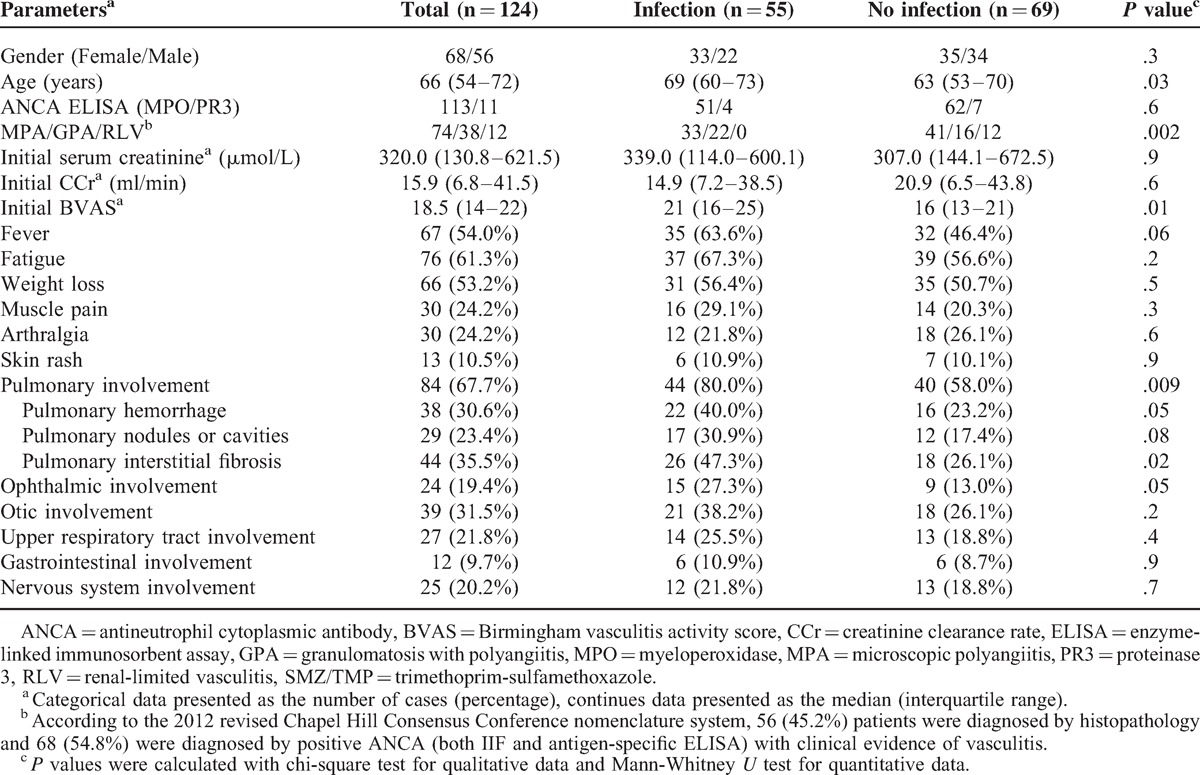
Among the 124 patients with AAV, 56 were male and 68 were female, with a median age of 66 (range 16–89) years at diagnosis; 113 (91.1%) of them were MPO-ANCA positive, whereas the other 11 (8.9%) patients were PR3-ANCA-positive. According to the Chapel Hill Consensus Conference definition, 74 of the 124 (59.7%) patients were classified as having MPA, 38 of the 124 (30.6%) were classified as having GPA and 12 of the 124 (9.7%) were classified as having RLV. The average duration of follow-up was 11.5 (range 0.5–142) months. The detailed general data at baseline are summarized in Table 1.
TABLE 1.
General Data of Patients with ANCA-Associated Vasculitis at Baseline
The infection-free survival curve of the AAV patients was especially steep within the first 6 months after the initiation of immunosuppressive therapy (Figure 2). In fact, 38 out of the 55 infection episodes (69.1%) occurred within the first 6 months, and by 2 years of follow-up 44 out of 55 infections (80.0%) had happened.
FIGURE 2.
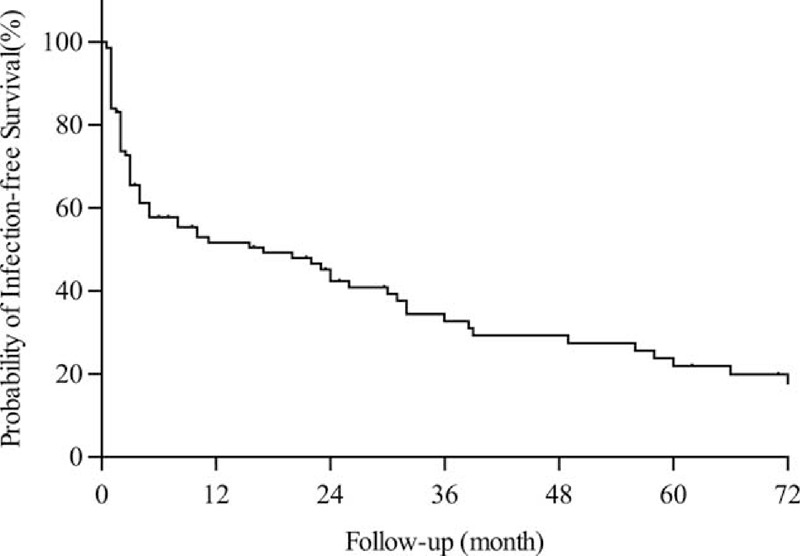
Infection-free survival during follow-up.
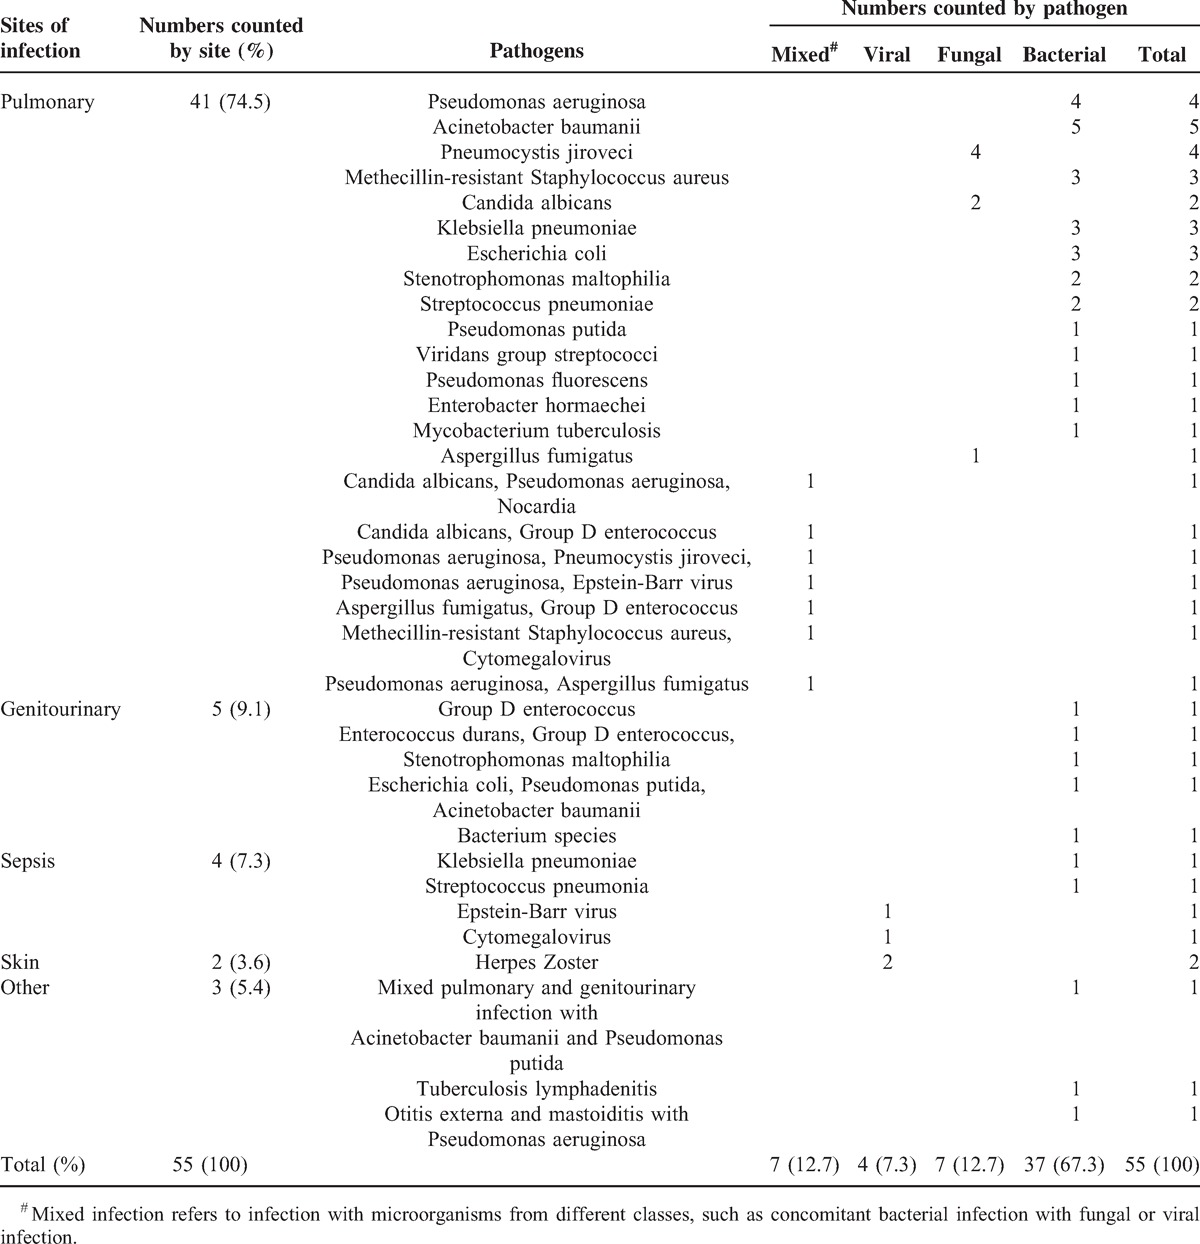
The pathogens and sites of infection were also analyzed. Bacterial infection was the most common cause of the infectious episodes (37/55, 67.3%), including 2 cases of tuberculosis. Fungal (7/55, 12.7%) and viral (4/55, 7.3%) infections were the second and third most common cause of infection. In addition, 7 of the 55 (12.7%) episodes of infection were caused by mixed pathogens. Among the fungal or mixed infections, 5 were caused by Pneumocystis jiroveci. Regarding the sites of infection, pulmonary infection was the leading site (41/55, 74.5%), followed by genitourinary infection and sepsis (5/55 and 4/55, respectively) (Table 2).
TABLE 2.
Details of Major Infectious Episodes
Survival Analysis for the Overall Infection
Univariate Cox analyses for risk factors of the overall infection were performed both in the cohort of 247 patients without CD4 count data from their last visit and in 124 patients with CD4 count data, and the results were similar to one another (see Supplemental Digital Content 1, http://links.lww.com/MD/A267, Table 1, which demonstrates the results of the univariate Cox analyses). Candidate parameters which were entered in the multivariate survival analysis included age, gender, disease classification, gastrointestinal involvement, initial creatinine clearance (CCr), pulmonary interstitial fibrosis, pulmonary nodule or cavity, pulmonary hemorrhage and the log10TLC or log10CD4 count measured at the last visit before infection or censoring. Due to the close correlation between the log10TLC and the log10CD4 count, these two parameters were submitted separately to the multivariate survival analysis using different models (model A and model B, respectively) (n = 124). In model A, which included the log10TLC rather than the log10CD4 count, lower initial CCr (for per 10 ml/min increase, HR = 0.899, 95%CI 0.814–0.994, P = 0.04), the presence of pulmonary interstitial fibrosis (HR = 1.822 95%CI 1.013–3.277, P = 0.05), the presence of a pulmonary nodule or cavity (HR = 2.680, 95%CI 1.422–5.049, P = 0.002) and a lower log10TLC (TLC measured per 1 × 10⁹/L increase, HR = 0.361, 95%CI 0.128–0.999, P = 0.05) were found to be independent risk factors for overall infection. In model B, which included the log10CD4 count rather than log10TLC, lower initial CCr (for per 10 ml/min increase, HR = 0.886, 95%CI 0.804–0.979, P = 0.02), the presence of pulmonary interstitial fibrosis (HR = 1.850, 95%CI 1.029–3.326, P = 0.04), the presence of a pulmonary nodule or cavity (HR = 2.781, 95%CI 1.472–5.257, P = 0.002) and a lower log10CD4 count (CD4 count measured per 1 × 10⁹/L increase, HR = 0.279, 95%CI 0.132–0.592, P < 0.001) were found to be independent risk factors for overall infection (Table 3).
TABLE 3.
Multivariate Cox Analyses with Model A and Model B for Overall Infections (n = 124)
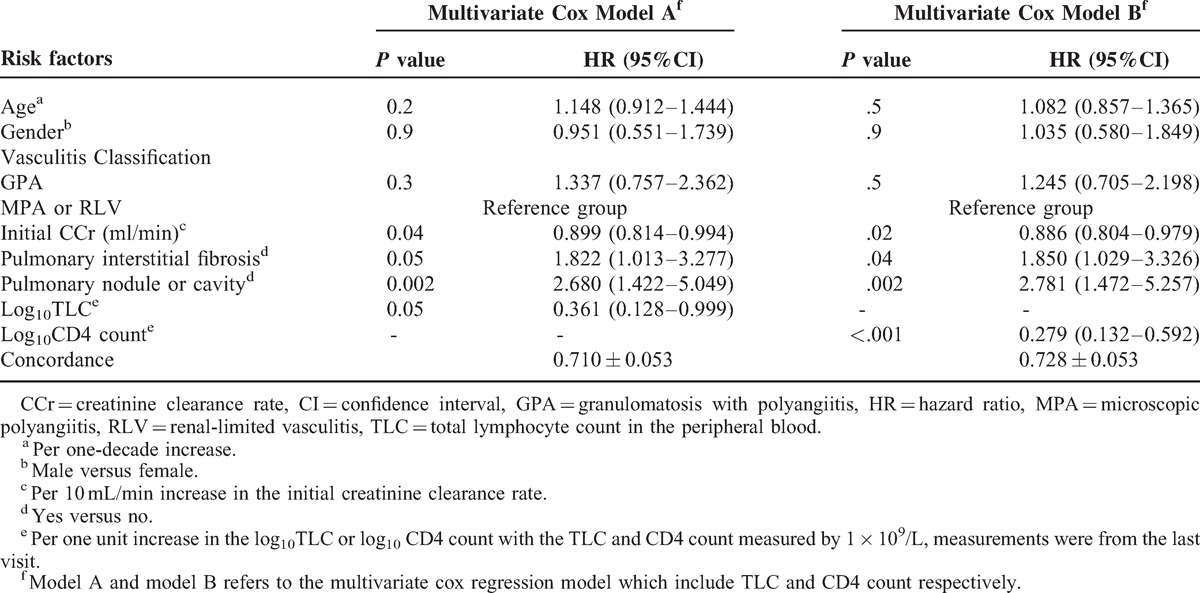
Then the multivariate Cox analyses were also repeated for the CD4 count and TLC measured at the other two above-mentioned time points, for the decreases between the time points, and for the time-varying form of the CD4 count and TLC. The comparison of the concordance of these Cox models confirmed our assumption that the most up-to-date measurement from the last visit was the most predictive of the impending infection (see Supplemental Digital Content 2, http://links.lww.com/MD/A267, Tables 2–3, which illustrate the results of above-mentioned multivariate Cox models).
Comparison of the TLC and the CD4 Count for Predicting the Overall Infection
To compare the values of the TLC and CD4 count from last visit to predict the overall infection, the AUC(t)s of TLC and CD4 count were estimated and compared continuously on a plot. Since most of the infections had happened by 2 years of follow-up, the comparison of the AUC(t)s was also demonstrated at 5 arbitrarily chosen but typical time points of follow-up visits in the first 2 years, that is, at the 3rd, 6th, 9th, 12th and 24th month after the initiation of immunosuppressive therapy (Figure 3). The predictive value of the CD4 count measured by the AUC(t), which ranged from 62.8% to 70.2%, was almost always higher than the predictive value of the TLC (range 55.2–58.1%) during the first 2 years of immunosuppressive therapy (P = .01–.2) (Figure 3), although the lower border of 95% point-wise CI of the ΔAUC(t) (ΔAUC(t) = AUCCD4count(t)- AUCTLC(t)) intersected the zero line occasionally (Figure 4). Collectively, these results suggested that CD4 count performed better than the TLC for predicting overall infection in AAV patients, particularly during the first 2 years of immunosuppressive therapy. In addition, cutoff values for predicting overall infection can be inferred, which were −0.288 (HR = 0.272, 95%CI 0.154–0.481, P < .001) for the log10TLC and −0.783 (HR = 0.297, 95%CI 0.155–0.572, P < .001) for the log10CD4 count, that is, 0.515 × 10⁹/L for the TLC and 0.165 × 10⁹/L for the CD4 count.
FIGURE 3.
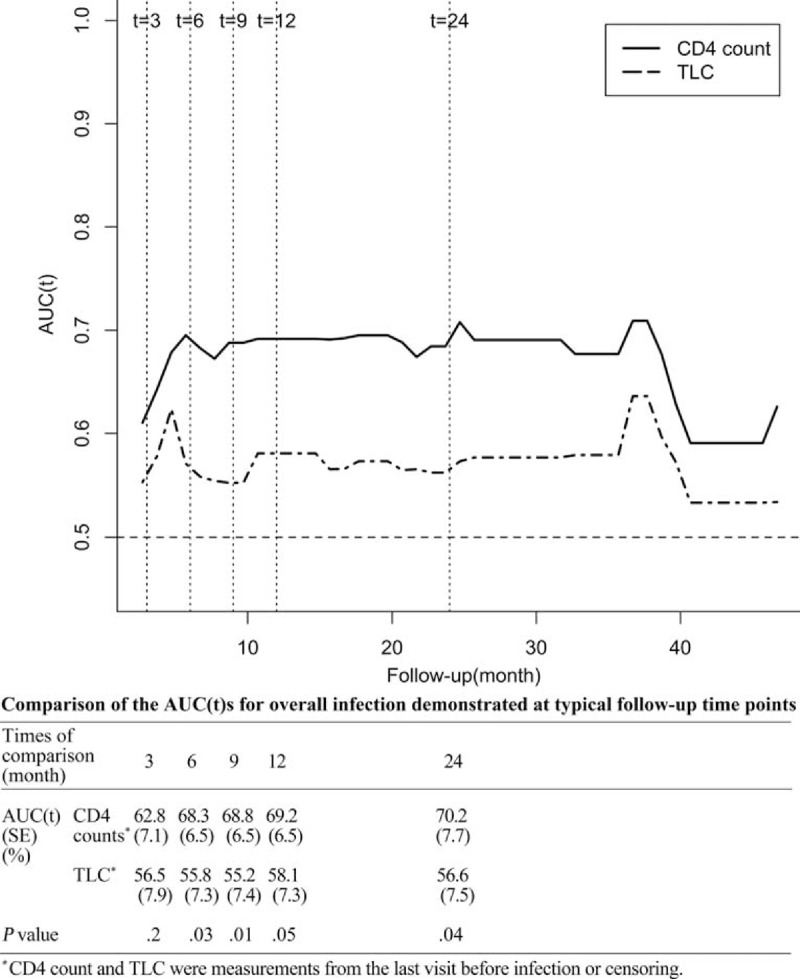
. Comparison of the AUC(t) over time for the CD4 count and total lymphocyte count measured at the last visit for overall infection. AUC(t) = time-dependent area under the receiver operator characteristics curve, TLC = total lymphocyte count in the peripheral blood.
FIGURE 4.
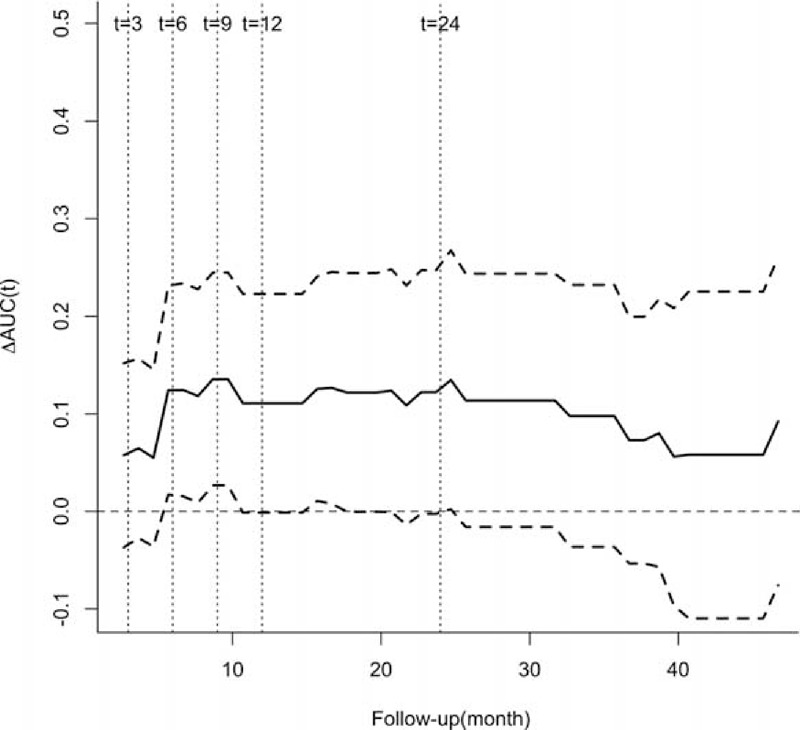
Difference in the AUC(t) between the CD4 count and the total lymphocyte count measured at the last visit with a 95% point-wise confidence interval for overall infection. AUC(t) = time-dependent area under the receiver operator characteristics curve, TLC = total lymphocyte count in the peripheral blood, ΔAUC(t) = AUC(t)CD4 count − AUC(t)TLC.
Comparison of the TLC and the CD4 Count for Predicting Causes-Specific Infection Or Clinically Diagnosed Infection
Then, the survival analyses were repeated for cause-specific outcomes, and the endpoint was defined as bacterial or non-bacterial infection with microbiological confirmation. The uni- and multivariate Cox analyses showed that both the CD4 count and TLC measured at the last visit before censoring or infection were independent risk factors for non-bacterial infection (data not shown). The AUC(t)s demonstrated that both the CD4 count (range 77.6–82.7%) and TLC (range 69.2–77.7%) had a good value for predicting non-bacterial infection during the first 2 years of immunosuppressive therapy, and the difference between the two markers was not significant (P > 0.1) (Figures 5 and 6). In terms of bacterial infection, the univariate Cox analysis showed that lower log10CD4 count was an independent risk factor for bacterial infection (CD4 count measured per 1 × 10⁹/L increase, HR = 0.424, 95%CI 0.180–0.998, P = .05), whereas lower log10TLC was not (TLC measured per 1 × 10⁹/L increase, HR = 0.532, 95%CI 0.154–1.838, P = .3). Therefore, no further estimation or comparison of AUC(t) was conducted.
FIGURE 5.
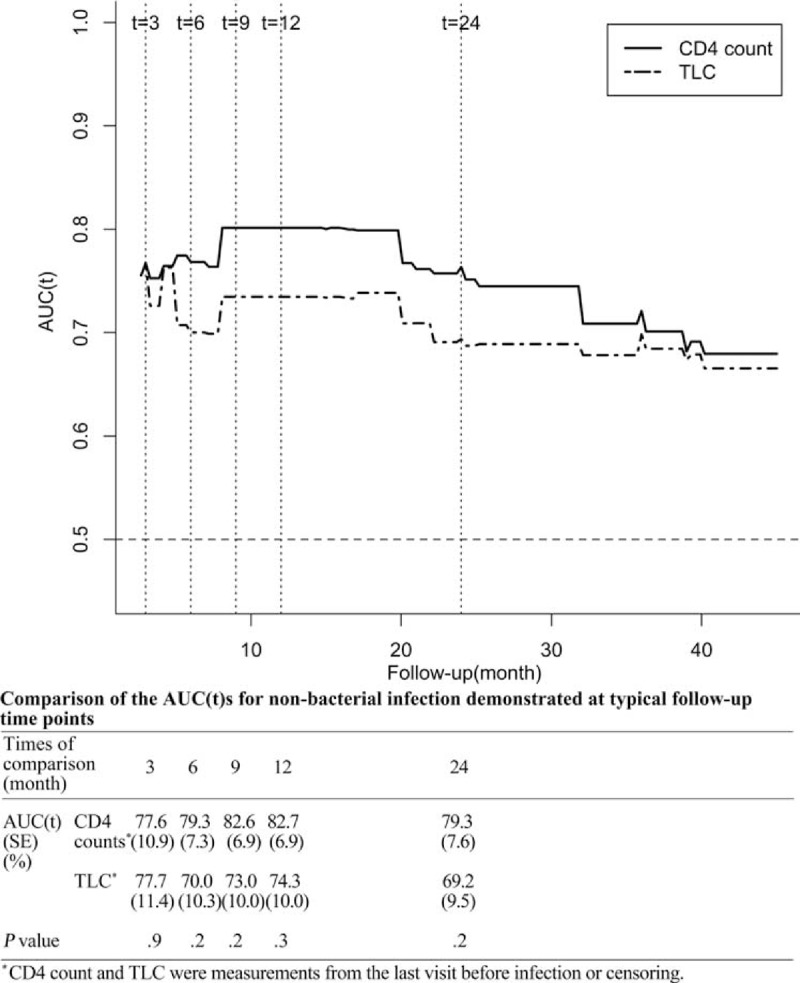
Comparison of the AUC(t) over time for the CD4 count and total lymphocyte count measured at the last visit for non-bacterial infection. AUC(t) = time-dependent area under the receiver operator characteristics curve, TLC = total lymphocyte count in the peripheral blood.
FIGURE 6.
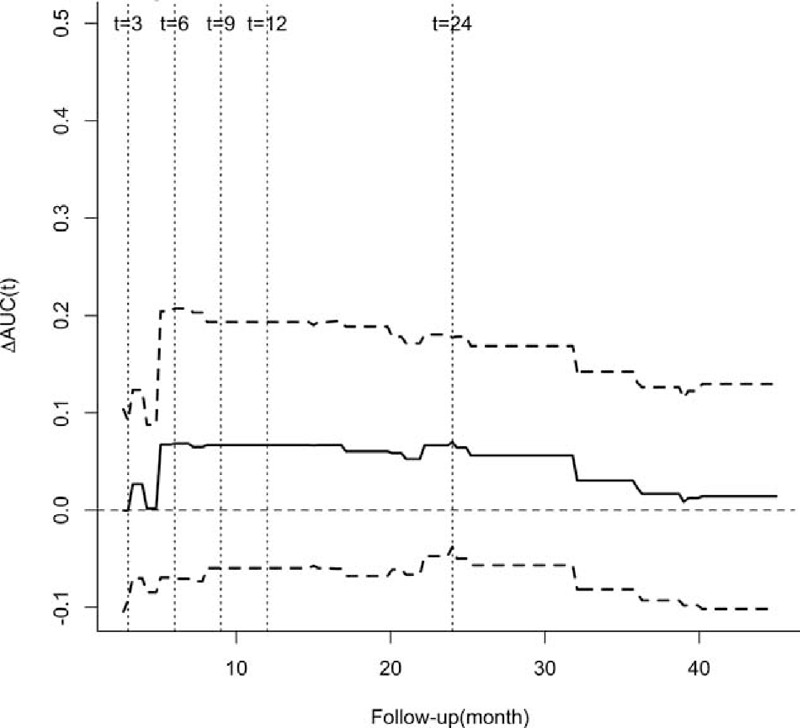
Difference in the AUC(t) between the CD4 count and the total lymphocyte count measured at the last visit with a 95% point-wise confidence interval for non-bacterial infection. AUC(t) = time-dependent area under the receiver operator characteristics curve, TLC = total lymphocyte count in the peripheral blood, ΔAUC(t) = AUC(t)CD4 count − AUC(t)TLC.
Furthermore, we repeated the Cox analysis and AUC comparison by reclassifying major infection outcome to include those clinically diagnosed infections without a positive identification of the responsible microorganisms. By this definition, 150 patients were eligible for our analysis, 81 (54%) of which experienced a major infection. Lower log10TLC (TLC measured per 1 × 10⁹/L increase, HR = 0.293, 95%CI 0.129–0.666, P = .003) and lower log10CD4 count (CD4 count measured per 1 × 10⁹/L increase, HR = 0.285, 95%CI 0.153–0.529, P < .001) remained independent predictors of infection in the multivariate Cox analyses, which adjusted for the same covariates as model A and B (data not shown). The predictive value of CD4 count for the first major overall infection as measured by AUC(t) (64.0–72.0%) was also higher than that of TLC (57.1–61.9%) during the first 2 years of immunosuppressive therapy, with a smaller SE (5.4–6.5%) and smaller P value (.01–.1), which corresponded to the enlarged sample size. Collectively, these results suggested that the CD4 count almost always performed better than the TLC at predicting overall infection in AAV patients during the first 2 years of immunosuppressive therapy, which was unlikely the result of either selection or misclassification bias.
DISCUSSION
In our previous studies and studies by other groups, infection is a major cause of mortality in AAV, and the majority of infections occur within the first several months of treatment.7,10,11 Previous studies have demonstrated the important role of leukopenia or lymphopenia in predicting infections in AAV.7,10,11 The CD4 count has been widely used to evaluate immune status and predict opportunistic infections in AIDS patients, as well as to predict Pneumocystis pneumonia infection in other immunocompromised populations.15,16 However, to the best of our knowledge, studies of the predictive value of CD4 count for overall infection in AAV patients are rare. Moreover, the pathogen profile of infection in AAV patients was quite different from that in AIDS patients, and the majority of infections in AAV patients were bacterial.4,13,28 Therefore, it is of particular interest to investigate the value of the CD4 count for predicting infection in AAV patients.
In the current study, we found that both the TLC and the CD4 count (expressed as the log10-transformed values) measured at the last follow-up visit before infection or censoring were independently associated with the overall infection in AAV patients using separate Cox models and that the predictive value of the CD4 count measured by the AUC(t) was better than that of the TLC, particularly during the first 2 years of immunosuppressive therapy.
The mechanism responsible for the fact that the CD4 count is a better predictor of overall infection in AAV patients is not fully clarified. CD4+ T cells play a central role in immune protection and orchestrate the full panoply of immune responses to both extra- and intracellular bacteria, fungi, viruses and parasites.29–31 Thus, CD4 lymphopenia is commonly regarded as a marker of immunocompromised status. Other subsets of lymphocytes or a combination of lymphocyte subsets could also provide predictive information for infection. In fact, in some studies of immunocompromised patients after kidney transplantation, the CD8 count outperformed the CD4 count for predicting EBV and CMV infection.32,33 The predictive value of the CD8 count and the total T cell count for overall infections and non-bacterial infection in AAV patients were also examined in our study, which turned out to be not as good as that of CD4 count (data not shown). This outcome is most likely because that the CD4 count, compared with other lymphocyte subsets, is influenced more prominently with the induction therapy of corticosteroids and cyclophosphamide13,34–37 or with the AAV disease itself.38 Therefore, the CD4 count more directly reflects the degree of immunocompromised status in these patients.
In addition, the analysis of the predictive value for infection of different pathogens showed that both the TLC and CD4 count performed very well in predicting non-bacterial infection. In terms of bacterial infection, the TLC count was not a significant predictor, whereas lower CD4 count had a borderline P value. In the studies of idiopathic CD4 lymphopenia patients, the most prevalent infection was reported to be cryptococcal infection, followed by mycobacterial, candida, and herpes zoster infection.39,40 All of these results suggest that the CD4+ T cell and TLC might have a more prominent role in predicting fungal and viral infection than bacterial infection.
The current study has some limitations. First, because patients were retrospectively recruited, a number of patients did not have CD4 count data. Our analysis showed that these data were likely to be missing at random, and neither the factors associated with the missing CD4 count nor the missing data itself was significantly associated with infection (Supplemental Digital Content 1, http://links.lww.com/MD/A267). However, the actual influence of this selection bias is unknown. Second, only the CD4 count and TLC measured at three typical time points and the time-varying covariate derived from these three time points were included in the comparison of their ability to predict infection (Supplemental Digital Content 2, http://links.lww.com/MD/A267), and the duration of the decrease in CD4 count or TLC before infection could not be determined in our study. Further investigation by prospective study with more uniformly and closely monitored TLC or CD4 counts may help to determine the best time point of measurements for infection prediction or may improve the predictive value of including these counts as time-varying covariates.
In conclusion, the TLC and CD4 count were both independent risk factors of overall infection and non-bacterial infection in AAV patients. The CD4 count had a higher predictive value than the TLC for the overall infection, particularly during the first 2 years of immunosuppressive therapy.
Footnotes
Abbreviations: AAV = ANCA-associated vasculitis, ANCA = antineutrophil cytoplasmic antibody, AUC = area under the ROC curve, BVAS = Birmingham Vasculitis Activity Score, CCr = creatinine clearance ratio, CD4 count = CD4 positive T lymphocyte count in the peripheral blood, CI = confidence interval, EGPA = eosinophilic granulomatosis with polyangiitis, ELISA = enzyme-linked immunosorbent assay, GPA = granulomatosis with polyangiitis, IIF = indirect immunofluorescence, MPA = microscopic polyangiitis, MPO = myeloperoxidase, PR3 = proteinase 3, ROC = receiver operator characteristics, SD = standard deviation, SE = standard error, SMZ/TMP = trimethoprim-sulfamethoxazole, TLC = total lymphocyte count in the peripheral blood.
Supports: This study was supported by a grant of the Chinese 973 project (No. 2012CB517702), three grants from the National Natural Science Fund (No. 81425008, 81321064 and 81370829), and the “National Key Technology Research and Development (R&D) Program” of the Ministry of Science and Technology of China (No. 2011BAI10B04).
Contributions: Yi-Yun Shi participated in the design of the study, collected the data, performed the statistical analysis and drafted the manuscript. Zhi-Ying Li collected the data, provided advice about the statistical analysis and helped to draft the manuscript. Min Chen and Ming-Hui Zhao conceived the study, participated in its design and helped to interpret the data. All authors read and approved the final manuscript. Yi-Yun Shi takes responsibility for the affirmation that this study has been reported honestly, accurately, and transparently, that no important aspects of the study have been omitted and that any discrepancies from the study as planned (and, if relevant, registered) have been explained.
Conflicts of interest: None declared.
Supplemental digital content is available for this article. Direct URL citations appear in the printed text and are provided in the HTML and PDF versions of this article on the journal's Website (www.md-journal.com).
REFERENCES
- 1.Tarzi RM, Pusey CD. Current and future prospects in the management of granulomatosis with polyangiitis (Wegener's granulomatosis). Ther Clin Risk Manag 2014; 10:279–293. [DOI] [PMC free article] [PubMed] [Google Scholar]
- 2.Hilhorst M, Wilde B, van Paassen P, et al. Improved outcome in anti-neutrophil cytoplasmic antibody (ANCA)-associated glomerulonephritis: a 30-year follow-up study. Nephrol Dial Transplant 2013; 28:373–379. [DOI] [PubMed] [Google Scholar]
- 3.Kallenberg CG. The diagnosis and classification of microscopic polyangiitis. J Autoimmun 2014; 48–49.90–93.. [DOI] [PubMed] [Google Scholar]
- 4.Koselj-Kajtna M, Koselj M, Rott T, et al. Infectious complications of immunosuppressive treatment for anti-neutrophil cytoplasm antibody-related vasculitis. Transplant Proc 2002; 34:3001–3002. [DOI] [PubMed] [Google Scholar]
- 5.Flossmann O, Berden A, de Groot K, et al. Long-term patient survival in ANCA-associated vasculitis. Ann Rheum Dis 2011; 70:488–494. [DOI] [PubMed] [Google Scholar]
- 6.Wang T, Weigt SS, Belperio JA, et al. Immunosuppressive and cytotoxic therapy: pharmacology, toxicities, and monitoring. Semin Respir Crit Care Med 2011; 32:346–370. [DOI] [PubMed] [Google Scholar]
- 7.Wall N, Harper L. Complications of long-term therapy for ANCA-associated systemic vasculitis. Nat Rev Nephrol 2012; 8:523–532. [DOI] [PubMed] [Google Scholar]
- 8.Doran MF, Crowson CS, Pond GR, et al. Predictors of infection in rheumatoid arthritis. Arthritis Rheum 2002; 46:2294–2300. [DOI] [PubMed] [Google Scholar]
- 9.Jayne D, Rasmussen N, Andrassy K, et al. A randomized trial of maintenance therapy for vasculitis associated with antineutrophil cytoplasmic autoantibodies. N Engl J Med 2003; 349:36–44. [DOI] [PubMed] [Google Scholar]
- 10.Goupil R, Brachemi S, Nadeau-Fredette AC, et al. Lymphopenia and treatment-related infectious complications in ANCA-associated vasculitis. Clin J Am Soc Nephrol 2013; 8:416–423. [DOI] [PMC free article] [PubMed] [Google Scholar]
- 11.Lai QY, Ma TT, Li ZY, et al. Predictors for mortality in patients with antineutrophil cytoplasmic autoantibody-associated vasculitis: a study of 398 Chinese patients. J Rheumatol 2014; 41:1849–1855. [DOI] [PubMed] [Google Scholar]
- 12.Fernandez-Ruiz M, Lopez-Medrano F, Allende LM, et al. Kinetics of peripheral blood lymphocyte subpopulations predicts the occurrence of opportunistic infection after kidney transplantation. Transpl Int 2014; 27:674–685. [DOI] [PubMed] [Google Scholar]
- 13.Gluck T, Kiefmann B, Grohmann M, et al. Immune status and risk for infection in patients receiving chronic immunosuppressive therapy. J Rheumatol 2005; 32:1473–1480. [PubMed] [Google Scholar]
- 14.Brown ER, Otieno P, Mbori-Ngacha DA, et al. Comparison of CD4 cell count, viral load, and other markers for the prediction of mortality among HIV-1-infected Kenyan pregnant women. J Infect Dis 2009; 199:1292–1300. [DOI] [PMC free article] [PubMed] [Google Scholar]
- 15.Sowden E, Carmichael AJ. Autoimmune inflammatory disorders, systemic corticosteroids and pneumocystis pneumonia: a strategy for prevention. BMC Infect Dis 2004; 4:42. [DOI] [PMC free article] [PubMed] [Google Scholar]
- 16.2010; Stamp LK, Hurst M. Is there a role for consensus guidelines for P. jiroveci pneumonia prophylaxis in immunosuppressed patients with rheumatic diseases? J Rheumatol. 37:686–688. [DOI] [PubMed] [Google Scholar]
- 17.Jennette JC, Falk RJ, Bacon PA, et al. 2012 revised International Chapel Hill Consensus Conference Nomenclature of Vasculitides. Arthritis Rheum 2013; 65:1–11. [DOI] [PubMed] [Google Scholar]
- 18.Abril A, Calamia KT, Cohen MD. The Churg Strauss syndrome (allergic granulomatous angiitis): review and update. Semin Arthritis Rheum 2003; 33:106–114. [DOI] [PubMed] [Google Scholar]
- 19.Li ZY, Chang DY, Zhao MH, et al. Predictors of treatment resistance and relapse in antineutrophil cytoplasmic antibody-associated vasculitis: a study of 439 cases in a single Chinese center. Arthritis Rheumatol 2014; 66:1920–1926. [DOI] [PubMed] [Google Scholar]
- 20.Jennette JC. Rapidly progressive crescentic glomerulonephritis. Kidney Int 2003; 63:1164–1177. [DOI] [PubMed] [Google Scholar]
- 21.Luqmani RA, Bacon PA, Moots RJ, et al. Birmingham Vasculitis Activity Score (BVAS) in systemic necrotizing vasculitis. QJM 1994; 87:671–678. [PubMed] [Google Scholar]
- 22.Garner JS, Jarvis WR, Emori TG, et al. CDC definitions for nosocomial infections, 1988. Am J Infect Control 1988; 16:128–140. [DOI] [PubMed] [Google Scholar]
- 23.Charlier C, Henegar C, Launay O, et al. Risk factors for major infections in Wegener granulomatosis: analysis of 113 patients. Ann Rheum Dis 2009; 68:658–663. [DOI] [PubMed] [Google Scholar]
- 24.Stebbing J, Sawleshwarkar S, Michailidis C, et al. Assessment of the efficacy of total lymphocyte counts as predictors of AIDS defining infections in HIV-1 infected people. Postgrad Med J 2005; 81:586–588. [DOI] [PMC free article] [PubMed] [Google Scholar]
- 25.Blanche P, Dartigues JF, Jacqmin-Gadda H. Estimating and comparing time-dependent areas under receiver operating characteristic curves for censored event times with competing risks. Stat Med 2013; 32:5381–5397. [DOI] [PubMed] [Google Scholar]
- 26.Lambert J, Chevret S. Summary measure of discrimination in survival models based on cumulative/dynamic time-dependent ROC curves. Stat Methods Med Res 2014; [Epub ahead of print]. [DOI] [PubMed] [Google Scholar]
- 27.Budczies J, Klauschen F, Sinn BV, et al. Cutoff Finder: a comprehensive and straightforward Web application enabling rapid biomarker cutoff optimization. PLoS One 2012; 7:e51862. [DOI] [PMC free article] [PubMed] [Google Scholar]
- 28.Morton M, Edmonds S, Doherty AM, et al. Factors associated with major infections in patients with granulomatosis with polyangiitis and systemic lupus erythematosus treated for deep organ involvement. Rheumatol Int 2012; 32:3373–3382. [DOI] [PubMed] [Google Scholar]
- 29.Tubo NJ, Jenkins MK. CD4+ T Cells: guardians of the phagosome. Clin Microbiol Rev 2014; 27:200–213. [DOI] [PMC free article] [PubMed] [Google Scholar]
- 30.Deuffic-Burban S, Losina E, Wang B, et al. Estimates of opportunistic infection incidence or death within specific CD4 strata in HIV-infected patients in Abidjan, Côte d’Ivoire: impact of alternative methods of CD4 count modelling. Eur J Epidemiol 2007; 22:10. [DOI] [PMC free article] [PubMed] [Google Scholar]
- 31.Luckheeram RV, Zhou R, Verma AD, et al. CD4(+)T cells: differentiation and functions. Clin Dev Immunol 2012; 2012:925135. [DOI] [PMC free article] [PubMed] [Google Scholar]
- 32.Bouvy AP, Kho MM, Klepper M, et al. Kinetics of homeostatic proliferation and thymopoiesis after rATG induction therapy in kidney transplant patients. Transplantation 2013; 96:904–913. [DOI] [PubMed] [Google Scholar]
- 33.Calarota SA, Zelini P, De Silvestri A, et al. Kinetics of T-lymphocyte subsets and posttransplant opportunistic infections in heart and kidney transplant recipients. Transplantation 2012; 93:112–119. [DOI] [PubMed] [Google Scholar]
- 34.Chen M, Kallenberg CG. ANCA-associated vasculitides-advances in pathogenesis and treatment. Nat Rev Rheumatol 2010; 6:653–664. [DOI] [PubMed] [Google Scholar]
- 35.Dimitrov S, Benedict C, Heutling D, et al. Cortisol and epinephrine control opposing circadian rhythms in T cell subsets. Blood 2009; 113:5134–5143. [DOI] [PMC free article] [PubMed] [Google Scholar]
- 36.McCune WJ, Golbus J, Zeldes W, et al. Clinical and immunologic effects of monthly administration of intravenous cyclophosphamide in severe systemic lupus erythematosus. N Engl J Med 1988; 318:1423–1431. [DOI] [PubMed] [Google Scholar]
- 37.Manno R, Boin F. Immunotherapy of systemic sclerosis. Immunotherapy 2010; 2:863–878. [DOI] [PMC free article] [PubMed] [Google Scholar]
- 38.Berden AE, Kallenberg CG, Savage CO, et al. Cellular immunity in Wegener's granulomatosis: characterizing T lymphocytes. Arthritis Rheum 2009; 60:1578–1587. [DOI] [PubMed] [Google Scholar]
- 39.Ahmad DS, Esmadi M, Steinmann WC. Idiopathic CD4 Lymphocytopenia: Spectrum of opportunistic infections, malignancies, and autoimmune diseases. Avicenna J Med 2013; 3:37–47. [DOI] [PMC free article] [PubMed] [Google Scholar]
- 40.Walker U, Warnatz K. Idiopathic CD4 lymphopenia. Curr Opin Rheumatol 2006; 18:389–395. [DOI] [PubMed] [Google Scholar]


