

Significance
Almost all cell types rely on calcium signals to maintain homeostasis and trigger specific cell responses. In eukaryotic cells, store-operated Ca2+ entry (SOCE) is one of the mechanisms used to ensure control over cytosolic Ca2+ signaling and internal Ca2+ stores. Mutations in either Orai1 or stromal interaction molecule 1 (STIM1) lead to lethal severe combined immune deficiencies. Using a morphological approach with transmission and freeze–fracture electron microscopy, we describe STIM1-Orai1 interactions and visualize the distribution of individual Orai1 channels on the cell surface. This approach confirms STIM1-Orai1 interaction at specialized endoplasmic reticulum (ER)–plasma membrane junctions following ER depletion and provides new insight on STIM1-Orai1 stoichiometry.
Keywords: SOCE, STIM1, Orai1, nanoscale patterning, electron microscopy
Abstract
Stromal interacting molecule (STIM) and Orai proteins constitute the core machinery of store-operated calcium entry. We used transmission and freeze–fracture electron microscopy to visualize STIM1 and Orai1 at endoplasmic reticulum (ER)–plasma membrane (PM) junctions in HEK 293 cells. Compared with control cells, thin sections of STIM1-transfected cells possessed far more ER elements, which took the form of complex stackable cisternae and labyrinthine structures adjoining the PM at junctional couplings (JCs). JC formation required STIM1 expression but not store depletion, induced here by thapsigargin (TG). Extended molecules, indicative of STIM1, decorated the cytoplasmic surface of ER, bridged a 12-nm ER-PM gap, and showed clear rearrangement into small clusters following TG treatment. Freeze–fracture replicas of the PM of Orai1-transfected cells showed extensive domains packed with characteristic “particles”; TG treatment led to aggregation of these particles into sharply delimited “puncta” positioned upon raised membrane subdomains. The size and spacing of Orai1 channels were consistent with the Orai crystal structure, and stoichiometry was unchanged by store depletion, coexpression with STIM1, or an Orai1 mutation (L273D) affecting STIM1 association. Although the arrangement of Orai1 channels in puncta was substantially unstructured, a portion of channels were spaced at ∼15 nm. Monte Carlo analysis supported a nonrandom distribution for a portion of channels spaced at ∼15 nm. These images offer dramatic, direct views of STIM1 aggregation and Orai1 clustering in store-depleted cells and provide evidence for the interaction of a single Orai1 channel with small clusters of STIM1 molecules.
Specialized junctions linking the endoplasmic reticulum (ER) to the plasma membrane (PM) were first described by Porter and Palade (1) in skeletal and cardiac muscle. In skeletal muscle, excitation–contraction coupling is mediated by direct physical contact between voltage-gated Ca2+ channels (dihydropyridine receptors) in invaginated transverse tubules of the PM and Ca2+-release channels (ryanodine receptors) in ER membrane (2). A second type of ER-PM junction mediates inside-out signaling by linking depletion of Ca2+ in the ER lumen to Ca2+ influx across the PM in a process termed store-operated Ca2+ entry (SOCE). In addition to being a mechanism of ionic homeostasis, SOCE supports long-lasting Ca2+ signals in many cell types. ER stromal interacting molecule (STIM) and PM Orai proteins were identified by RNAi screening as required for SOCE (3–7). Overexpression of both proteins is required to amplify Ca2+ influx through Orai channels (7–10). In Drosophila, STIM and Orai are the sole members of a gene family, which in mammals, includes two STIM and three Orai proteins. STIM1 and Orai1 are predominant in the immune system; human mutations in either gene can cause lethal severe combined immune deficiencies (SCID) (11). ER STIM proteins trigger SOCE by sensing ER Ca2+ store depletion, translocating as oligomers to the PM, and binding to PM Orai proteins to promote clustering and channel opening (3, 12–16). These events have been extensively documented by microscopy of cells expressing fluorescently tagged proteins. Numerous studies have defined domains and amino acid residues of STIM1 and Orai1 that are vital for channel function (17, 18).
ER-PM junctions underlying SOCE have been visualized by electron microscopy (EM), using either HRP-tagged STIM1 (13, 19) or immunogold labeling of STIM1 (20). However, little is known about the nanometer-scale subcellular organization of STIM and Orai proteins, although they define a basic unit of Ca2+ signaling. Here, through a close examination of transmission and freeze–fracture electron micrographs of transfected cells expressing STIM1 and Orai1, we further define the microanatomy of the ER-PM, as well as of ER-ER junctions in store-depleted and untreated cells. These images provide direct candidate signatures for STIM1 molecules bridging the ER-PM and ER-ER gaps and for individual Orai1 channels in puncta. Taken together, our observations provide visual confirmation of STIM1 and Orai1 function, constrain models of STIM1 and Orai1 assembly and interaction, and suggest new aspects of molecular interactions between STIM1 and Orai1.
Results
Sets of HEK 293A cells were cultured and transfected under the same conditions and treated either with thapsigargin (TG) to deplete the ER of Ca2+ or with DMSO to control for the specific effect of store depletion. The samples will be referred as empty vector (EV)/DMSO and EV/TG for cells transfected with EVs and named after the DNA used in the transfection, followed by the treatment, for all others (e.g., Orai1/DMSO, Orai1/TG, STIM1/Orai1/DMSO, etc.). Static EM images are affected both by the experimental procedures and by the intervention of the fixative solution containing a cross-linking agent, glutaraldehyde; we consider how each observed structure may be affected. We define “junctional coupling” (JC) here as a specialized subcellular structure that occurs at sites of close membrane apposition between two organelles.
Visualization of STIM1 Molecules and ER-PM Interactions by Thin-Section EM.
ER in EV- and Orai1-transfected cells.
Control EV samples exhibit scarce elements of the ER, only occasionally in the form of flat cisternae, and a dense cytoskeletal network that is not highly structured. JCs between two ER cisternae and between peripheral ER elements and the PM are quite rare, and no obvious differences were revealed between TG- and DMSO-treated cells. An increase in JCs of the type found in Jurkat T cells after TG treatment (13) could not be detected because of the scarcity of JC profiles. Therefore, we did not perform a detailed cell by cell morphometric analysis but pooled the data from all cells. In 140 cell profiles from three separate cultures (one treated with TG, two with DMSO), we detected 20 short JCs (0.15–0.20 µm in length) and nine medium-long JCs (0.25–0.6 µm), giving a total length of JC profiles for all cells of ∼7.3 µm. Given an average perimeter length of the sectioned cell profiles of 42 ± 8 µm (from 40 randomly selected cell profiles), with a total combined length of 5,888 µm, we estimate that JCs in EV-transfected cells occupy less than 1% of the cell periphery (Fig. 1).
Fig. 1.
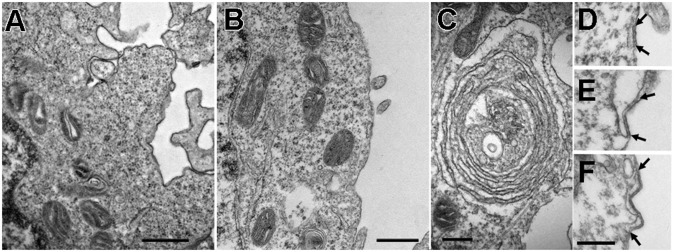
Thin-section EM images of the cell periphery. A and C are from Orai1/TG, and B and D–F are from EV/DMSO cells. A and B show common appearances of the cell periphery and ER in Orai1- and EV-transfected cells (but not STIM1-transfected cells). The cytoplasm is poorly structured, and ER elements are scarce and have a smooth cytoplasmic surface. (C) Rare example of parallel but separate ER elements in an Orai1/TG cell. D–F illustrate examples of JCs in EV/DMSO cells (between arrows). A short (D), a medium (E), and a longer (F) JC are shown. All JCs are rare, and longer ones are extremely rare, in these cells. (Scale bars: A and B, 500 nm; C–F, 250 nm.]
Cells transfected with DNA for Orai1 channels in the absence of STIM1 overexpression do not show distinguishing features in thin sections, so that when examining these samples, it is not possible to tell which cells overexpress the channels. The overall structure of Orai1/TG cells is the same as that of EV/TG cells (Fig. 1 A and B), with only an occasional presence of extensive ER cisternae (Fig. 1C). JCs were seen infrequently in EV/DMSO cells (Fig. 1 D–F), and in Orai1-only–transfected samples, JCs were also short; in 371 cells from four Orai1/DMSO samples, we detected 61 short JCs and 11 medium ones. In 191 cells from four Orai1/TG samples, 18 short and 2 medium-length JCs were present. Both short and medium-length JCs occupy less than 1% of the cell periphery, similar to EV-transfected cells. Clearly, glutaraldehyde fixation does not induce ER clustering or JC formation in cells with an endogenous content of STIM1.
Proliferation of ER elements in cells overexpressing STIM1.
Cells that overexpress the STIM1 protein as a result of transfection show extensive proliferation of ER and obvious JCs. Cells transfected with DNA for either STIM1 alone or for STIM1 and Orai1 combined showed obvious structural alterations in 31–68% of cell profiles counted (from a total of 50 and 180 cells, respectively) in an initial set of experiments that used high levels of DNA. Cells within the same thin sections that resembled EV transfected cells were assumed to be untransfected and ignored for further analysis.
The highest level of STIM1 expression could only be obtained in the absence of Orai1 coexpression, because a higher amount of total DNA could not be used without damaging the cells. High levels of STIM1 expression resulted in three different configurations of the greatly extended ER. Wide flat cisternae, with variable degrees of fenestration, often arranged in closely apposed stacks of 2–10 elements are a common configuration (Fig. 2 A–F, highlighted in yellow). Either a single flat cisterna or the most peripheral element of the stack is parallel to and in close apposition to the PM and forms extended JCs up to 1.6 µm in length (Fig. 2, highlighted in turquoise). A second configuration is an extensive labyrinthine structure formed by convoluted and often very regular ER elements that abut against each other (the structures fill the entire image in Fig. 3 A and B). A third configuration is a curved narrow ER cisterna (Fig. 3C) surrounding all or part of an apparent internal vesicle or tubule (T) that can be identified as an invagination of the PM when seen at the cell periphery. Some of the invaginations are quite deep into the cell, so their coupling to ER is structurally equivalent to a dyad, as seen in cardiac muscle (21). In all cases, the closely parallel disposition of ER-ER and ER-PM membranes indicates a specific association rather than just a casual proximity. STIM-induced membrane associations are limited to ER-ER and ER-PM (including PM invaginations) and exclude ER–mitochondria and ER–nuclear envelope associations. In cells transfected with lower amounts of STIM1 DNA, in the presence and/or absence of Orai1 expression, ER also proliferates but mostly forms single flat cisternae of JCs (Fig. 2 E and F) and few internal “dyads.” Whereas in high STIM1-expressing cells, the frequency of multiple peripheral stacks with two or more elements is high (21 out of 41 JCs in DMSO-treated cells and 20 out of 42 JCs in TG-treated cells), in cells expressing low levels of STIM1 (alone or in combination with Orai1), a total of 153 JCs revealed only one double-layered stack. The various membrane dispositions correspond closely to the three categories of precortical, cortical, and thin cortical ER described in ref. 20 under similar STIM1 overexpression conditions. However, we differ in noting that formation of thin cortical ER does not require TG treatment.
Fig. 2.

Targeting of ER elements to the periphery of cells transfected with STIM1. Thin sections at the edges of cells transfected with either STIM1 only (A–D) or STIM1/Orai1 together (E and F) and treated with either DMSO (A, B, and E) or TG (C, D, and F), as indicated in the figure. Multiple elongated ER cisternae, identified by pale yellow in their lumen, are closely apposed to the PM, forming JCs, and to each other at the cell edge. The lumen width varies, but the gap between adjacent ER cisternae and ER cisternae and PM is quite uniform. The ER in A and D seems discontinuous because it is fenestrated (compare with Fig. 3). STIM1 only cells were exposed to higher DNA levels for STIM1 and have more stacks. The PM segments in close apposition to the peripheral ER stacks within JCs are outlined in turquoise. (Scale bars: 100 nm.)
Fig. 3.

Extensive ER-ER association and visible STIM1 protein extensions in cells transfected with STIM1. Thin sections through the cytoplasm of cells expressing either high levels of STIM1 in the absence of Orai1 (A, B, and E) or lower levels of STIM1 after STIM1/Orai1 cotransfection (C) or no STIM at all (D). (A and B) Three-dimensional ER networks (here filling the whole image), with different configurations of the closely packed elements. These networks are only visible in cells expressing high levels of STIM1 and are independent of DMSO (A) or TG (B) treatments. However, visible bristle-like extensions on the ER’s cytoplasmic surface reflecting aggregation of STIM1 into small clusters (some indicated between pairs of small arrows in B) are present only in TG-treated cells (also see Fig. 4). Asterisks indicate STIM1 extensions between ER membranes. (C) Circular ER cisterna surrounds an invagination of the PM (T) in a STIM1/Orai1/TG cell. Similar structures are also seen in the absence of Orai1. Asterisks indicate the presence of STIM1 extensions between the ER and the PM invaginations. (D and E) Comparison between the smooth ER (●) and nuclear envelope (●●) profiles in an EV cell (D) with the fuzzy profile of ER in a STIM1-TG cell (E). (Scale bars: A, 500 nm; B and C, 100 nm; D and E, 50 nm.)
Visualizing STIM1 on the ER surface.
The ER’s cytoplasmic surface appears smooth and does not have distinguishing features in EV cells (Fig. 3D). In contrast, the ER of all STIM1-overexpressing cells shows a distinctive fuzzy layer that can be resolved into individual groups of small linear elements in various states of aggregation (Fig. 3E and between arrows in Fig. 3B). The logical interpretation of these images is that the small projections represent the cytoplasmic extensions of STIM1 molecules that associate at high density in the ER membrane. The luminal side of the membrane is quite clean, indicating that the molecules do not extend far into the lumen. STIM1 projections are most visible where ER membranes abut, either against each other or against the PM, and they are denser in the former than in the latter configuration (Fig. 3B, between asterisks, and Fig. 3E; compare with Fig. 4). This is presumably attributable to the fact that in ER-ER appositions both sides of the apposed membrane contribute STIM1 molecules to the gap.
Fig. 4.

Clustering of STIM1 molecules at ER-PM junctions after store depletion in STIM1/Orai1 cells. Sections at the cell periphery showing JCs. The gap between the ER and PMs is occupied by electron-dense projections, presumably cytoplasmic extensions of STIM1, which display two different states of aggregation. After TG treatment (A, C, and E), the molecules are grouped into small aggregates of various sizes (some indicated by arrows), whereas in DMSO-treated cells (B, D, and F), the molecules are dispersed and appear singly as very thin lines indicated by arrowheads. In both cases, the section thickness (∼40–50 nm) includes many molecules, and a clear view of individual and/or clustered molecules is obtained only where there is a close alignment across the section thickness. Where the molecules are not aligned, a fuzzy layer results (e.g., between asterisks in B and D). (Scale bar: A–F, 100 nm.)
One noticeable feature of the ER-ER and ER-PM associations in the cells transfected with either STIM1 only (Figs. 2 A–D and 3 A and B) or both STIM1 and Orai1 (Figs. 2 E and F, 3C, and 4) is the parallel course of the facing membranes over long distances. In STIM1/Orai1 cells, the gap separating ER from PM has a width that varies little along the area of apposition and is not strongly dependent on pretreatment of the cells with TG (Fig. 4); ER-PM gap sizes in STIM1/Orai1/TG cells are 12 ± 2 nm (from three experiments, 45 JCs, and 277 measurements) and 11 ± 2 nm in STIM1/Orai1/DMSO cells (from four experiments, 69 JCs, and 420 measurements). The gap in DMSO-treated cells is slightly narrower and the difference is statistically significant (P < 0.001) but of very small magnitude. Note that at JCs, the PM is usually slightly pushed forward forming a raised platform on which puncta formation can occur (compare with Fig. S1).
Fig. S1.

STIM1 expression produced raised PM subdomains. (A and B) Freeze–fracture of the PM in cells expressing STIM1 and L273D Orai1. Numerous domains of the plasmalemma are slightly raised outwards into flat platforms of variable sizes and shapes (small arrows in A) because of the presence of subplasmalemmal ER cisternae forming JCs. Compare with Figs. 2 and 4. Large arrows indicate the direction of the platinum shadow. (Scale bars: A, 500 nm; B, 200 nm.)
The gap separating two apposed ER membranes in ER-ER JCs is 14.3 ± 5.3 nm (three experiments, 32 JCs, 153 measurements) in STIM1/TG and 14.3 ± 2.7 (three experiments, 21 JCs, 56 measurements) in STIM1/DMSO cells. The gap is significantly larger than the ER-PM gap in corresponding cells (P < 0.001); however, ER-ER gaps were not measured in STIM1/Orai1-cotransfected cells because of scarcity of available images. Interestingly, the ER-ER gaps in the extensive ER labyrinths of cells greatly overexpressing STIM, such as seen in Fig. 3 A and B, are quite variable, ranging from ∼12 to as high as 27 nm. STIM1 densities projecting out of the free ER surface (e.g., between arrows in Fig. 3B) also reach to similar distances, but precise measurements are not possible because of uncertainty in the position of the cytoplasmic face of the ER membrane.
The state of STIM1 aggregation within the ER membrane is affected by TG treatment.
The appearance of the fuzzy layer over the ER of STIM1-overexpressing cells is distinctly different between TG- and DMSO-treated cells, and the difference is particularly visible where the ER runs parallel to the PM at JCs. In Ca2+-depleted cells (TG treatment) STIM1 signatures are quite clearly visible, mostly because the proteins are aggregated in small clusters of various dimensions (arrows in Fig. 4 A, C, and E). In cells exposed to DMSO, the STIM1 extensions between ER and PM are narrower and more uniform in size (Fig. 4 B, D, and F). If the smallest of these strands (Fig. 4F, small arrowheads) represents either a single STIM1 molecule or a dimer, then the larger groups contain many STIM1 molecules. This clustering depends on store depletion by TG, but it does not require ER-ER or ER-PM apposition, because it is clearly visible on the free surface of ER in TG-treated cells (Fig. 3B, between arrows).
We conclude that extension of overexpressed STIM1 over the surface of ER is independent of TG-induced store depletion, but aggregation of STIM1 into clusters of variable size is dependent on it. Large-scale STIM1 rearrangements are not induced by glutaraldehyde fixation and Ca2+ store release does not occur within the 1 min needed for protein immobilization (Figs. S2 and S3 and Movies S1 and S2; also see ref. 22).
Fig. S2.

Preservation of Orai1 and STIM1 localization and Ca2+ store integrity by glutaraldehyde (Glut) fixation. (A–I) TIRF microscopy was used to assess the degree of fixation-induced redistribution STIM1 and Orai1 in transfected HEK 293A cells. Changes in STIM1 brightness and distribution would indicate movement of STIM1 toward and engagement with the PM, initial steps in SOCE. Clustering of Orai1 into puncta would indicate participation in a later step in SOCE. Images were acquired 1 min before fixation (A, D, and G) and both 1 min (B, E, and H) and 9 min (C, F, and I) after addition of 0.1% glutaraldehyde. A–C are EGFP-Orai1, D–F are mCherrry-STIM1, and G–I are background-subtracted and enlarged images of mCherry-STIM1 taken from the regions indicated by the red squares in D, E, and F, respectively. The consistency of STIM1 and Orai1 distributions before and after fixation indicate that 0.1% glutaraldehyde does not induce protein redistributions that accompany SOCE. Images were produced by averaging 10 consecutive image frames taken at one frame per 5 s. The asterisk in F indicates a cell displaying glutaraldehyde-induced fluorescence. The scale bar in A is 20 μm and applies to A–F. The scale bar in G is 5 μm and applies to G–I. (J) Ca2+ imaging was used to measure loss of Ca2+ from internal stores in response to fixation. Time courses of internal Ca2+ concentration of HEK 293A cells transfected with Orai1 and STIM1 and fixed with 0.1% glutaraldehyde are shown. The black trace corresponds to cells (n = 14) treated with 2 µM ionomycin in 0 Ca Ringer solution to deplete internal Ca2+ stores before fixation, whereas the red trace corresponds to cells (n = 30) fixed directly without ionomycin treatment. Traces were aligned by the time of glutaraldehyde addition, and the arrow indicates 1 min after glutaraldehyde addition. Note that glutaraldehyde addition to cells without internal calcium stores leads to a progressive autofluorescence-induced increase in the ratio of emission when excited at 340 nm/380 nm. When Fura-2 responses are calibrated, this autofluorescence is “read-out” as an apparent increase in [Ca2+]in. Within the ∼1 min required to fix cells, there is no difference in the plotted [Ca2+]in between store-depleted and store-replete cells. This indicates that fixation does not release Ca2+ from internal stores before cellular structures are immobilized.
Fig. S3.

Redistribution of STIM1 and Orai1 in response to store depletion by TG. (A–L) TIRF microscopy was used to document store depletion-induced redistribution of STIM1 and Orai1 in transfected HEK 293A cells. These images serve as a point of comparison for possible fixation-induced redistribution of STIM1 and Orai1. Images were acquired 0.5 min before fixation (A, E, and I) and 1.5 min (B, F, and J), 2.5 min (C, G, and K), and 3.5 min (D, H, and L) after addition of 2 µM TG. A–D are mCherry-Orai1, E–H are EYFP-STIM1, and I–L are background-subtracted and enlarged images of EYFP-STIM1 taken from the regions indicated by the red squares in E–H, respectively. Note the increase in EYFP-STIM1 fluorescence in H and L attributable to movement of STIM1 toward the basal PM and into the evanescent TIRF light field. Images were produced by averaging 10 consecutive image frames taken at one frame per 5 s The scale bar in A is 20 μm and applies to A–H. The scale bar in I is 5 μm and applies to I–L. (M) Time course of EYFP-STIM1 and mCherry-Orai1 movement into puncta. Fluorescence of EYFP-STIM1 and mCherry-Orai1 at the sites of puncta formation was measured and plotted versus time after 2 µM TG addition. The green trace indicates EYFP-STIM1, and the red trace indicates mCherry-Orai1. Fluorescence values were normalized to the range of final minus initial fluorescence. Note that EYFP-STIM1 arrival at puncta precedes mCherry-Orai1.
Frequency and extent of JCs.
Because STIM1-Orai1 interactions occur at the outer edge of the cell where the two molecules come into a direct molecular interface, we focused on quantitative assessment of JC sizes ignoring the internal ER-ER junctions. The extent of JC formation was determined by the ratio of total length of cisternae profiles to the overall cell perimeter. A first set of images was collected from random sections of cells exposed either to TG or DMSO and pelleted before fixation (Materials and Methods). To exclude untransfected cells from the data, images were collected from only cells that showed more than one very small coupling along their periphery. The sample consisted of more than 100 cells (Table S1). Data from individual cells vary quite widely for two reasons: first, of course, the level of expression is not equal between cells; second, the distribution of JCs is not random within each cell. Nonetheless, sufficiently large samples show two clear trends, with only one out of six samples being at variance (Table S1). One trend is that the concentration of STIM1 DNA to which the cells were exposed affects the extent of JC formation. Cells from two sets of experiments with the highest STIM1 DNA concentration have the highest percentage of JC-occupied PM. This finding is not surprising because it is an expected consequence of the high frequency of ER profiles in the cell. The second trend in these data are that, with the exception of one set of cells treated with very low concentrations of STIM1 DNA, the extent of JC formation is not affected either by TG treatment preceding the fixation or by the presence or absence of coexpressed Orai1. Under the conditions used in this initial set of observations, based on cells fixed after pelleting, the extent of JC formation is the same in DMSO and TG treated cells.
Table S1.
Extent of close association between ER elements and PM (JCs) in cells fixed as a pellet
| STIM1 DNA level /treatment | No. of experiments | Total no. of cells | Cell perimeter occupied by JCs, mean ± SD% |
| High STIM1 | 2 | 27 | 61.3 ± 21.8 |
| STIM1/TG | |||
| High STIM1 | 2 | 27 | 56.9 ± 25.5 |
| STIM1/DMSO | |||
| Medium STIM1 | 3 | 27 | 23.9 ± 15.5 |
| STIM1/Orai1/TG | |||
| Medium STIM1 | 3 | 27 | 29.2 ± 16.5 |
| STIM1/Orai1/DMSO | |||
| Low STIM1 | 2 | 15 | 47.2 ± 20.2 |
| STIM1/TG | |||
| Low STIM1 | 2 | 18 | 24.0 ± 17.1 |
| STIM1/DMSO |
High STIM1, 4 µg of DNA; medium STIM1, 2.67 µg of DNA; low STIM1, 1.33–1.67 µg of DNA.
The extent of JC in fixed cells is affected by the rapidity of fixation.
The apparent lack of effect of either ER Ca2+ depletion or presence of overexpressed Orai1 on the extent and appearance of ER-PM associations was surprising, given the current hypothesis that ER Ca2+ depletion and STIM1/Orai1 interactions are necessary for extensive JC formation. One immediate question is what role fixation plays in the final disposition of membranes. The cells fixed as a pellet were not exposed uniformly and/or rapidly to the fixative. Cells deep in the pellet were reached by the fixative more slowly than those at the surface and final structural immobilization was not immediate. An initial rough comparison of superficial versus deep cells in the pellet indicated a higher frequency of JCs in the deep cells. This warranted a further more detailed analysis. In a new set of experiments, we fixed the cells while in suspension, so they were all equally and rapidly exposed to the fixative, and we compared the effect of two different fixative solutions (Materials and Methods). A “slow” fixative, 0.1% glutaraldehyde, was designed to allow movement of organelles for a period before final immobilization by cross-linking, whereas a “fast” fixative, 6% (wt/vol) paraformaldehyde (PFA) plus 4% (wt/vol) glutaraldehyde, immobilized organelles within a very brief period. The combined results from two separate sets of experiments were highly revealing (Table S2): in cells treated with TG, the type of fixation did not affect the frequency of JCs, but in DMSO-treated cells, the rapid fixation showed a paucity of JCs, whereas the slow fixation resulted in a frequency and extent of ER-PM contacts similar to those generated by the TG treatment.
Table S2.
Effect of fixation procedure on extent of JC formation
| STIM1 level DNA/treatment | No. of experiments | Fixation | Total no. of cells | Cell perimeter occupied by JCs, mean ± SD% |
| Low STIM1 | 2 | Slow fixation | 28 | 18 ± 13 |
| STIM1/Orai1/TG | ||||
| Low STIM1 | 2 | Fast fixation | 23 | 20 ± 14 |
| STIM1/Orai1/TG | ||||
| Low STIM1 | 2 | Slow fixation | 22 | 17 ± 10 |
| STIM1/Orai1/DMSO | ||||
| Low STIM1 | 2 | Fast fixation | 28 | 7 ± 6 |
| STIM1/Orai1/DMSO |
All cells came from the same set of transfections. Low STIM1, 1.33–1.67 µg of DNA.
Essentially, in cells treated with TG, a large fraction of STIM1-bearing ER is prepositioned in close proximity to the PM, so that the frequency and extent of JCs in images of fixed cells are independent of fixation rate. In DMSO-treated cells, on the other hand, relatively few ER elements are close enough to the PM to be immobilized into a JC during the brief (fast) fixation time; however, a significantly greater region of the ER became located close to the PM and could be cross-linked to it during the slow fixation period.
Subcortical microtubules are abundant in the transfected cells.
A noticeable component of STIM1-transfected cells is a network of microtubules mostly located in the cortical region of the cell and mostly parallel to the PM, as previously noted by (20) (compare Fig. 5 A and B with Fig. 5 C–F). Radially arranged microtubules ranging from deep to peripheral layers of the cell are rare in interphase cells from our samples. Extensive close associations of microtubules are particularly visible in the peripheral cytoplasm of STIM1-overexpressing cells (Fig. 5 C and D). Importantly, the newly developed ER elements that are induced as a result of STIM1 overexpression are closely associated with numerous microtubules (Fig. 5 E and F). The microtubule tracks are most likely responsible for the positioning of STIM1-coated ER elements in the cells’ cortex and at the cells’ edges. Indeed, STIM1 acts as a motile protein in association with microtubules (23).
Fig. 5.

Organization of peripheral microtubules in cells transfected with STIM1. Thin sections at the periphery of EV/DMSO (A),EV/TG (B), STIM1/Orai1/TG (C and D), and STIM1/DMSO (E and F) cells. In all cells, microtubule tracks (highlighted in green) run mostly parallel to the cell surface. E and F show abundant flat cisternae of peripheral ER in close association with microtubules. This is seen in TG-treated as well as in DMSO-treated cells (shown here). (Scale bars: A–E, 250 nm; F, 100 nm.)
Direct Visualization of Orai1 Channel Positioning by Freeze–Fracture of Transfected Cells.
Distribution of Orai1 in the absence of store depletion.
We sought to accurately map the position of individual Orai1 channels in the PM using freeze–fracture EM. As in all cells, the PM of HEK 293A cells is occupied by a large variety of intramembrane proteins that are revealed by the freeze–fracture technique as randomly distributed “particles” of varied heights and diameters. Identification of an individual particle with a single molecular species is directly possible from the images only when the protein is specifically clustered and/or present at high concentrations. The latter is the case in cells overexpressing Orai1, with or without coexpression of STIM1, and treated with DMSO, so that the ER is not depleted of Ca2+. In these cells, some areas of the PM are populated by an unusually high concentration of new particles distributed over extended portions of the surface (Fig. 6). No distinct borders mark the transition between crowded areas and the rest of the membrane (e.g., along a diagonal line in Fig. 6B); indeed, the channels seem to be free to diffuse away from the borders of the large patches.
Fig. 6.

Freeze–fracture images of the PM of Orai1-transfected cells. (A) Overexpression of only Orai1 channels. (B) Overexpression of both STIM1 and Orai1. Note a very high density of particles with apparently uniform size and shape (presumably the overexpressed Orai channels) mixed with native particles of variable size and shape. The edge of the densely occupied region in B runs approximately along the diagonal from upper left to lower right corners, showing the uneven distribution of particles at the border. (Scale bars: 100 nm.)
Criteria for the identification of Orai1 channels.
Particles within the characteristically crowded regions were sorted into classes based upon the size, shape, and pattern of platinum shadows and highlights (Fig. 7). A comparison of particles between either sparse areas of the PM in transfected cells or random areas of PM in untransfected cells (Fig. 7A) and crowded areas (Fig. 7B) shows that in the latter, there is a family of “selected” particles with fairly uniform height (indicated by the length of the platinum-free “shadow”) and diameter (measured at right angle to the platinum shadow).
Fig. 7.

Classification of intramembrane particles in Orai1-transfected cells. The distributions of intramembrane particles were compared between a region of a STIM1/Orai1/TG cell exhibiting a cluster of similar and apparently exogenous particles (B) and a representative region from the PM of an untransfected cell (A). A visual selection akin to correspondence analysis reveals a well-represented population of selected particles with common characteristics in the particle cluster of the STIM1/Orai1/TG cell (shown at the top of B). Particles with a similar appearance are far fewer in the untransfected cells (at the top in A), so the selected particles represent an additional population with common features and can be identified as Orai1 channels. All Orai1-overexpressing cells present areas containing additional particles with common characteristics (compare Figs. 6, 8, and 9).
In the absence of ER Ca2+ depletion, the overall particle density is higher in the areas where a crowded structure is detected by eye (2,601 ± 512/µm2; n = 5 experimental samples of STIM1/Orai1 DMSO cells) than in other areas of the same cells (1,704 ± 386/µm2). The density of selected particles in the crowded areas is 808 ± 187/µm2 and 687 ± 202/µm2 in STIM1/Orai1/DMSO and Orai1/DMSO cells, representing 31% and 34%, respectively, of all particles in the same areas. Untransfected cells had a much lower density and percentage of selected particles (193 ± 91/µm2; 12% of total). The differences are statistically significant (selected particles count: Student’s t test, P < 0.001 for both STIM1/Orai1/DMSO and Orai1/DMSO compared with EV; selected particles percentage: χ2 test, P < 0.001 for the two transfected samples against EV). The groupings of selected particles are often very large in the Orai1 cells, covering an area of 4 µm2 or more and involving several hundred putative Orai1 channels with the same freeze–fracture profile.
Distribution of Orai1 following TG-induced store depletion.
In cells coexpressing STIM1 and Orai1, but not in cells expressing Orai1 only, TG treatment results in a dramatic clustering of selected (presumptive Orai1) particles. Three significant details differentiate these clusters of selected particles from the more diffuse areas encountered in the cells treated with DMSO. First, the particles are located over flat or very slightly domed patches of membrane that are raised by a small distance above the level of the remaining membrane, as indicated by a denser platinum shadow on one side of the patch, a corresponding lack of platinum on the opposite side, and a uniform layer of platinum over the rest of the patch (Fig. 8 A and B). The platforms are generated by the position of ER elements in JCs just under the PM, which appear to push the PM slightly outward (Fig. S1 and compare with Figs. 2 and 4) and are present in all STIM1-overexpressing cells regardless of treatment. A second feature is the sharp border of each patch separating areas with a high density of selected particles from adjacent areas with random particles (Fig. 8 B and C). A third feature is the high relative density of selected particles (Fig. 8 B and C). The density of all particles in the patches is significantly higher than in adjacent areas (2,564 ± 443/µm2 versus 1,658 ± 551/µm2 from 11 areas, each in different experimental cells; P = 0.0004). The density of selected particles within the patches is 1,302 ± 309/µm2 (three experiments, 11 images) accounting for 51% of all particles, a considerably higher percentage than in the crowded areas of DMSO-treated cells (31%). Overall, the effect is consistent with the migration of Orai1 channels from a larger area into a smaller patch of membrane and with their trapping within the patch, which is located over a raised, flat mound. We conclude that Orai1 channel patches are formed over JCs.
Fig. 8.

Orai1 clustering in STIM1/Orai1/TG cells. (A) Several clusters. (B and C) Examples of individual clusters at increasing magnifications. Orai1 channels (as defined in Figs. 6 and 7) accumulate at high density over patches of PM, leaving only native particles in the adjacent membrane areas. Note the sharply delimited edges and the raised position of the patches relative to the rest of the membrane. Although clustered, the channels are not tightly packed, supposedly because they are associated with the underlying STIM1 protein. Similar clustering is extremely rare in STIM1/Orai1/DMSO cells, even where the overall density of Orai1 channels is very high (compare with Fig. 6). (Scale bars: A and B, 100 nm; C, 50 nm.)
The clustering effect is uniquely and consistently detected in cells that express sufficient levels of STIM1 and Orai1 and that have been exposed to TG. In the same cells exposed to DMSO, Orai1 clustering was very rarely detected (in two to three cells in this whole survey), and the edges of the clusters in this case were not as sharply defined as those in the TG-treated cells. In the absence of STIM1 overexpression, even when Orai1 particles are densely expressed in the PM, segregation into discrete clusters never occurs.
The size of clustered particle patches (corresponding to Orai1 foci or puncta, as detected by light microscopy) varies greatly in the range of 0.011–0.46 µm2. At the average density of 1,302 particles/µm2 given above, the smallest and biggest patches contain 14 and 595 selected particles, respectively. The majority of patches fall into a middle range (200–300 particles), but the larger patches are not infrequent. The frequency of foci is also quite variable even within adjacent areas of the same cell. Some areas have sprinkles of 5–10 closely spaced small foci; others contain a single focus, mostly of the larger size, within an area of several square microns.
Particle distribution derived from overexpression of a channel that cannot interact with STIM1.
Expression of L273D Orai1 (24), which lacks the primary high-affinity binding site for STIM1, offered the opportunity to assess the state of expressed Orai1 in the absence of a link to STIM1. Images from the freeze–fractured PM of L273D were slightly more difficult to analyze than those described above, because the channels were inserted in the PM at lower densities, so the background of native particles was relatively more prominent (Fig. 9A). Nonetheless, it was possible to identify a set of selected particles with common characteristics shown in the panel at lower left in Fig. 9. Furthermore, when the majority of particles not belonging to the selected category were hidden by gray circles in Fig. 9B, the remaining image was quite different from the example “native” particle distribution shown in Fig. 9D, indicating that the selected particles constitute an addition to the native population of particles. Conversely, hiding the selected particles in Fig. 9C leaves behind a particle distribution that is quite similar to the native one. Thus, based on two criteria, shape similarity and evidence that they constitute an additional population, the selected particles represent L273D channels. As expected, the mutated Orai1 channels in Orai1 L273D/STIM1/TG cells do not cluster into tight patches, although obvious mounds in the cell surface showing the presence of JCs are visible (Fig. S1).
Fig. 9.

L273D Orai1, a mutant that does not interact with STIM1, forms a set of particles similar to WT Orai1. (A) Expression levels of the mutated L273D Orai channel in L273D DMSO cells are lower than for Orai1, so the images show a larger proportion of native proteins between the expressed channels relative to Fig. 6. A homogeneous population of selected particles similar to those identified in Orai1 channel expression can be identified (lower left image; compare with Fig. 7). (B and C) Same area as A (or a portion of it), but in B, the particles constituting the random population are hidden under gray circles, whereas in C, the population of selected particles is similarly eliminated. B, in which only the selected particles are visible, is clearly different from D, an image of native particles from another cell area. On the other hand, hiding the population of selected particles leaves behind a varied population that mimics very well the native configuration (compare C and D). Thus, the selected particles are an additional set superimposed on the native population. (Scale bar: A–D, 100 nm).
Size of Orai1 freeze–fracture particles under different conditions.
We determined the size of selected particles, contained within particle-rich patches and constituting putative Orai1 channels as defined above, by measuring the diameter at right angle to the direction of shadowing. Particle sizes were assessed under four different conditions. In cells that either expressed Orai1 only (Fig. 6A) or both STIM1 and Orai1 (Fig. 6B) and were treated with DMSO, the average diameters were 7.7 ± 0.7 and 7.6 ± 0.6 nm, respectively (n = 40 particles); the two means are not statistically different (P = 0.5). The average diameter of easily identified selected particles within the sharply delimited patches in STIM1/Orai1 cells treated with TG (Fig. 7B and 8 A–C) was 7.6 ± 0.7 nm (n = 45), and it was not statistically different from the Orai1/DMSO values (P = 0.6). Finally, the size of L273D particles was 7.9 ± 1.1 nm (n = 40), not significantly different from STIM1/Orai1/TG particles (P = 0.1). The size of putative Orai1 channels’ particles is quite similar to but slightly smaller than the size of freeze–fracture particles positively identified as voltage-gated Ca2+ channels (CaV1.1 and CaV1.2) in skeletal and cardiac muscle cells (25, 26).
Patterning of Orai1 and STIM1 at ER-PM junctions.
The arrangement of Orai1 and STIM1 proteins at ER-PM junctions in STIM1/Orai1/TG cells can provide clues to the assembly of these structures and the molecular mechanisms underlying gating. Overall, the arrangement of Orai1 channels in freeze–fracture images of puncta is substantially unstructured. However, we noted that although the spacing between Orai1 channels may seem random; in fact, a specific arrangement of the channels into pairs and short chains is detected (Fig. 10 A–D). The spacing between channels was documented by imposing standard rulers of 15 and 9 nm upon the gaps between channel pairs or groups (Fig. 10 E–H). Puncta with a low density of channels exhibited sporadic groups with a center-to-center spacing of ∼15 nm (Fig. 10E). At higher densities, the presence of channels consistently spaced at ∼15 nm was more pronounced (Fig. 10 F and G). Channels spaced more closely at ∼9–10 nm were also detected (Fig. 10H).
Fig. 10.

Spacing of Orai1 and STIM1 at ER-PM junctions of STIM1/Orai1/TG cells. Freeze–fracture images of Orai1 channels in puncta with a low density (A) and high density (B–D) of Orai1 channels. (E–H) Images corresponding to A–D in which the center-to-center distance between selected pairs of Orai1 channels has been labeled with standard rulers of 9 nm (blue line segments) or 15 nm (green line segments). (I) Histogram of the distance to the second-closest particle for a representative punctum (n = 380 particles). The curve corresponds to a nonlinear fit to the sum of two Gaussian functions. (J) Histogram of the distance to the second-closest particle for an equal number of random particles from Monte Carlo simulation corresponding to the region of interest from I, which Includes the combined distances from three separate simulations (n = 1140 particles). (K) Histogram of the distance to the closest particle for the punctum with the greatest fraction of touching particles (n = 380 particles). The arrow indicates the subset of touching particles. (L) Histogram of internal angles between the closest and second-closest particle. Angles from all particles of five puncta were combined (n = 2,286 particles). (M) ER-PM junction showing clusters of STIM1 molecules (arrowheads). Beneath the junction are freeze–fracture images of Orai1 channel groups from puncta shown at the same scale. The sizes refer to the range of distances between adjacent STIM1 clusters. (Scale bar: A–H and M, 50 nm.)
To measure the typical spacing between channels more systematically, we developed an analysis in which the distances from a given particle to its neighbors were ranked. Based upon examination of our images, we concluded that the distance to the second-closest particle was a good measure of this typical spacing. Implicit in this approach is the requirement that most particles in puncta need to be included; otherwise, the results will be skewed by empty spaces surrounding some particles. This precluded selecting and analyzing just the subset of selected particles corresponding to classified Orai1 channels. Instead, we chose to analyze the spacing between essentially all of the particles in a punctum. We reasoned that, for statistical testing, patterning of the predominant particle population consisting of Orai1 channels will lead to detectable changes in quantitative measures calculated from all particles in a punctum, even if the population is not pure.
Five puncta with the clearest and most consistent particle appearance were chosen for analysis, ranging from 0.3–0.6 µm in diameter, 218–578 particles, and 2,227–2,933 particles/µm2. Particle position was determined in an automated fashion, and interparticle distances were ranked. The typical spacing was 15.4 ± 0.6 nm (n = 5 puncta) with an average SD of 2.3 nm. This is similar to the spacing detected by imposing standard rulers on images of particles, suggesting that analyzing every particle yields spacing measurements similar to those taken for Orai1 channels. The fraction of particles in a punctum within 2 nm of typical spacing ranged from 35% to 57%.
Because many particle spacings were clustered at ∼15 nm, we wondered whether particles were positioned and spaced randomly or whether there was a cellular mechanism responsible for particle spacing. We assessed this question using sets of pseudorandomly positioned simulated particles (Monte Carlo analysis). In three of five puncta, the fraction of particles exhibiting typical spacing (∼15 nm) was greater than in the simulated populations, and this difference was significant (P = 0.0014, 0.0018, and 0.0002, respectively; Fisher’s exact test; compare Fig. 10 I and J). In the other two puncta, the differences were not significant (P = 0.36 and 0.28, respectively; Fisher’s exact test). Significant deviations from random controls are consistent with the presence of a cellular mechanism responsible for particle spacing.
Our automated analysis of particle position and spacing enabled other aspects of patterning to be examined. The mean distance to the nearest particle was 12.9 ± 0.05 nm (n = 5 puncta). In two puncta, particles in a discrete subset were closer together (for example, see Fig. 10K). These correspond to particles that touch (Discussion), and their Gaussian mean spacing was 9.3 nm. Touching particles were infrequent, occurring for at most 9 ± 3% (SD) of particles in a punctum. The distance between touching particles was confirmed by measuring the center-to-center distance of pairs of closely spaced, manually identified selected particles. Both STIM1/Orai1/TG and Orai1/DMSO cells were examined; the average spacing turned out to be the same in both cases (9.9 ± 1.4 and 9.9 ± 1.4 nm, from 24 and 25 images, 100 particle couples) and comparable to 9.3 nm produced by automated analysis.
In addition, automated analysis of particle position enabled the angles between particles to be assessed. Consistent angles between groups of channels were not detected. The distribution of internal angles formed by the closest to second-closest particles was dispersed, without evidence for clustering at angles indicative of regular packing (60°, 90°, or 120°), although small angles were occluded because of particle crowding (Fig. 10L).
To assess the correspondence between the patterning of STIM1 clusters and Orai1 particles, we combined images from thin sections and freeze–fracture at the same magnification into a single figure (Fig. 10M). Several small sets of Orai1 FF particles copied from the image of a punctum, such as shown in Fig. 8, are superimposed on the image of a JC with candidate STIM1 signatures from a thin section, such as shown in Fig. 4 A, C, and E. Both are from STIM1/Orai1/TG cells. Clearly, a single Orai1 particle subtends a complete small STIM1 cluster, but it is not sufficiently large to cover two clusters, thus establishing an approximate 1:1 relationship between Orai1 channels and small STIM1 clusters. Because each STIM1 cluster is composed of several molecules, this also indicates that a single Orai1 channel interacts with several STIM1 molecules. Evenly spaced STIM1 clusters were observed, and the spacing between them (13–18 nm) is similar to the spacing between Orai1 channels.
Discussion
In this investigation, we use EM to identify individual molecules and clusters of STIM1 and Orai1 and to uncover their organization at the nanometer scale. This high-resolution view depends upon appropriate fixation. Glutaraldehyde is the fixative of choice for EM because it maintains structural rigidity of proteins and protein complexes (27). Immobilization of organelles and molecules is not immediate; it depends on diffusion of glutaraldehyde into the cell and subsequent cross-linking (28). At the concentrations mostly used in this project, immobilization is expected to occur between ∼9 and 30 s (22), which is on the same time scale as reorganization of key proteins and membranes involved in activation of SOCE. We found that even low concentrations of glutaraldehyde (0.1%) did not induce STIM1 puncta formation or Ca2+ release (Fig. S2), unlike formaldehyde (4%) (29).
STIM1 is an ER transmembrane protein with a long, substantially α-helical cytosolic domain ending in a polybasic C-terminal membrane-binding domain (15, 18, 30). Overexpression of STIM1 in HEK 293A cells, particularly at high levels and independently of store depletion, induces three structural changes: the formation of extensive ER elements; the insertion of STIM1 in the ER membrane, where it extends from the cytoplasmic surface; and a specific association of ER elements to each other and to the PM, across a narrow gap of uniform width. Stacking of ER elements was detected in a previous EM study (20), although not as extensively as here. At the highest levels of STIM1 expression, these subcellular structures were observed together with extensive and sometimes array-like associations of ER membranes in the cytosol.
Images of STIM1-expressing cells document the redistribution of internal membrane systems and attest to the specificity of STIM1 molecular associations. ER-ER associations probably depend on STIM1-STIM1 interactions through their cytoplasmic domains. However, even at the highest level of expression, ER association was observed with the PM but not with mitochondria and the nuclear envelope, although the outer membrane of the latter is in continuity with ER membranes. This finding reveals a previously unknown selectivity in STIM1 membrane association that might be tied to affinity for phosphatidylinositol 4,5-bisphosphate (31) or protein assemblies (32). More unclear are the mechanisms by which STIM1 expression leads to ER proliferation, which obviously requires new lipid synthesis.
Because glutaraldehyde was not found to induce ER migration to the PM, extensive JCs in STIM1-expressing cells demonstrate the presence of ER elements in close proximity to the PM at the moment of cross-linking. To account for this, we hypothesize that regions of the ER constantly extend toward the periphery, where they come into contact with the PM. These contacts are typically transient unless either cellular mechanisms or cross-linking by the fixative are engaged to stabilize them. In the case of SOCE in live cells, store depletion-dependent Ca2+ unbinding, oligomerization, and translocation of STIM1 to JCs lead to STIM1 binding to Orai1 channels in the PM and puncta formation (14, 15). The increased extent of PM occupancy by JCs after TG is in complete agreement with increased frequency and extent of JCs shown by ref. 13, and this finding is independent of fixation protocol. By contrast, we envision that the presence of STIM1 in slowly fixed cells allows the ER to be slowly, progressively, and irreversibly “pinned” to the PM. STIM1 extensions over the ER surface facilitate the glutaraldehyde-based cross-linking of ER to PM by providing the necessary protein linkage. In DMSO-treated cells, this process must occur in the absence of bulk movement of STIM1, as shown in Fig. S2, and so instead must involve a small number of widely spaced STIM1 molecules spanning the ER-PM divide. Indeed, in all STIM1 cells, we observe candidate signatures of clearly separated, individual STIM1 molecules all over the ER membrane, and these are present at ER-PM junctions after DMSO treatment, as predicted by this model (Fig. 4 B, D, and F).
Transmission EM signatures of STIM1 molecules were found extending from the cytoplasmic ER surface in a variety of contexts and exhibited expected changes upon overexpression and store depletion. We conclude that these structures correspond to STIM1 molecules in various states of assembly. These images of STIM1 proteins at nanometer resolution in a cellular context provide direct visual confirmation of STIM1 oligomerization. The presence of STIM1 extensions over the cytoplasmic surface of the ER is independent of store depletion, but the disposition of STIM1 is clearly affected by it. In resting cells treated with DMSO, STIM1 extensions are diffuse and without sign of aggregation. Thin STIM1 protein complexes, containing at most a few individual subunits, are seen. Treatment with TG induces a striking change in STIM1 organization; the proteins cluster into small aggregates rather than being dispersed along the ER membrane.
In addition, STIM1 was found to extend from ER membranes to different extents. A more compact form extended roughly 12–14 nm from the ER membrane, whereas clusters possessing more extended conformations reached up to 27 nm, suggesting that intact STIM1 may exhibit more extended conformations, as indicated by structural studies of STIM1 fragments (33, 34). Our measured gap size for ER-PM JCs is narrower than the ∼17 nm reported in Wu et al. (13), most likely because of differences in identifying the real edges of the membrane. Contrary to Chang et al. (35), we find that gaps in ER-PM JCs are either equal in DMSO- and TG-treated cells or slightly larger in the latter. The reason for the discrepancy is likely attributable to the unavoidable shrinkage that accompanies the various preparative procedures. The shrinkage is most likely to affect the gaps in DMSO cells, where STIM1 is more diffuse than STIM1 in TG cells, where the aggregated STIM1 would offer more resistance.
Overexpression of Orai1 led to the appearance of a set of particles with distinct and consistent characteristics in freeze–fracture images of the PM. These particles were found to redistribute to restricted domains in the PM upon store depletion. We conclude that they correspond to individual Orai1 channels. We are unable to ascertain channel stoichiometry in these images; however, their size is consistent across a variety of treatments, including store depletion, coexpression with STIM1, and a mutation affecting STIM1 association. Therefore, we find no evidence for changes in stoichiometry of channels expressed at high levels in cells. However, the closed state crystal structure of Drosophila Orai shows a hexamer consisting of a trimer of dimers (36), and dimers of recently synthesized Orai have been observed by photobleaching of tagged GFP (29, 37). We propose that an immature dimeric state may exist briefly in the PM before assembly into tetramers and, ultimately, hexamers. We note that our Orai1 constructs lack the 5′ and 3′ untranslated sequences from Orai1, are fused to EFGP at the N terminus, and possess a strong translational initiation site. Therefore, these constructs are not expected to produce truncated Orai1 polypeptides initiated internally at methionine 64 of Orai1 (38) that might lead to a mixed population of Orai1 channels.
In resting cells not challenged by TG, presumptive Orai1 particles cover extensive areas of the membrane, and the ragged edges of the overexpressing areas suggest that the particles are freely moving within the membrane until immobilized by the fixative. Coexpression with STIM1 rarely affects the disposition of Orai1 in resting cells, presumably because the resting STIM1 molecules in a diffuse configuration do not induce Orai1 clustering. In contrast, Orai1 particles redistribute dramatically in STIM1/Orai1 cells following TG treatment. The Orai1 particles are grouped into large patches containing a variable number (tens to hundreds) of channels. The patches are sharply delimited indicating widespread restriction of channels to areas that cover a slightly raised patch of membrane presumably corresponding to the position of JCs. The membrane adjacent to the patches is seemingly swept free of presumptive Orai1, and nearly all channels in the surface of the affected cells are contained within tight patches.
Recent work using live-cell imaging at the single-molecule level has identified two mechanisms involved in Orai1 targeting to and maintenance at STIM1 puncta: diffusion traps and corrals (16). Local molecular constraints on Orai1 channel mobility may involve identified STIM1- or Orai1-interacting proteins such as CRACR2 (39), septins (40), and SARAF (41), as well as other molecules that localize to ER-PM junctions such as junctophilins (42, 43) and extended synaptotagmins (35, 44); however, unresolved details include cellular partners, regulation, timing, coordination, and relative importance. Our observations reinforce live imaging studies and place limits on models of Orai1 localization. Orai1 channels in STIM1-expressing cells in the absence of ER store depletion are located at high density over large areas of the PM, but the channels are not aggregated into puncta. The ragged edges of these high density areas suggest that the movement of Orai1 in the membrane is not restrained. This finding indicates that although transient STIM1-Orai1 interactions are likely to occur at JCs when both proteins are at high densities, these interactions are weak. After ER store depletion, regions of the PM adjacent to puncta are almost devoid of Orai1 channels, indicating that the STIM1-Orai1 binding interaction is strong. If a physical barrier (corral) for Orai1 exists, our freeze–fracture images show that it does not extend into the plane of the PM. We note that STIM1 and Orai1 could be retained at ER-PM junctions by mutual tethering, which may serve as a means to “corral” these proteins, as proposed in Wu et al. (16).
The ability to classify and count nearly every protein complex in the membrane allowed us to determine the density of Orai1 channels in puncta. In HEK 293A cells transfected with STIM1 and Orai1, puncta formed after ER store depletion are composed of at least 50% particles classified as Orai1 channels. We expect that the percentage is much higher, because channels may have been fragmented in fracturing and the smaller, resulting particle would not be classified as Orai1. Regardless, membrane proteins other than Orai1 channels are apparently captured in puncta, although no other class of particle was consistently detected and abundant. Puncta varied in size in transfected cells. However, if ER-PM junctions in unperturbed cells in vivo possessed the average size (273 × 176 nm) seen using the MAPPER construct (35), the number of channels in a punctum would be about 50–100 as long as the density was similar. Because puncta are fundamental subcellular units of Ca2+ influx through Orai1 channels, the number of channels, as well as their conductance and open state probability, are significant parameters that define a basic unit of Ca2+ signaling in the cell.
Orai1 channels were visualized as particles projecting out of the cytoplasmic leaflet of freeze–fractured membranes. Considering the addition of platinum shadow, the ∼7.6 nm diameter of these particles is comparable to the 6 nm diameter of the Drosophila Orai crystal structure (36) at the external surface of the PM. The minimum distance between closely apposed particles (∼9.9 nm) is equivalent to the diameter of the cytoplasmic face of Orai1 (∼9.6 nm between opposing M4 extension segments) (17, 18), and so at this distance, channels should be in contact at their cytoplasmic side. Nearest-neighbor measurements in puncta yielded a similar value (∼9.3 nm). STIM1/Orai1/TG and Orai1/DMSO cells exhibited the same close spacing between Orai1 channels, indicating that STIM1 is not required for Orai1 channels to touch.
A limited number of discrete STIM1 clusters were observed in thin section in STIM1/Orai1/TG cells. In these cases, cluster size was consistent, indicating that they are composed of similar numbers of molecules and thus supporting the existence of a discrete molecular structure. The diameter at the PM and the spacing between these STIM1 clusters is similar to the respective diameter and spacing of Orai1 channels in freeze–fracture. The simplest interpretation is that one STIM1 cluster binds directly and exclusively to one Orai1 channel and opens it. We note that STIM1 clusters resemble structures found bridging ER-PM junctions in cells overexpressing junctate, although STIM1 clusters are smaller than the 20-nm diameter of presumptive junctate clusters (45).
Orai1 channels in puncta are nonrandomly spaced. This pattern may be a consequence of macromolecular crowding in the cytoplasm by extended Orai1 conformations or additional proteins associated with Orai1. Alternatively, spacing may be attributable to interactions between adjacent Orai1–STIM1 clusters. Bridging of separate STIM1 clusters, if it occurs, might allow for cooperation in gating between adjacent channels or channel groups. Our data do not rule out direct bridging of adjacent Orai1 channels by individual STIM1 clusters, which might also allow for cooperative gating.
Overall, however, the arrangement of Orai1 channels in puncta is substantially unstructured. This is likely a consequence of channel mobility. STIM1 and Orai1 diffuse at similar rates in puncta, and it has been suggested that they might diffuse together as a complex (16). Our observation that STIM1 clusters in puncta might possess a discrete molecular structure, and that one STIM1 cluster is well suited to binding and opening one Orai1 channel, is consistent with this model.
In summary, these first EM images of STIM1 and Orai1 confirm basic aspects of their function: oligomerization of STIM1 upon store depletion and precise targeting of Orai1 to puncta. They also reveal a previously unknown selectivity in STIM1 membrane association, multiple conformations of STIM1, stability of Orai1 channel stoichiometry, and active spacing of Orai1 channels in puncta. The sizes, densities, and membrane organization depicted in these EM images will constrain, and hopefully guide, the development of structural and functional models for STIM1 and Orai1 at ER-PM junctions.
Materials and Methods
Cells and Transfection.
HEK 293A cells (Life Technologies) were maintained in Dulbecco’s modified Eagle medium (Lonza) supplemented with 10% (vol/vol) FCS (Omega Scientific) and 2 mM l-glutamine (Sigma). Cells were transfected with Lipofectamine 2000 (Life Technologies) or BioT (Bioland Scientific) and harvested with PBS-EDTA 48 h later. Human Orai1 (hOrai1) and STIM1 (hSTIM1) were cloned into pEGFP-C2 and myc-pCI vectors (46); pEGFP-C2, a vector expressing only EGFP and not STIM1 or Orai1, was used as an empty vector control. hOrai1 mutagenesis was performed using QuikChange XL kit (Agilent Technologies), and the results were confirmed by DNA sequencing.
TG Treatment and Pellet Preparation.
All cell manipulations were performed at room temperature. Harvested cells were washed with PBS, split in two parts, and treated either with 2 µM TG or 0.02% DMSO as a control, both in “0 Ca” Ringer (SI Materials and Methods). After 5 min of incubation, cells were spun down and fixed with 3.5% (approx.) glutaraldehyde (vol/vol) diluted in PBS. Alternatively, during experiments with fast and slow fixation, cells were spun down and resuspended in 130 µM PBS, and 65 µL of suspension were transferred into a larger volume (1 mL) of either fast (6% PFA plus 4% glutaraldehyde) or slow (0.1% glutaraldehyde) fixative. After 30 min of incubation, cells were spun down and additionally treated with 3.5% glutaraldehyde.
EM.
After fixation, the cells were shipped at room temperature to the C.F.-A. laboratory. For thin-section EM, the pellets were post fixed in 2% (vol/vol) OsO4 in 0.1 M cacodylate buffer for 1 h at 4 °C, en bloc-stained with saturated uranyl acetate in H2O, and embedded in epon. Thin sections were “stained” with lead acetate. For freeze–fracture, pellets were infiltrated with 30% (vol/vol) glycerol, frozen, fractured, shadowed with platinum at 45°, and replicated with carbon. Sections and fracture replicas were examined in a Philips 410 EM (Philips Electron Optics). Images were digitally recorded with a Hamamatsu C4742-95 digital camera (Advanced Microscopy Techniques).
Image Processing and Data Analysis.
Morphometric data were obtained using Fiji (Image J; National Institutes of Health) image-processing software, and results were assessed for statistical significance by Student’s t test (for mean ± SD) or χ2 test (for percentages). Automated identification of Orai1 particles was performed using ImageJ 1.49. The background was homogenized by subtracting the image with a 10- or 20-pixel-radius Gaussian smooth, depending on the magnification. The distance to the second-closest particle, and not the closest particle, was chosen as a measure of the typical spacing for two reasons. One, this set will contain fewer instances of particles touching (and thus not actively spaced) than the distance to the closest particle. Two, interparticle distances are ranked, and so using the closest distance will lead to a systematic underestimate of the underlying spacing, because particles are typically surrounded by two to four other particles at ∼15 nm. Particles were identified by a threshold set via a mixture model, and the size range was set to ∼0.5× to 2× the area of a selected Orai1 particle. Particle distances were calculated using Microsoft Excel, and curve fitting and graphing was performed using GraphPad Prism 4.
Monte Carlo Simulations.
Pseudorandom particle positions were generated using a custom macro written for ImageJ. For each puncta, the same number of random particles and the same region of interest were used as for the actual particle measurements. Random particles included in the dataset needed to be greater than 9.9 nm from the closest particle. Distances between particles were calculated using Excel in the same manner as actual freeze–fracture particles. Multiple simulations were used, totaling at least 1,000 random particles and three iterations, and the sets of distances were combined for statistical testing. For comparing the fraction of distances that were typical, for each punctum, the predominant peak from fitting the sum of two Gaussian functions was identified. Inclusion in the typical spacing subset was ±2 nm from this Gaussian mean. Fisher’s exact test was used for statistical testing (GraphPad Prism).
SI Materials and Methods
Microscopy.
Total internal reflectance fluorescence (TIRF) imaging was performed on an inverted microscope with a home-built TIRF illumination system. TIRF illumination lasers were introduced into the optical path by way of a small, micrometer-positioned mirror-coated prism placed near the back focal plane of the objective. The microscope system consisted of an Olympus IX81 microscope body, Olympus 60× 1.45 NA PlanApoN TIRF objective, Photometrics DualView2 image splitter with Chroma T565lpxr dichroic mirror and Semrock 520/28 and 624/40 emission filters, Photometrics Evolve 512 EMCCD camera, 488-nm argon ion laser (Ion Laser Technology), 561-nm solid state laser (DPSS-type; Lasos), and Prior Proscan motorized stage. The system was controlled using Metamorph 7 software (Molecular Devices). Two color images were acquired simultaneously using the DualView from samples illuminated simultaneously with both lasers. HEK 293A cells were cultured and imaged on poly l-lysine coated coverslips. Images were acquired at one every 5 s.
Image Processing and Analysis.
Image processing was performed using ImageJ 1.49. Images were produced by averaging 10 consecutive image frames taken 1 every 5 s. mCherry-STIM1 raw images were convolving using a three-pixel-radius median filter, and the resulting image was subtracted from the original raw image to produce the background-subtracted image.
Ca2+ Imaging.
The [Ca2+]in measurement methods and equipment have been previously described (29). Briefly, HEK 293 cells were cotransfected with GFP-Orai1 and myc-STIM1, and after 48 h, cells were loaded with 6 µM Fura2-AM (Molecular Probes) and incubated for 45 min. Transfected cells were identified by GFP fluorescence. A Semrock BrightLine filter set was used for Fura-2 Ca2+ measurements. The Ringer solution containing 2 mM Ca2+ (“2 Ca”) and Ca2+-free Ringer solution (Ca2+ was replaced by Mg2+, and 1 mM EGTA was added, 0 Ca) were used. At the beginning of the experiment, cells were maintained in 2 Ca solution for 2 min, and basal [Ca2+]in was recorded. Ionomycin (Calbiochem) at a final concentration of 2 µM was diluted in 0 Ca solution and was used to deplete Ca2+ stores. Cells with basal [Ca2+]in greater than 150 nM were excluded from analysis. The data were analyzed using Origin software (OriginLabs) and presented as means ± SEM.
Supplementary Material
Acknowledgments
We thank Dr. Luette Forrest for assistance with cell culture. This work was supported by National Institutes of Health Grants NS14609 (to M.D.C.), R01 HL48093 (to C.F.-A.), and 2P01 AR052354 (P. D. Allen, principal investigator, Core D) (to C.F.-A.).
Footnotes
The authors declare no conflict of interest.
This article contains supporting information online at www.pnas.org/lookup/suppl/doi:10.1073/pnas.1515606112/-/DCSupplemental.
References
- 1.Flucher BE, Franzini-Armstrong C. Formation of junctions involved in excitation-contraction coupling in skeletal and cardiac muscle. Proc Natl Acad Sci USA. 1996;93(15):8101–8106. doi: 10.1073/pnas.93.15.8101. [DOI] [PMC free article] [PubMed] [Google Scholar]
- 2.Porter KR, Palade GE. Studies on the endoplasmic reticulum. III. Its form and distribution in striated muscle cells. J Biophys Biochem Cytol. 1957;3(2):269–300. doi: 10.1083/jcb.3.2.269. [DOI] [PMC free article] [PubMed] [Google Scholar]
- 3.Liou J, et al. STIM is a Ca2+ sensor essential for Ca2+-store-depletion-triggered Ca2+ influx. Curr Biol. 2005;15(13):1235–1241. doi: 10.1016/j.cub.2005.05.055. [DOI] [PMC free article] [PubMed] [Google Scholar]
- 4.Roos J, et al. STIM1, an essential and conserved component of store-operated Ca2+ channel function. J Cell Biol. 2005;169(3):435–445. doi: 10.1083/jcb.200502019. [DOI] [PMC free article] [PubMed] [Google Scholar]
- 5.Feske S, et al. A mutation in Orai1 causes immune deficiency by abrogating CRAC channel function. Nature. 2006;441(7090):179–185. doi: 10.1038/nature04702. [DOI] [PubMed] [Google Scholar]
- 6.Vig M, et al. CRACM1 is a plasma membrane protein essential for store-operated Ca2+ entry. Science. 2006;312(5777):1220–1223. doi: 10.1126/science.1127883. [DOI] [PMC free article] [PubMed] [Google Scholar]
- 7.Zhang SL, et al. Genome-wide RNAi screen of Ca(2+) influx identifies genes that regulate Ca(2+) release-activated Ca(2+) channel activity. Proc Natl Acad Sci USA. 2006;103(24):9357–9362. doi: 10.1073/pnas.0603161103. [DOI] [PMC free article] [PubMed] [Google Scholar]
- 8.Mercer JC, et al. Large store-operated calcium selective currents due to co-expression of Orai1 or Orai2 with the intracellular calcium sensor, Stim1. J Biol Chem. 2006;281(34):24979–24990. doi: 10.1074/jbc.M604589200. [DOI] [PMC free article] [PubMed] [Google Scholar]
- 9.Peinelt C, et al. Amplification of CRAC current by STIM1 and CRACM1 (Orai1) Nat Cell Biol. 2006;8(7):771–773. doi: 10.1038/ncb1435. [DOI] [PMC free article] [PubMed] [Google Scholar]
- 10.Soboloff J, et al. Orai1 and STIM reconstitute store-operated calcium channel function. J Biol Chem. 2006;281(30):20661–20665. doi: 10.1074/jbc.C600126200. [DOI] [PubMed] [Google Scholar]
- 11.Feske S, Picard C, Fischer A. Immunodeficiency due to mutations in ORAI1 and STIM1. Clin Immunol. 2010;135(2):169–182. doi: 10.1016/j.clim.2010.01.011. [DOI] [PMC free article] [PubMed] [Google Scholar]
- 12.Zhang SL, et al. STIM1 is a Ca2+ sensor that activates CRAC channels and migrates from the Ca2+ store to the plasma membrane. Nature. 2005;437(7060):902–905. doi: 10.1038/nature04147. [DOI] [PMC free article] [PubMed] [Google Scholar]
- 13.Wu MM, Buchanan J, Luik RM, Lewis RS. Ca2+ store depletion causes STIM1 to accumulate in ER regions closely associated with the plasma membrane. J Cell Biol. 2006;174(6):803–813. doi: 10.1083/jcb.200604014. [DOI] [PMC free article] [PubMed] [Google Scholar]
- 14.Cahalan MD. STIMulating store-operated Ca(2+) entry. Nat Cell Biol. 2009;11(6):669–677. doi: 10.1038/ncb0609-669. [DOI] [PMC free article] [PubMed] [Google Scholar]
- 15.Lewis RS. Store-operated calcium channels: New perspectives on mechanism and function. Cold Spring Harb Perspect Biol. 2011;3(12):a003970. doi: 10.1101/cshperspect.a003970. [DOI] [PMC free article] [PubMed] [Google Scholar]
- 16.Wu MM, Covington ED, Lewis RS. Single-molecule analysis of diffusion and trapping of STIM1 and Orai1 at endoplasmic reticulum-plasma membrane junctions. Mol Biol Cell. 2014;25(22):3672–3685. doi: 10.1091/mbc.E14-06-1107. [DOI] [PMC free article] [PubMed] [Google Scholar]
- 17.Amcheslavsky A, et al. Molecular biophysics of Orai store-operated Ca2+ channels. Biophys J. 2015;108(2):237–246. doi: 10.1016/j.bpj.2014.11.3473. [DOI] [PMC free article] [PubMed] [Google Scholar]
- 18.Shim AH, Tirado-Lee L, Prakriya M. Structural and functional mechanisms of CRAC channel regulation. J Mol Biol. 2015;427(1):77–93. doi: 10.1016/j.jmb.2014.09.021. [DOI] [PMC free article] [PubMed] [Google Scholar]
- 19.Lur G, et al. Ribosome-free terminals of rough ER allow formation of STIM1 puncta and segregation of STIM1 from IP(3) receptors. Curr Biol. 2009;19(19):1648–1653. doi: 10.1016/j.cub.2009.07.072. [DOI] [PMC free article] [PubMed] [Google Scholar]
- 20.Orci L, et al. From the Cover: STIM1-induced precortical and cortical subdomains of the endoplasmic reticulum. Proc Natl Acad Sci USA. 2009;106(46):19358–19362. doi: 10.1073/pnas.0911280106. [DOI] [PMC free article] [PubMed] [Google Scholar]
- 21.Sharma VK, Ramesh V, Franzini-Armstrong C, Sheu SS. Transport of Ca2+ from sarcoplasmic reticulum to mitochondria in rat ventricular myocytes. J Bioenerg Biomembr. 2000;32(1):97–104. doi: 10.1023/a:1005520714221. [DOI] [PubMed] [Google Scholar]
- 22.Gilkey JC, Staehelin LA. Advances in ultrarapid freezing for the preservation of cellular ultrastructure. J Electron Microsc Tech. 1986;3(2):177–210. [Google Scholar]
- 23.Grigoriev I, et al. STIM1 is a MT-plus-end-tracking protein involved in remodeling of the ER. Curr Biol. 2008;18(3):177–182. doi: 10.1016/j.cub.2007.12.050. [DOI] [PMC free article] [PubMed] [Google Scholar]
- 24.Li Z, et al. Graded activation of CRAC channel by binding of different numbers of STIM1 to Orai1 subunits. Cell Res. 2011;21(2):305–315. doi: 10.1038/cr.2010.131. [DOI] [PMC free article] [PubMed] [Google Scholar]
- 25.Sun XH, et al. Molecular architecture of membranes involved in excitation-contraction coupling of cardiac muscle. J Cell Biol. 1995;129(3):659–671. doi: 10.1083/jcb.129.3.659. [DOI] [PMC free article] [PubMed] [Google Scholar]
- 26.Block BA, Imagawa T, Campbell KP, Franzini-Armstrong C. Structural evidence for direct interaction between the molecular components of the transverse tubule/sarcoplasmic reticulum junction in skeletal muscle. J Cell Biol. 1988;107(6 Pt 2):2587–2600. doi: 10.1083/jcb.107.6.2587. [DOI] [PMC free article] [PubMed] [Google Scholar]
- 27.Migneault I, Dartiguenave C, Bertrand MJ, Waldron KC. Glutaraldehyde: Behavior in aqueous solution, reaction with proteins, and application to enzyme crosslinking. Biotechniques. 2004;37(5):790–796, 798–802. doi: 10.2144/04375RV01. [DOI] [PubMed] [Google Scholar]
- 28.Olde Damink LH, et al. Cross-linking of dermal sheep collagen using a water-soluble carbodiimide. Biomaterials. 1996;17(8):765–773. doi: 10.1016/0142-9612(96)81413-x. [DOI] [PubMed] [Google Scholar]
- 29.Demuro A, et al. Subunit stoichiometry of human Orai1 and Orai3 channels in closed and open states. Proc Natl Acad Sci USA. 2011;108(43):17832–17837. doi: 10.1073/pnas.1114814108. [DOI] [PMC free article] [PubMed] [Google Scholar]
- 30.Soboloff J, Rothberg BS, Madesh M, Gill DL. STIM proteins: Dynamic calcium signal transducers. Nat Rev Mol Cell Biol. 2012;13(9):549–565. doi: 10.1038/nrm3414. [DOI] [PMC free article] [PubMed] [Google Scholar]
- 31.Balla T. Phosphoinositides: Tiny lipids with giant impact on cell regulation. Physiol Rev. 2013;93(3):1019–1137. doi: 10.1152/physrev.00028.2012. [DOI] [PMC free article] [PubMed] [Google Scholar]
- 32.Prinz WA. Bridging the gap: Membrane contact sites in signaling, metabolism, and organelle dynamics. J Cell Biol. 2014;205(6):759–769. doi: 10.1083/jcb.201401126. [DOI] [PMC free article] [PubMed] [Google Scholar]
- 33.Yang X, Jin H, Cai X, Li S, Shen Y. Structural and mechanistic insights into the activation of Stromal interaction molecule 1 (STIM1) Proc Natl Acad Sci USA. 2012;109(15):5657–5662. doi: 10.1073/pnas.1118947109. [DOI] [PMC free article] [PubMed] [Google Scholar]
- 34.Stathopulos PB, et al. STIM1/Orai1 coiled-coil interplay in the regulation of store-operated calcium entry. Nat Commun. 2013;4:2963. doi: 10.1038/ncomms3963. [DOI] [PMC free article] [PubMed] [Google Scholar]
- 35.Chang CL, et al. Feedback regulation of receptor-induced Ca2+ signaling mediated by E-Syt1 and Nir2 at endoplasmic reticulum-plasma membrane junctions. Cell Reports. 2013;5(3):813–825. doi: 10.1016/j.celrep.2013.09.038. [DOI] [PubMed] [Google Scholar]
- 36.Hou X, Pedi L, Diver MM, Long SB. Crystal structure of the calcium release-activated calcium channel Orai. Science. 2012;338(6112):1308–1313. doi: 10.1126/science.1228757. [DOI] [PMC free article] [PubMed] [Google Scholar]
- 37.Penna A, et al. The CRAC channel consists of a tetramer formed by Stim-induced dimerization of Orai dimers. Nature. 2008;456(7218):116–120. doi: 10.1038/nature07338. [DOI] [PMC free article] [PubMed] [Google Scholar]
- 38.Fukushima M, Tomita T, Janoshazi A, Putney JW. Alternative translation initiation gives rise to two isoforms of Orai1 with distinct plasma membrane mobilities. J Cell Sci. 2012;125(Pt 18):4354–4361. doi: 10.1242/jcs.104919. [DOI] [PMC free article] [PubMed] [Google Scholar]
- 39.Srikanth S, et al. A novel EF-hand protein, CRACR2A, is a cytosolic Ca2+ sensor that stabilizes CRAC channels in T cells. Nat Cell Biol. 2010;12(5):436–446. doi: 10.1038/ncb2045. [DOI] [PMC free article] [PubMed] [Google Scholar]
- 40.Sharma S, et al. An siRNA screen for NFAT activation identifies septins as coordinators of store-operated Ca2+ entry. Nature. 2013;499(7457):238–242. doi: 10.1038/nature12229. [DOI] [PMC free article] [PubMed] [Google Scholar]
- 41.Jha A, et al. The STIM1 CTID domain determines access of SARAF to SOAR to regulate Orai1 channel function. J Cell Biol. 2013;202(1):71–79. doi: 10.1083/jcb.201301148. [DOI] [PMC free article] [PubMed] [Google Scholar]
- 42.Takeshima H, Komazaki S, Nishi M, Iino M, Kangawa K. Junctophilins: A novel family of junctional membrane complex proteins. Mol Cell. 2000;6(1):11–22. doi: 10.1016/s1097-2765(00)00003-4. [DOI] [PubMed] [Google Scholar]
- 43.Hirata Y, et al. Uncoupling store-operated Ca2+ entry and altered Ca2+ release from sarcoplasmic reticulum through silencing of junctophilin genes. Biophys J. 2006;90(12):4418–4427. doi: 10.1529/biophysj.105.076570. [DOI] [PMC free article] [PubMed] [Google Scholar]
- 44.Giordano F, et al. PI(4,5)P(2)-dependent and Ca(2+)-regulated ER-PM interactions mediated by the extended synaptotagmins. Cell. 2013;153(7):1494–1509. doi: 10.1016/j.cell.2013.05.026. [DOI] [PMC free article] [PubMed] [Google Scholar]
- 45.Treves S, et al. Agonist-activated Ca2+ influx occurs at stable plasma membrane and endoplasmic reticulum junctions. J Cell Sci. 2010;123(Pt 23):4170–4181. doi: 10.1242/jcs.068387. [DOI] [PMC free article] [PubMed] [Google Scholar]
- 46.Zhang SL, et al. Mutations in Orai1 transmembrane segment 1 cause STIM1-independent activation of Orai1 channels at glycine 98 and channel closure at arginine 91. Proc Natl Acad Sci USA. 2011;108(43):17838–17843. doi: 10.1073/pnas.1114821108. [DOI] [PMC free article] [PubMed] [Google Scholar]
Associated Data
This section collects any data citations, data availability statements, or supplementary materials included in this article.